assessed%lab%2:%image%analysis% due:5pm...
TRANSCRIPT
Assessed Lab 2: Image analysis Due: 5pm Monday, 6 May 2013 In many fields there is a need to automate the often tedious task of extracting information from images. For example, counting cells on a microscope image, identifying geological features in geomagnetic data images. Here we will write a small program to count the number of stars in a light telescope image. However, before we get going we will do some practice tasks in manipulating and interrogating large matrices, as image files are really just data stored in large matrices. Task 1: Matrix interrogation Write a single function that takes in a square integer matrix A and the scalars N and G, as well as a 2-‐value vector R indicating the inclusive range [R(1), R(2)] as inputs. The function should return as an output:
A1: the value of the largest element in the matrix (1 mark) A2: the average of the elements in the Nth column (2 mark) A3: the value of the most frequently occurring number (2 marks) A4: the number of elements within a specified range R, inclusive of the
edge values (3 marks) A5: a Mx2 matrix, with each row containing two elements to represent the
indicial position (i.e. row number, column number) of each appearance of the number G. (4 marks) function [A1,A2,A3,A4,A5] = LAB2_Task1(A, N, G, R) Upload function file LAB2_Task1.m to cssubmit. Note, in this task you will need to create your own square integer matrix to test your code. The function randi may be useful for this. For example, randi([5,30],5) will give a 5x5 matrix of uniformly distributed random integers between 5 and 30 (see below) >>A=randi([5,30],5) A = 27 18 16 26 22 16 13 19 10 17 19 21 30 7 18 19 22 20 29 22 6 21 22 9 8
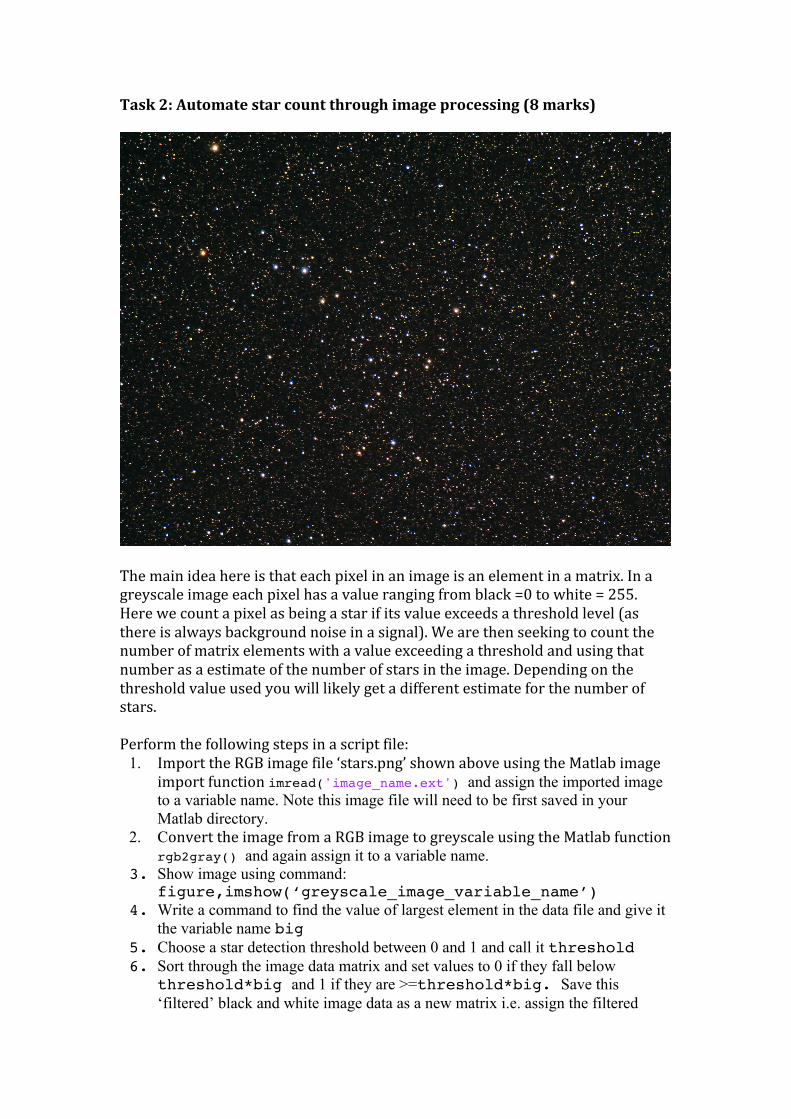
Task 2: Automate star count through image processing (8 marks)
The main idea here is that each pixel in an image is an element in a matrix. In a greyscale image each pixel has a value ranging from black =0 to white = 255. Here we count a pixel as being a star if its value exceeds a threshold level (as there is always background noise in a signal). We are then seeking to count the number of matrix elements with a value exceeding a threshold and using that number as a estimate of the number of stars in the image. Depending on the threshold value used you will likely get a different estimate for the number of stars. Perform the following steps in a script file:
1. Import the RGB image file ‘stars.png’ shown above using the Matlab image import function imread('image_name.ext') and assign the imported image to a variable name. Note this image file will need to be first saved in your Matlab directory.
2. Convert the image from a RGB image to greyscale using the Matlab function rgb2gray() and again assign it to a variable name.
3. Show image using command: figure,imshow(‘greyscale_image_variable_name’)
4. Write a command to find the value of largest element in the data file and give it the variable name big
5. Choose a star detection threshold between 0 and 1 and call it threshold 6. Sort through the image data matrix and set values to 0 if they fall below
threshold*big and 1 if they are >=threshold*big. Save this ‘filtered’ black and white image data as a new matrix i.e. assign the filtered
image data to a new variable. 7. Use the imshow command again (as in step 3) to show the filtered image.
figure(2),imshow(‘filtered_image_variable_name’)
The human eye + brain is a very good image processor. Comparing the images in step 7 and step 3 try to estimate the value of threshold in which the filtered image best represents the original image in terms of detecting the right number of stars? For example, when threshold =1 the filtered image is black (no pixels are counted as stars), when threshold =0, the image is white (all pixels treated as stars), so your estimate should be between 0 and 1.
8. Copy and paste the Matlab commands relating to steps 5 and 6 to below the command in your script file used for step 7 (above).
9. Enclose these pasted commands within a for loop, and make the necessary changes so that you can then try (sweep) values of threshold from 0 to 1 in increments of 0.01, which we refer to as the threshold step.
10. For each value of threshold sum the number of data points (pixels) exceeding the detection threshold. This corresponds to a star count.
11. Plot threshold versus star count using Plot(x,y) Does the number of stars counted surprise you? 12. Write a function file called Star_detection.m to carry out the task
described in steps 8 to 10 (do not include the plot in step 11 in the function file). Your function file needs to be written so that it can take an image filename and a scalar value for the threshold step as input, convert it into greyscale image and returns a Mx2 matrix as an output, with each row of the output corresponding to a [threshold, star count] pair.
The first line of your function file should be function [Count] = Star_detection(filename, step) As a check, you should be able to call this function file in Matlab (i.e. from a command line or script file) to get the same output as step 11 e.g. > count = Star_detection(‘stars.png’, 0.01) > plot(count(:,1), count(:,2))
Upload function file Star_detection.m to cssubmit.