asphalt in figures - eapa - european asphalt ... in figures/asphalt in...asphalt in figures 2012 2...
TRANSCRIPT
ASPHALT IN FIGURES 2012
2
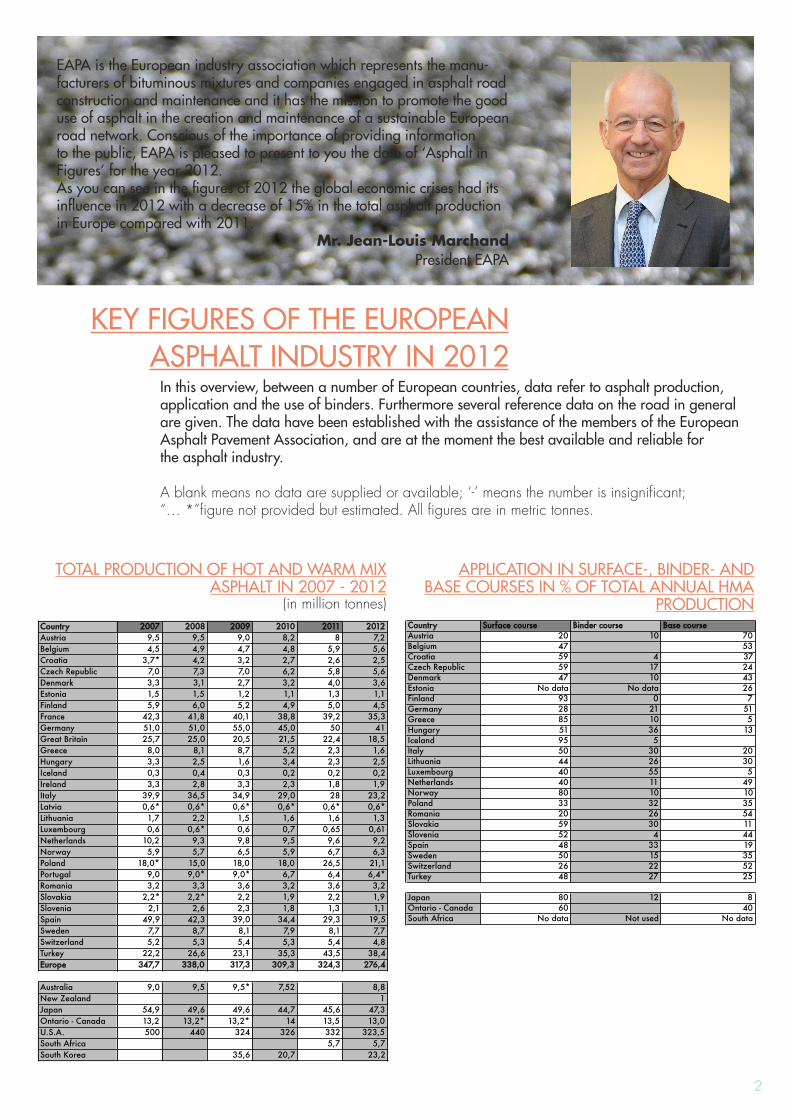
KEy FIGURES oF THE EURoPEANASPHALT INdUSTRy IN 2012
In this overview, between a number of European countries, data refer to asphalt production, application and the use of binders. Furthermore several reference data on the road in general are given. The data have been established with the assistance of the members of the EuropeanAsphalt Pavement Association, and are at the moment the best available and reliable forthe asphalt industry.
A blank means no data are supplied or available; ‘-’ means the number is insignificant; “… *”figure not provided but estimated. All figures are in metric tonnes.
ToTAL PRodUcTIoN oF HoT ANd WARm mIx ASPHALT IN 2007 - 2012
(in million tonnes)
APPLIcATIoN IN SURFAcE-, bINdER- ANd bASE coURSES IN % oF ToTAL ANNUAL HmA
PRodUcTIoN
EAPA is the European industry association which represents the manu-facturers of bituminous mixtures and companies engaged in asphalt road construction and maintenance and it has the mission to promote the good use of asphalt in the creation and maintenance of a sustainable European road network. conscious of the importance of providing information to the public, EAPA is pleased to present to you the data of ‘Asphalt in Figures’ for the year 2012. As you can see in the figures of 2012 the global economic crises had its influence in 2012 with a decrease of 15% in the total asphalt production in Europe compared with 2011.
Mr. Jean-Louis MarchandPresident EAPA
CountryAustriaBelgiumCroatiaCzech RepublicDenmarkEstoniaFinlandFranceGermanyGreat Britain GreeceHungaryIcelandIrelandItalyLatviaLithuaniaLuxembourgNetherlandsNorwayPolandPortugalRomaniaSlovakiaSloveniaSpainSwedenSwitzerlandTurkeyEurope
AustraliaNew ZealandJapanOntario - CanadaU.S.A.South AfricaSouth Korea
2007 2008 2009 2010 2011 20129,5 9,5 9,0 8,2 8 7,24,5 4,9 4,7 4,8 5,9 5,6
3,7* 4,2 3,2 2,7 2,6 2,57,0 7,3 7,0 6,2 5,8 5,63,3 3,1 2,7 3,2 4,0 3,61,5 1,5 1,2 1,1 1,3 1,15,9 6,0 5,2 4,9 5,0 4,5
42,3 41,8 40,1 38,8 39,2 35,351,0 51,0 55,0 45,0 50 4125,7 25,0 20,5 21,5 22,4 18,58,0 8,1 8,7 5,2 2,3 1,63,3 2,5 1,6 3,4 2,3 2,50,3 0,4 0,3 0,2 0,2 0,23,3 2,8 3,3 2,3 1,8 1,9
39,9 36,5 34,9 29,0 28 23,20,6* 0,6* 0,6* 0,6* 0,6* 0,6*1,7 2,2 1,5 1,6 1,6 1,30,6 0,6* 0,6 0,7 0,65 0,61
10,2 9,3 9,8 9,5 9,6 9,25,9 5,7 6,5 5,9 6,7 6,3
18,0* 15,0 18,0 18,0 26,5 21,19,0 9,0* 9,0* 6,7 6,4 6,4*3,2 3,3 3,6 3,2 3,6 3,2
2,2* 2,2* 2,2 1,9 2,2 1,92,1 2,6 2,3 1,8 1,3 1,1
49,9 42,3 39,0 34,4 29,3 19,57,7 8,7 8,1 7,9 8,1 7,75,2 5,3 5,4 5,3 5,4 4,8
22,2 26,6 23,1 35,3 43,5 38,4347,7 338,0 317,3 309,3 324,3 276,4
9,0 9,5 9,5* 7,52 8,81
54,9 49,6 49,6 44,7 45,6 47,313,2 13,2* 13,2* 14 13,5 13,0500 440 324 326 332 323,5
5,7 5,735,6 20,7 23,2
Country Surface course Binder course Base courseAustria 20 10 70Belgium 47 53Croatia 59 4 37Czech Republic 59 17 24Denmark 47 10 43Estonia No data No data 26Finland 93 0 7Germany 28 21 51Greece 85 10 5Hungary 51 36 13Iceland 95 5Italy 50 30 20Lithuania 44 26 30Luxembourg 40 55 5Netherlands 40 11 49Norway 80 10 10Poland 33 32 35Romania 20 26 54Slovakia 59 30 11Slovenia 52 4 44Spain 48 33 19Sweden 50 15 35Switzerland 26 22 52Turkey 48 27 25
Japan 80 12 8Ontario - Canada 60 40South Africa No data Not used No data
3
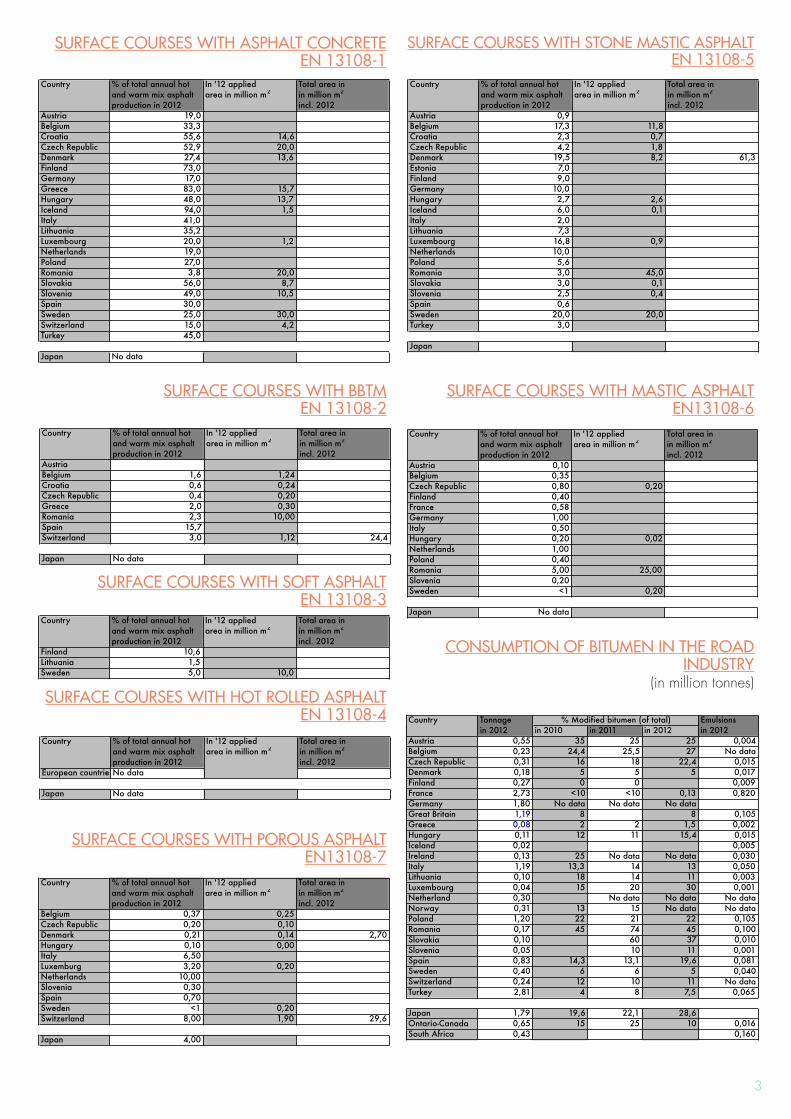
SURFAcE coURSES WITH ASPHALT coNcRETEEN 13108-1
SURFAcE coURSES WITH PoRoUS ASPHALT EN13108-7
SURFAcE coURSES WITH mASTIc ASPHALT EN13108-6
SURFAcE coURSES WITH SToNE mASTIc ASPHALTEN 13108-5
SURFAcE coURSES WITH bbTmEN 13108-2
SURFAcE coURSES WITH SoFT ASPHALTEN 13108-3
SURFAcE coURSES WITH HoT RoLLEd ASPHALTEN 13108-4
coNSUmPTIoN oF bITUmEN IN THE RoAd INdUSTRy
(in million tonnes)
Country % of total annual hot In '12 applied Total area in and warm mix asphalt area in million m2 in million m2
production in 2012 incl. 2012Finland 10,6Lithuania 1,5Sweden 5,0 10,0
Country % of total annual hot In '12 applied Total area in and warm mix asphalt area in million m2 in million m2
production in 2012 incl. 2012European countriesNo data
Japan No data
Country % of total annual hot In '12 applied Total area in and warm mix asphalt area in million m2 in million m2
production in 2012 incl. 2012AustriaBelgium 1,6 1,24Croatia 0,6 0,24Czech Republic 0,4 0,20Greece 2,0 0,30Romania 2,3 10,00Spain 15,7Switzerland 3,0 1,12 24,4
Japan No data
Country % of total annual hot In '12 applied Total area in and warm mix asphalt area in million m2 in million m2
production in 2012 incl. 2012Belgium 0,37 0,25Czech Republic 0,20 0,10Denmark 0,21 0,14 2,70Hungary 0,10 0,00Italy 6,50Luxemburg 3,20 0,20Netherlands 10,00Slovenia 0,30Spain 0,70Sweden <1 0,20Switzerland 8,00 1,90 29,6
Japan 4,00
Country % of total annual hot In '12 applied Total area in and warm mix asphalt area in million m2 in million m2
production in 2012 incl. 2012Austria 19,0Belgium 33,3Croatia 55,6 14,6Czech Republic 52,9 20,0Denmark 27,4 13,6Finland 73,0Germany 17,0Greece 83,0 15,7Hungary 48,0 13,7Iceland 94,0 1,5Italy 41,0Lithuania 35,2Luxembourg 20,0 1,2Netherlands 19,0Poland 27,0Romania 3,8 20,0Slovakia 56,0 8,7Slovenia 49,0 10,5Spain 30,0Sweden 25,0 30,0Switzerland 15,0 4,2Turkey 45,0
Japan No data
Country % of total annual hot In '12 applied Total area in and warm mix asphalt area in million m2 in million m2
production in 2012 incl. 2012Austria 0,10Belgium 0,35Czech Republic 0,80 0,20Finland 0,40France 0,58Germany 1,00Italy 0,50Hungary 0,20 0,02Netherlands 1,00Poland 0,40Romania 5,00 25,00Slovenia 0,20Sweden <1 0,20
Japan No data
Country Tonnage Emulsionsin 2012 in 2010 in 2011 in 2012 in 2012
Austria 0,55 35 25 25 0,004Belgium 0,23 24,4 25,5 27 No dataCzech Republic 0,31 16 18 22,4 0,015Denmark 0,18 5 5 5 0,017Finland 0,27 0 0 0,009France 2,73 <10 <10 0,13 0,820Germany 1,80 No data No data No dataGreat Britain 1,19 8 8 0,105Greece 0,08 2 2 1,5 0,002Hungary 0,11 12 11 15,4 0,015Iceland 0,02 0,005Ireland 0,13 25 No data No data 0,030Italy 1,19 13,3 14 13 0,050Lithuania 0,10 18 14 11 0,003Luxembourg 0,04 15 20 30 0,001Netherland 0,30 No data No data No dataNorway 0,31 13 15 No data No dataPoland 1,20 22 21 22 0,105Romania 0,17 45 74 45 0,100Slovakia 0,10 60 37 0,010Slovenia 0,05 10 11 0,001Spain 0,83 14,3 13,1 19,6 0,081Sweden 0,40 6 6 5 0,040Switzerland 0,24 12 10 11 No dataTurkey 2,81 4 8 7,5 0,065
Japan 1,79 19,6 22,1 28,6Ontario-Canada 0,65 15 25 10 0,016South Africa 0,43 0,160
% Modified bitumen (of total)
Country % of total annual hot In '12 applied Total area in and warm mix asphalt area in million m2 in million m2
production in 2012 incl. 2012Austria 0,9Belgium 17,3 11,8Croatia 2,3 0,7Czech Republic 4,2 1,8Denmark 19,5 8,2 61,3Estonia 7,0Finland 9,0Germany 10,0Hungary 2,7 2,6Iceland 6,0 0,1Italy 2,0Lithuania 7,3Luxembourg 16,8 0,9Netherlands 10,0Poland 5,6Romania 3,0 45,0Slovakia 3,0 0,1Slovenia 2,5 0,4Spain 0,6Sweden 20,0 20,0Turkey 3,0
Japan
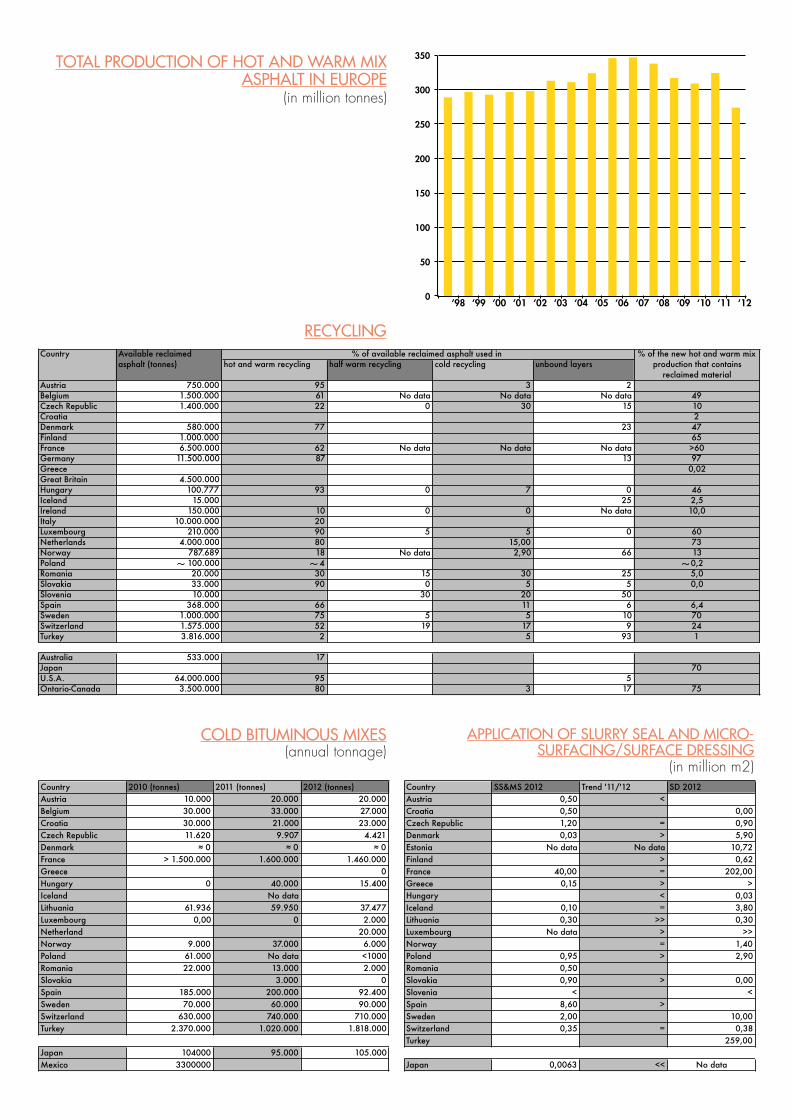
Country Available reclaimed % of the new hot and warm mixasphalt (tonnes) hot and warm recycling half warm recycling cold recycling unbound layers production that contains
reclaimed materialAustria 750.000 95 3 2Belgium 1.500.000 61 No data No data No data 49Czech Republic 1.400.000 22 0 30 15 10Croatia 2Denmark 580.000 77 23 47Finland 1.000.000 65France 6.500.000 62 No data No data No data >60Germany 11.500.000 87 13 97Greece 0,02Great Britain 4.500.000Hungary 100.777 93 0 7 0 46Iceland 15.000 25 2,5Ireland 150.000 10 0 0 No data 10,0Italy 10.000.000 20Luxembourg 210.000 90 5 5 0 60Netherlands 4.000.000 80 15,00 73Norway 787.689 18 No data 2,90 66 13Poland 100.000 4 0,2Romania 20.000 30 15 30 25 5,0Slovakia 33.000 90 0 5 5 0,0Slovenia 10.000 30 20 50Spain 368.000 66 11 6 6,4Sweden 1.000.000 75 5 5 10 70Switzerland 1.575.000 52 19 17 9 24Turkey 3.816.000 2 5 93 1
Australia 533.000 17Japan 70U.S.A. 64.000.000 95 5Ontario-Canada 3.500.000 80 3 17 75
% of available reclaimed asphalt used in
APPLIcATIoN oF SLURRy SEAL ANd mIcRo-SURFAcING/SURFAcE dRESSING
(in million m2)
coLd bITUmINoUS mIxES (annual tonnage)
REcycLING
0
50
100
150
200
250
300
350
‘00 ‘03 ‘06 ‘09‘98 ‘01 ‘04 ‘07 ‘10‘99 ‘02 ‘05 ‘08 ‘12‘11
ToTAL PRodUcTIoN oF HoT ANd WARm mIx ASPHALT IN EURoPE
(in million tonnes)
~ ~ ~
Country 2010 (tonnes) 2011 (tonnes) 2012 (tonnes)Austria 10.000 20.000 20.000Belgium 30.000 33.000 27.000Croatia 30.000 21.000 23.000Czech Republic 11.620 9.907 4.421Denmark ≈ 0 ≈ 0 ≈ 0France > 1.500.000 1.600.000 1.460.000Greece 0Hungary 0 40.000 15.400Iceland No dataLithuania 61.936 59.950 37.477Luxembourg 0,00 0 2.000Netherland 20.000Norway 9.000 37.000 6.000Poland 61.000 No data <1000Romania 22.000 13.000 2.000Slovakia 3.000 0Spain 185.000 200.000 92.400Sweden 70.000 60.000 90.000Switzerland 630.000 740.000 710.000Turkey 2.370.000 1.020.000 1.818.000
Japan 104000 95.000 105.000Mexico 3300000
Country SS&MS 2012 Trend '11/'12 SD 2012Austria 0,50 <Croatia 0,50 0,00Czech Republic 1,20 = 0,90Denmark 0,03 > 5,90Estonia No data No data 10,72Finland > 0,62France 40,00 = 202,00Greece 0,15 > >Hungary < 0,03Iceland 0,10 = 3,80Lithuania 0,30 >> 0,30Luxembourg No data > >>Norway = 1,40Poland 0,95 > 2,90Romania 0,50Slovakia 0,90 > 0,00Slovenia < <Spain 8,60 >Sweden 2,00 10,00Switzerland 0,35 = 0,38Turkey 259,00
Japan 0,0063 << No data
5
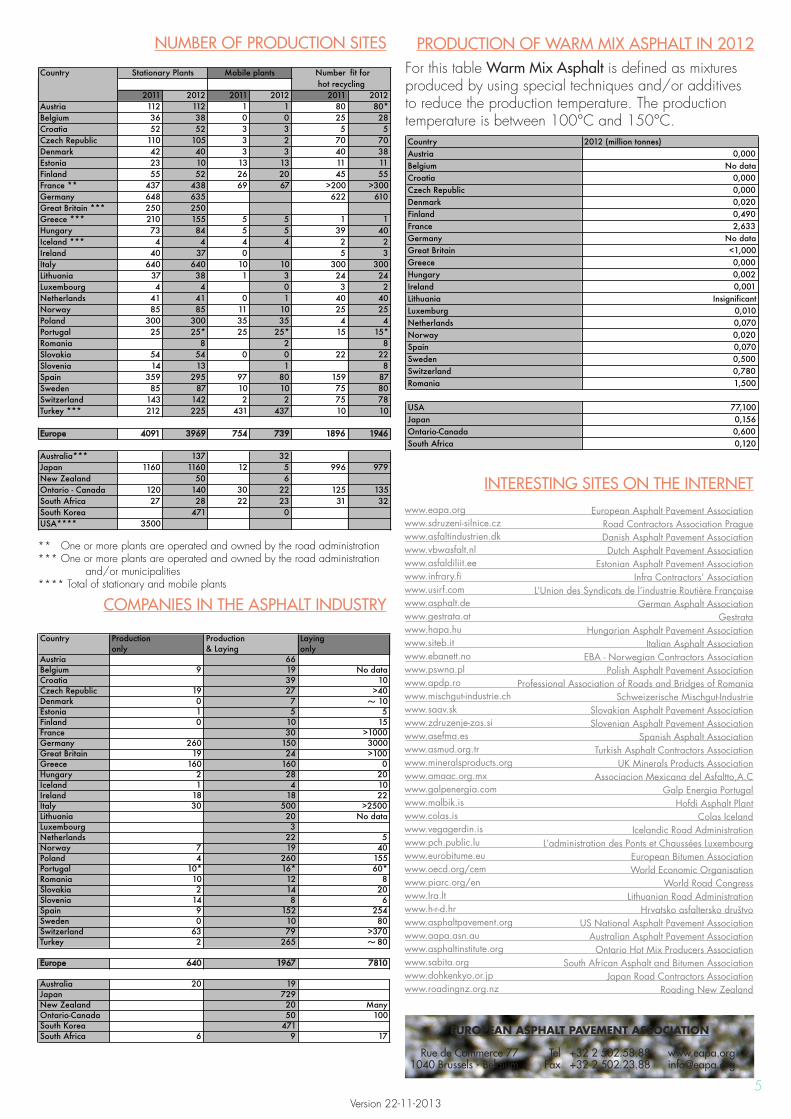
Country Production Production Layingonly & Laying only
Austria 66Belgium 9 19 No dataCroatia 39 10Czech Republic 19 27 >40Denmark 0 7 10Estonia 1 5 5Finland 0 10 15France 30 >1000Germany 260 150 3000Great Britain 19 24 >100Greece 160 160 0Hungary 2 28 20Iceland 1 4 10Ireland 18 18 22Italy 30 500 >2500Lithuania 20 No dataLuxembourg 3Netherlands 22 5Norway 7 19 40Poland 4 260 155Portugal 10* 16* 60*Romania 10 12 8Slovakia 2 14 20Slovenia 14 8 6Spain 9 152 254Sweden 0 10 80Switzerland 63 79 >370Turkey 2 265 80
Europe 640 1967 7810
Australia 20 19Japan 729New Zealand 20 ManyOntario-Canada 50 100South Korea 471South Africa 6 9 17
European Asphalt Pavement Association Road Contractors Association Prague Danish Asphalt Pavement Association Dutch Asphalt Pavement Association Estonian Asphalt Pavement Association Infra Contractors’ Association L’Union des Syndicats de l’industrie Routière Française German Asphalt Association Gestrata Hungarian Asphalt Pavement Association Italian Asphalt Association EBA - Norwegian Contractors Association Polish Asphalt Pavement Association Professional Association of Roads and Bridges of Romania Schweizerische Mischgut-Industrie Slovakian Asphalt Pavement Association Slovenian Asphalt Pavement Association Spanish Asphalt Association Turkish Asphalt Contractors Association UK Minerals Products Association Associacion Mexicana del Asfaltto,A.C Galp Energia Portugal Hofdi Asphalt Plant Colas Iceland Icelandic Road Administration L’administration des Ponts et Chaussées Luxembourg European Bitumen Association World Economic Organisation World Road Congress Lithuanian Road Administration Hrvatsko asfaltersko društvo US National Asphalt Pavement Association Australian Asphalt Pavement Association Ontario Hot Mix Producers Association South African Asphalt and Bitumen Association Japan Road Contractors Association Roading New Zealand
Version 22-11-2013
NUmbER oF PRodUcTIoN SITES
** One or more plants are operated and owned by the road administration*** One or more plants are operated and owned by the road administration and/or municipalities**** Total of stationary and mobile plants
For this table Warm mix Asphalt is defined as mixtures produced by using special techniques and/or additives to reduce the production temperature. The production temperature is between 100°C and 150°C.
PRodUcTIoN oF WARm mIx ASPHALT IN 2012
comPANIES IN THE ASPHALT INdUSTRy
INTERESTING SITES oN THE INTERNETwww.eapa.orgwww.sdruzeni-silnice.czwww.asfaltindustrien.dkwww.vbwasfalt.nlwww.asfaldiliit.eewww.infrary.fiwww.usirf.comwww.asphalt.dewww.gestrata.atwww.hapa.huwww.siteb.itwww.ebanett.nowww.pswna.plwww.apdp.rowww.mischgut-industrie.chwww.saav.skwww.zdruzenje-zas.siwww.asefma.eswww.asmud.org.trwww.mineralsproducts.orgwww.amaac.org.mxwww.galpenergia.comwww.malbik.iswww.colas.iswww.vegagerdin.is www.pch.public.luwww.eurobitume.euwww.oecd.org/cemwww.piarc.org/enwww.Ira.ltwww.h-r-d.hrwww.asphaltpavement.orgwww.aapa.asn.auwww.asphaltinstitute.orgwww.sabita.orgwww.dohkenkyo.or.jpwww.roadingnz.org.nz
Rue de commerce 771040 brussels - belgium
EUROPEAN ASPHALT PAVEMENT ASSOCIATION
Tel +32 2 502.58.88Fax +32 2 502.23.88
~
~
~
Country Number fit for
2011 2012 2011 2012 2011 2012Austria 112 112 1 1 80 80*Belgium 36 38 0 0 25 28Croatia 52 52 3 3 5 5Czech Republic 110 105 3 2 70 70Denmark 42 40 3 3 40 38Estonia 23 10 13 13 11 11Finland 55 52 26 20 45 55France ** 437 438 69 67 >200 >300Germany 648 635 622 610Great Britain *** 250 250Greece *** 210 155 5 5 1 1Hungary 73 84 5 5 39 40Iceland *** 4 4 4 4 2 2Ireland 40 37 0 5 3Italy 640 640 10 10 300 300Lithuania 37 38 1 3 24 24Luxembourg 4 4 0 3 2Netherlands 41 41 0 1 40 40Norway 85 85 11 10 25 25Poland 300 300 35 35 4 4Portugal 25 25* 25 25* 15 15*Romania 8 2 8Slovakia 54 54 0 0 22 22Slovenia 14 13 1 8Spain 359 295 97 80 159 87Sweden 85 87 10 10 75 80Switzerland 143 142 2 2 75 78Turkey *** 212 225 431 437 10 10
Europe 4091 3969 754 739 1896 1946
Australia*** 137 32Japan 1160 1160 12 5 996 979New Zealand 50 6Ontario - Canada 120 140 30 22 125 135South Africa 27 28 22 23 31 32South Korea 471 0USA**** 3500
Stationary Plantshot recycling
Mobile plants
Country 2012 (million tonnes)Austria 0,000Belgium No dataCroatia 0,000Czech Republic 0,000Denmark 0,020Finland 0,490France 2,633Germany No dataGreat Britain <1,000Greece 0,000Hungary 0,002Ireland 0,001Lithuania InsignificantLuxemburg 0,010Netherlands 0,070Norway 0,020Spain 0,070Sweden 0,500Switzerland 0,780Romania 1,500
USA 77,100Japan 0,156Ontario-Canada 0,600South Africa 0,120