asmi annual meeting of shareholders - … annual meeting of shareholders may 16 2013 confidential...
TRANSCRIPT

Confidential and Proprietary Information ASMI Annual Meeting of Shareholders May 16 2013 Confidential and Proprietary Information Confidential and Proprietary Information
May 16 2013
ASMI ANNUAL MEETING OF SHAREHOLDERS Chuck del Prado, President & CEO

Confidential and Proprietary Information ASMI Annual Meeting of Shareholders May 16 2013
SAFE HARBOR STATEMENTS
Safe Harbor Statement under the U.S. Private Securities Litigation Reform Act of 1995: All
matters discussed in this business and strategy update, except for any historical data, are
forward-looking statements. Forward-looking statements involve risks and uncertainties that
could cause actual results to differ materially from those in the forward-looking statements.
These include, but are not limited to, economic conditions and trends in the semiconductor
industry generally and the timing of the industry cycles specifically, currency fluctuations,
corporate transactions, financing and liquidity matters, the success of restructurings, the timing
of significant orders, market acceptance of new products, competitive factors, litigation involving
intellectual property, shareholder and other issues, commercial and economic disruption due to
natural disasters, terrorist activity, armed conflict or political instability, epidemics and other
risks indicated in the Company's filings from time to time with the U.S. Securities and Exchange
Commission, including, but not limited to, the Company’s reports on Form 20-F and Form 6-K.
The company assumes no obligation to update or revise any forward-looking statements to
reflect future developments or circumstances.
2

Confidential and Proprietary Information ASMI Annual Meeting of Shareholders May 16 2013 3
› Semiconductor Equipment Market in 2012
› ASMI Results in 2012
› Status ASMI Back-end
- Results
- Products & Business highlights
› Status ASMI Front-end
- Results
- Products & Business highlights
› Market Outlook and Conclusions
OUTLINE

Confidential and Proprietary Information ASMI Annual Meeting of Shareholders May 16 2013
Semi Capital Equipment (USD billion)
0
10
20
30
40
50
2007 2008 2009 2010 2011 2012
Source: Gartner, March 2013
+142,1%
+10,8%
-15,4%
-45,4%
OUR INDUSTRY TURNED DOWN IN 2012
4
After 2 years of growth, our industry declined in 2012
Confidential and Proprietary Information ASMI Annual Meeting of Shareholders May 16 2013
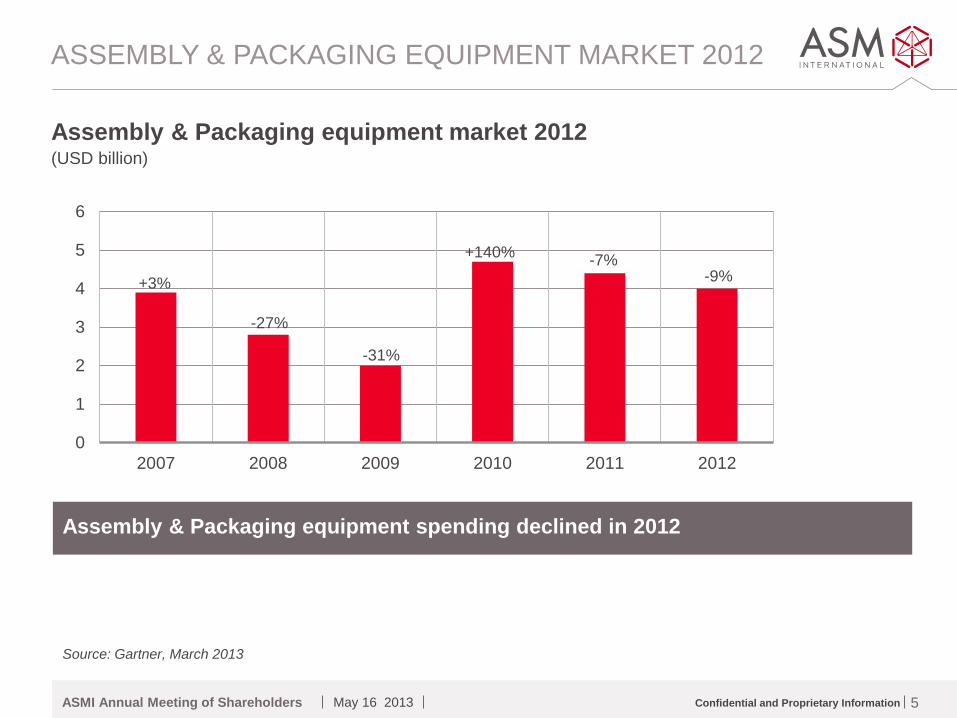
Assembly & Packaging equipment market 2012 (USD billion)
0
1
2
3
4
5
6
2007 2008 2009 2010 2011 2012
+3%
-27%
-31%
+140%
-7% -9%
5
ASSEMBLY & PACKAGING EQUIPMENT MARKET 2012
Assembly & Packaging equipment spending declined in 2012
Source: Gartner, March 2013

Confidential and Proprietary Information ASMI Annual Meeting of Shareholders May 16 2013
SMT* equipment market 2012 (USD million)
0
1000
2000
3000
4000
5000
6000
2003 2004 2005 2006 2007 2008 2009 2010 2011 2012
+37%
+8%
+11% -12%
+162%
+3%
+37%
0%
-50%
-19%
6
SMT EQUIPMENT MARKET 2012
Source: ASM SIPLACE market intelligence, February 2013
SMT equipment market was down in 2012
*SMT = Surface Mount Technology

Confidential and Proprietary Information ASMI Annual Meeting of Shareholders May 16 2013
Wafer Fab Equipment by device type (USD billion)
0
5
10
15
20
25
30
35
40
2007 2008 2009 2010 2011 2012
Other
Memory
Logic
Foundry
+10%
-47%
+145%
+15%
-33%
-18%
WAFER FAB EQUIPMENT DECLINED IN 2012
7
Source: Gartner, March 2013
› 2012 WFE spending decreased by 18%
› Logic & Foundry declined slightly in 2012
› Memory declined substantially

Confidential and Proprietary Information ASMI Annual Meeting of Shareholders May 16 2013 8
› Semiconductor Equipment Market in 2012
› ASMI Results in 2012
› Status ASMI Back-end
- Results
- Products & Business highlights
› Status ASMI Front-end
- Results
- Products & Business highlights
› Market Outlook and Conclusions
OUTLINE

Confidential and Proprietary Information ASMI Annual Meeting of Shareholders May 16 2013
KEY HIGHLIGHTS – 2012
› Revenues down 13% y-o-y
- FE sales decreased 19% y-o-y
- BE sales decreased 11% y-o-y
› EBIT margin of 6%
- FE EBIT margin down from 14% in 2011 to 0.4% in 2012
- BE EBIT margin down from 18% in 2011 to 8% in 2012
› Cash flow from operations of €42m in 2012
- Proposal to ASMI AGM for dividend of €0.50 per share
› Net earnings of €7m down from €187m in 2011
- 2011 included gain on bargain purchase of €51m
9

Confidential and Proprietary Information ASMI Annual Meeting of Shareholders May 16 2013
NET EARNINGS – GROUP
(EUR million)
FULL YEAR 2011
FULL YEAR 2012
Q1 2012
Q2 2012
Q3 2012
Q4 2012
Q1 2013
Front-end 456.1 370.4 94.8 86.5 96.1 93.1 80.0
Back-end 1,178.3 1,047.7 216.3 291.4 313.2 226.8 160.3
NET SALES 1,634.3 1,418.1 311,1 377.9 409.3 319.9 240.3
Front-end 37.8% 33.6% 33.0% 33.0% 31.4% 37.1% 37.7%
Back-end 34.8% 30.2% 30.2% 35.0% 30.4% 23.5% 24.0%
GROSS MARGIN 582.2 440.4 96.6 130.6 125.4 87.8 68.6
as % of sales 35.6% 31.1% 31.1% 34.6% 30.6% 27.4% 28.5%
Selling, general and administrative (176.5) (202.1) (41.2) (53.8) (53.6) (53.5) (40.9)
Research and development (129.4) (149.2) (33.5) (38.2) (40.0) (37.5) (30.5)
Front-end 62.6 1.4 2.9 (1.9) (1.6) 2.1 1.4
Back-end (100%) 213.7 87.7 19.0 40.5 33.6 (5.3) (4.3)
EBIT (excl. restructuring/impairment) 276.3 89.2 21.9 38.5 31.9 (3.2) (2.9)
as % of sales 16.9% 6.3% 7.1% 10.2% 7.8% -1.0% -1.2%
Restructuring - (0.9) - - - (0.9) (0.3)
Bargain purchase (PPA) 97.8 - - - - - -
Impairment (8.0) - - - - - -
Front-end 44.5 (29.1) (2.5) 1.3 (8.4) (19.5) 3.1
Back-end (ASMI interest) 142.2 36.4 8.8 16.,5 13.3 (2.2) (0.5)
Gain on sale shares - - - - - - 1,407.6
NET RESULT 186.8 7.1 6.2 17.7 4.9 (21.7) 1,410.1
10

Confidential and Proprietary Information ASMI Annual Meeting of Shareholders May 16 2013
BALANCE SHEET – GROUP
(EUR million) DEC 2011 MAR 2012 JUN 2012 SEP 2012 DEC 2012 MAR 2013
Cash and cash equivalents 390
405
334
297
291
565
Other current assets 806
773
917
901
804
208
Property, plant and equipment, net 260
259
279
275
275
61
Goodwill, net 52
51
54
52
52
12
Other assets 74
74
84
89
75
1,381
TOTAL ASSETS 1,582 1,561 1,668 1,615 1,496 2,226
ST debt (incl. current LT debt) 45
40
72
86
68
-
Other current liabilities 418
409
449
390
344
86
Long-term debt & convertible subordinated debt 150
150
152
144
13
-
Other long term liabilities 11
11
17
17
21
4
TOTAL LIABILITIES 625 610 690 637 446 90
Total shareholders' equity 660
653
665
667
742
2,136
Non-controlling interest 298
298
313
311
308 -
TOTAL LIABILITIES AND EQUITY 1, 582 1,561 1,668 1,615 1,496 2,226
11

Confidential and Proprietary Information ASMI Annual Meeting of Shareholders May 16 2013
WORKING CAPITAL – GROUP
0
100
200
300
400
500
600
Q4 Q1 Q2 Q3 Q4 Q1 Q2 Q3 Q4
(EUR in million)
Front-end Back-end
Days
50
75
100
125
150
Q4 Q1 Q2 Q3 Q4 Q1 Q2 Q3 Q4
Front-end Back-end Group
12
10 11 12 10 11 12

Confidential and Proprietary Information ASMI Annual Meeting of Shareholders May 16 2013
CASH FLOW – GROUP
(EUR million)
FULL
YEAR
2011
FULL
YEAR
2012
Q1 2012
Q2 2012
Q3 2012
Q4 2012
Net result 316.2 40.4 14.2 32.8 17.2 (23.8)
Depreciation 49.5 56.9 13.1 13.7 15.1 15.0
Working capital (39.2) (60.8) 19.3 (62.2) (59.7) 41.8
Restructuring & impairments 4.9 0.1 0.1 - - -
Others (114.7) 5.9 (7.3) (11.6) 7.7 17.1
Net cash from operating activities 216.6 42.5 40.2 (27.2) (19.8) 50.1
Net cash from investing activities (93.4) (71.9) (18.4) (17.8) (14.5) (21.1)
Net cash from financing activities (45.4) (73.5) (5.8) (27.4) (5.2) (35.1)
Exchange rate effects (7.8) 3.1 (0.8) 1.5 3.2 (0.8)
NET INCREASE (DECREASE) IN CASH
AND CASH EQUIVALENTS 70.0 (99.8) 14.4 (70.9) (36.4) (6.8)
13

Confidential and Proprietary Information ASMI Annual Meeting of Shareholders May 16 2013
BOOKINGS & BACKLOG - GROUP
14
0
100
200
300
400
500
600
Q1 Q2 Q3 Q4 Q1 Q2 Q3 Q4 Q1 Q2 Q3 Q4 Q1 Q2 Q3 Q4 Q1 Q2 Q3 Q4 Q1 Q2 Q3 Q4
07 08 09 10 11 12
Bookings (EUR million)
0
100
200
300
400
500
600
700
Q1 Q2 Q3 Q4 Q1 Q2 Q3 Q4 Q1 Q2 Q3 Q4 Q1 Q2 Q3 Q4 Q1 Q2 Q3 Q4 Q1 Q2 Q3 Q4
07 08 09 10 11 12
Backlog (EUR million) Back-end Front-end
Backlog decreased
from €331m at the
end of 2011,
to €289m at
the end of 2012
Book to bill ratio
in 2012 of 1.0 (2011
was 0.8)

Confidential and Proprietary Information ASMI Annual Meeting of Shareholders May 16 2013
USE OF ASMPT DIVIDENDS
Dividends
received
ASMI shares
repurchased
Convertible
bonds
repurchased
Dividend
pay outs
Balance
(EUR million)
2007 49.1 -32.9 -5.4 10.8
2008 49.1 -36.5 -27.1 -14.5
2009 21.4 -27.0 -5.6
2010 65.6 -55.8 9.8
2011 87.2 -22.3 64.9
2012 * -40.6 -27.5 -68.1
TOTAL 272.4 -77.1 -142.8 -55.2 -2.7
15
* 2012 PT dividend received of 29.5 was not part of commitment
1.5 million shares bought back in 2012

Confidential and Proprietary Information ASMI Annual Meeting of Shareholders May 16 2013
ASMI SHARE PRICE IN 2012
› ASMI share price increased 20% in 2012, but declined in March’13
following sale stake ASMPT
› Comparison same sector companies
16
Source: google.com/finance and Euronext

Confidential and Proprietary Information ASMI Annual Meeting of Shareholders May 16 2013
ASMI SHARE PRICE LAST 5 YEARS
ASMI share price increased 49% (end of 2012) compared to 2008
17
Source: google.com/finance and Euronext

Confidential and Proprietary Information ASMI Annual Meeting of Shareholders May 16 2013
Back-end
• CSR Policy draft in review, target Q2-13
• 3rd party EICC audit of HK and China
complete 7/12, corrective actions underway
• EICC self-assessment done for 5 of 8
facilities, rest complete by Q3-13
• Ethics training all employees annually
Front-end
• Sustainability policy published 2/13
• Internal EICC audit all sites completed 1/13
• External EICC re-audit of Singapore site
5/13 successful, zero open findings
• Annual ethics training completed 10/12
• Ethics Scorecard in place 4/13
COMMITMENT TO SUSTAINABILITY
› We are committed to the Electronics Industry Citizenship Coalition (EICC)
tenets to conduct our business responsibly in all areas of Environment, Health
& Safety, Labor, Ethics and Supply Chain.
› We strive to earn the trust of all stakeholders through responsible and ethical
corporate practices.
› In both our Front-end and Back-end businesses, we pride ourselves in being
responsible corporate citizens.
18
Transparency ASM Internet site - Sustainability

Confidential and Proprietary Information ASMI Annual Meeting of Shareholders May 16 2013
HEALTH, SAFETY, ENVIRONMENT
Front-end
› Among benchmark companies
› Key customer recognition for EHS
Back-end
› RCR continues to outperform Industry
› Safety Training top-to-bottom improvement
› Risk Assessment and risk-focused actions
Front-end
› Global ISO14001 by 7/13
› Environmental Scorecard 1/13
› Carbon Disclosure Project (CDP)
participation 5/13
Back-end
› 5 of 8 facilities ISO14001 certified now
› Global ISO14001 target by 2016 end
› Environmental Scorecard in place
S
A
F
E
T
Y
G
R
E
E
N
19
0.2
0.4
0.6
0.8
1
1.2
2009 2010 2011 2012
Recordable Case Rate (CY)
ASM FE ASM BE SEMI (US BOL Data)
FE Goal=0.35
BE Goal=0.50

Confidential and Proprietary Information ASMI Annual Meeting of Shareholders May 16 2013 20
› Semiconductor Equipment Market in 2012
› ASMI Results in 2012
› Status ASMI Back-end
- Results
- Products & Business highlights
› Status ASMI Front-end
- Results
- Products & Business highlights
› Market Outlook and Conclusions
OUTLINE

Confidential and Proprietary Information ASMI Annual Meeting of Shareholders May 16 2013
BACK-END – WHAT HAS CHANGED IN 2012?
› Assembly & Packaging revenue down 23% compared to 2011
› Record leadframe revenue, leadframe business profitable
› SMT improved its market position and profit margin in 2012
21

Confidential and Proprietary Information ASMI Annual Meeting of Shareholders May 16 2013
Net sales in EUR mln EBIT in EUR mln
22
HISTORICAL DEVELOPMENT – BACK-END
- 20
0
20
40
60
80
100
120
0
50
100
150
200
250
300
350
400
Q1 Q2 Q3 Q4 Q1 Q2 Q3 Q4 Q1 Q2 Q3 Q4 Q1 Q2 Q3 Q4 Q1 Q2 Q3 Q4 Q1 Q2 Q3 Q4
07 08 09 10 11 12

Confidential and Proprietary Information ASMI Annual Meeting of Shareholders May 16 2013
SUMMARY 2012 – BACK-END
(EUR million)
FULL
YEAR 2011
FULL
YEAR 2012
Q1 2012
Q2 2012
Q3 2012
Q4 2012
Net sales 1,178.3 1,047.7 216.3 291.4 313.2 226.8
Gross margin 409.8 315.9 65.3 102.0 95.3 53.3
as % of sales 34.8% 30.2% 30.2% 35.0% 30.4% 23.5%
Selling, general and administrative
(115.3)
(137.6)
(26.6)
(38.5)
(37.2)
(35.4)
Research & development
(80.9)
(90.5)
(19.7)
(23.1)
(24.5)
(23.2)
EBIT (EXCL. IMPAIRMENT) 213.7 87.7 19.0 40.5 33.6 (5.3)
as % of sales 18.1% 8.4% 8.8% 13.9% 10.7% -2.3%
Bookings 971 1,017 282 334 210 191
BOOK-TO-BILL 0.8 1.0 1.3 1.1 0.7 0.8
23

Confidential and Proprietary Information ASMI Annual Meeting of Shareholders May 16 2013
BOOKINGS & BACKLOG – BACK-END
0
50
100
150
200
250
300
350
400
450
Q1 Q2 Q3 Q4 Q1 Q2 Q3 Q4 Q1 Q2 Q3 Q4 Q1 Q2 Q3 Q4 Q1 Q2 Q3 Q4 Q1 Q2 Q3 Q4
Bookings (EUR million)
0
50
100
150
200
250
300
350
400
450
500
Q1 Q2 Q3 Q4 Q1 Q2 Q3 Q4 Q1 Q2 Q3 Q4 Q1 Q2 Q3 Q4 Q1 Q2 Q3 Q4 Q1 Q2 Q3 Q4
Backlog (EUR million)
24
Book-to-Bill
ratio in 2012
was 1.0
Backlog
declined 12%
to €198m
in 2012
ASMAS ASMPT
07 08 09 10 11 12
07 08 09 10 11 12

Confidential and Proprietary Information ASMI Annual Meeting of Shareholders May 16 2013
PRODUCTS – BACK-END
IC manufacturing - LED manufacturing - Surface Mount Technology
MARKET APPLICATION ASM RELATIVE POSITIONING
IC manufacturing › Assembly tools
› Packaging tools
› Inspection tools
LED manufacturing › Assembly tools
› Packaging tools
› Testing tools
SMT › Placement tools
• Die bonding
• Wire bonding
• Flip chip bonding / TCB
bonding
• Moulding
• Trim & Form
• Vision and Inspection
• Die bonding
• Wire bonding
• Moulding
• Trim & Form
• Vision and Inspection
• Sorting
• Testing
• Pick & Place
• Automation software
Among the top 2 position
for most products
Qualified by most IDM’s
and Subcontractors’
Strong local service and
support organization
Total solution selling
#1 in the bonding market
Complete manufacturing
tools portfolio
Entered LED market
already in 2006
Strong local service and
support organization
ASM #3 vendor
Leading position in High-
end tools
25

Confidential and Proprietary Information ASMI Annual Meeting of Shareholders May 16 2013
BACK-END PRODUCT HIGHLIGHTS THERMAL COMPRESSION BONDING (TCB) PROCESS
› Capable to address
fine pitch flip chip
(Cu pillar) bonding
and 2.5D/3D
package applications
› Popularity of mobile
devices expected to
accelerate adoption of
2.5D/3D packages
Substrate
NCP
Dispensing
Substrate
Bond head
Die
Heat
Die
Substrate
Force + Heat
Die
Substrate
Alignment
Post Curing Thermal Compression Bonding
NCP Dispensing
Heat
26

Confidential and Proprietary Information ASMI Annual Meeting of Shareholders May 16 2013
› Expanding SMT equipment into non-
traditional placement market
› Ideal for WLFO (Wafer Level Fan
Out), SiP (System-in-package), LED,
Embedded PCB and flip chips
› Enables the combination of flip-chip
and SMT operations in a single pass
› Supports direct die attach
› Supports large panel areas
› Very high production speed and
throughput
27
BACK-END PRODUCT HIGHLIGHTS
Chip Assembly (CA) solution for advanced packages

Confidential and Proprietary Information ASMI Annual Meeting of Shareholders May 16 2013 28
› Semiconductor Equipment Market in 2012
› ASMI Results in 2012
› Status ASMI Back-end
- Results
- Products & Business highlights
› Status ASMI Front-end
- Results
- Products & Business highlights
› Market Outlook and Conclusions
OUTLINE

Confidential and Proprietary Information ASMI Annual Meeting of Shareholders May 16 2013
Net sales in EUR million
- 25
- 20
- 15
- 10
- 5
0
5
10
15
20
25
0
20
40
60
80
100
120
140
Q1 Q2 Q3 Q4 Q1 Q2 Q3 Q4 Q1 Q2 Q3 Q4 Q1 Q2 Q3 Q4 Q1 Q2 Q3 Q4 Q1 Q2 Q3 Q4 Q1
EBIT in EUR million
HISTORICAL DEVELOPMENT – FRONT-END
07 08 09 10 11 12 13
29

Confidential and Proprietary Information ASMI Annual Meeting of Shareholders May 16 2013
SUMMARY 2012 – FRONT-END
(EUR million) Full Year
2011 Full Year
2012 Q1
2012 Q2
2012 Q3
2012 Q4
2012 Q1
2013
Net sales
456.1
370.4
94.8
86.5
96.1
93.1
80.0
Gross margin
172.3
124.5
31.3
28.5
30.1
34.6
30.2
as % of sales 37.8% 33.6% 33.0% 32.9% 31.4% 37.1% 37.7%
Selling, general and administrative
(61.2)
(64.4)
(14.6)
(15.4)
(16.3)
(18.2)
(15.3)
Research & development
(48.5)
(58.7)
(13.8)
(15.1)
(15.4)
(14.3)
(13.4)
EBIT (excl. restructuring) 62.6 1.4 2.9 (1.9) (1.6) 2.1 1.4
as % of sales 13.7% 0.4% 3.0% -2.2% -1.7% 2.3% 1.8%
Bookings 398 360 81 86 64 129 106
Book-to-Bill 0.9 1.0 0.8 1.0 0.7 1.4 1.3
30

Confidential and Proprietary Information ASMI Annual Meeting of Shareholders May 16 2013
Bookings & Backlog – Front-end
Book-to-Bill ratio in 2012 of 1.0
0
20
40
60
80
100
120
140
160
180
200
Q1 Q2 Q3 Q4 Q1 Q2 Q3 Q4 Q1 Q2 Q3 Q4 Q1 Q2 Q3 Q4 Q1 Q2 Q3 Q4 Q1 Q2 Q3 Q4 Q1
Bookings Backlog
31
07 08 09 10 11 12 13
BOOKINGS & BACLOG – FRONT-END

Confidential and Proprietary Information ASMI Annual Meeting of Shareholders May 16 2013
ASM PRODUCTS – FRONT-END
› Market requirements: 32nm → 22nm → 14nm and beyond
› Strong IP protected portfolio
ALD and PEALD › ALD solution (Hafnium oxide)
› PEALD Low temp dielectrics
Diffusion Furnace › Unique “dual reactor dual boat”
design
Epitaxy › Epitaxial films for both analog
devices as well as NMOS/PMOS
PECVD › Extreme low-k films
PROCESS APPLICATION ASM RELATIVE POSITIONING
• ALD key for High-k Metal Gate
technology
• 3D FinFET requires more
conformal layers, strength of ALD
• SDDP-application of PEALD
• Smallest footprint per reactor
• Low Cost of Ownership
• Advanced intermetal dielectric
film
• Thick Epi layers for power
devices
• Strained Epi films for CMOS
#1 in the served ALD market
Qualified by nearly all Logic &
Foundry manufacturers
Strengthening inroads with
PEALD
Leading IC manufacturers are
customers
ASM one of only two top
vendors in PE-CVD Low-k
ASM one of only two top
vendors
32

Confidential and Proprietary Information ASMI Annual Meeting of Shareholders May 16 2013 33
FRONT-END – WHAT HAS CHANGED IN 2012? (I)
› ALD and PEALD strongly developed further traction in 2012
› Growing share of wallet with top clients
› Two new high productivity platforms introduced in 2012
› Gross margin improvement focus
- Inefficiency issues solved
- Several cost measures in implementation
- Further savings opportunities identified in supply chain
33

Confidential and Proprietary Information ASMI Annual Meeting of Shareholders May 16 2013
Epitaxy
IntrepidTM XP
34
FRONT-END – WHAT HAS CHANGED IN 2012? (II)
PECVD
Dragon® XP8
PEALD
Eagle® XP8
Two new high productivity platforms
High throughput, low CoO single wafer
deposition tool
High productivity XP cluster with 4 Epi
reactors

Confidential and Proprietary Information ASMI Annual Meeting of Shareholders May 16 2013
Key Developments:
› Diversification of customer
base from Logic to Memory
and Foundries
› Weight of Asia growing
› Wider adoption number of
top capex customers
Customer Revenue (%)
35
PRODUCTS – FRONT-END GROWING WALLET SHARE WITH TOP CLIENTS
100
50
25
0
75
2009 2010 2011 2012 2013E
Top 3 Nr 4-10 Rest

Confidential and Proprietary Information ASMI Annual Meeting of Shareholders May 16 2013
FRONT-END’S COMPETITIVE ADVANTAGES
› Established a leading position in ALD technology, since start in 1999
› Shift from Planar Logic to 3D FinFET will require more ALD/PEALD
› PEALD offered on high productivity platform
› ASMI is one of the two leading suppliers of PECVD Low-k films
› In the EPI market ASMI is one of only two global suppliers
36

Confidential and Proprietary Information ASMI Annual Meeting of Shareholders May 16 2013 37
› Semiconductor Equipment Market in 2012
› ASMI Results in 2012
› Status ASMI Back-end
- Results
- Products & Business highlights
› Status ASMI Front-end
- Results
- Products & Business highlights
› Market Outlook and Conclusions
OUTLINE

Confidential and Proprietary Information ASMI Annual Meeting of Shareholders May 16 2013
Semi capital equipment outlook (USD billion)
0
10
20
30
40
50
2008 2009 2010 2011 2012 2013 2014
+142,1%
+10,8%
-15,4%
-45,4%
-8,2%
+18,6%
38
Market predicted to be down in 2013 by approximately 8% and to grow in 2014
Source: Gartner, March 2013
SEMI CAPITAL EQUIPMENT OUTLOOK

Confidential and Proprietary Information ASMI Annual Meeting of Shareholders May 16 2013
Ultramobile PC
Notebook PC
Desk-based PC
Utility/Basic Media Tablet
Premium Media Tablet
Premium Smartphone
Utility/Basic Smartphone
Traditional Mobile Phone
Semiconductor Sales1 ($B)
1 - excludes SSD / ODD / RDD / Ethernet / graphics cards
0
20
40
60
80
100
120
140
160
2009 2010 2011 2012 2013 2014 2015 2016 2017
Source: Gartner (March 2013)
Semiconductor Dollars Per Unit1 ($)
0
20
40
60
80
100
120
140
160
180
2009 2010 2011 2012 2013 2014 2015 2016 2017
PC
Smartphone
Media Tablet
Traditional Phone
39
SEMICONDUCTOR MARKET THROUGH 2017

Confidential and Proprietary Information ASMI Annual Meeting of Shareholders May 16 2013
Assembly & Packaging equipment (USD billion)
0
1
2
3
4
5
2008 2009 2010 2011 2012 2013 2014
-28%
-31%
+140% -7%
-9%
23%
40
ASM BACK-END MARKETS
-13%
40
Source: Gartner, March 2013
Assembly & Packaging equipment spending is expected to decline in 2013,
and to rebound in 2014
Confidential and Proprietary Information ASMI Annual Meeting of Shareholders May 16 2013
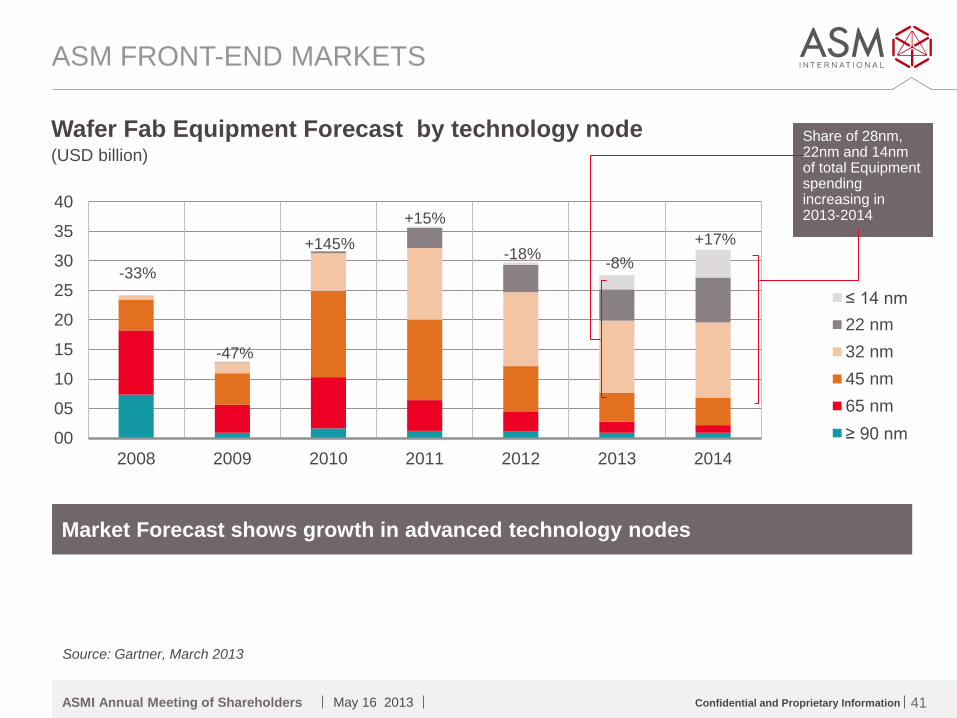
Wafer Fab Equipment Forecast by technology node (USD billion)
00
05
10
15
20
25
30
35
40
2008 2009 2010 2011 2012 2013 2014
≤ 14 nm
22 nm
32 nm
45 nm
65 nm
≥ 90 nm
Market Forecast shows growth in advanced technology nodes
-47%
+145%
+15%
-33%
-18%
ASM FRONT-END MARKETS
Share of 28nm, 22nm and 14nm of total Equipment spending increasing in 2013-2014
-8%
+17%
41
Source: Gartner, March 2013

Confidential and Proprietary Information ASMI Annual Meeting of Shareholders May 16 2013
Q2 FINANCIAL OUTLOOK ASMI
› Based upon the current backlog and our current visibility:
- Following the healthy book to bill ratios in Q4 2012 and Q1 2013 our Front-end
operations are expected to show a strong double digit sales increase in Q2
compared to Q1.
We also expect a double digit increase of our order-intake in Q2 compared to Q1.
42

Confidential and Proprietary Information ASMI Annual Meeting of Shareholders May 16 2013
SUMMARY
› Front-end revenue declined 19% compared to 2011
› Back-end revenue declined 11% compared to 2011
› ALD and PEALD strongly developed further traction in 2012
› Continued focus on Front-end Gross Margin improvement
› Company believes to be well positioned to benefit from the semi
industry end product growth drivers in 2013-2017
› Technology shift in the industry will require more ALD/PEALD
› Front-end equipment market believed to turn around in 2013 versus
weak 2012
43

Confidential and Proprietary Information ASMI Annual Meeting of Shareholders May 16 2013 44