asian academic research j o u r n a l o f s o c i a l s c ... fileaarjsh volume 1, issue 4 (october...
TRANSCRIPT
AARJSH VOLUME 1, ISSUE 4 (OCTOBER 2012) ISSN : 2278 – 859X
Asian Academic Research Journal of Social Sciences & Humanities
www.asianacademicresearch.org
118
A Peer Reviewed International Journal of Asian
Academic Research Associates
AARJSH
ASIAN ACADEMIC RESEARCH
J O U R N A L O F S O C I A L
S C I E N C E & H U M A N I T I E S
CAUSES AND CONSEQUENCES OF THE ATTRITION IN A SELECTED
ORGANISATION AT BANGALORE, INDIA
*DR RUPA GUNASEELAN *; M/S. ZENETTA ROSALINE **
* Associate Professor,
BSMED, Bharathiar University, Coimbatore
** Assistant Professor,
PSGR Krishnammal College for Women, Coimbatore
ABSTRACT
The average attrition rate in the industrial sector is approximately around 40 to 50 percent.
It is true that this is lesser than the prevalent attrition rate in the US market (around 70
percent), but the challenge continues to be greater considering the recent growth of the
industry in the country. The US industrial sector is estimated to be somewhere around three
decades old. Keeping low attrition levels is a major challenge as the demand outstrips the
supply of good agents by a big margin. Further the salary growth plan for each employee is
not well defined. All this only encourages poaching by other companies who can offer a
higher salary. Retention specialist would dream of telling you what your employee’s value.
HR managers, team leaders and other top notch officials’ wake up to this reality. In the world
of globalization and cut-throat competition battles cannot be lost for the want of a nail.

AARJSH VOLUME 1, ISSUE 4 (OCTOBER 2012) ISSN : 2278 – 859X
Asian Academic Research Journal of Social Sciences & Humanities
www.asianacademicresearch.org
119
INTRODUCTION ON ATTRITION
In the best of worlds, employees would love their jobs, like their co-workers, work hard for
their employers, get paid well for their work, have ample chances for advancement, and
flexible schedules so they could attend to personal or family needs when necessary and never
leave. But then there‟s the real world. And in the real world, employees do leave, either
because they want more money, hate the working conditions, hate their co-workers, want a
change, or because their spouse gets a dream job in another state.
The HR manager is not only required to fulfill this responsibility, but also find the right kind
of people who can keep pace with the unique work patterns in the industry. Adding to this is
the issue of maintaining consistency in performance and keeping the motivation levels high,
despite the monotonous work. The toughest concern for an HR manager is however the high
attrition rate.
In India, the average attrition rate in the industrial sector is approximately around 40 to 50
percent. It is true that this is lesser than the prevalent attrition rate in the US market (around
70 percent), but the challenge continues to be greater considering the recent growth of the
industry in the country. The US industrial sector is estimated to be somewhere around three
decades old. Keeping low attrition levels is a major challenge as the demand outstrips the
supply of good agents by a big margin. Further the salary growth plan for each employee is
not well defined. All this only encourages poaching by other companies who can offer a
higher salary.
The much hyped “work for fun”: tag normally associated with the industry has in fact
backfired as many individuals (mostly fresh graduates), take it as a past-time job. Once they
join the sector and understand its requirements, they are taken aback by the long working
hours and later monotony of the job starts setting in. This is the reason for the high attrition
rate as many individuals are not able to take the pressures of work.
The toughness of the job and timings is not adequately conveyed. Besides the induction and
project training, not much investment has been done to evolve a “continuous training
program” for the Employees. Motivational training is still to evolve in this industry. But, in
all this, it is the HR manager who is expected to straighten things out and help individuals
adjust to the real world. I believe that the new entrant needs to be made aware of the realistic
situation from day- one itself, with the training session conducted, so that they get
accustomed to things right at the beginning.

AARJSH VOLUME 1, ISSUE 4 (OCTOBER 2012) ISSN : 2278 – 859X
Asian Academic Research Journal of Social Sciences & Humanities
www.asianacademicresearch.org
120
The high percentage of females in the workforce (constituting 30-35 percent of the total),
adds to the high attrition rate. Most women leave their job either after marriage or because of
social pressures caused by irregular working hours in the industry. All this translates into
huge losses for the company, which invests a lot of money in training them.
ATTRITION THE UNHEALED ISSUE
Managing attrition is not just a „nice thing to do‟ in Indian Business sector. It is the route to
their survival.
Far from accepting attrition rates as part of the cost of doing business, it is surely something
that all organizations should address, and equally surely it is an area in which HR can take a
lead- measure attrition, seek its cause, set out solutions and target performance.
Calculation of Attriction rate:
Total Number of Resigns per month x 100
(Total No. of employees at the beginning of the month New joiners) -- Total no. of
resignations
LITERATURE REVIEWS
Gen.H.Lal [2006] in CREST, Volume No: 13 B stated that the attrition
problem can be tackled with the application of TQM concept “people side of quality”. In this
approach we must have factual data on the causes that impel employees to leave an
organization. The most authentic means of obtaining this data is to conduct comprehensive
exit interviews of those quitting.
PBS Kumar, HR manager, Shahi Export Pvt. Ltd. UNIT – 12 Bangalore [2007] in his
publication “A study on Attrition in Shahi Exports “[IBA Library] has listed the reasons of
attrition as putting policies ahead of people, lack of communication, failing to hear, what
your employees have to say, not acknowledging that you do not have all the answers, the
glass is always half empty, not accepting responsibility.
Mr. Kirupalli, IIPM student, [2007] in his article “Retention tools for curbing attrition” [IBA
Library] stated that the following are the retention tools:
Offer compensation – attractive and competitive
Benefits need to be quantified and qualitative,
Train the front- line managers, administrators,
Roles and responsibilities needs to be dovetailed
Enhancement, advancement and progression opportunities,
Offer retention bonus,

AARJSH VOLUME 1, ISSUE 4 (OCTOBER 2012) ISSN : 2278 – 859X
Asian Academic Research Journal of Social Sciences & Humanities
www.asianacademicresearch.org
121
Retention strategies implementation needs to have a process owner,
Go in for employee engagement practices,
Teamwork and cross functional teams
Paperless organization
Fun is must
Mission statement for ach functional area, assignments for job enrichment,
Encourage higher learning.
Ms.Kiruthika Roa S.I.E.S college of Commerce and Economics, Mumbai [2007],[IIM [B]
Library] her recommendations to Wipro are, to improve employee retention, one needs to
understand what they value the most. Attrition rates in BPO‟s are alarmingly high, so
immediate solutions need to be derived and acted upon in order to check the high attrition
rates and retain the employees. As a suggestion, there could be a separate department for
employee retention within the realm of the HR department. The constant endeavor of this
„sub-department‟ should be to bring down employee turnover rate on an ongoing basis. If the
company goes with this aim, they can surely achieve this goal. There are two things that are
critical in achieving the objective of keeping the attrition rate in check and increasing the
degree of employee retention.
They are:
a. Right people must be hired for the right job, with an emphasis of following the
procedure and focus on their development needs such as training etc.
b. Right reason as to why the employees leave the organization must be found out and
addressed so as to prevent such as turnover.
Retention programs often fail because managers do not know and, therefore, do not
act on the most important areas affecting on employee‟s intention to leave. Across the
organization, individual development and career advancement stand out as both
frequent and critical key drivers of any employee‟s intent to level. While the general
conclusions across organizations may appear similar, at a more micro level, the
composition and ordering of specific retention key drivers is unique to each company.
In addition, the meaning attached to specific drivers

AARJSH VOLUME 1, ISSUE 4 (OCTOBER 2012) ISSN : 2278 – 859X
Asian Academic Research Journal of Social Sciences & Humanities
www.asianacademicresearch.org
122
(e.g., opportunities for personal growth and development) and, therefore, the actions
to be taken may vary by organization. Before implementing targeted solutions to
improve retention, managers need to determine which factors drive retention in their
organization as well as the meaning of those drivers.
5. Rohit Minton HR Amicorp group, Spain, [2007] [www.citehr.com] has given the
following retention tools:
Employee Reward Program
Career Development Program
Performance based Bonus
Employee Referral Plan
Loyalty Bonus
Giving a voice to the Knowledge Banks & Employee Recreation
Gifts at some Occasions
OD Corner [2007] [www.Managementparadise.com] has stated that, it‟s high time “human
resource”, is considered as the most important asset along with other entities in the balance
sheet of all organizations. This is the era where knowledge workers gain prominence and it
is well understood that Great people make Great organizations, not just a great
infrastructure can make a business successful. People and process are the vital components
of performance, hence it is essential for any organization to understand, monitor and
nurture the above factors. Process being a number friendly entity gets noticed and
monitored always on an immediate basis. Unfortunately the fire fighting mode of work
results in non recognition of people responsible for the process. Any good work can be
sustained only when it is appreciated and encouraged. This gives the respective employee
a morale boost and contributes significantly to employee retention which is a critical
aspect to any organization. This is why we want to imbibe the “Recognition culture”, deep
into the organization so that it becomes not just a monthly affair but becomes an addictive
habit.
Too much focus on numbers, not enough on people.
Feeling They Deserve Recognition and Don‟t Get It, While Others Do
Feeling That No One Even Knows or Cares if they Exist
Recognition Was Too late in Coming to Be Meaningful

AARJSH VOLUME 1, ISSUE 4 (OCTOBER 2012) ISSN : 2278 – 859X
Asian Academic Research Journal of Social Sciences & Humanities
www.asianacademicresearch.org
123
Feeling That No One Is Listening to them,
Feeling They Are Worth Less Than Employees at Other Companies
7. Paul James Davis [2008] in Attrition Management, Volume No.15 stated that the attrition
Rate varies according to the Thumb rule used by the countries. It is the quality of work shown
by the workers to their firm and found that the attrition rate in U.S. is 42%, Australia is 29%,
Europe is 34% and in India is 485 thus the global average of attrition rate comes around 24%
and it depicts that the massive cost is associated with attrition.
STATEMENT OF THE PROBLEM
The IT industry is being looked upon as the next big employment generator (it
requires 1.1 million job requirement by the year 2008). It is however no easy task for an HR
manager in this sector to bridge the ever increasing demand and supply gap of professionals.
Unlike software industry counterpart, the IT HR manager is not only required to fulfill this
responsibility, but also find the right kind of people who can keep pace with the unique work
patterns in this industry. The toughest concern for an HR manager is however the high
attrition rate. So this situation required a detailed study on attrition and retention management
that was conducted at a small IT firm located at Bangalore.
OBJECTIVES OF THE STUDY
Primary Objective: To assess the attrition rate and there by analyzing the reasons for
attrition, it the attrition is high.
Secondary Objectives:
To analyze the factors of attrition and to develop a future direction for
reduction of the attrition.
To suggest suitable measures to control Attrition in the selected
organization.
RESEARCH DESIGN
The study was designed to be descriptive in nature. Descriptive research
includes survey and fact finding enquires of different kinds. The study will come under the
type of cross sectional study. The study includes the analytical type of research to bring about
the attrition values and levels.
UNIVERSE OF THE STUDY
AARJSH VOLUME 1, ISSUE 4 (OCTOBER 2012) ISSN : 2278 – 859X
Asian Academic Research Journal of Social Sciences & Humanities
www.asianacademicresearch.org
124
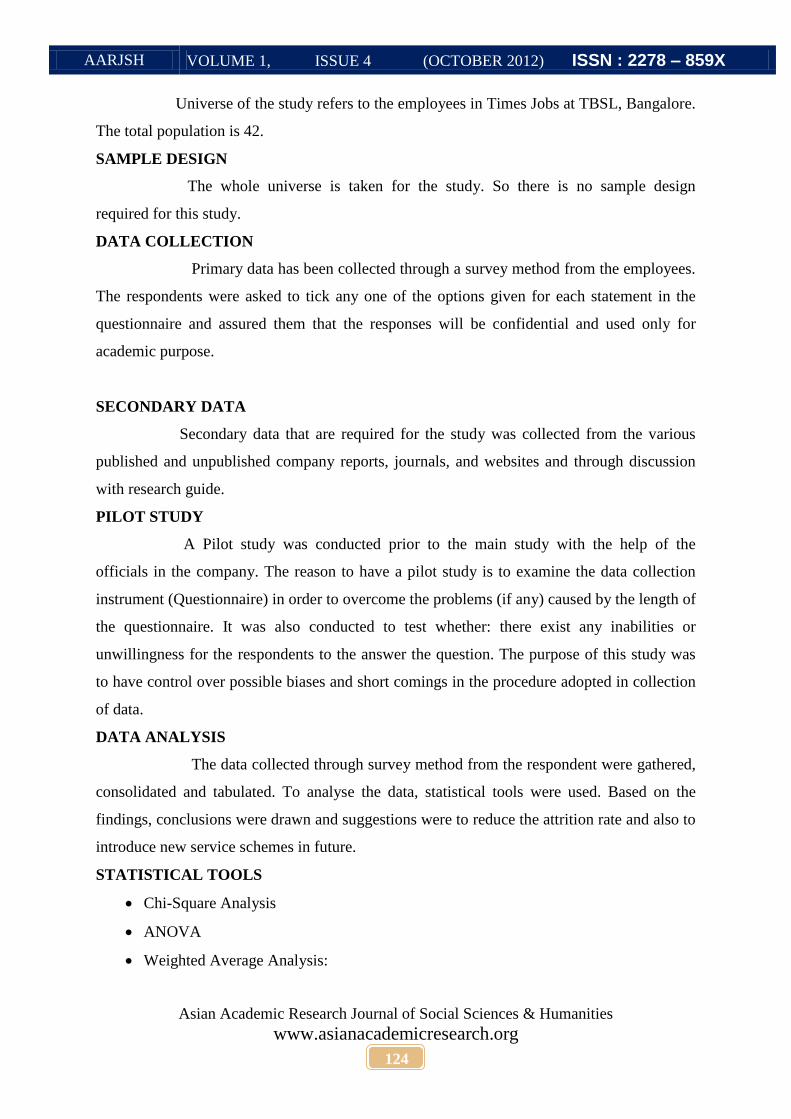
Universe of the study refers to the employees in Times Jobs at TBSL, Bangalore.
The total population is 42.
SAMPLE DESIGN
The whole universe is taken for the study. So there is no sample design
required for this study.
DATA COLLECTION
Primary data has been collected through a survey method from the employees.
The respondents were asked to tick any one of the options given for each statement in the
questionnaire and assured them that the responses will be confidential and used only for
academic purpose.
SECONDARY DATA
Secondary data that are required for the study was collected from the various
published and unpublished company reports, journals, and websites and through discussion
with research guide.
PILOT STUDY
A Pilot study was conducted prior to the main study with the help of the
officials in the company. The reason to have a pilot study is to examine the data collection
instrument (Questionnaire) in order to overcome the problems (if any) caused by the length of
the questionnaire. It was also conducted to test whether: there exist any inabilities or
unwillingness for the respondents to the answer the question. The purpose of this study was
to have control over possible biases and short comings in the procedure adopted in collection
of data.
DATA ANALYSIS
The data collected through survey method from the respondent were gathered,
consolidated and tabulated. To analyse the data, statistical tools were used. Based on the
findings, conclusions were drawn and suggestions were to reduce the attrition rate and also to
introduce new service schemes in future.
STATISTICAL TOOLS
Chi-Square Analysis
ANOVA
Weighted Average Analysis:

AARJSH VOLUME 1, ISSUE 4 (OCTOBER 2012) ISSN : 2278 – 859X
Asian Academic Research Journal of Social Sciences & Humanities
www.asianacademicresearch.org
125
LIMITATIONS OF THE STUDY
The respondents have answered the questionnaires from their memory, perception and
not from any written records.
Only the respondent‟s point of view has been analyzed. Company opinions were not
used in analyzing the data.
The study is based on employee‟s attitude and opinion. The attitude may change
suddenly or slowly.
Table1. Demographic Classification of the Respondents
NUMBER OF
RESPONDENTS
PERCENTAGE
Gender- Male 12 28.57%
Female 30 71.43%
AGE- Below 25 yrs 0 0%
26-35 yrs 35 83.33%
36-45 yrs 7 16.67%
Above 45 yrs 0 0%
Experience – Below 5
yrs
29 69.04%
6-10 yrs 7 16.66%
Above 10 yrs 6 14.03%
Table 1. Indicates that out of 42 respondents, 35 respondents (83.33%) belongs to 26-35
years, 7 respondents (16.67%) belongs to 36-46 years. It is inferred that, 83.3% of the
respondents, belongs to age group of 26-35 years. Further the table indicates that out of 42
respondents, 12 respondents (28.57%) were male and 30 respondents (71.43%) were female.
It is inferred that, 71.43% of the respondents were female. It also indicates that out of 42
respondents, 36 respondents (85.72%) were team Players. 6 respondents (14.28%) were
Team Leaders. It is inferred that, (85.72%) of the respondents were Team Players. Table 1.
Details that out 42 respondents, 29 respondents (69.04%) were having below 5 years
experience, 7 respondents (16.66%) were having 6-10 years experience and 6 respondents

AARJSH VOLUME 1, ISSUE 4 (OCTOBER 2012) ISSN : 2278 – 859X
Asian Academic Research Journal of Social Sciences & Humanities
www.asianacademicresearch.org
126
(14.03)%) were having above 10 years experience. It is inferred that, 69.04% of the
respondents were having experience of below 5 years.
TABLE 3.3.1
WEIGHTED AVERAGE SCORE BETWEEN PERSONAL FACTORS AND
STUDY
FACTORS
SL
NU
MB
ER
FA
CT
OR
S
AGE DESIGNATI
ON
GENDER EDUCATIONAL
QUALIFICATION
EXPERIENCE
25-3
5
YR
S
35-4
5
YR
S
TE
AM
PL
AY
ER
TE
AM
LE
AD
ER
MA
LE
FE
MA
LE
UG
PG
PR
OF
ES
SO
R
OT
HE
RS
LE
SS
TH
AN
5
YE
AR
S
5
TO
10
YE
AR
S
AB
OV
E
10
YE
AR
S
1
A
4.66
2.71
3.61
1.67
5.00
3.8
7
4.20
3.67
4.22
2.
86
4.00
3.00
1.85
2
B
4.03
4.99
4.06
5.00
4.50
5.0
0
4.06
3.61
3.83
4.
86
3.83
4.98
3.67
3
C
5.00
4.14
5.00
4.00
3.17
4.6
0
1.85
4.98
3.26
4.
12
3.87
2.13
3.50
4
D
4.37
3.29
4.33
3.33
3.98
5.0
0
4.33
3.50
4.66
3.
83
4.66
3.00
3.33
5
E
4.81
2.79
4.20
3.28
4.98
4.6
0
4.00
3.33
5.00
4.
00
3.39
3.29
4.20
6
F
4.66
2.86
4.98
4.67
4.67
5.0
2.88
4.20
4.59
2.
4.59
3.39
2.88
AARJSH VOLUME 1, ISSUE 4 (OCTOBER 2012) ISSN : 2278 – 859X
Asian Academic Research Journal of Social Sciences & Humanities
www.asianacademicresearch.org
127
0 36
7
G
4.29
2.13
4.78
3.33
3.33
5.0
0
4.78
3.00
4.96
4.
59
4.26
3.86
3.00
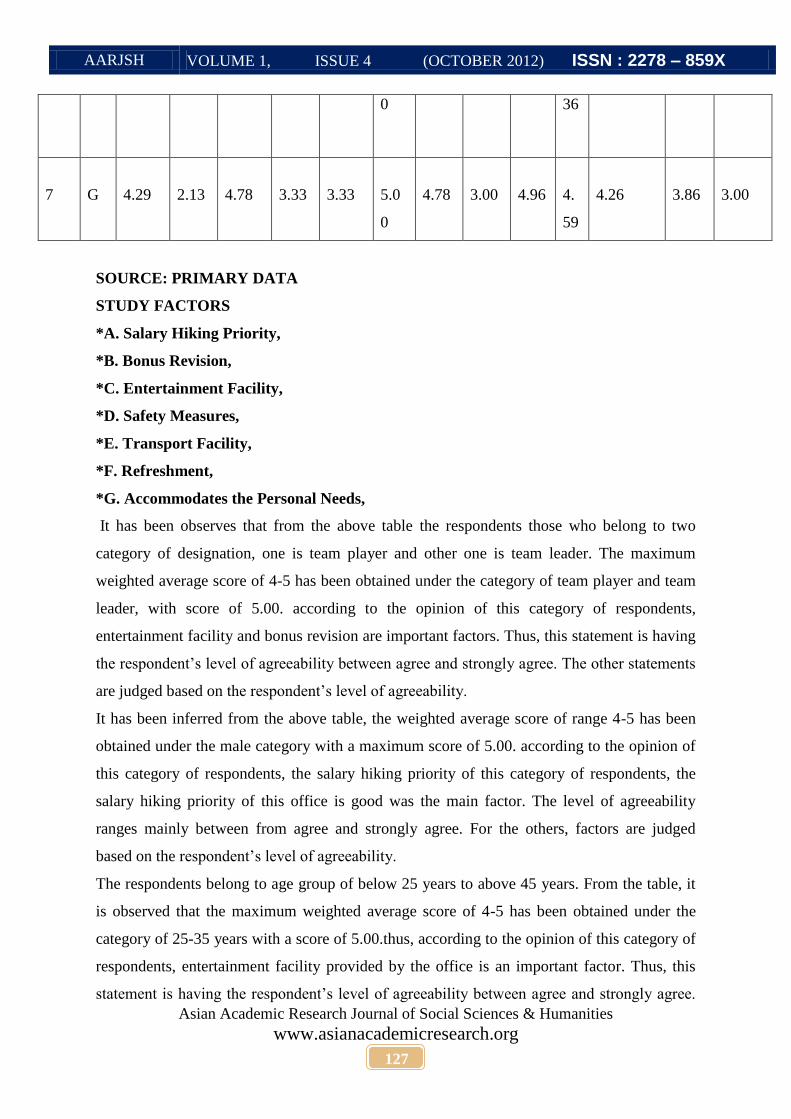
SOURCE: PRIMARY DATA
STUDY FACTORS
*A. Salary Hiking Priority,
*B. Bonus Revision,
*C. Entertainment Facility,
*D. Safety Measures,
*E. Transport Facility,
*F. Refreshment,
*G. Accommodates the Personal Needs,
It has been observes that from the above table the respondents those who belong to two
category of designation, one is team player and other one is team leader. The maximum
weighted average score of 4-5 has been obtained under the category of team player and team
leader, with score of 5.00. according to the opinion of this category of respondents,
entertainment facility and bonus revision are important factors. Thus, this statement is having
the respondent‟s level of agreeability between agree and strongly agree. The other statements
are judged based on the respondent‟s level of agreeability.
It has been inferred from the above table, the weighted average score of range 4-5 has been
obtained under the male category with a maximum score of 5.00. according to the opinion of
this category of respondents, the salary hiking priority of this category of respondents, the
salary hiking priority of this office is good was the main factor. The level of agreeability
ranges mainly between from agree and strongly agree. For the others, factors are judged
based on the respondent‟s level of agreeability.
The respondents belong to age group of below 25 years to above 45 years. From the table, it
is observed that the maximum weighted average score of 4-5 has been obtained under the
category of 25-35 years with a score of 5.00.thus, according to the opinion of this category of
respondents, entertainment facility provided by the office is an important factor. Thus, this
statement is having the respondent‟s level of agreeability between agree and strongly agree.

AARJSH VOLUME 1, ISSUE 4 (OCTOBER 2012) ISSN : 2278 – 859X
Asian Academic Research Journal of Social Sciences & Humanities
www.asianacademicresearch.org
128
In the other categories of age group, the level of agreeability for the same statement is
between neutral and agree with the weighted average score of 3-4.
The respondents those who belong to categories of experience like less than 5 years, 5-10
years and above 10 years. The maximum weighted average score of 4-5 has been obtained
under the category of 5-10 years with a score of 4.98. According to the opinion of this
category of respondent‟s bonus revision is an important factor. Thus, this statement is having
the respondent‟s level of agreeability between agree and strongly agree. In other categories of
experience i.e., less than 5 years and above 10 years the level of agreeability is based on own
judgment of the respondents.
ANOVA: TABLE 3
ASSOCITION BETWEEN GENDER AND OVERALL OPINION ABOUT THE
ATTRITION AND RETENTION MANAGEMENT IN TIMES JOBS.
S.NO FACTORS SUM OF
SQUARES
DF f-
VALUE
p-
VALUE
1 I feel fairly compensated for the
work I do in this organization as
compared to other similar
positions across the IT industry
17.610
1
12.722
.001
2 I know what is expected of me as
an employee in terms of target
quotas and ………..
16.020
1
9.622
.000
3 I have a clear understanding of
how my job performance is
measured
2.143
1
11.429
.002
4 I feel encouraged by my office to
pursue professional development
3.086
1
4.898
.033
5 Your management comes forward
when you are facing with critical
situation
28.810
1
314.286
.000
6 Work- life balance is supported by

AARJSH VOLUME 1, ISSUE 4 (OCTOBER 2012) ISSN : 2278 – 859X
Asian Academic Research Journal of Social Sciences & Humanities
www.asianacademicresearch.org
129
this organization in terms of
…………..
3.810
1 57.143 .000
7 You have opportunities to learn
and grow with this organization
25.260
1
81.592
.000
8 Promoting respect and fair
treatment among all fair treatment
among all the staff is a high
priority of
1.61
1
5.664
.022
9 Communication among staff and
between the top levels is effective
6.943
1
102.857
.000
10 I have a clear sense of the further
direction of this office
12.688
1
19.735
.000
11 Communication among staff in
this office is mostly done through
5.952
1
142.857
.000
12 This office atmosphere is
generally friendly
23.810
1
27.473
.000
13 Morale in this office is high
7.202
1
314.286
.000
14 There is a spirit of co-operation
among staff in this office
37.80
1
29.822
.000
15
This office has policies that are
supportive and clearly articulated
21.038
1
48.456
.000
16 Disciplinary procedures in this office
are consistently enforced.
5.038
1
21.515
.000
17 This office has regular staff meetings to
plan and co-ordinate
2.143
1
28.571
.000
AARJSH VOLUME 1, ISSUE 4 (OCTOBER 2012) ISSN : 2278 – 859X
Asian Academic Research Journal of Social Sciences & Humanities
www.asianacademicresearch.org
130
18 My office leadership has a clear
understanding of the work I do
6.438
1
74.286
.000
19 I receive a constructive feedback about
the quality of my work
1.152
1
2.430
.000
20 I have a positive relationship feedback
about the quality of my work
0.771
1
0.970
.000
21 I have a positive relationship with my
office leadership
1.488
1
20.408
.000
22 I received a thorough orientation to this
office and my job when I started
7.467
1
23.830
.000
23 Conflicts and problems are managed
effectively in this office when they..
3.438
1
4.441
.000
24 Overall this office is run efficiently
23.810
1
142.857
.000
25 This office reasonably accommodates
personal needs
5.952
1
7.519
.000
26 Others in this office trust me to perform
my job
5.952
1
5.928
.000
27 I like my job
3.086
1
7.465
.000
28 My office is one of the best places to
work
4.821
1
45.378
.000
29 I like the people I work with
0.610
1
.009
.000
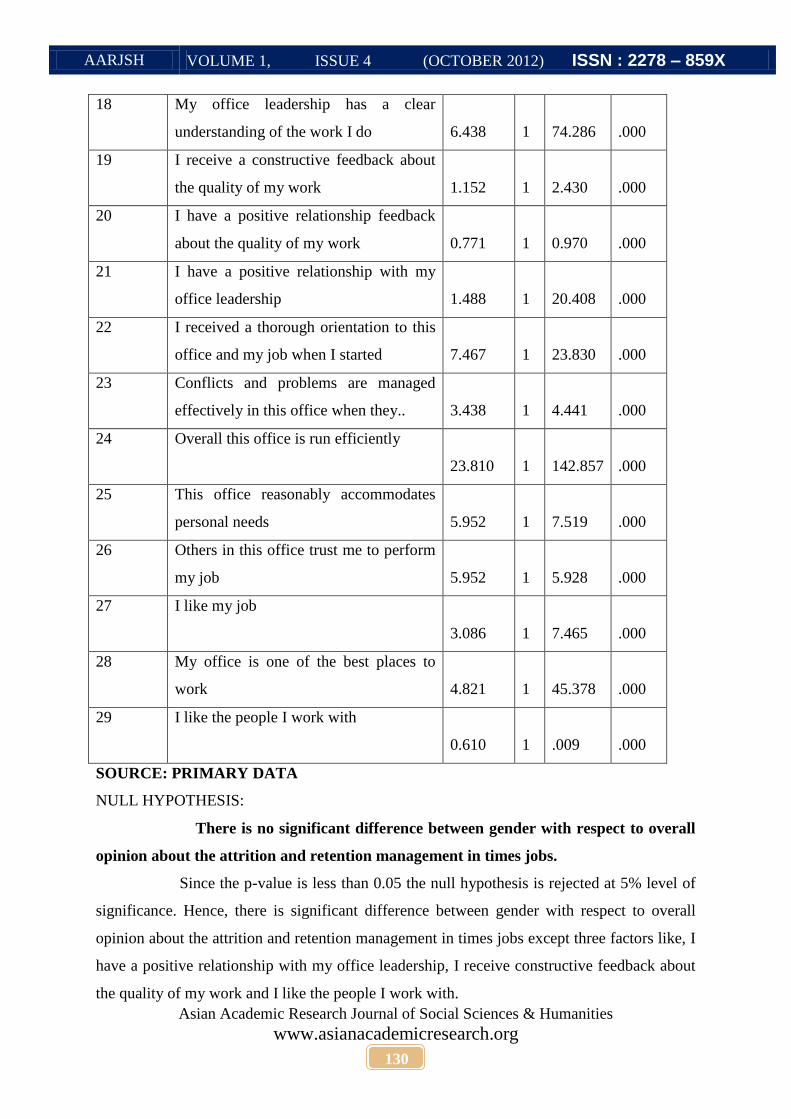
SOURCE: PRIMARY DATA
NULL HYPOTHESIS:
There is no significant difference between gender with respect to overall
opinion about the attrition and retention management in times jobs.
Since the p-value is less than 0.05 the null hypothesis is rejected at 5% level of
significance. Hence, there is significant difference between gender with respect to overall
opinion about the attrition and retention management in times jobs except three factors like, I
have a positive relationship with my office leadership, I receive constructive feedback about
the quality of my work and I like the people I work with.

AARJSH VOLUME 1, ISSUE 4 (OCTOBER 2012) ISSN : 2278 – 859X
Asian Academic Research Journal of Social Sciences & Humanities
www.asianacademicresearch.org
131
TABLE 3.4.3.
ASSOCIATION BETWEEN EXPERIENCE AND OVERALL OPINION ABOUT THE
ATTRITION AND RETENTION MANAGEMENT IN TIMES JOBS
S.NO
FACTORS SUM OF
SQUARES
DF f-VALUE p-
VALUE
1
I feel fairly compensated for
the work I do in this
organization as compared to
other similar positions across
the IT industry
19.735
2
7.228
.002
2
I know what is expected of me
as an employee in terms of
target quotas and ………..
16.652
5.228
.000
3
I have a clear understanding of
how my job performance is
measured
2.401
2
6.467
.004
4 I feel encouraged by my office
to pursue professional
development
3.458
2.716
.079
5 Your management comes
forward when you are facing
with critical situation
26.762
2
91.325
.000
6 Work- life balance is
supported by this organization
in terms of …………..
5.048
2
68.900
.000
7 You have opportunities to
learn and grow with this
organization
28.648
2
62.104
.000
8 Promoting respect and fair
treatment among all fair
treatment among all the staff is
1.804
2
3.148
.054

AARJSH VOLUME 1, ISSUE 4 (OCTOBER 2012) ISSN : 2278 – 859X
Asian Academic Research Journal of Social Sciences & Humanities
www.asianacademicresearch.org
132
a high priority of ………..
9 Communication among staff
and between the top levels is
effective
7.781
2
81.482
.000
10 I have a clear sense of the
further direction of this office
15.663
2
13.431
.000
11 Communication among staff in
this office is mostly done
through email
5.905
2
67.167
.000
12 This office atmosphere is
generally friendly
26.683
2
16.366
.000
13 Morale in this office is high
6.6902
2
91.325
.000
14 There is a spirit of co-
operation among staff in this
office
42.362
2
17.904
.000
15 This office has policies that are
supportive and clearly
articulated
13.449
2
10.509
.000
16 Disciplinary procedures in this
office are consistently
enforced.
5.686
2
12.715
.000
17 This office has regular staff
meetings to plan and co-
ordinate
5.143
2
9.678
.000
18 My office leadership has a
clear understanding of the
work I do
7.215
2
52.310
.000
19 I receive a constructive
feedback about the quality of
13.567
2
40.381
.000
AARJSH VOLUME 1, ISSUE 4 (OCTOBER 2012) ISSN : 2278 – 859X
Asian Academic Research Journal of Social Sciences & Humanities
www.asianacademicresearch.org
133
my work
20 I have a positive relationship
feedback about the quality of
my work
20.361
2
32.517
.000
21 I have a positive relationship
with my office leadership
3.571
2
83.571
.000
22 I received a thorough
orientation to this office and
my job when I started
7.833
2
12.553
.000
23 Conflicts and problems are
managed effectively in this
office when they..
14.996
2
15.066
.000
24 Overall this office is run
efficiently
23.619
2
67.167
.000
25 This office reasonably
accommodates personal needs
8.397
2
5.604
.007
26 Others in this office trust me to
perform my job
6.671
2
3.297
.048
27 I like my job
5.320
2
7.255
.002
28 My office is one of the best
places to work
4.310
2
17.648
.000
29 I like the people I work with
35.970
2
19.214
.000
SOURCE: PRIMARY DATA
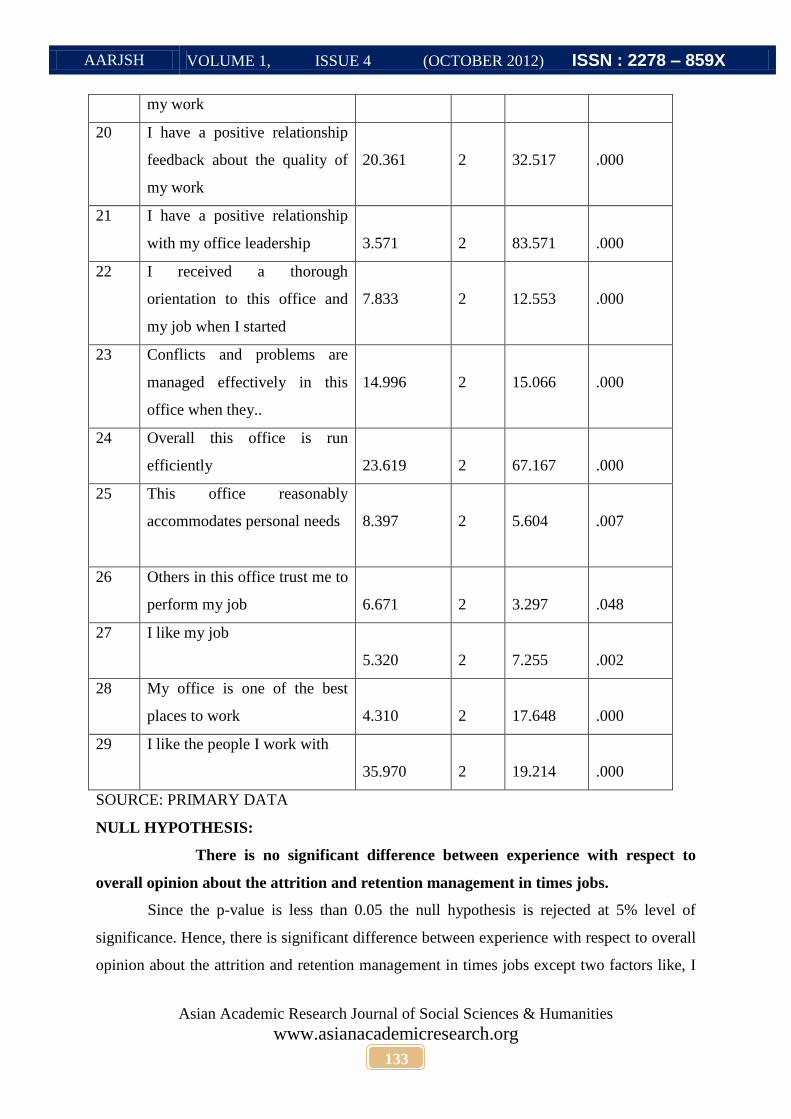
NULL HYPOTHESIS:
There is no significant difference between experience with respect to
overall opinion about the attrition and retention management in times jobs.
Since the p-value is less than 0.05 the null hypothesis is rejected at 5% level of
significance. Hence, there is significant difference between experience with respect to overall
opinion about the attrition and retention management in times jobs except two factors like, I
AARJSH VOLUME 1, ISSUE 4 (OCTOBER 2012) ISSN : 2278 – 859X
Asian Academic Research Journal of Social Sciences & Humanities
www.asianacademicresearch.org
134
feel encouraged by my office to pursue professional development and promoting respect and
fair treatment among all fair treatment among all the staff is a high priority of this office.
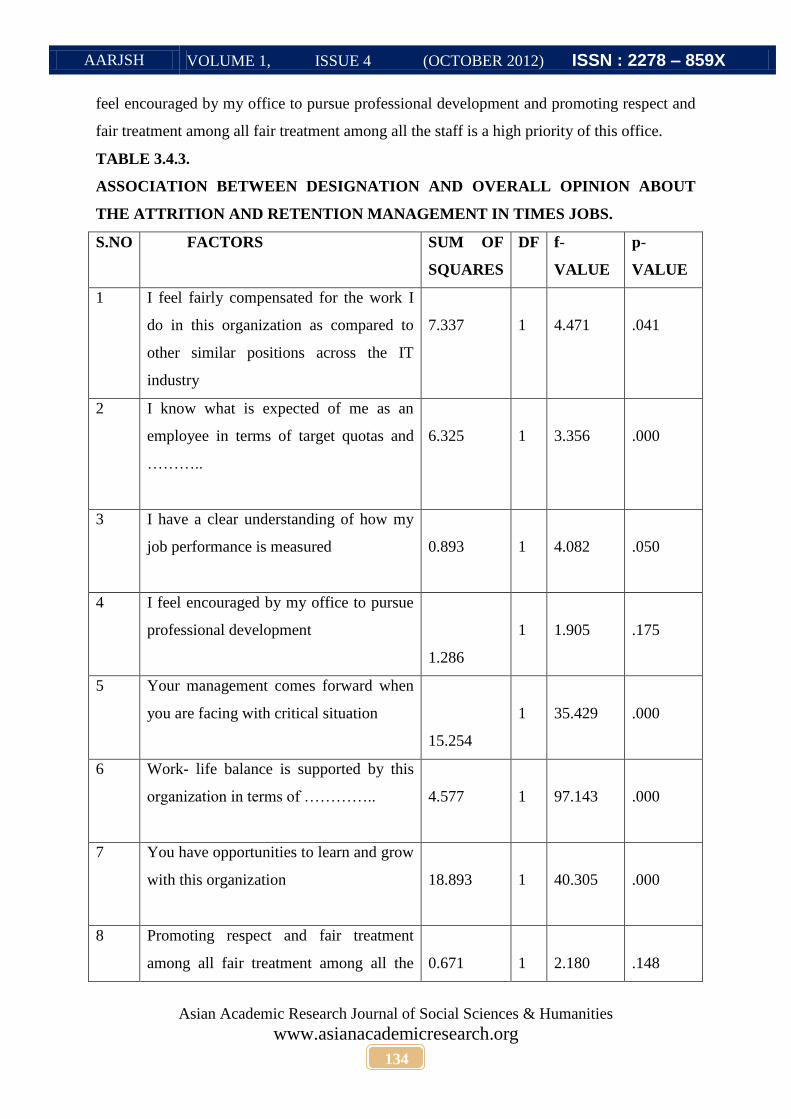
TABLE 3.4.3.
ASSOCIATION BETWEEN DESIGNATION AND OVERALL OPINION ABOUT
THE ATTRITION AND RETENTION MANAGEMENT IN TIMES JOBS.
S.NO FACTORS SUM OF
SQUARES
DF f-
VALUE
p-
VALUE
1
I feel fairly compensated for the work I
do in this organization as compared to
other similar positions across the IT
industry
7.337
1
4.471
.041
2
I know what is expected of me as an
employee in terms of target quotas and
………..
6.325
1
3.356
.000
3
I have a clear understanding of how my
job performance is measured
0.893
1
4.082
.050
4
I feel encouraged by my office to pursue
professional development
1.286
1
1.905
.175
5
Your management comes forward when
you are facing with critical situation
15.254
1
35.429
.000
6
Work- life balance is supported by this
organization in terms of …………..
4.577
1
97.143
.000
7
You have opportunities to learn and grow
with this organization
18.893
1
40.305
.000
8
Promoting respect and fair treatment
among all fair treatment among all the
0.671
1
2.180
.148

AARJSH VOLUME 1, ISSUE 4 (OCTOBER 2012) ISSN : 2278 – 859X
Asian Academic Research Journal of Social Sciences & Humanities
www.asianacademicresearch.org
135
staff is a high priority of ………..
9
Communication among staff and between
the top levels is effective
2.893
1
17.143
.000
10
I have a clear sense of the further
direction of this office
2.683
1
3.004
.091
11
Communication among staff in this
office is mostly done through email
4.063
1
45.714
.000
12
This office atmosphere is generally
friendly
9.921
1
8.173
.007
13
Morale in this office is high
3.813
1
35.429
.000
14
There is a spirit of co-operation among
staff in this office
15.750
1
8.660
.005
15
This office has policies that are
supportive and clearly articulated
8.766
1
11.830
.001
16
Disciplinary procedures in this office are
consistently enforced.
5.433
1
24.219
.000
17
This office has regular staff meetings to
plan and co-ordinate
5.143
1
21.219
.000
18
My office leadership has a clear
understanding of the work I do
2.683
1
14.857
.000
19 I receive a constructive feedback about
AARJSH VOLUME 1, ISSUE 4 (OCTOBER 2012) ISSN : 2278 – 859X
Asian Academic Research Journal of Social Sciences & Humanities
www.asianacademicresearch.org
136
the quality of my work 11.147
1 49.695 .000
20
I have a positive relationship feedback
about the quality of my work
6.349
1
9.685
.003
21
I have a positive relationship with my
office leadership
3.571
1
171.429
.000
22
I received a thorough orientation to this
office and my job when I started
7.000
1
21.538
.000
23
Conflicts and problems are managed
effectively in this office when they..
2.099
1
2.599
.115
24
Overall this office is run efficiently
16.254
1
45.714
.000
25
This office reasonably accommodates
personal needs
8.397
1
11.494
.002
26
Others in this office trust me to perform
my job
2.480
1
2.273
.139
27
I like my job
0.063
1
0.130
.720
28
My office is one of the best places to
work
1.433
1
7.501
.009
29
I like the people I work with
24.143
1
19.980
.000
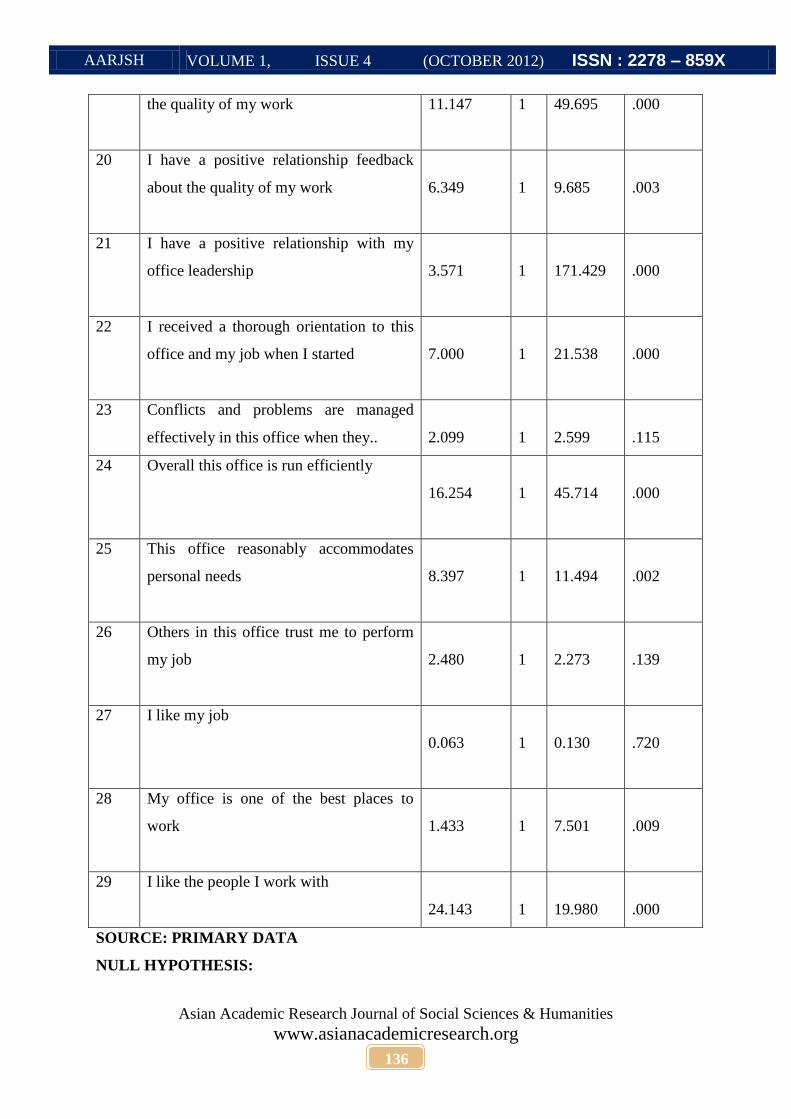
SOURCE: PRIMARY DATA
NULL HYPOTHESIS:

AARJSH VOLUME 1, ISSUE 4 (OCTOBER 2012) ISSN : 2278 – 859X
Asian Academic Research Journal of Social Sciences & Humanities
www.asianacademicresearch.org
137
There is no significant difference between designation with respect to overall
opinion about the attrition and retention management in times jobs.
Since the p- value is less than 0.05 the null hypothesis is rejected at 5% level of
significance. Hence, there is significant difference between designation with respect to
overall opinion about the attrition and retention management in times jobs except five factors
like, I feel encouraged by my office to pursue professional development, promoting respect
and fair treatment among all fair treatment among all the staff is a high priority of this office,
Overall this office is run efficiently, I feel heard when I communicate with others in my
office and I like my job.
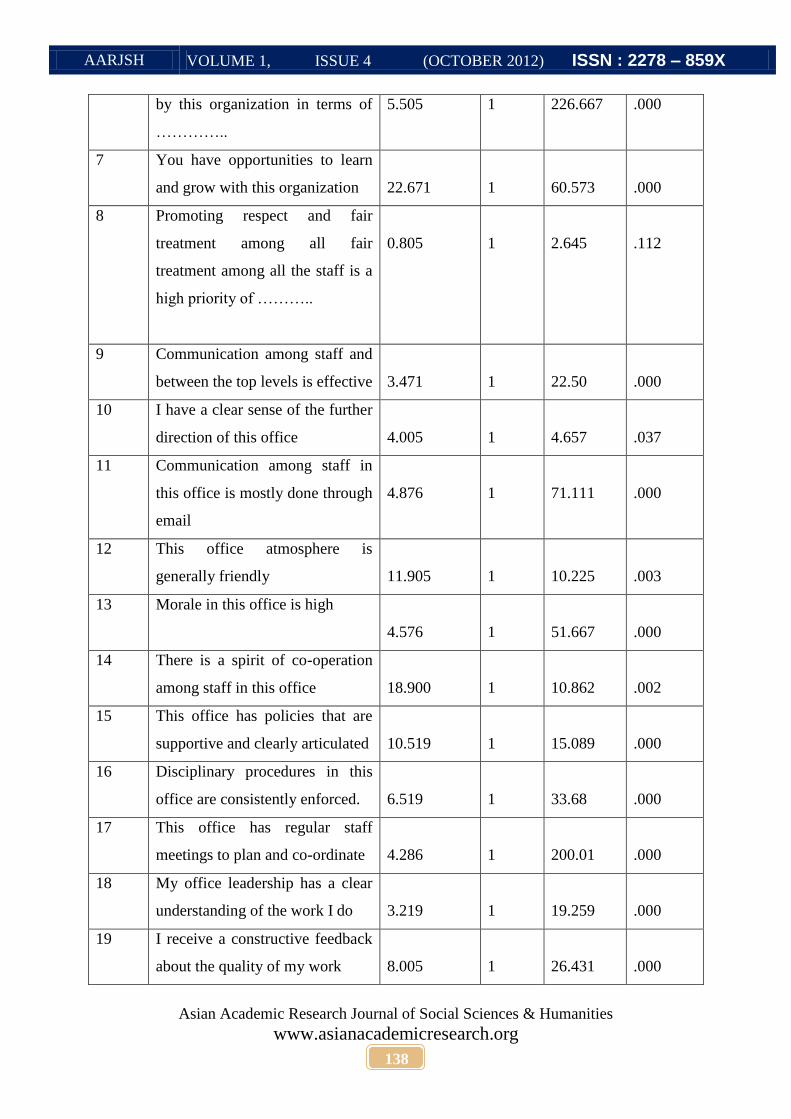
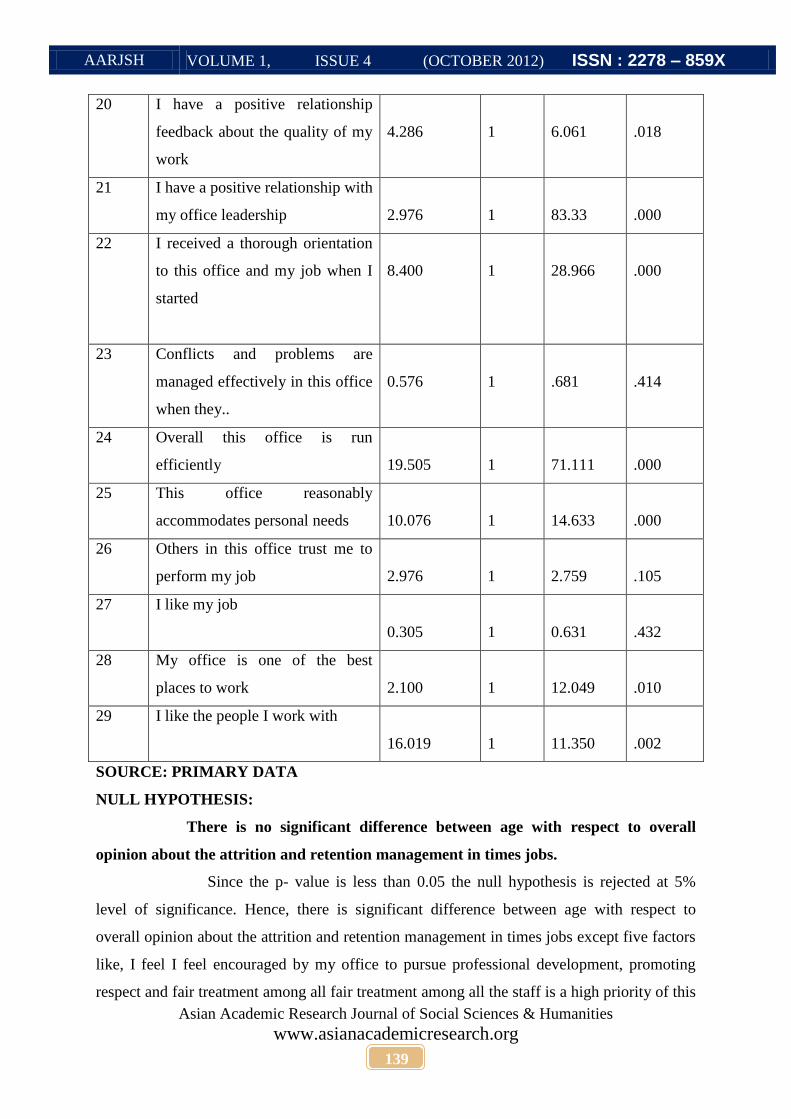
TABLE 3.4.4.
ASSOCIATION BETWEEN AGE AND OVERALL OPINION ABOUT THE
ATTRITION AND RETENTION MANAGEMENT IN TIMES JOBS.
S.NO FACTORS SUM OF
SQUARES
DF f-VALUE p-
VALUE
1 I feel fairly compensated for the
work I do in this organization as
compared to other similar
positions across the IT industry
8.805
1
5.488
.024
2 I know what is expected of me as
an employee in terms of target
quotas and ………..
9.163
1
4.521
.000
3 I have a clear understanding of
how my job performance is
measured
1.071
1
5.000
.031
4 I feel encouraged by my office to
pursue professional development
1.543
1
2.308
.137
5 Your management comes
forward when you are facing with
critical situation
18.305
1
51.667
.000
6 Work- life balance is supported
AARJSH VOLUME 1, ISSUE 4 (OCTOBER 2012) ISSN : 2278 – 859X
Asian Academic Research Journal of Social Sciences & Humanities
www.asianacademicresearch.org
138
by this organization in terms of
…………..
5.505 1 226.667 .000
7 You have opportunities to learn
and grow with this organization
22.671
1
60.573
.000
8 Promoting respect and fair
treatment among all fair
treatment among all the staff is a
high priority of ………..
0.805
1
2.645
.112
9 Communication among staff and
between the top levels is effective
3.471
1
22.50
.000
10 I have a clear sense of the further
direction of this office
4.005
1
4.657
.037
11 Communication among staff in
this office is mostly done through
4.876
1
71.111
.000
12 This office atmosphere is
generally friendly
11.905
1
10.225
.003
13 Morale in this office is high
4.576
1
51.667
.000
14 There is a spirit of co-operation
among staff in this office
18.900
1
10.862
.002
15 This office has policies that are
supportive and clearly articulated
10.519
1
15.089
.000
16 Disciplinary procedures in this
office are consistently enforced.
6.519
1
33.68
.000
17 This office has regular staff
meetings to plan and co-ordinate
4.286
1
200.01
.000
18 My office leadership has a clear
understanding of the work I do
3.219
1
19.259
.000
19 I receive a constructive feedback
about the quality of my work
8.005
1
26.431
.000
AARJSH VOLUME 1, ISSUE 4 (OCTOBER 2012) ISSN : 2278 – 859X
Asian Academic Research Journal of Social Sciences & Humanities
www.asianacademicresearch.org
139
20 I have a positive relationship
feedback about the quality of my
work
4.286
1
6.061
.018
21 I have a positive relationship with
my office leadership
2.976
1
83.33
.000
22 I received a thorough orientation
to this office and my job when I
started
8.400
1
28.966
.000
23 Conflicts and problems are
managed effectively in this office
when they..
0.576
1
.681
.414
24 Overall this office is run
efficiently
19.505
1
71.111
.000
25 This office reasonably
accommodates personal needs
10.076
1
14.633
.000
26 Others in this office trust me to
perform my job
2.976
1
2.759
.105
27 I like my job
0.305
1
0.631
.432
28 My office is one of the best
places to work
2.100
1
12.049
.010
29 I like the people I work with
16.019
1
11.350
.002
SOURCE: PRIMARY DATA
NULL HYPOTHESIS:
There is no significant difference between age with respect to overall
opinion about the attrition and retention management in times jobs.
Since the p- value is less than 0.05 the null hypothesis is rejected at 5%
level of significance. Hence, there is significant difference between age with respect to
overall opinion about the attrition and retention management in times jobs except five factors
like, I feel I feel encouraged by my office to pursue professional development, promoting
respect and fair treatment among all fair treatment among all the staff is a high priority of this

AARJSH VOLUME 1, ISSUE 4 (OCTOBER 2012) ISSN : 2278 – 859X
Asian Academic Research Journal of Social Sciences & Humanities
www.asianacademicresearch.org
140
office, Overall this office is run efficiently, I feel heard when I communicate with others in
my office and I like my job.
FINDINGS, SUGGESTIONS AND CONCLUSION
FINDINGS
This chapter devoted to recapitulate the findings of the study. The project titled “A
Study on Attrition and Retention Management in Times Jobs-TBSL at Bangalore” is based
on primary data. The data required for the study are collected, tabulated and analyzed with
the help of statistical tools such as Chi-Square, ANOVA, and Weighted Average. This study
would help the management to extend monetary & non-monetary benefits and to have a clear
understanding of the expectations of the workers and to improve the Retention curbing
policies and to save cost over recruiting and training new hires.
The study shows that:
Majority (83.3%) of the respondents belong to the age group 26 to 35 years.
Majority (71.43%) of the respondents were Female.
Majority (85.72%) of the respondents were Team Players.
Majority (69.04%) of the respondents were having their experience of below 5
years.
There is significant relationship between age and experience of community in
office.
There is no significant relationship between designation and experience of
community in office.
There is significant relationship between age and my job makes good use of my
skills and abilities.
There is no significant relationship between designation and my job makes
good use of my skills and abilities.
There is significant relationship between age and I have tools and resources to
do my job well.
There is significant relationship between designations and I have tools and
resources to do my job well.

AARJSH VOLUME 1, ISSUE 4 (OCTOBER 2012) ISSN : 2278 – 859X
Asian Academic Research Journal of Social Sciences & Humanities
www.asianacademicresearch.org
141
There is significant relationship between age and I have support and authority
to make decisions necessary for accomplishing.
There is significant relationship between designation and the management
encourages employee feedback to make improvements.
There is significant relationship between age and I understand how my work
contributes to the company‟s overall goals and strategies.
There is significant relationship between designation and I understand how my
work contributes to the company‟s overall goals and strategies.
There is significant relationship between age and work assignments are
distributed fairly/equitably.
There is significant relationship between designation and work assignments are
distributed fairly/equitably.
There is significant relationship between age and I feel I am a valued part of
this organization.
There is significant relationship between designation and I feel I am a valued
part of this organization.
There is significant relationship between age and my workload and expected
completion times are reasonable.
There is significant relationship between designation and my workload and
expected completion times are reasonable.
It has been observed that from the table (3.3.1) the respondents those who
belong to two category of designation, one is team player and the other is team leader,
The maximum weighted average score of 4-5 has been obtained under the category of
team player and team leader, with the score of 5.00. According to the opinion of this
category of respondents, entertainment facility and bonus revision are important
factors. Thus, this statement is having the respondent‟s level of agreeability between
agree and strongly agree. In other statements are judged based on the respondent‟s
level of agreeability.
It has been inferred from the table (3.3.1) the weighted average score of range
4-5 has been obtained under the male category with a maximum score of 5.00.
According to the opinion of this category of respondents, the salary hiking priority of
this office is good was the main factor. The level of agreeability ranges mainly

AARJSH VOLUME 1, ISSUE 4 (OCTOBER 2012) ISSN : 2278 – 859X
Asian Academic Research Journal of Social Sciences & Humanities
www.asianacademicresearch.org
142
between agree and strongly agree. For the others, factors are judged based on the
respondent‟s level of agreeability.
The respondent‟s belong to age group of below 25 years to above 45 years.
From the table, it is observed that the maximum weighted average score of 4-5 has
been obtained under the category of 25-35 years with a score of 5.00.thus, according
to the opinion of this category of respondents, entertainment facility provided by the
office is an important factor. Thus, this statement is having the respondent‟s level of
agreeability between agree and strongly agree. In other categories of age group, the
level of agreeability for the same statement is between neutral and agree with the
weighted average score of 3-4.
The respondents have been categorized of under graduate and professionals.
The maximum weighted average score of 4-5 has been obtained by the post graduates,
with a score of 4.98. According to the opinion of this category of respondents,
entertainment facility provided by the office is an important factor. Thus, this
statement is having the respondent‟s level of agreeability between agree and strongly
agree. In the other categories of educational status, the level of agreeability are based
on own judgments of the respondents.
The respondents those who belong to categories of experience like less than 5
years , 5-10 years and above 10 years. The maximum weighted average score of 4-5
has been obtained under the category of 5-10 years with a score of 4.98. According to
the opinion of this category of respondents, bonus revision is an important factor.
Thus, this statement is having the respondent‟s level of agreeability between agree
and strongly agree. In other categories of experience i.e., less than 5 years and above
10 years of agreeability is based on own judgment of the respondents.
There is significance difference gender with respect to overall opinion about
the attrition and retention management in times jobs except three factors like, I have a
positive relationship with my office leadership, I receive constructive feedback about
the quality of my work and I like the people I work with.
There is significant difference between experience with respect to overall
opinion about the attrition and retention management in times jobs except two factors
like, I feel encouraged by my office to pursue professional development, promoting
respect and fair treatment among all fair treatment among all the staff is a high
AARJSH VOLUME 1, ISSUE 4 (OCTOBER 2012) ISSN : 2278 – 859X
Asian Academic Research Journal of Social Sciences & Humanities
www.asianacademicresearch.org
143
priority of this office, Overall this office is run efficiently, I feel heard when I
communicate with others in my office and I like my job.
There is significant difference between age with respect to overall opinion
about the attrition and retention management in times jobs except five factors like, I
feel encouraged by my office to pursue professional development, Promoting respect
and fair treatment among all fair treatment among all the staff is a high priority of this
office, Overall this office is run efficiently, I feel heard when I communicate with
others in my office and I like my job.
SUGGESTIONS
It is recommended that organizations should concentrate on the above
mentioned findings before moulding their best practices to counter
attrition, this will ensure that the step taken is effective and efficient
to fight the exodus. The company should remember, treatment is
given for causes and not symptoms.
If the company has to conduct an exit interview, it is far better to get a
neutral third party to conduct them. This might help them to improve
the reliability of exit interviews.
It is advisable to conduct exit interviews after a period of 3-6 months.
The information is more difficult to obtain but may be more reliable
as the references factor is less significant
Today‟s HR jobs are confined to recruitment and salary calculation.
The enormous growth in the strength of work force has made one to
one interaction between HR and employee practically impossible. But
it will be wise to get in touch with the team leaders and get a weekly
or bi-weekly update on performers and non- performers in a team.
Find time to spare for having a word with the non- performers.
„Offer‟ them assistance in the form of training. Forcing them to take
training might hurt their morale making idea backfire.
It has come to our notice that often HR managers tend to „lose‟
patience with some non performers and eventually end up in firing
that employee. It is advisable to seek the help of a psychologist or a
AARJSH VOLUME 1, ISSUE 4 (OCTOBER 2012) ISSN : 2278 – 859X
Asian Academic Research Journal of Social Sciences & Humanities
www.asianacademicresearch.org
144
councilor to effectively handle such issues- to find out the underlying
reasons- than the HR managers to handle it by themselves.
Rewards and recognition alone can‟t help in fighting the attrition. It
should be properly backed by good career guidance and career
counseling. It is sad to notice that many employees are still not fully
aware of their growth potential.
Finally to end with, something for the industry to practice: the most
important countermove (against attrition) would be to promote close
bonding (as in a club) amongst HR personnel in the industry in a
given city. Insisting on „ reliving‟ letters, mutual respect for an
„industry- agreed relieving period‟ and bilateral „ no- poach policies‟
are the steps that has to be taken, if at all something can be done.
Another strategy to defend attrition could be to persuade companies
not to entertain people who come with less than a year of productive
employment with their previous employer
CONCLUSION
It is interesting to see that most of the company‟s best practices remain as
just practices because of the simple fact that those are not designed in accordance with their
employee‟s real needs. They are designed keeping in mind some general reasons. No
retention specialist would dream of telling you what your employee‟s value. The million
dollar question is “whether to find a new employee or to retain the old in kitty?” it is found
that an organization has to spend 6 times more for replacing a lost employee. It is high time
that HR managers, team leaders and other top notch officials‟ wake up to this reality. In the
world of globalization and cut-throat competition battles cannot be lost for the want of a nail.
BIBLIOGRAPHY
BOOKS
Keith Davies, “Human Behaviour at Work” Tata McGraw Hill Book Company,
New Delhi ,1985.

AARJSH VOLUME 1, ISSUE 4 (OCTOBER 2012) ISSN : 2278 – 859X
Asian Academic Research Journal of Social Sciences & Humanities
www.asianacademicresearch.org
145
Kothari, C.R., “Research Methodology- Methods and Techniques”, Vikas
Publishing House pvt. Ltd., New Delhi, 1978.
Roa V.S.P. “Human Resource Management”, Anurag Jain Publication, New Delhi,
2005.
Uday Pareek,” Human Resource System”
Gary Dazler, “Human Resource Management” Prentice Hall India, New Delhi,
2005.
Websites
www.citehr.com
www.managementparadise.com