asia oil price analysis 5 formula price of arabian light crude...
TRANSCRIPT
IEEJ: September 2002
1
Asia Oil Price Analysis 5: Formula Price of Arabian Light Crude
(ALC) and Netback Value of ALC Based on Oil Product Market Prices
Yoshiki Ogawa, Ph. D.
General Manager, the Second Research Department
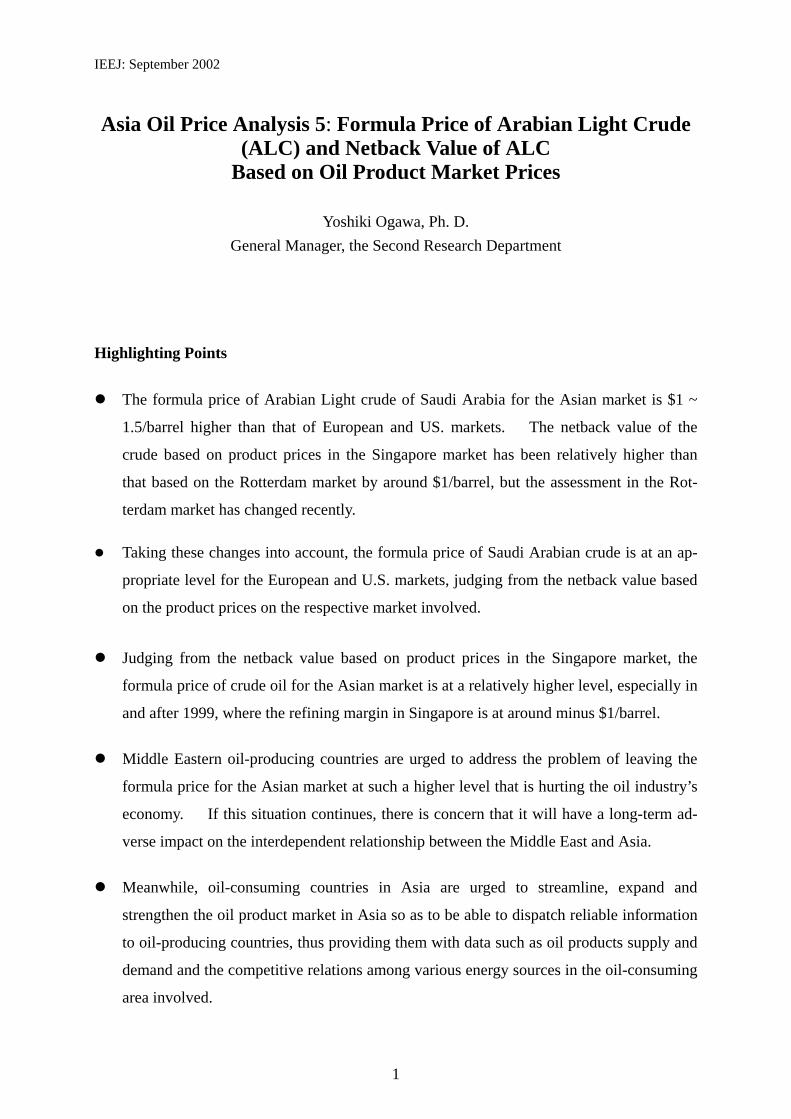
Highlighting Points
The formula price of Arabian Light crude of Saudi Arabia for the Asian market is $1 ~
1.5/barrel higher than that of European and US. markets. The netback value of the
crude based on product prices in the Singapore market has been relatively higher than
that based on the Rotterdam market by around $1/barrel, but the assessment in the Rot-
terdam market has changed recently. Taking these changes into account, the formula price of Saudi Arabian crude is at an ap-
propriate level for the European and U.S. markets, judging from the netback value based
on the product prices on the respective market involved.
Judging from the netback value based on product prices in the Singapore market, the
formula price of crude oil for the Asian market is at a relatively higher level, especially in
and after 1999, where the refining margin in Singapore is at around minus $1/barrel.
Middle Eastern oil-producing countries are urged to address the problem of leaving the
formula price for the Asian market at such a higher level that is hurting the oil industry’s
economy. If this situation continues, there is concern that it will have a long-term ad-
verse impact on the interdependent relationship between the Middle East and Asia.
Meanwhile, oil-consuming countries in Asia are urged to streamline, expand and
strengthen the oil product market in Asia so as to be able to dispatch reliable information
to oil-producing countries, thus providing them with data such as oil products supply and
demand and the competitive relations among various energy sources in the oil-consuming
area involved.
IEEJ: September 2002
2
Introduction
In and after the second half of 1987, the oil-producing countries adopted a formula
method for determining the selling price of crude oil produced in their countries, under which
respective marker crude oils were selected for consuming areas such as the U.S., Europe and
Asia so that the crude oil selling price could be determined in reference to the market price of
the marker crude concerned. Under the method, the formula price of the same crude can be
different since it is determined in reference to different marker crude oils. How are these
formula prices assessed when oil product market conditions for each consuming area are
taken into account? With this question in mind, the formula price of Arabian Light crude
of Saudi Arabia, a representative Middle Eastern crude, is compared with the netback value of
Arabian Light crude, assessed on the basis of oil product market prices. Three oil product
markets -- the U.S. Gulf, Rotterdam and Singapore -- are selected as they represent the three
major oil consuming areas of the U.S., Europe and Asia.
1. Formula Price of Arabian Light Crude and its Netback Value
(1) Relatively Higher Formula Price for the Asian Market
Saudi Arabia, a major oil-producing country, ships crude oil to Europe, the U.S. and Asia
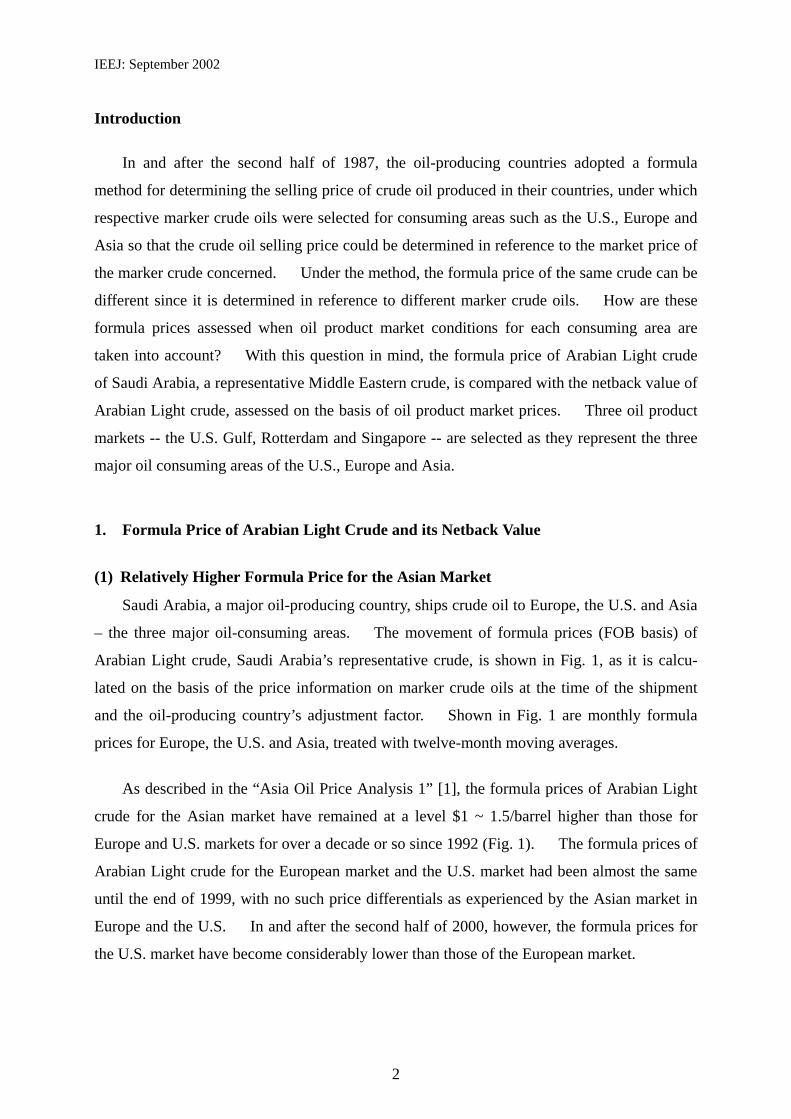
– the three major oil-consuming areas. The movement of formula prices (FOB basis) of
Arabian Light crude, Saudi Arabia’s representative crude, is shown in Fig. 1, as it is calcu-
lated on the basis of the price information on marker crude oils at the time of the shipment
and the oil-producing country’s adjustment factor. Shown in Fig. 1 are monthly formula
prices for Europe, the U.S. and Asia, treated with twelve-month moving averages.
As described in the “Asia Oil Price Analysis 1” [1], the formula prices of Arabian Light
crude for the Asian market have remained at a level $1 ~ 1.5/barrel higher than those for
Europe and U.S. markets for over a decade or so since 1992 (Fig. 1). The formula prices of
Arabian Light crude for the European market and the U.S. market had been almost the same
until the end of 1999, with no such price differentials as experienced by the Asian market in
Europe and the U.S. In and after the second half of 2000, however, the formula prices for
the U.S. market have become considerably lower than those of the European market.
IEEJ: September 2002
3
(Note) FOB prices of Arabian Light crude are calculated on the basis of the price information on marker crude
oils as of the timing of crude oil shipment and according to the formula. (Source) Calculated on the basis of daily spot crude oil price data and according to the formula.
Fig. 1 Comparison of Formula Prices of Arabian Light Crude for Three Major Consuming Areas (FOB Basis as of Timing of Shipment)
(Twelve-month moving averages) (2) Netback Value of Arabian Light Crude Based on Oil Product Market Prices
As noted above, the formula prices of Arabian Light crude for the Asian market have
constantly remained at a level higher than those of the European and U.S. markets over a long
period in the past. How then has Arabian Light crude been assessed, when based on the oil
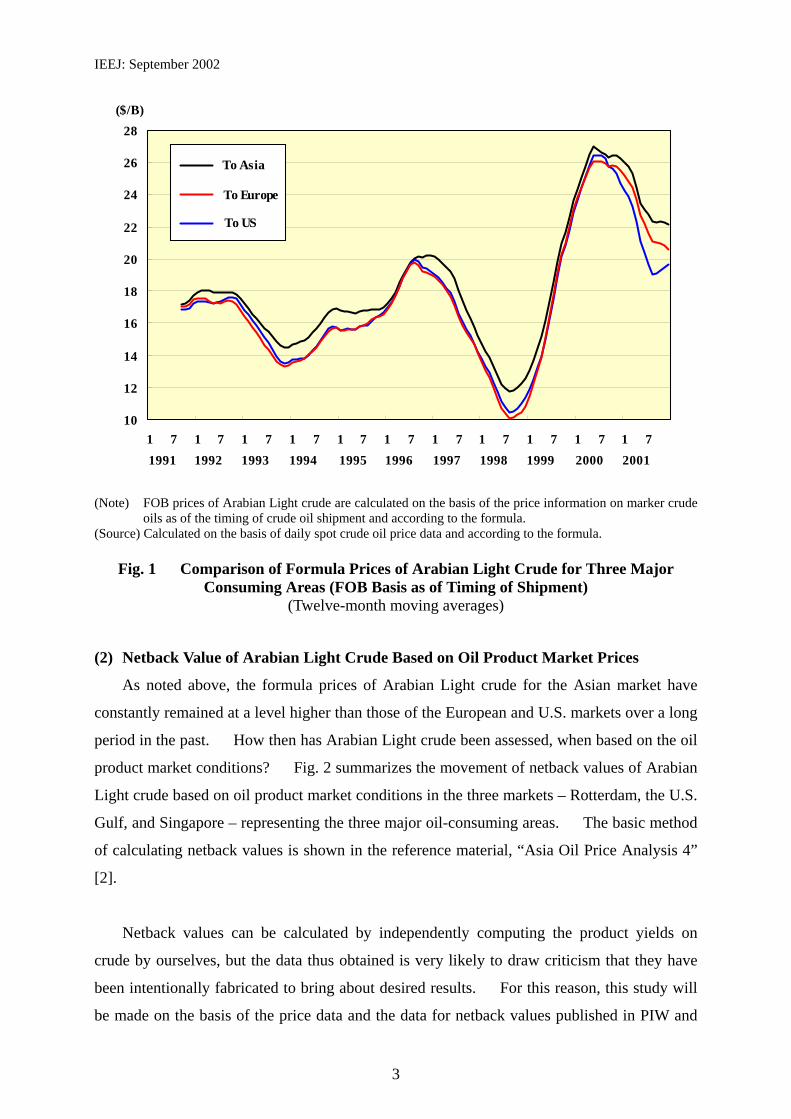
product market conditions? Fig. 2 summarizes the movement of netback values of Arabian
Light crude based on oil product market conditions in the three markets – Rotterdam, the U.S.
Gulf, and Singapore – representing the three major oil-consuming areas. The basic method
of calculating netback values is shown in the reference material, “Asia Oil Price Analysis 4”
[2].
Netback values can be calculated by independently computing the product yields on
crude by ourselves, but the data thus obtained is very likely to draw criticism that they have
been intentionally fabricated to bring about desired results. For this reason, this study will
be made on the basis of the price data and the data for netback values published in PIW and
10
12
14
16
18
20
22
24
26
28
1 7 1 7 1 7 1 7 1 7 1 7 1 7 1 7 1 7 1 7 1 71991 200019991998199719961995199419931992 2001
To Asia
To Europe
To US
($/B)
IEEJ: September 2002
4
oil market intelligence [3], which has enjoyed an established reputation for years, after they
were processed for use in our study.
(Source) Prepared by processing the data published in “Oil Market Intelligence.”
Fig. 2 Comparison of Netback Values of Arabian Light Crude Based on Oil
Product Prices In Three Major Oil-Consuming Markets (Twelve-month moving averages)
As shown in Fig. 2, the netback values of Arabian Light crude based on product prices in
the Singapore market in Asia had been relatively higher than those in the U.S. Gulf and Rot-
terdam markets until 1996. This means that oil product prices in the Singapore market
were higher in general than those in Europe and US. markets during that period (See the
“Asia Oil Price Analysis 3” [4]). Unlike the movement of the formula prices until 1996,
the netback values in the U.S. Gulf market were higher than those in the Rotterdam market.
In 1996, there was a phase in which the netback values in the U.S. Gulf market almost identi-
cal to those in the Singapore market.
Compared with the movement of the formula prices (Fig. 1), the movement of the net-
back values show a large disparity in and after 2000. One notable characteristic is the fact
10
12
14
16
18
20
22
24
26
28
1 7 1 7 1 7 1 7 1 7 1 7 1 7 1 7 1 7 1 7 1 71991 200019991998199719961995199419931992 2001
Singapore Market
Rotterdam Market
US Gulf Market
($/B)
IEEJ: September 2002
5
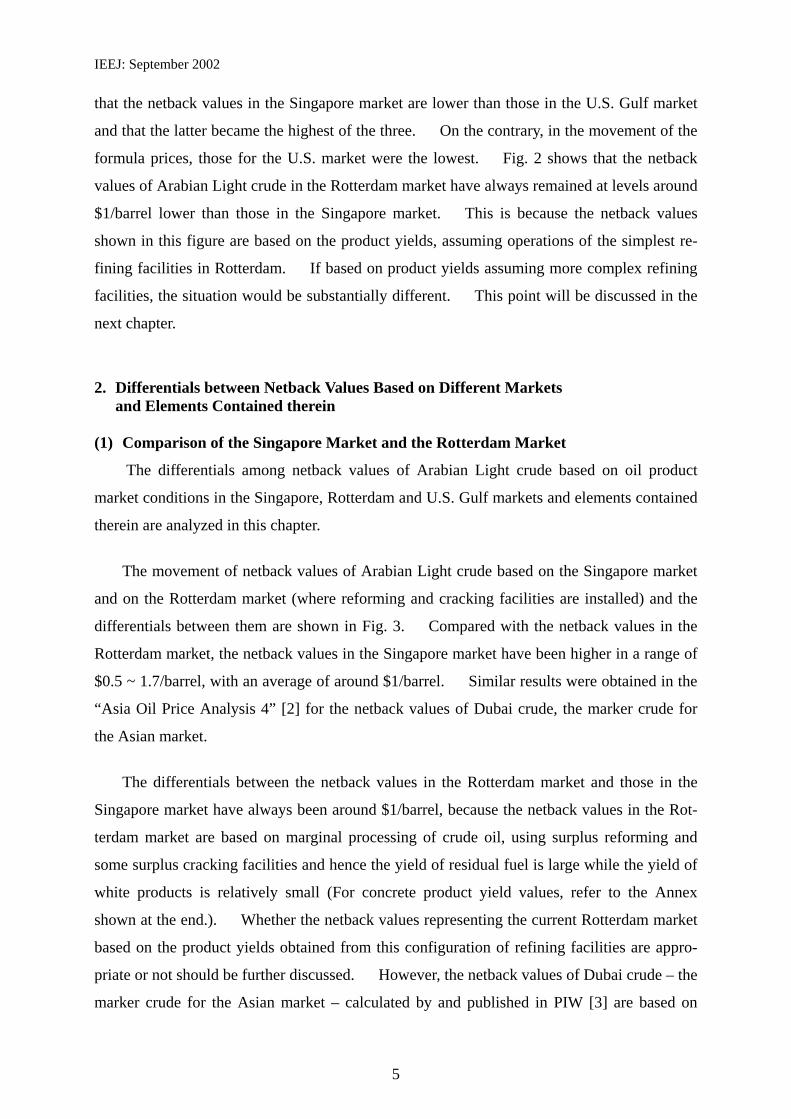
that the netback values in the Singapore market are lower than those in the U.S. Gulf market
and that the latter became the highest of the three. On the contrary, in the movement of the
formula prices, those for the U.S. market were the lowest. Fig. 2 shows that the netback
values of Arabian Light crude in the Rotterdam market have always remained at levels around
$1/barrel lower than those in the Singapore market. This is because the netback values
shown in this figure are based on the product yields, assuming operations of the simplest re-
fining facilities in Rotterdam. If based on product yields assuming more complex refining
facilities, the situation would be substantially different. This point will be discussed in the
next chapter.
2. Differentials between Netback Values Based on Different Markets and Elements Contained therein (1) Comparison of the Singapore Market and the Rotterdam Market
The differentials among netback values of Arabian Light crude based on oil product
market conditions in the Singapore, Rotterdam and U.S. Gulf markets and elements contained
therein are analyzed in this chapter.
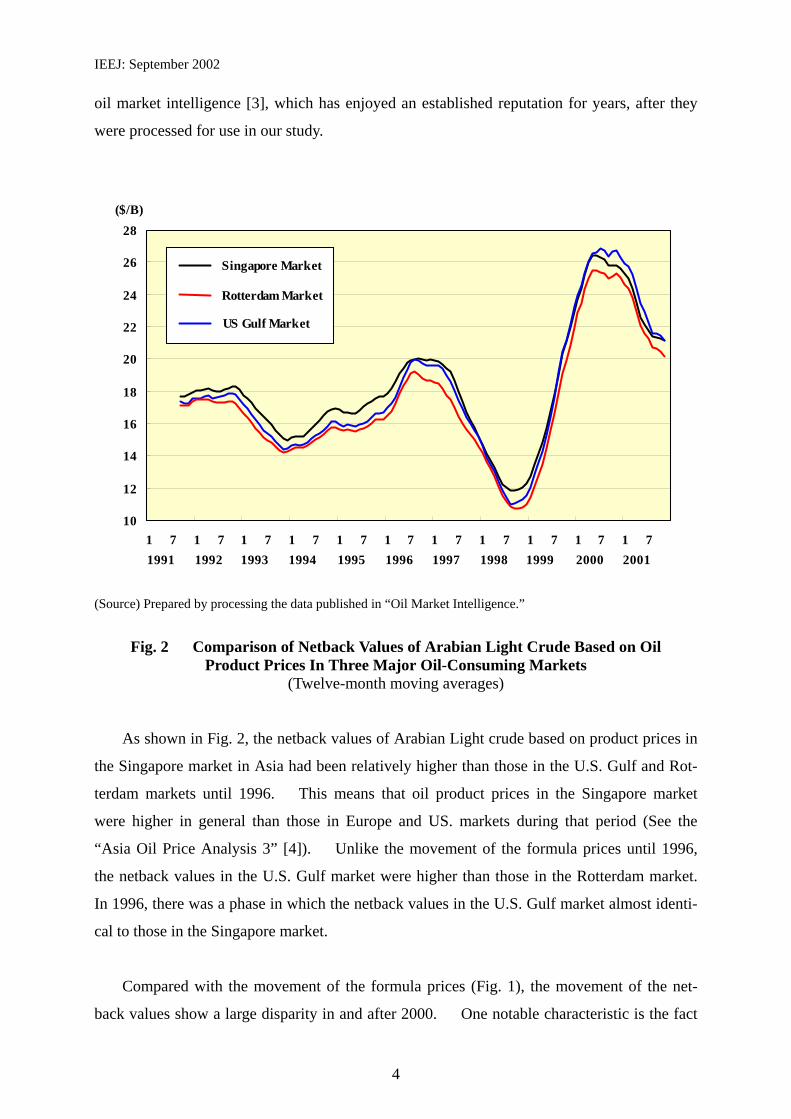
The movement of netback values of Arabian Light crude based on the Singapore market
and on the Rotterdam market (where reforming and cracking facilities are installed) and the
differentials between them are shown in Fig. 3. Compared with the netback values in the
Rotterdam market, the netback values in the Singapore market have been higher in a range of
$0.5 ~ 1.7/barrel, with an average of around $1/barrel. Similar results were obtained in the
“Asia Oil Price Analysis 4” [2] for the netback values of Dubai crude, the marker crude for
the Asian market.
The differentials between the netback values in the Rotterdam market and those in the
Singapore market have always been around $1/barrel, because the netback values in the Rot-
terdam market are based on marginal processing of crude oil, using surplus reforming and
some surplus cracking facilities and hence the yield of residual fuel is large while the yield of
white products is relatively small (For concrete product yield values, refer to the Annex
shown at the end.). Whether the netback values representing the current Rotterdam market
based on the product yields obtained from this configuration of refining facilities are appro-
priate or not should be further discussed. However, the netback values of Dubai crude – the
marker crude for the Asian market – calculated by and published in PIW [3] are based on

IEEJ: September 2002
6
these product yields alone.
(Source) Prepared by processing the data published in “Oil Market Intelligence.” Fig. 3 Movement of Netback Values in Singapore and Rotterdam Markets (Equipped
with Reforming and Cracking Facilities) and Differentials between Them (Twelve-month moving averages)
Before showing the comparison with the netback values based on different product yields,
the elements that constituted these differentials of netback values between the Singapore and
Rotterdam markets are analyzed below. The method of analyzing elements which consti-
tuted the differentials of netback values is outlined in the Annex shown at the end of this re-
port. For the analysis of elements, the data on product yields on Arabian Light crude in
each market assumed for calculation of the netback values are necessary, while the data pub-
lished in PIW are also summarized in the reference material. As previously noted, in an
attempt to avoid criticism that assumptions are arbitrarily made to obtain the desired results,
discussions will be carried on based on the results obtained from the product yields and the
price data published in PIW.
Fig. 4 shows the results of the analysis of elements which constituted the differentials of
-2.5
-2.0
-1.5
-1.0
-0.5
0.0
0.5
1.0
1.5
2.0
2.5
1 7 1 7 1 7 1 7 1 7 1 7 1 7 1 7 1 7 1 7 1 710
12
14
16
18
20
22
24
26
28
30
1991 2001200019991998199719961995199419931992
($/B) ($/B)
Singapore MarketRotterdam Market
Singapore- Rotterdam
IEEJ: September 2002
7
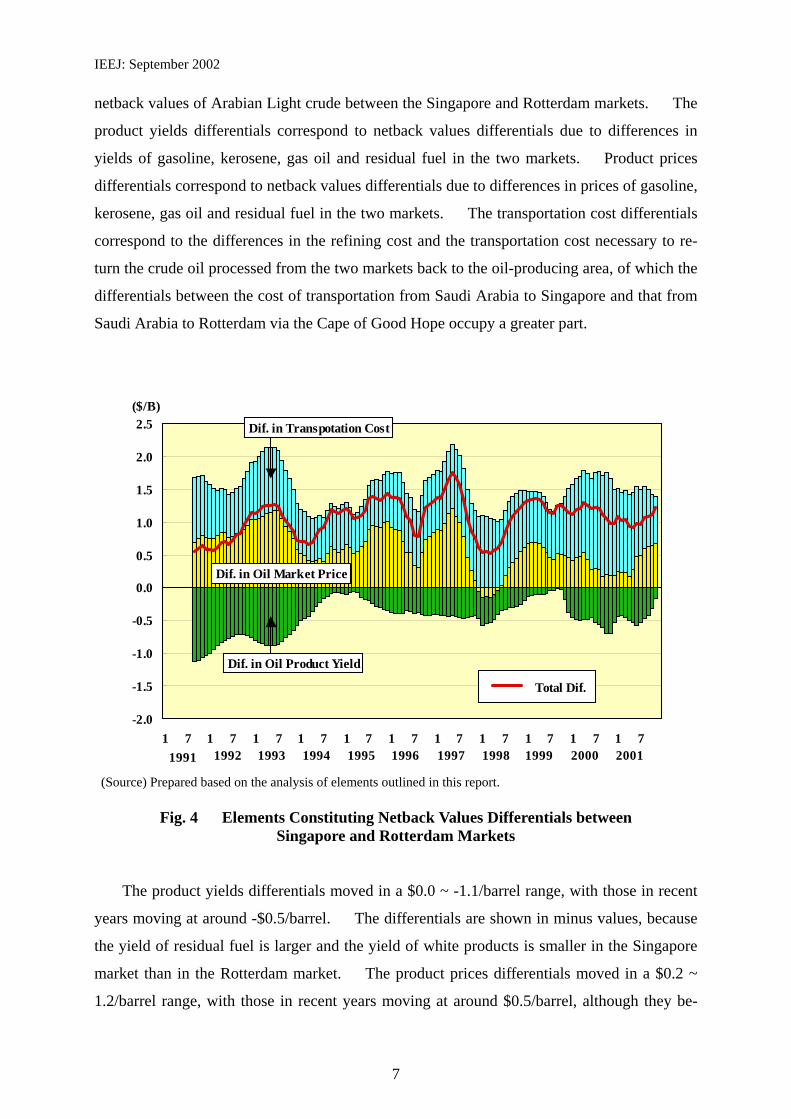
netback values of Arabian Light crude between the Singapore and Rotterdam markets. The
product yields differentials correspond to netback values differentials due to differences in
yields of gasoline, kerosene, gas oil and residual fuel in the two markets. Product prices
differentials correspond to netback values differentials due to differences in prices of gasoline,
kerosene, gas oil and residual fuel in the two markets. The transportation cost differentials
correspond to the differences in the refining cost and the transportation cost necessary to re-
turn the crude oil processed from the two markets back to the oil-producing area, of which the
differentials between the cost of transportation from Saudi Arabia to Singapore and that from
Saudi Arabia to Rotterdam via the Cape of Good Hope occupy a greater part.
(Source) Prepared based on the analysis of elements outlined in this report.
Fig. 4 Elements Constituting Netback Values Differentials between Singapore and Rotterdam Markets
The product yields differentials moved in a $0.0 ~ -1.1/barrel range, with those in recent
years moving at around -$0.5/barrel. The differentials are shown in minus values, because
the yield of residual fuel is larger and the yield of white products is smaller in the Singapore
market than in the Rotterdam market. The product prices differentials moved in a $0.2 ~
1.2/barrel range, with those in recent years moving at around $0.5/barrel, although they be-
-2.0
-1.5
-1.0
-0.5
0.0
0.5
1.0
1.5
2.0
2.5
1 7 1 7 1 7 1 7 1 7 1 7 1 7 1 7 1 7 1 7 1 71991 2001200019991998199719961995199419931992
($/B)
Dif. in Oil Product Yield
Dif. in Oil Market Price
Dif. in Transpotation Cost
Total Dif.
IEEJ: September 2002
8
came minus figures temporarily. On a total products basis, product prices in the Singapore
market had been higher than those in the Rotterdam market until the first half of 1997 (see the
“Asia Oil Price Analysis 3” [4]), which was a reason why the differentials were plus figures.
Especially, the relatively higher prices of residual fuel greatly contributed to this. In the
wake of the Asian economic crisis in 1997, however, sluggish oil demand and surplus refining
capacities wiped out the sense of relatively higher-priced white products (see the “Asia Oil
Price Analysis 3” [4]), thereby squeezing plus differentials.
Roughly speaking, the minus product yields differentials and the plus product prices dif-
ferentials offset each other. As a result, the netback value differentials between the Singa-
pore and Rotterdam markets are represented primarily by the differential transportation cost
from Saudi Arabia.
When the netback values in the Rotterdam market (with reforming and cracking facili-
ties) based on product yields assuming marginal processing of crude oil, using surplus re-
forming and some surplus cracking facilities, are used, appear large differentials always be-
tween the Rotterdam and Singapore markets. Against the this case, when the netback val-
ues in the Rotterdam market (equipped with heavy cracking facilities) based on product yields
assuming marginal processing of crude oil, using more surplus cracking facilities, on the basis
of which PIW calculated, are compared with the netback values in the Singapore market and
the differentials between the two netback values are shown in Fig. 5.
In this case, the netback values differentials between Singapore and Rotterdam markets
moved mostly in a $0.0 ~ 0.6/barrel range, but turned to a minus range of $0.0 ~ -0.6/barrel in
and after 2000. Either way, the netback values in the Rotterdam market (equipped with
heavy cracking facilities) and those in the Singapore market moved in an almost similar
manner and the differentials between them become much narrower. Which netback values
should be regarded as representative of the Rotterdam market will be discussed further at the
end of this report.

IEEJ: September 2002
9
(Source) Prepared by processing the data published in “Oil Market Intelligence.” Fig. 5 Movement of Netback Values in Singapore and Rotterdam Markets (Equipped
with Heavy Cracking Facilities) and Differentials between Them (Twelve-month moving averages)
(2) Comparison of the U.S. Gulf Market and the Rotterdam Market
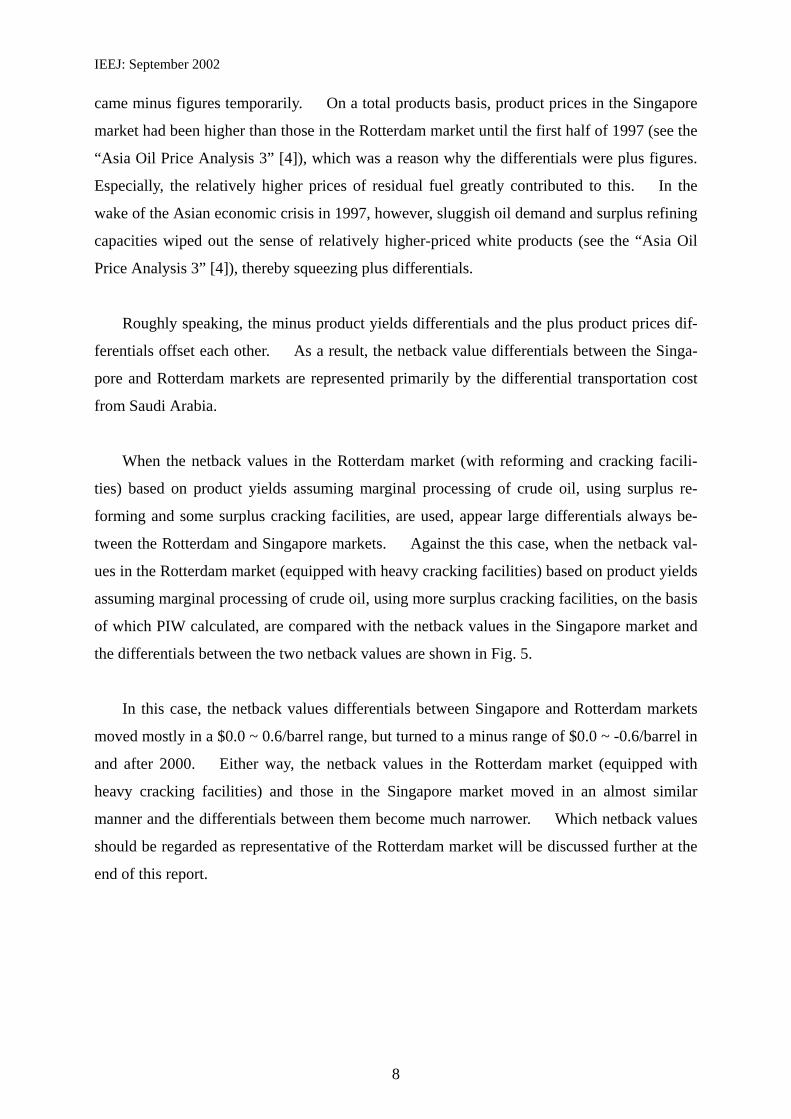
Next, the movement of the netback values of Arabian Light crude based on the U.S. Gulf
market and on the Rotterdam market (equipped with reforming and cracking facilities) and
the differentials between them are shown in Fig. 6. Compared with the Rotterdam market,
the netback values in the U.S. Gulf market remained stable at levels $0.2 ~ 0.5/barrel higher
until 1995, while the differentials widened greatly to $0.5 ~ 1.2/barrel during the period 1996
~ 1997 and further to $0.5 ~ 1.9/barrel in and after 1999. Especially in and after the second
half of 1999, the differentials continued to remain at high levels of around $1.5/barrel as a re-
sult of the sharp increase in oil product prices primarily in the U.S. market.
As was the case with the Singapore market, the netback values in the U.S. Gulf market
moved at a level higher than those in the Rotterdam market (equipped with reforming and
cracking facilities), with the differentials usually moving at around $0.5/barrel. In and after
2000, as the oil products inventories fell to extraordinarily low levels and shortages in refin-
-2.5
-2.0
-1.5
-1.0
-0.5
0.0
0.5
1.0
1.5
2.0
2.5
1 7 1 7 1 7 1 7 1 7 1 7 1 7 1 7 1 7 1 7 1 710
12
14
16
18
20
22
24
26
28
30
1991 2001200019991998199719961995199419931992
($/B) ($/B)
SingaporeRotterdam
Singapore- Rotterdam
IEEJ: September 2002
10
ing capacities triggered a sharp increase in oil product prices primarily in the U.S. market, the
netback values in the U.S. Gulf market further increased. During the period from 1996 into
1997, a similar phenomenon was witnessed due to a sharp fall in commercial oil products in-
ventories.
(Source) Prepared by processing the data published in “Oil Market Intelligence.”
Fig. 6 Movement of Netback Values in U.S. Gulf and Rotterdam Markets (with Reforming and Cracking Facilities) and Differentials between Them
(Twelve-month moving averages) The results of analysis of elements constituting the differentials in netback values of Ara-
bian Light crude between the U.S. Gulf market and the Rotterdam market are summarized in
Fig. 7. The product yield differentials moved in a $0.3 ~ 1.5/barrel range. These plus
figures are attributed to a very high yield of gasoline and a low yield of residual fuel in the
U.S. Gulf market (see Annex shown in the end). As the yield of gasoline is high at around
50 percent in the U.S. Gulf market, the product yield differentials widen when gasoline prices
increase sharply. The product yield differentials also widen, when the price differential
between white products and residual fuel widens.
-2.5
-2.0
-1.5
-1.0
-0.5
0.0
0.5
1.0
1.5
2.0
2.5
1 7 1 7 1 7 1 7 1 7 1 7 1 7 1 7 1 7 1 7 1 710
12
14
16
18
20
22
24
26
28
30
1991 2001200019991998199719961995199419931992
($/B)
US GulfRotterdam
($/B)
US Gulf - Rotterdam
IEEJ: September 2002
11
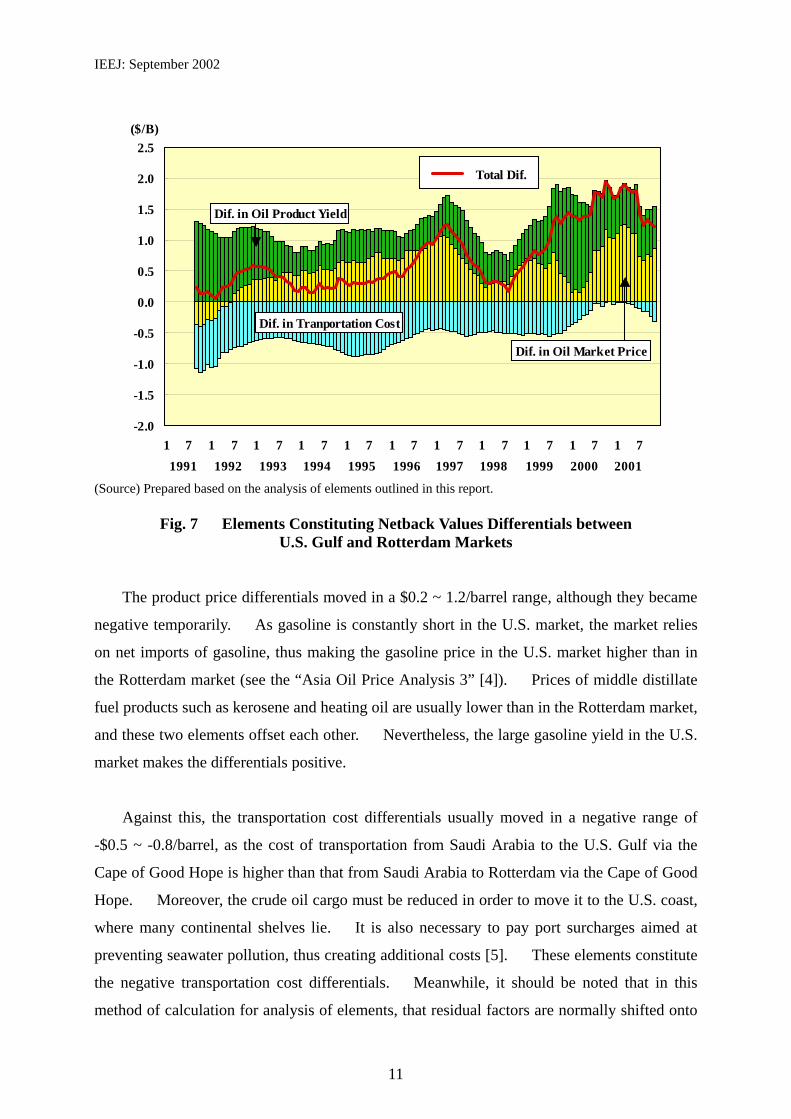
(Source) Prepared based on the analysis of elements outlined in this report.
Fig. 7 Elements Constituting Netback Values Differentials between U.S. Gulf and Rotterdam Markets
The product price differentials moved in a $0.2 ~ 1.2/barrel range, although they became
negative temporarily. As gasoline is constantly short in the U.S. market, the market relies
on net imports of gasoline, thus making the gasoline price in the U.S. market higher than in
the Rotterdam market (see the “Asia Oil Price Analysis 3” [4]). Prices of middle distillate
fuel products such as kerosene and heating oil are usually lower than in the Rotterdam market,
and these two elements offset each other. Nevertheless, the large gasoline yield in the U.S.
market makes the differentials positive.
Against this, the transportation cost differentials usually moved in a negative range of
-$0.5 ~ -0.8/barrel, as the cost of transportation from Saudi Arabia to the U.S. Gulf via the
Cape of Good Hope is higher than that from Saudi Arabia to Rotterdam via the Cape of Good
Hope. Moreover, the crude oil cargo must be reduced in order to move it to the U.S. coast,
where many continental shelves lie. It is also necessary to pay port surcharges aimed at
preventing seawater pollution, thus creating additional costs [5]. These elements constitute
the negative transportation cost differentials. Meanwhile, it should be noted that in this
method of calculation for analysis of elements, that residual factors are normally shifted onto
-2.0
-1.5
-1.0
-0.5
0.0
0.5
1.0
1.5
2.0
2.5
1 7 1 7 1 7 1 7 1 7 1 7 1 7 1 7 1 7 1 7 1 7
($/B)
1991 2001200019991998199719961995199419931992
Dif. in Tranportation Cost
Dif. in Oil Market Price
Dif. in Oil Product Yield
Total Dif.
IEEJ: September 2002
12
the transportation cost differentials. It can be thought, therefore, that residual factors
brought on by the extraordinarily sharp increase in oil product prices witnessed from 2000
into 2001 wiped out the transportation cost differentials which would otherwise have resulted.
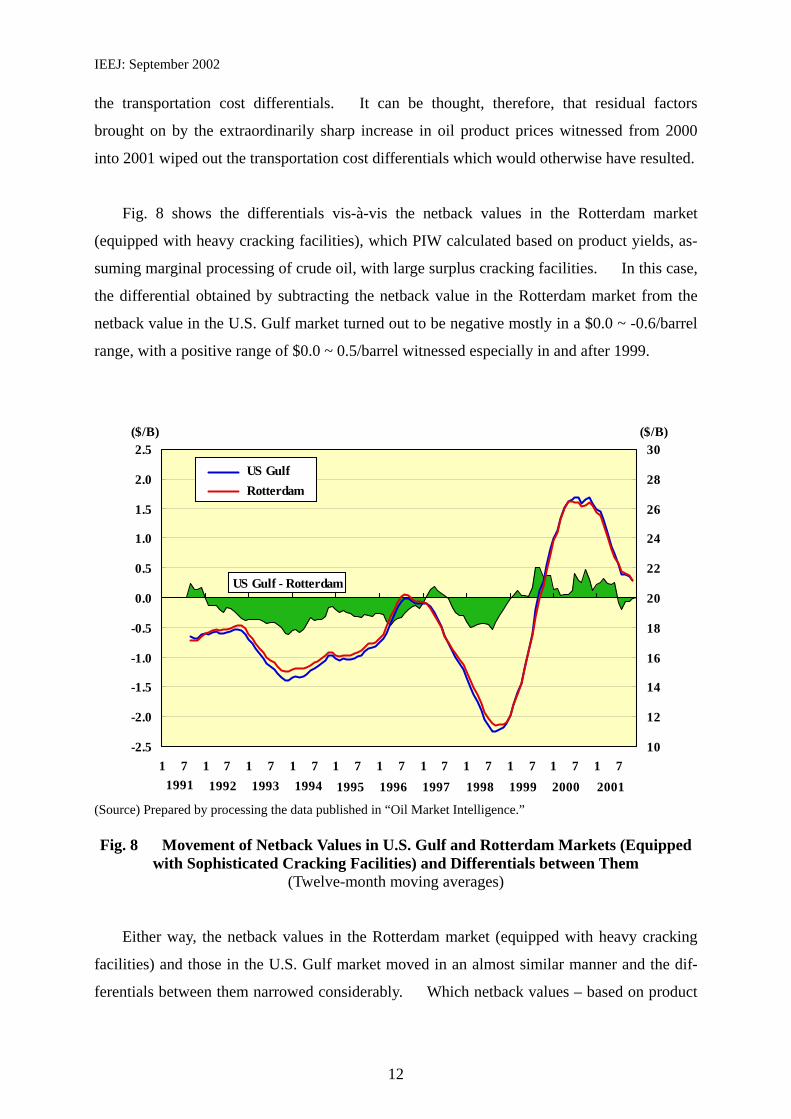
Fig. 8 shows the differentials vis-à-vis the netback values in the Rotterdam market
(equipped with heavy cracking facilities), which PIW calculated based on product yields, as-
suming marginal processing of crude oil, with large surplus cracking facilities. In this case,
the differential obtained by subtracting the netback value in the Rotterdam market from the
netback value in the U.S. Gulf market turned out to be negative mostly in a $0.0 ~ -0.6/barrel
range, with a positive range of $0.0 ~ 0.5/barrel witnessed especially in and after 1999.
(Source) Prepared by processing the data published in “Oil Market Intelligence.” Fig. 8 Movement of Netback Values in U.S. Gulf and Rotterdam Markets (Equipped
with Sophisticated Cracking Facilities) and Differentials between Them (Twelve-month moving averages)
Either way, the netback values in the Rotterdam market (equipped with heavy cracking
facilities) and those in the U.S. Gulf market moved in an almost similar manner and the dif-
ferentials between them narrowed considerably. Which netback values – based on product
-2.5
-2.0
-1.5
-1.0
-0.5
0.0
0.5
1.0
1.5
2.0
2.5
1 7 1 7 1 7 1 7 1 7 1 7 1 7 1 7 1 7 1 7 1 710
12
14
16
18
20
22
24
26
28
30
1991 2001200019991998199719961995199419931992
($/B)
US GulfRotterdam
($/B)
US Gulf - Rotterdam
IEEJ: September 2002
13
yields in cases equipped with reforming and cracking facilities vis-à-vis product yields in
cases equipped with heavy cracking facilities – should be regarded as representative of the
Rotterdam market will be discussed at the end of this report.
3. Refining margins based on the formula price of Arabian Light crude
(1) Refining margins in the U.S. Gulf market
This chapter presents an analysis of what refining margins will result from the formula
prices of Arabian Light crude set for the three major oil-consuming markets of the U.S.,
Europe and Asia and the netback values of Arabian Light crude based on the oil product
market conditions representing the U.S. Gulf, Rotterdam and Singapore markets. The re-
fining margins thus obtained are the indicators showing whether the formula prices of Arabian
Light crude set for the three markets are attractive enough to compete in each market.
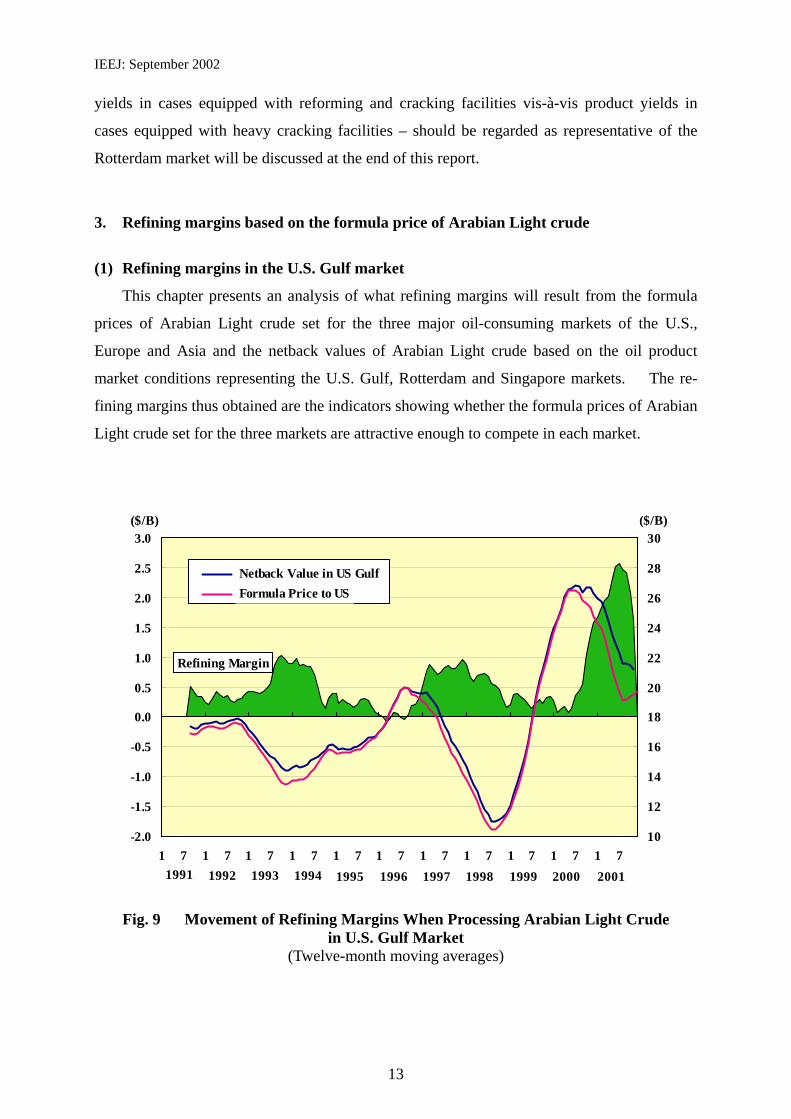
Fig. 9 Movement of Refining Margins When Processing Arabian Light Crude
in U.S. Gulf Market (Twelve-month moving averages)
-2.0
-1.5
-1.0
-0.5
0.0
0.5
1.0
1.5
2.0
2.5
3.0
1 7 1 7 1 7 1 7 1 7 1 7 1 7 1 7 1 7 1 7 1 710
12
14
16
18
20
22
24
26
28
30
1991 2001200019991998199719961995199419931992
($/B)
Netback Value in US GulfFormula Price to US
Refining Margin
($/B)
IEEJ: September 2002
14
The refining margins obtained from the netback values in the U.S. Gulf market and the
formula prices for the U.S. market are shown in Fig. 9. The refining margins for process-
ing Arabian Light crude normally vary within a range of $0.0 ~ 0.5/barrel, with almost no
cases showing negative margins based on an average a twelve-month moving average, but not
necessarily so on an average monthly basis. From the second half of 1993 into the first half
of 1994 and from 1997 into the first half of 1998, the refining margins rose to around
$1/barrel as the crude oil market became bearish. From the second half of 2000 into 2001,
the refining margin went up to around $2.5/barrel at the maximum as Saudi Arabia reduced
the formula price for the U.S. market by using a large adjustment factor.
It can be said from the above that the formula price of Arabian Light crude for the U.S.
market has been attractive for more than a decade from 1991 to the present from the stand-
point of selecting crude oil, when viewed from crude oil processing based on the oil product
prices in the U.S. Gulf market.
(2) Refining Margins in the Rotterdam Market
The refining margins obtained from the netback values in the Rotterdam market
(equipped with reforming and cracking facilities) and the formula price for the European
market are shown in Fig. 10. First, a case is considered in which the netback value is cal-
culated on the basis of product yields, assuming marginal processing of crude oil, using sur-
plus reforming facilities and some surplus cracking facilities.
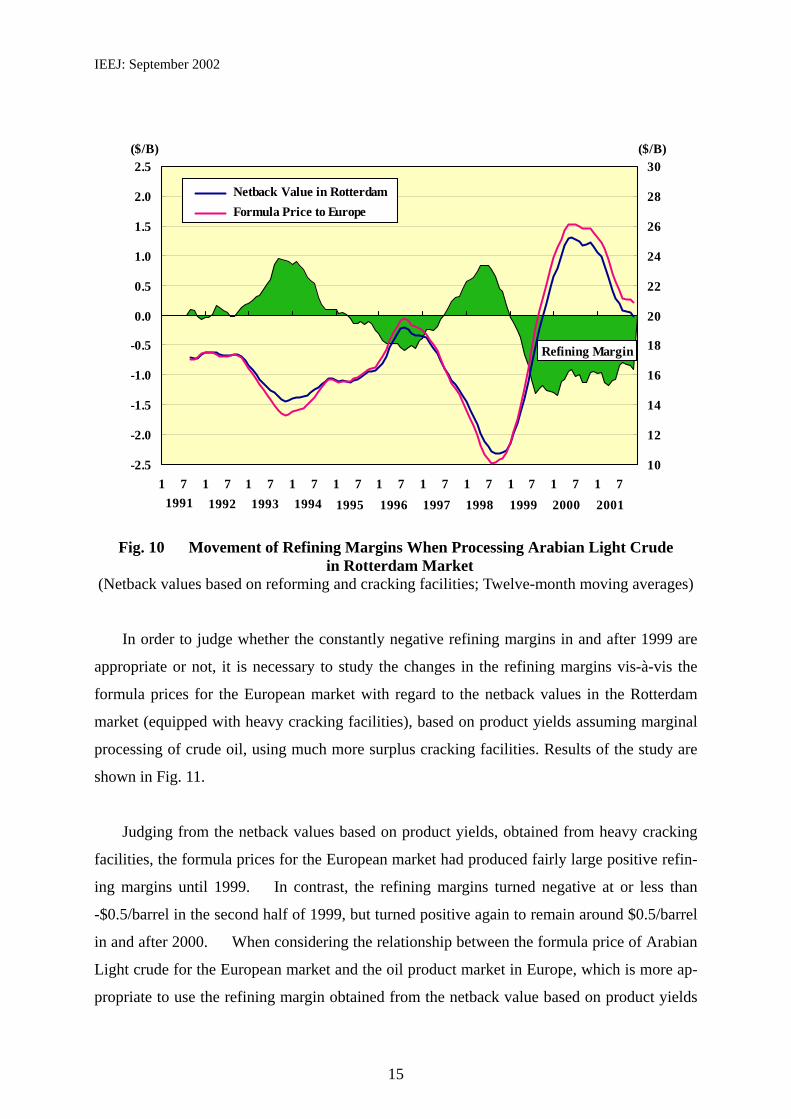
The refining margins when processing Arabian Light crude in the Rotterdam market
show repetition of positive and negative margins. From the second half of 1993 into the
first half of 1994 and in the first half of 1998, the refining margins were positive at a level
close to $1/barrel due to the bearish crude oil market, as was the case with the U.S. Gulf mar-
ket as noted above. In 1996, especially in the first half, the refining margins dropped to
around -$0.5/barrel as crude oil prices went up in Europe as a results of a ripple effect of the
fall in commercial inventories of gasoline to an abnormally low level in the U.S. In and
after 1999, the refining margins further dropped to -$0.8 ~ -1.3/barrel and remain at this level
as crude oil prices increased sharply due to OPEC’s production cuts coordinated with
non-OPEC, coupled with the sharp rise in oil product prices in the U.S.
IEEJ: September 2002
15
Fig. 10 Movement of Refining Margins When Processing Arabian Light Crude
in Rotterdam Market (Netback values based on reforming and cracking facilities; Twelve-month moving averages) In order to judge whether the constantly negative refining margins in and after 1999 are
appropriate or not, it is necessary to study the changes in the refining margins vis-à-vis the
formula prices for the European market with regard to the netback values in the Rotterdam
market (equipped with heavy cracking facilities), based on product yields assuming marginal
processing of crude oil, using much more surplus cracking facilities. Results of the study are
shown in Fig. 11.
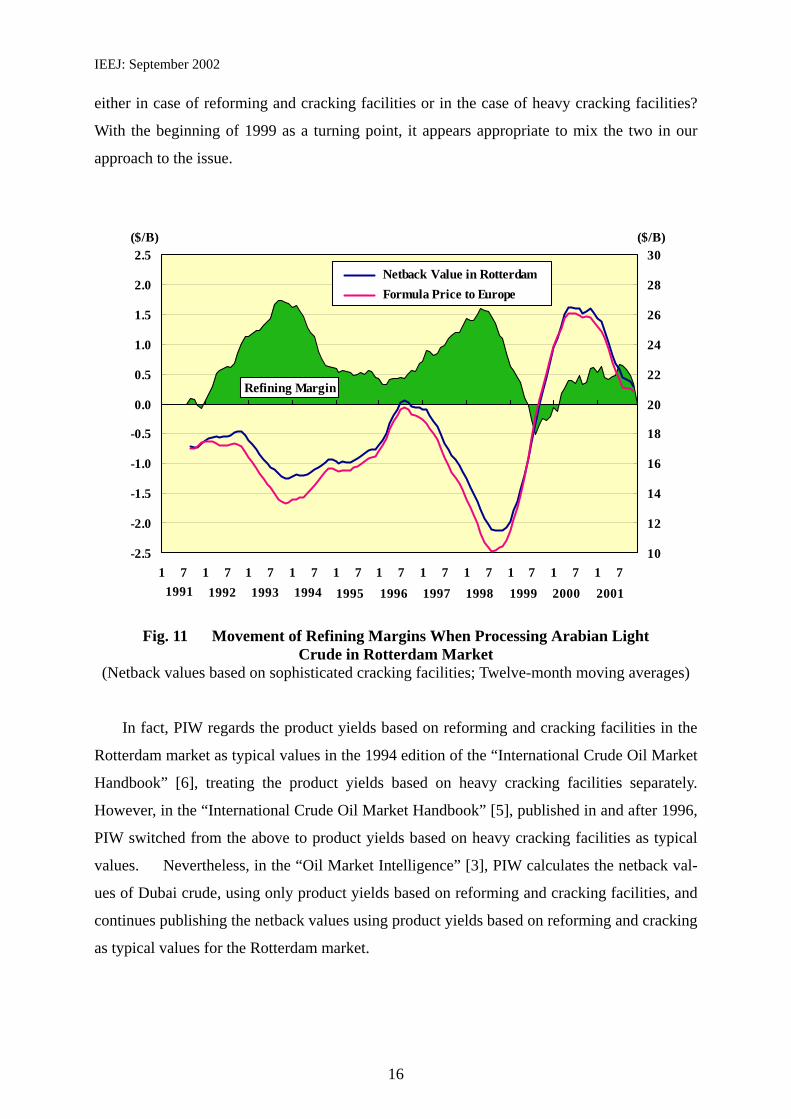
Judging from the netback values based on product yields, obtained from heavy cracking
facilities, the formula prices for the European market had produced fairly large positive refin-
ing margins until 1999. In contrast, the refining margins turned negative at or less than
-$0.5/barrel in the second half of 1999, but turned positive again to remain around $0.5/barrel
in and after 2000. When considering the relationship between the formula price of Arabian
Light crude for the European market and the oil product market in Europe, which is more ap-
propriate to use the refining margin obtained from the netback value based on product yields
-2.5
-2.0
-1.5
-1.0
-0.5
0.0
0.5
1.0
1.5
2.0
2.5
1 7 1 7 1 7 1 7 1 7 1 7 1 7 1 7 1 7 1 7 1 710
12
14
16
18
20
22
24
26
28
30
1991 2001200019991998199719961995199419931992
($/B) ($/B)
Netback Value in RotterdamFormula Price to Europe
Refining Margin
IEEJ: September 2002
16
either in case of reforming and cracking facilities or in the case of heavy cracking facilities?
With the beginning of 1999 as a turning point, it appears appropriate to mix the two in our
approach to the issue.
Fig. 11 Movement of Refining Margins When Processing Arabian Light
Crude in Rotterdam Market (Netback values based on sophisticated cracking facilities; Twelve-month moving averages)
In fact, PIW regards the product yields based on reforming and cracking facilities in the
Rotterdam market as typical values in the 1994 edition of the “International Crude Oil Market
Handbook” [6], treating the product yields based on heavy cracking facilities separately.
However, in the “International Crude Oil Market Handbook” [5], published in and after 1996,
PIW switched from the above to product yields based on heavy cracking facilities as typical
values. Nevertheless, in the “Oil Market Intelligence” [3], PIW calculates the netback val-
ues of Dubai crude, using only product yields based on reforming and cracking facilities, and
continues publishing the netback values using product yields based on reforming and cracking
as typical values for the Rotterdam market.
-2.5
-2.0
-1.5
-1.0
-0.5
0.0
0.5
1.0
1.5
2.0
2.5
1 7 1 7 1 7 1 7 1 7 1 7 1 7 1 7 1 7 1 7 1 710
12
14
16
18
20
22
24
26
28
30
1991 2001200019991998199719961995199419931992
($/B) ($/B)
Netback Value in RotterdamFormula Price to Europe
Refining Margin

IEEJ: September 2002
17
These measures do no preclude the possibility that there were efforts to pressure Middle
Eastern oil-producers to reduce crude oil prices for the European market. At any rate, it
appears natural that oil-producing countries, becoming aware of the environment surrounding
the European market, began setting formula prices corresponding to the typical netback val-
ues in the Rotterdam market in and after 1999. Accordingly, the refining margins when
processing Arabian Light crude did not so worsen in and after 1999 as judged from the net-
back values based on product yields from reforming and cracking facilities. Rather, the re-
fining margins for the netback values based on product yields from heavy cracking facilities
are considered to be appropriate.
(3) Refining Margins in the Singapore Market
Lastly, the movement of refining margins when processing Arabian Light crude in the
Singapore market, based on net-back values and formula prices for the Asian market, is
shown in Fig. 12.
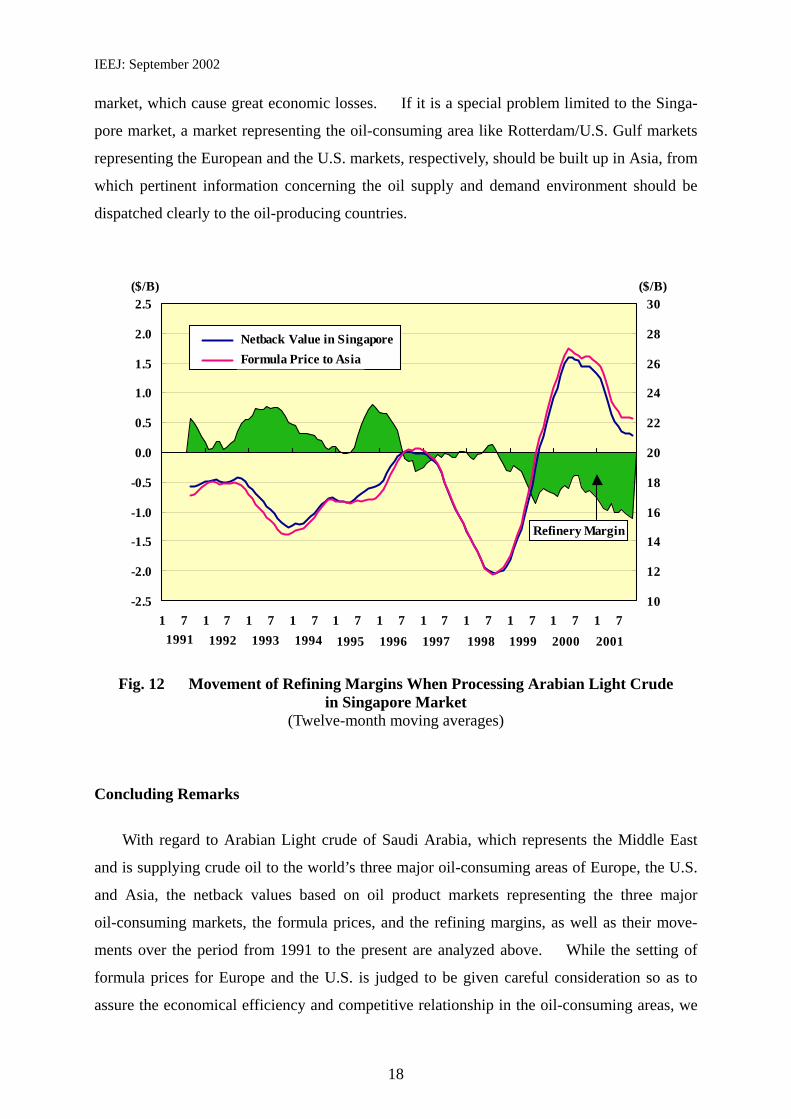
The refining margins moved in a $0.0 ~ 0.8/barrel range until the first half of 1996. As
all product prices in the Singapore market were higher than those in the Rotterdam market
until 1997 (see the “Analysis 3 of Oil Prices for Asian Market” [4]), positive refining margins
were obtained even against the relatively higher formula prices for the Asian market.
On the contrary, the refining margins turned negative to a $0.0 ~ -0.3/barrel range from
the second half of 1996 to 1998, due to the sharp increase in crude oil prices, which accompa-
nied the sharp increase in oil product prices in the Europe and US. markets, and slackened oil
demand, which was triggered by the Asian economic crisis. With this period as a turning
point, the refining margin worsened to show larger negative figures on a continuous basis in
and after 1999, reaching a level breaking the -$1.0/barrel line recently. In this connection,
it is of no small concern that oil-producing countries have fallen into idleness in and after
1999, paying no attention to the setting of formula prices for the Asian market in such a man-
ner that the formula prices are commensurate with oil product prices in the Singapore market,
which represents Asia.
There were serious concerns that the situation which plagued the Singapore Market could
spread to all oil consuming countries in Asia. Oil-consuming countries and oil industries in
Asia should not keep silent about the existence of the higher formula prices for the Asian
IEEJ: September 2002
18
market, which cause great economic losses. If it is a special problem limited to the Singa-
pore market, a market representing the oil-consuming area like Rotterdam/U.S. Gulf markets
representing the European and the U.S. markets, respectively, should be built up in Asia, from
which pertinent information concerning the oil supply and demand environment should be
dispatched clearly to the oil-producing countries.
Fig. 12 Movement of Refining Margins When Processing Arabian Light Crude
in Singapore Market (Twelve-month moving averages)
Concluding Remarks
With regard to Arabian Light crude of Saudi Arabia, which represents the Middle East
and is supplying crude oil to the world’s three major oil-consuming areas of Europe, the U.S.
and Asia, the netback values based on oil product markets representing the three major
oil-consuming markets, the formula prices, and the refining margins, as well as their move-
ments over the period from 1991 to the present are analyzed above. While the setting of
formula prices for Europe and the U.S. is judged to be given careful consideration so as to
assure the economical efficiency and competitive relationship in the oil-consuming areas, we
-2.5
-2.0
-1.5
-1.0
-0.5
0.0
0.5
1.0
1.5
2.0
2.5
1 7 1 7 1 7 1 7 1 7 1 7 1 7 1 7 1 7 1 7 1 710
12
14
16
18
20
22
24
26
28
30
1991 2001200019991998199719961995199419931992
($/B) ($/B)
Netback Value in SingaporeFormula Price to Asia
Refinery Margin
IEEJ: September 2002
19
cannot but conclude that the formula prices for the Asian market have been set at relatively
higher levels in and after 1999, thus causing economic losses when judged from oil product
prices in the Singapore market.
When the formula method was introduced as a means of pricing crude oil in the second
half of 1987, the oil-producing countries must have firmly advocated the attitude and the
spirit to attach great importance to economical efficiency and competitive relations in the
consuming areas. Isn’t it the action that runs counter to the above-mentioned spirit to set
crude oil prices at a relatively higher level for the Asian market, thus entailing economic
losses to the Asian oil-consuming area, which has a scale of consumption comparable with
Europe and the U.S. and is expected to see expanded oil demand in the future as a growth
center? When the long-term interdependent relations between the Asian oil-consuming
countries and the Middle Eastern oil-producing countries are taken into account, this is an is-
sue that has essential elements to be paid careful attention by the Middle Eastern
oil-producing countries. Should the Asian oil-consuming countries be forced to bear such a
cost burden, it is expected to stifle the economic growth and cripple the growth in energy and
oil demand as well.
The Asian oil-consuming countries, on their part, are urged to streamline, expand and
strengthen the oil product market. The current Singapore market is thought to be too weak
to function as a body to dispatch the information on supply and demand of oil products and
competitive relations among energy sources in the major Asian oil-consuming areas to the
oil-producing countries. It is believed to be an essential task in the future for the Asian
oil-consuming countries as a whole to strengthen the Singapore market function by expanding
oil products trading through the implementation deregulation measures so that interdependent
relations with the oil-producing countries can be built up from a long-term perspective.
(References)
[1] Yoshiki Ogawa, “Asia Oil Price Analysis 1: Middle Eastern Crude for Asian Market
Priced at Comparatively Higher Levels and Switchover of Marker Crude Inevitable to
Gain Market’s Confidence,” Research Report, Homepage of the Institute of Energy Eco-
nomics, Japan (IEEJ): http://eneken.ieej.or.jp/en/data/pdf/133.pdf, 2002.
IEEJ: September 2002
20
[2] Yoshiki Ogawa, “Asia Oil Price Analysis 4: Values of Marker Crude Based on Oil Prod-
uct Market Prices and Evaluation on Price Differential among Marker Crude Oils,” Re-
search Report, Homepage of the Institute of Energy Economics, Japan (IEEJ): http://
eneken.ieej.or.jp/en/data/pdf/160.pdf , 2002.
[3] Petroleum Intelligence Weekly and Oil Market Intelligence (issues published to date)
[4] Yoshiki Ogawa, “Asia Oil Price Analysis 3: Streamlining of Asian Oil Market and Global
Link of Oil Prices,” Research Report, Homepage of the Institute of Energy Economics,
Japan (IEEJ): http://eneken.ieej.or.jp/en/data/pdf/153.pdf , 2002.
[5] PIW, “The International Crude Oil Market Handbook 1997-98,” 2nd edition, 1996 and
3rd & 4th editions in sub-sequent years
[6] PIW, “The International Crude Oil Market Handbook 1996,” 1st edition, 1994
Contact: [email protected]
IEEJ: September 2002
21
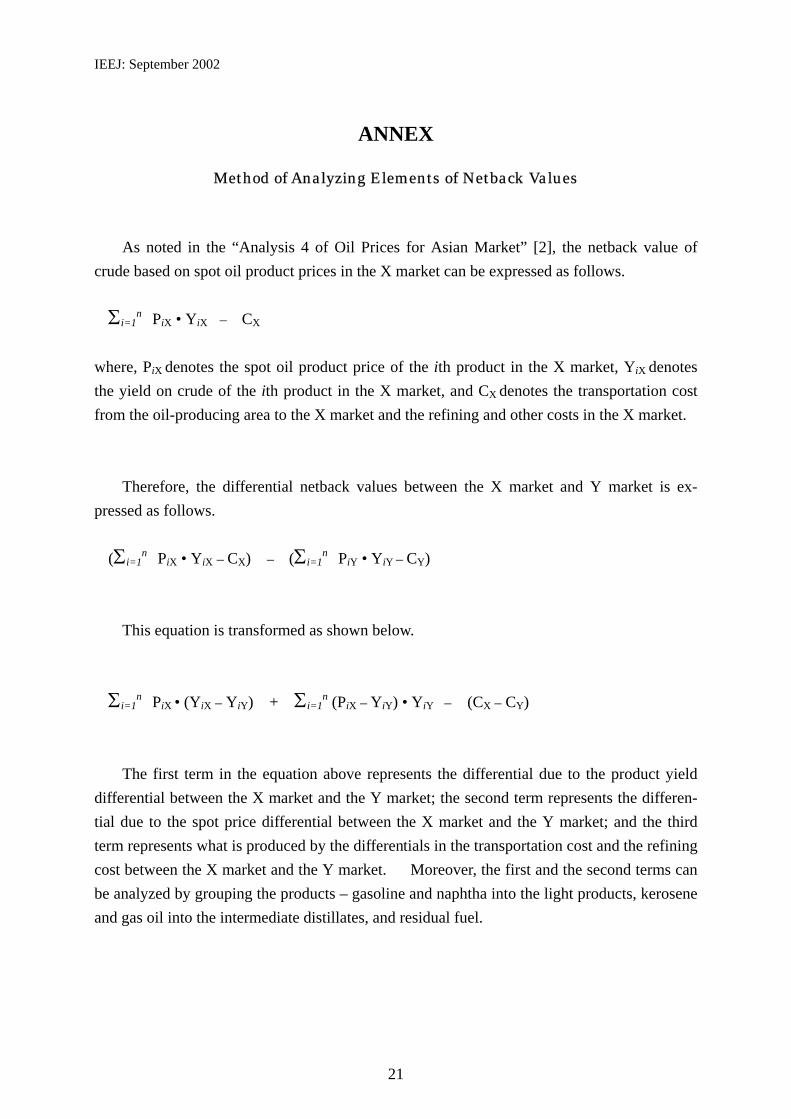
ANNEX
Method of Analyzing Elements of Netback Values
As noted in the “Analysis 4 of Oil Prices for Asian Market” [2], the netback value of crude based on spot oil product prices in the X market can be expressed as follows. Σi=1
n PiX • YiX – CX
where, PiX denotes the spot oil product price of the ith product in the X market, YiX denotes the yield on crude of the ith product in the X market, and CX denotes the transportation cost from the oil-producing area to the X market and the refining and other costs in the X market. Therefore, the differential netback values between the X market and Y market is ex-pressed as follows. (Σi=1
n PiX • YiX – CX) – (Σi=1n PiY • YiY – CY)
This equation is transformed as shown below.
Σi=1
n PiX • (YiX – YiY) + Σi=1n (PiX – YiY) • YiY – (CX – CY)
The first term in the equation above represents the differential due to the product yield differential between the X market and the Y market; the second term represents the differen-tial due to the spot price differential between the X market and the Y market; and the third term represents what is produced by the differentials in the transportation cost and the refining cost between the X market and the Y market. Moreover, the first and the second terms can be analyzed by grouping the products – gasoline and naphtha into the light products, kerosene and gas oil into the intermediate distillates, and residual fuel.

IEEJ: September 2002
22
Production Yield of Arabian Light Crude Using for Netback
Value Assessment in Each Oil Product Market (Unit: %)
Premium Gasoline
Regular Gasoline
Naphtha Jet Kerosene
Gas oil Heating
LS Residual
HS Residual
Total
Rotterdam (All Years)
Summer 15.5 5.6 7.0 -- 33.0 -- 33.4 94.5
Reforming Cracking
Winter 11.9 4.3 5.4 -- 40.3 -- 32.8 94.7
Rotterdam (~96) Sophiscated Cracking
Whole 21.8 7.8 -- -- 41.1 -- 25.3 96.0
US Gulf (~96)
Summer 16.6 11.3 5.6 6.3 29.4 -- 24.7 93.9
Sophiscated Cracking
Winter 12.7 8.7 4.4 7.7 35.9 -- 24.3 93.7
US Gulf (97~)
Summer -- 51.6 -- -- 18.4 -- 27.5 97.5
Sophiscated Cracking
Winter -- 44.0 -- -- 26.6 -- 26.6 97.2
Singapore (~96)
Summer -- 48.8 -- 5.6 17.1 -- 24.5 96.0
Strait-run Reforming
Winter -- 39.9 -- 8.2 24.7 -- 23.7 96.5
Singapore (97~) Straight-run Reforming
Whole 14.2 -- 3.5 16.3 16.5 -- 45.0 95.5
Rotterdam (All Years)
Summer -- -- 18.4 19.6 16.5 -- 42.5 97.0
Reforming Cracking
Winter -- -- 16.5 23.2 16.5 -- 40.0 96.2
(Source) Refs. [5] and [6]