asia bond monitor 2008 - asian development bankthe asia bond monitor (abm) reviews recent...
TRANSCRIPT

Continued overleaf
The Asia Bond Monitor (ABM) reviews recent developments in East Asian local currency bond markets along with the outlook, risks, and policy options. In this issue, a theme chapter examines bond market development in India. The ABM covers the 10 Association of Southeast Asian Nations member countries plus the People’s Republic of China; Hong Kong, China; and the Republic of Korea.
Asia Bond Monitor 2008
Asian Development Bank Office of Regional Economic Integration
6 ADB Avenue, Mandaluyong City1550 Metro Manila, Philippines
Telephone+63 2 632 6688
Facsimile+63 2 636 2183
How to reach us
April 2008 asianbondsonline.adb.org
ContentsBond Market Developments in theSecond Half of 2007 3
Size and Composition 4Turnover 15Bond Yields 18Bond Index Returns 26Institutional and Regulatory Changes 27
Outlook, Risks, and PolicyChallenges 32
External Market Environment 32Outlook for 2008 39Risks to the Outlook 44Policy Challenges 47
The Indian Bond Market—Developments and Challenges Ahead 53
BoxesWhy All the Fuss about Sovereign Wealth Funds? 37What’s Needed to Build Liquidity—an AsianBondsOnline Survey 42Are There Ways to Broaden Investor Diversity? 50Reforming India’s Financial Sector 57
Emerging East Asian Local Currency Bond Markets: A Regional Update
Highlights
Bond Market Developments in the Second Half of 2007
Emerging East Asia’s local currency (LCY) bonds outstanding
expanded at an annual 21% rate in the second half of 2007.
LCY government bond markets grew 21% in 2007, largely driven
by central bank sterilization and fiscal stimulus.
LCY corporate bond markets expanded 20% in 2007, illustrating
the limited initial impact of the global credit crisis.
Turnover increased in most emerging East Asian government
markets in 2007, but was weak in most corporate markets.
Heightened inflation risks and fears of an external demand shock
led to increased volatility in yield curves in 2007.
The ABF Pan Asian Bond Index gained 8% in 2007 in US dollar
terms, partly lifted by stronger regional currencies, lower than
the 13.6% return in 2006.
Reforms in 2007 concentrated on the secondary market: key
themes were better risk management, price discovery, and
creating a wider array of fixed-income assets for investors.
Outlook, Risks, and Policy Challenges
The global economy is expected to slow moderately in 2008
as the US economy weakens, credit conditions tighten, and
inflationary pressures continue.
Despite the worsening external economic environment facing
emerging East Asia, GDP growth, while moderating, is expected
to remain robust.
The outlook for 2008 is for continued bond market growth, but
at a slower pace. Credit tightening has not been as severe in
Asia, although corporate yields are higher than in mid-2007 and
some borrowers have delayed bond issues, relying instead on
short-term bank finance.
Three main risks to the outlook are (i) a deep or protracted
US economic contraction; (ii) continued financial market
volatility places pressure on market participants to cover rapidly
shifting positions, increasing possible new credit disruption that
could affect both global and regional financial markets; and
(iii) inflation exerts greater pressure on regional economies,
constraining policy options amid slowing growth.
Five policy challenges are to (i) bolster investor confidence
by strengthening legal protection and thus certainty, improve
standards of corporate governance and transparency, and
•
•
•
•
•
•
•
•
•
•
•
•

ABCP asset-backed commercial paperABF Asian Bond FundABM Asia Bond MonitorABS asset-backed securitiesADB Asian Development BankASEAN Association of Southeast Asian NationsBIBOR Bangkok Interbank Offered RateBNM Bank Negara Malaysia BNMN Bank Negara Monetary Notes BSP Bangko Sentral ng PilipinasCBLO Collateralized Borrowing and Lending ObligationCCIL Clearing Corporation of India Ltd.CDS credit default swapCHIBOR China Interbank Offered RateCSRC China Securities Regulatory Commission DvP delivery versus paymentECB European Central BankEU European UnionFRBM Fiscal Responsibility and Budget Management ActFSC Financial Supervisory CommissionGDP gross domestic productHIBOR Hong Kong Interbank Offered RateIMF International Monetary FundJIBOR Jakarta Interbank Offered RateKLIBOR Kuala Lumpur Interbank Offered RateKorea Republic of KoreaKORIBOR Korea Interbank Offered RateLCY local currencyLIC Life Insurance Corporation of IndiaMGS Malaysian Government SecurityMBS mortgage-backed securities MSB Monetary Stabilization BondNDS Negotiated Dealing SystemNSE National Stock ExchangeOECD Organisation for Economic Co- operation and DevelopmentOREI Office of Regional Economic IntegrationOTC over–the-counter PHIBOR Philippine Interbank Offered RatePRC People’s Republic of ChinaRBI Reserve Bank of IndiaREIT real estate investment trustrepo repurchase agreementRMBS residential mortgage-backed securitiesSEBI Securities and Exchange Board of IndiaSEC Securities and Exchange Commission SGS Singapore Government Securities SHIBOR Shanghai Interbank Offered RateSIBOR Singapore Interbank Offered RateSIVs structured investment vehicles SLR Statutory Liquidity ReserveSOE state-owned enterprises SPV special purpose vehicleSRO self-regulating organizationSWF sovereign wealth fundTIBOR Tokyo Interbank Offered RateUK United KingdomUS United StatesUS Fed United States Federal ReserveYTD year-to-date
bp = basis points
Note: To conform with market practice, the Asia Bond Monitor uses two-letter official ISO Country Codes and three-letter currency codes rather than ADB’s standard symbols.
The Asia Bond Monitor April 2008 was prepared by ADB’s Office of Regional Economic Integration and does not necessarily reflect the views of ADB's Board of Governors or the countries they represent.
Acronyms, Abbreviations, and Notes
adhere to international accounting standards; (ii) reduce
constraints to market entry, investment, and encourage investor
diversity to promote greater demand for local currency bonds;
(iii) develop derivative and swap markets to broaden the investor
base, increase market liquidity, and allow a wider dispersal
of risk; (iv) improve data compilation and comparison; and
(v) strengthen broader arrangements for regulatory oversight
and regional cooperation in the areas of information-sharing and
in coordinated actions to maintain financial stability.
India’s Bond Market—Developments and Challenges Ahead
India’s government bond market has grown steadily in size, largely
due to the need to finance the fiscal deficit and is comparable to
many government bond markets in emerging East Asia.
The corporate bond market is less developed than most in
emerging East Asia, with private placements dominating.
The turnover ratio for government bonds is lower than most
of emerging East Asia—the corporate ratio compares well, but
the small number of outstanding bonds means the secondary
market is small and illiquid.
Like in many emerging East Asian bond markets, the investor
base remains narrow in both government and corporate bond
markets, with limited foreign participation.
Mandatory minimum holding requirements on banks, insurance
companies, and pension funds renders the market “captive”
and constrains the development of a truly competitive bond
market.
Regulatory responsibility in India’s bond markets is fragmented—
and there is the perception among market participants that
regulators tend to be at cross-purposes.
To address the lack of bond market liquidity, authorities could
(i) ease investment mandates on contractual savings institutions
to hold bonds to maturity; (ii) allow less-restricted development
of derivatives and swap markets; (iii) consolidate the outstanding
stock of government bonds; and (iv) relax exchange controls on
bonds to facilitate investment by foreign investors and broaden
the domestic investor base.
To develop the corporate bond market, authorities could
(i) reform the relevant tax structure particularly relating to the
stamp duty and (ii) revamp the disclosure requirements for
corporate public offers.
Initiatives underway to streamline and consolidate the supervisory
and regulatory structure of India’s local currency bonds markets
should contribute to a more level playing field.
•
•
•
•
•
•
•
•
•

��
Bond Market Developments in the Second Half of 2007
Global Bond Market Developments
Defaults from poor-quality borrowers in the US have continued to erode US bank capital and raise an "uncertainty" premium in the world’s capital markets.
The first half of 2007 was characterized by continued strong global
economic and bank loan growth. However, by the second half a
surge in default rates among subprime mortgages in the United
States (US) began to erode bank capital in several major lending
markets. The first signs of trouble occurred at end-January 2007,
when a brief, but significant, correction in the Shanghai equity
market sent tremors through all major markets. Default rates in
the US subprime market were already rising at the time but were
limited to local mortgage financers in half a dozen states. Four
months later the stress began to appear in the interbank funding
market, causing another brief market correction in global bond
and equity markets. The problem became public when two major
funds were rescued by their sponsor in June and then declared
bankrupt in July.
Despite US Federal Reserve (US Fed) intervention, lowering
policy rates, and expanding refinancing programs, default rates
in the subprime sector continued to rise quickly and force fund
closures, ratings downgrades and bank margin calls. Highly-
leveraged funds were forced to sell high-grade securities to meet
the margin calls, thus contaminating AAA mortgage-backed
securities (MBS) and spreading the wave of de-leveraging across
the US financial system. Regulators allowed the subprime and Alt-
A sectors of the US mortgage market to grow so quickly in the
beginning in 2005 and 2006 that they totaled one-third of the
entire US mortgage market by June 2007. The effects of higher
credit costs and credit rationing to poor-quality borrowers were
magnified by high levels of leverage to a level able to decimate
US bank capital. By early 2008, some analysts were putting the
cost at multiples of 10% of bank capital. The capital of monoline
insurers, which had strayed from municipal-bond guarantees to
insuring the senior portions of MBS and other securitized deals,
had been exhausted by end-2007. The prospect of an inability
to refinance quickly meant risk contagion began to spread to the
vast US municipal market in January 2008.
Emerging East Asian Local CurrencyBond Markets: A Regional Update

A S I A B O N D M O N I T O R
�
The asset-backed commercial paper market seized up in August
2007 and began to rapidly force assets back on to bank balance
sheets, over USD400 billion, by the end of March 2008. The
combined surprise of losses to bank capital and calls on the
balance sheet meant a bank’s self-interest would be served
by cutting lending so that only core clients could still access
regular credit. Moral suasion and wider credit provisions from
the central bank had little effect by now and a significant slowing
of credit growth in 2H07 led corporations in the US and some
of its import markets to delay spending and hiring plans. Signs
of a US recession were rife by end-2007 and economic growth
rates were further downgraded around the world. In spite of
the Fed’s continued aggressive rate-cutting through 1Q08 and
extraordinary lending programs to securities companies (as
opposed to its mandate with banks), financial firms also continued
hoarding cash and restricting credit lines.
The Asian local currency bond markets were initially beneficiaries
of the US credit crunch, as investors sought attractive yields
outside US markets. The debate over a so-called decoupling
of Asia’s credit and trade markets from those in the US quickly
ensued. However, risk aversion grew, and gradually became
strong enough for foreign investors to begin net withdrawals from
most of emerging Asia’s capital markets. Asia’s offshore bond
issuance market went into hibernation in August 2007 and the
region’s securitization markets have almost frozen since. Expect
credit growth to slow significantly across Asia in 2008 because
of the transmission effects through both US capital and current
accounts. High and rising inflation confronts domestic central
banks with the same dilemma the US Fed faces: whether to fight
inflation by raising policy rates and guarantee a recession or to
boost liquidity in the hope of restarting credit growth, at the cost
of much higher inflation.
Size and Composition
Emerging East Asia’s local currency bond markets expanded rapidly in the second half of 2007, with an annual 21% growth in bonds outstanding.
Growth in the value of local currency (LCY) debt instruments
outstanding accelerated across emerging East Asia1 during
2007, reaching USD3.7 trillion, 21.1% above the USD2.9 trillion
1 In this report, emerging East Asia is defined as People’s Republic of China (PRC); Hong Kong, China; Indonesia; Republic of Korea (Korea); Malaysia; Philippines; Singapore; Thailand; and Viet Nam.

A S I A B O N D M O N I T O R
�
outstanding at end-2006 (Table 1). During the last 6 months
of 2007, net issuance increased 10.3%, the result of a surge in
treasury and central bank bills to absorb excess liquidity stemming
from inflows of foreign portfolio investment. Viet Nam had the
highest growth rate for the year (98%), followed by the People’s
Republic of China (PRC) (33%); Malaysia (27%); Indonesia
(19%); Thailand (16%); Singapore (12%); Republic of Korea
(Korea) (11%); Philippines (5%); and Hong Kong, China (2%)
(Figure 1). 2
Bond market growth exceeded the expansion in gross domestic
product (GDP) in 2007—except in Hong Kong, China; Indonesia;
Philippines; and Singapore. The ratio of LCY bonds outstanding
to GDP for the region continued to trend upward from 60% at
end-2006 to 62% at end-June 2007 to 63% at the end-2007
(Table 2).
During the second half of the year currency market activity
increased, with most regional currencies strengthening further
against the US dollar. Only the Korean won, Indonesian rupiah
and the Hong Kong dollar, which had widened its trading band
around the US dollar peg rate in May 2005, weakened in that
period (Table �). Portfolio inflows accelerated slightly during the
second half as risk-adjusted returns in many regional markets
appeared more attractive than those in the United States (US)
and Europe.
Local currency government bond markets expanded 21% in 2007, fed by (i) central bank issuance aimed at sterilizing excess liquidity and by (ii) fiscal stimulus during the second half to address concerns of slowing global growth.
Emerging East Asia’s LCY government bond markets grew 21.4%
in 2007 (Figure 2), reaching 46% of aggregate GDP. Sustained
open-market operations by central banks contributed to most of
the growth. In several markets, governments issued new debt to
fund adjusted budgets and to accelerate planned expenditures in
an effort to counteract an expected slowdown in export demand
and to reduce the impact of any fallout from the global credit
crunch.
2 Growth figures based on local currency values, not the USD values shown in Table 1.
Figure 2: Growth of Emerging East Asian Local Currency Government Bond Markets in 2007 (%)
Sources: People’s Republic of China (ChinaBond); Hong Kong, China (Hong Kong Monetary Authority); Indonesia (Indonesia Stock Exchange and Bank Indonesia); Republic of Korea (KoreaBondWeb); Malaysia (Bank Negara Malaysia); Philippines (Bureau of the Treasury); Singapore (Monetary Authority of Singapore); Thailand (Bank of Thailand); Viet Nam (Bloomberg LP); and Japan (Japan Securities Dealers Association).
0 20 40 60 80 100
Japan
Emerging East AsiaViet NamThailand
SingaporePhilippines
MalaysiaKorea, Rep. of
IndonesiaHong Kong, China
China, People's Rep. of
Figure 1: Growth of Emerging East Asian Local Currency Bond Markets in 2007 (%)
Sources: People’s Republic of China (ChinaBond); Hong Kong, China (Hong Kong Monetary Authority); Indonesia (Indonesia Stock Exchange and Bank Indonesia); Republic of Korea (KoreaBondWeb); Malaysia (Bank Negara Malaysia); Philippines (Bureau of the Treasury and Bloomberg LP); Singapore (Monetary Authority of Singapore and Bloomberg LP) ;Thailand (Bank of Thailand); Viet Nam (Bloomberg LP); and Japan (Japan Securities Dealers Association).
0 20 40 60 80 100
Japan
Emerging East AsiaViet NamThailand
SingaporePhilippines
MalaysiaKorea, Rep. of
IndonesiaHong Kong, China
China, People's Rep. of

A S I A B O N D M O N I T O R
�
Table 1: Size and Composition of Emerging East Asian Local Currency Bond Markets (in USD billions)
200� 200� 1H07 (1Jan–30 Jun) 2007 Growth Rate (%)Amount Amount Amount Amount
2005 2006 1H07 2007 (USD billion) % share (USD
billion) % share (USD billion) % share (USD
billion) % share
China, People’s Rep. of
Total 899.24 100.00 1,184.12 100.00 1,368.42 100.00 1,689.83 100.00 40.57 27.35 12.72 33.42
Government 835.18 92.88 1,078.57 91.09 1,250.79 91.40 1,533.12 90.73 35.85 24.90 13.12 32.89
Corporate 64.07 7.12 105.55 8.91 117.63 8.60 156.71 9.27 157.13 59.35 8.70 38.80
Hong Kong, China
Total 85.59 100.00 96.19 100.00 99.20 100.00 97.98 100.00 9.18 12.72 3.66 2.15
Government 16.34 19.09 16.94 17.62 17.20 17.34 17.52 17.88 3.37 4.01 2.02 3.69
Corporate 69.25 80.91 79.25 82.38 82.00 82.66 80.46 82.12 10.65 14.77 4.01 1.82
Indonesia
Total 54.15 100.00 76.72 100.00 87.04 100.00 87.55 100.00 (5.28) 29.64 13.84 19.27
Government 48.27 89.15 69.88 91.09 78.55 90.25 79.14 90.39 (5.69) 32.46 12.79 18.36
Corporate 5.88 10.85 6.84 8.91 8.49 9.75 8.41 9.61 (1.75) 6.48 24.54 28.55
Korea, Rep. of
Total 983.53 100.00 1,192.72 100.00 1,286.33 100.00 1,313.81 100.00 14.20 11.66 7.11 10.87
Government 583.07 59.28 702.88 58.93 736.16 57.23 722.11 54.96 21.32 11.00 4.01 3.40
Corporate 400.45 40.72 489.84 41.07 550.17 42.77 591.69 45.04 5.20 12.63 11.54 21.58
Malaysia
Total 106.70 100.00 121.38 100.00 139.15 100.00 164.16 100.00 9.67 6.19 12.19 26.77
Government 52.25 48.97 61.00 50.26 76.52 54.99 88.61 53.98 8.04 8.99 22.74 36.15
Corporate 54.45 51.03 60.37 49.74 62.63 45.01 75.55 46.02 11.27 3.50 1.52 17.28
Philippines
Total 41.66 100.00 46.36 100.00 49.74 100.00 58.02 100.00 9.73 2.73 1.15 5.30
Government 40.20 96.50 43.50 93.83 45.38 91.23 52.84 91.07 8.30 (0.11) (1.65) 2.21
Corporate 1.46 3.50 2.86 6.17 4.36 8.77 5.18 8.93 72.76 81.29 43.70 52.34
Singapore
Total 83.10 100.00 99.39 100.00 106.89 100.00 118.11 100.00 5.90 10.35 7.26 11.53
Government 46.90 56.44 55.92 56.26 60.90 56.98 68.13 57.68 8.03 10.00 8.62 14.34
Corporate 36.20 43.56 43.47 43.74 45.98 43.02 49.98 42.32 3.26 10.80 5.50 7.91
Thailand
Total 78.84 100.00 112.01 100.00 136.51 100.00 153.93 100.00 24.69 22.75 8.98 15.52
Government 54.29 68.86 74.58 66.58 93.18 68.26 107.47 69.82 29.01 18.69 11.72 21.14
Corporate 24.55 31.14 37.44 33.42 43.33 31.74 46.45 30.18 16.10 31.73 3.51 4.31
Viet Nam
Total 4.30 100.00 4.93 100.00 7.08 100.00 9.79 100.00 14.52 15.57 44.23 98.11
Government 4.20 97.52 4.50 91.28 6.41 90.57 8.28 84.54 12.24 8.17 43.11 83.48
Corporate 0.11 2.48 0.43 8.72 0.67 9.43 1.51 15.46 466.67 306.16 56.02 251.33
Total Emerging East Asia
Total 2,337.11 100.00 2,933.82 100.00 3,280.36 100.00 3,693.19 100.00 22.02 18.12 9.75 21.10
Government 1,680.70 71.91 2,107.77 71.84 2,365.09 72.10 2,677.23 72.49 25.73 18.31 9.96 21.40
Corporate 656.41 28.09 826.05 28.16 915.26 27.90 1,015.95 27.51 13.32 17.62 9.19 20.34
Japan
Total 7,046.41 100.00 7,096.10 100.00 6,843.13 100.00 7,653.25 100.00 8.55 1.83 (0.24) 1.18
Government 6,302.54 89.44 6,389.17 90.04 6,154.61 89.94 6,879.28 89.89 10.29 2.51 (0.35) 1.02
Corporate 743.87 10.56 706.93 9.96 688.52 10.06 773.97 10.11 (4.23) (3.90) 0.76 2.72
Notes:1. Calculated using data from national sources.2. Corporate bonds include issues by financial institutions.3. Bloomberg end-of-period LCY/USD rates are used. 4. Growth rates are calculated from LCY base and do not include currency effects.Sources: People’s Republic of China (ChinaBond); Hong Kong, China (Hong Kong Monetary Authority); Indonesia (Indonesia Stock Exchange and Bank Indonesia); Republic of Korea (KoreaBondWeb); Malaysia (Bank Negara Malaysia); Philippines (Bureau of the Treasury and Bloomberg LP) ; Singapore (Monetary Authority of Singapore and Bloomberg LP) ; Thailand (Bank of Thailand); Viet Nam (Bloomberg); and Japan (Japan Securities Dealers Association).

A S I A B O N D M O N I T O R
7
Table 2: Size and Composition of Emerging East Asian Local Currency Bond Markets (% of GDP)
Amount Outstanding
200� 200� 1H07 (1 Jan-30 Jun) 2007
China, People’s Rep. of
Total 39.47 43.83 46.06 50.00
Government 36.66 39.92 42.10 45.36
Corporate 2.81 3.91 3.96 4.64
Hong Kong, China
Total 48.01 50.69 50.73 47.39
Government 9.16 8.93 8.79 8.47
Corporate 38.84 41.76 41.93 38.92
Indonesia
Total 19.19 20.66 21.66 20.80
Government 17.10 18.82 19.55 18.80
Corporate 2.08 1.84 2.11 2.00
Korea, Rep. of
Total 122.56 130.80 136.36 136.46
Government 72.66 77.08 78.04 75.00
Corporate 49.90 53.72 58.32 61.46
Malaysia
Total 77.63 74.79 80.64 84.62
Government 38.02 37.59 44.34 45.68
Corporate 39.62 37.20 36.30 38.94
Philippines
Total 40.67 37.66 36.39 35.97
Government 39.25 35.34 33.20 32.76
Corporate 1.42 2.32 3.19 3.21
Singapore
Total 69.32 70.28 71.53 69.94
Government 39.12 39.54 40.76 40.34
Corporate 30.19 30.74 30.77 29.60
Thailand
Total 45.59 50.71 53.38 54.06
Government 31.39 33.76 36.44 37.75
Corporate 14.20 16.95 16.95 16.31
Viet Nam
Total 8.18 8.13 10.97 13.72
Government 7.97 7.42 9.94 11.60
Corporate 0.20 0.71 1.04 2.12
Total Emerging East Asia
Total 56.63 60.08 62.00 63.13
Government 40.73 43.17 44.70 45.76
Corporate 15.91 16.92 17.30 17.37
Japan
Total 165.37 166.02 164.20 165.35
Government 147.91 149.48 147.68 148.63
Corporate 17.46 16.54 16.52 16.72
Sources: People’s Republic of China (ChinaBond). Hong Kong, China (Hong Kong Monetary Authority). Indonesia (Indonesia Stock Exchange and Bank Indonesia). Republic of Korea (KoreaBondWeb). Malaysia (Bank Negara Malaysia). Philippines (Bureau of the Treasury and Bloomberg LP). Singapore (Monetary Authority of Singapore and Bloomberg LP). Thailand (Bank of Thailand). Viet Nam (Bloomberg LP) for outstanding bonds, CEIC for GDP, and AsianBondsOnline estimates.
Table 3: 2007/08 Appreciation (Depreciation) of Emerging East Asian Currencies (%)
Against USD
Currency 2007 2008 YTD
CNY 6.73 3.99
HKD (0.28) 0.18
IDR (4.42) 2.10
KRW (0.65) (5.66)
MYR 6.48 3.45
PHP 17.29 (1.37)
SGD 6.34 4.26
THB 17.36 (5.52)
VND 0.25 (0.58)
JPY 6.38 11.58
Notes:1. Appreciation (depreciation) is equal to -LN(end-of-period rate/start-of-period rate).2. 2008 year-to-date (YTD) is as of 31 March 2008.Source: Bloomberg LP.

A S I A B O N D M O N I T O R
8
In Viet Nam (83% growth in 2007), the LCY government bond
market saw a surge in growth in 2007 as a result of significant
changes to the issuance process. While the State Treasury
of Viet Nam expanded its outstanding bonds by 16% during
the year, the biggest increase came from bonds issued by the
newly established3 Viet Nam Development Bank (VDB), whose
outstanding issues now comprise 30% of the public bond
total. Although short term central bank bills comprise under
3% of total government debt as of end-2007, this is expected
to increase as the State Bank of Viet Nam now uses these
instruments as a policy tool to drain liquidity. For example,
it issued VND20 trillion in short term bills (equivalent to
15% of end-2007 government bonds outstanding) to banks
in March 2008, on a compulsory basis, as inflation rates
soared. Rapid growth in new issuance is likely to continue, as
the government increasingly relies on the LCY bond market
to finance infrastructure development. The State Treasury
intends to increase issuance in 2008 by 55% over its 2007
goal in order to meet its infrastructure targets.
In Malaysia (36%), Bank Negara Malaysia (BNM), the central
bank, continued its policy of issuing monetary notes (BNMNs)
to absorb excess liquidity. The gradual improvement in the
budget deficit—and the upgrading of the S&P’s foreign-
currency outlook for Malaysia to positive—has led to significant
cross-border capital inflows, resulting in the MYR appreciating
6.5% against the US dollar during 2007. Conventional and
Islamic BNMNs, first introduced in December 2006, now
account for nearly 25% of total government debt as at end-
2007. Malaysian Government Security (MGS) issuance has
also increased, principally to help finance the infrastructure
requirement of the 9th Malaysian Plan. The maturities of
new issues of MGS were used to fill gaps in the existing
government bond benchmark yield curve.
Total PRC government bonds outstanding (33%) continued
to rise in 2007. Bonds issued by government policy banks
and other financial institutions—obligations guaranteed by
the central government—are now classified as government
3 The Viet Nam Development Bank (VDB), the successor to the Development Assistance Fund, was established in July 2006 to lend funds for infrastructure development and to provide medium- to long-term funds for basic industries. The strategic focus of the VDB appears similar to the People's Republic of China (PRC) China Development Bank, which issued in the PRC debt market until state-owned corporate entities developed the capacity to issue securities in their own name.
•
•
•

A S I A B O N D M O N I T O R
�
bonds.4 Because of the restatement, bill issuance from the
central bank constitutes 20% of the increase in government
bonds outstanding, down from 50% in 2006. Aside from the
reclassification, the largest component (88%) of new issues
was in 10- and 15-year special-purpose notes to finance the
newly-formed China Investment Corporation, the sovereign
wealth fund of the PRC. This issuance program has also
changed the maturity profile of government debt. At end-
2007, government bonds with maturities of 10 years or more
constituted 20% of total government bonds outstanding,
twice the ratio of a year earlier.
Thai government bond issuance (21%) accelerated during
the year, with the central bank providing 80% of new public
debt issuance. This included two large retail bond offerings
during the second half—comprising 30% of the issuance total
for 2007. Despite central bank measures to curtail foreign
capital inflows into LCY-denominated debt instruments, the
Thai baht appreciated 17% against the US dollar. Most of
the foreign inflow went into the equity market, while local
retail investors moved out. To absorb the increased liquidity,
the central bank issued a range of notes in addition to retail
savings bonds. After it announced in February 2008 the lifting
of the previous restrictions on capital imports, net portfolio
flows reversed direction and the THB fell 6% in the following
four weeks.
Indonesia (18%) has seen a steady acceleration in
government bond issuance. In line with much of East Asia,
the largest component of new bond issues was central bank
and government bills—comprising 52% of the issuance total
for 2007. The government also began lengthening maturities
using a bond-switching program. This is a popular method
of refinancing short-term notes into longer maturities. In an
October 2007 switching auction, the government repurchased
various series of bonds maturing in less than 5 years and
4 Previous issues of the Asian Bond Monitor treated People's Republic of China (PRC) state-owned policy banks as corporate issuers, as is often done in command economies with little or no private sector. The data in tables 1 and 2 have been restated to classify policy banks and government-guaranteed financial institutions as government debt—as their risk and issuance pattern is more typical of a government agency than a commercial corporation. The reclassification means the size of the PRC corporate bond market is now restated as 9% of total LCY bonds outstanding at end-June 2007 instead of 33%. Adjusted by this reclassification, growth rates for PRC’s corporate bond market were 157% instead of 32% in 2005, 59% instead of 35% in 2006, and 39% instead of 29% in 2007. Correspondingly, the restated government bond market growth has averaged a 1.7% per year lower rate than before reclassification.
•
•

A S I A B O N D M O N I T O R
10
encouraged investors to switch into higher-yielding bonds
maturing in 2023. This resulted in small illiquid short-term
securities being replaced by a larger and more liquid, 15-year
benchmark bond. Like several other markets in the region,
Indonesia has also been experimenting with retail bonds,
offering two series in 2007. Constituting 0.03% of bonds
outstanding, this represents a policy initiative to give retail
access to savings products rather than a fundamental change
in the issuance strategy. The government also continued
offering zero-coupon bonds and launched a 5-year note in
November.
Singapore (14%) continued its program of shaping its LCY
government bond yield curve to comply with a strategy of
providing more long-term liquidity to help finance the region’s
investment needs. In addition to supporting its 15-year note
series, the Monetary Authority of Singapore launched a new
20-year bond and a new series of 5-year notes. It re-opened
existing notes in key maturities with over 20% of the year’s
issuance, further deepening the market. A significant part of
the increase (58%) in the first half of 2007 was in short-term
bill issuance. Despite the significant new supply, safe-haven
interest from foreign investors pushed the Singapore dollar
up more than 6% against the US dollar during the second
half of the year.
In Hong Kong, China (4%), the Hong Kong Monetary Authority
proceeded with its 2006 plan to extend the maturity of the
LCY yield curve beyond 10 years. It launched a new 15-
year bond on a semiannual program and stopped issuing its
7-year note. There is still considerable work to be done in
creating a liquid benchmark of 10 years or more, as 53% of
the government market is still issued in its highly liquid bills
market with another 39% issued in bonds with maturities of
1 to 5 years.
Korea’s government bond market’s growth (3%) slowed
as the government continued to try to reduce its public
debt stock below 50% of GDP. Separating the central
bank’s Monetary Stabilization Bond (MSB) issues from the
aggregate, the balance of benchmark bonds and bills grew
by a somewhat stronger 6%. The MSB balance declined 7%
during the second quarter as the liquidity excess subsided
and buying pressure on the won reversed, resulting in almost
•
•
•

A S I A B O N D M O N I T O R
11
a 1% decline for the year—after appreciating 28% over the
previous 3 years. This reduction of quantitative intervention
was mirrored by an increase in price intervention, as the
Bank of Korea, the central bank, raised its policy rate twice
during the third quarter.
The Philippine treasury market grew moderately (2%) in
the second half of the year, after declining in the first half.
Although the stock of traditional bonds and bills aimed at
the primary market declined for the year as a whole, the
introduction of retail treasury bonds in July 2007 offset this.
Retail bonds now comprise 3% of the value of LCY government
bonds outstanding. The one-off sale of several public assets
in December 2007 reduced bond refinancing requirements
by a further 3% of the end-2006 figure. Higher tax revenues
helped reduce the final budget deficit to 0.1% of GDP,
further reducing the need for government debt issuance. As
a result of the reduced requirements for debt financing, the
government concentrated issues in the 91-day bill market
to maintain liquidity in this key benchmark maturity. The
improved fiscal deficit also allowed the government to alter
the composition of its total debt profile in favor of local
currency—a buy-back program reduced the foreign currency
bond stock by 8%.
East Asian corporate bond markets expanded 20% in 2007, as a much greater diversity of highly-rated issuers accessed the markets, suggesting that the initial impact of the global credit crisis was limited.
Regional aggregate growth in corporate bond markets was 2.7
percentage points greater than in 2006. Indonesia, Philippines,
and Viet Nam have begun to harvest the fruit of years of policy
reforms, with Viet Nam seeing its corporate bonds outstanding
surpass 10% of the market total for the first time (Figure �).
In addition, Malaysia and Korea enjoyed a return to significant
growth. During 2007, emerging East Asia’s corporate bond market
continued to grow as a percentage of GDP—to 17.4%.
Because of difficult global credit conditions for structured
transactions, it is not surprising that the picture for securitization
of East Asian corporate bond markets is less clear. Aggregate
issuance in the region grew 25% to USD18.3 billion during 2007
but it was concentrated in the first half and was far from uniform.
•
Figure 3: Growth of Emerging East Asian Local Currency Corporate Bond Markets in 2007 (%)
Sources: People’s Republic of China (ChinaBond); Hong Kong, China (Hong Kong Monetary Authority); Indonesia (Indonesia Stock Exchange and Bank Indonesia); Republic of Korea (KoreaBondWeb); Malaysia (Bank Negara Malaysia); Philippines (Bloomberg LP); Singapore (Bloomberg LP); Thailand (Bank of Thailand); Viet Nam (Bloomberg LP); and Japan (Japan Securities Dealers Association).
Japan
Emerging East AsiaViet NamThailand
SingaporePhilippines
MalaysiaKorea, Rep. of
IndonesiaHong Kong, China
China, People's Rep. of
0 10 20 30 40 50 60
251.33%
A S I A B O N D M O N I T O R
12
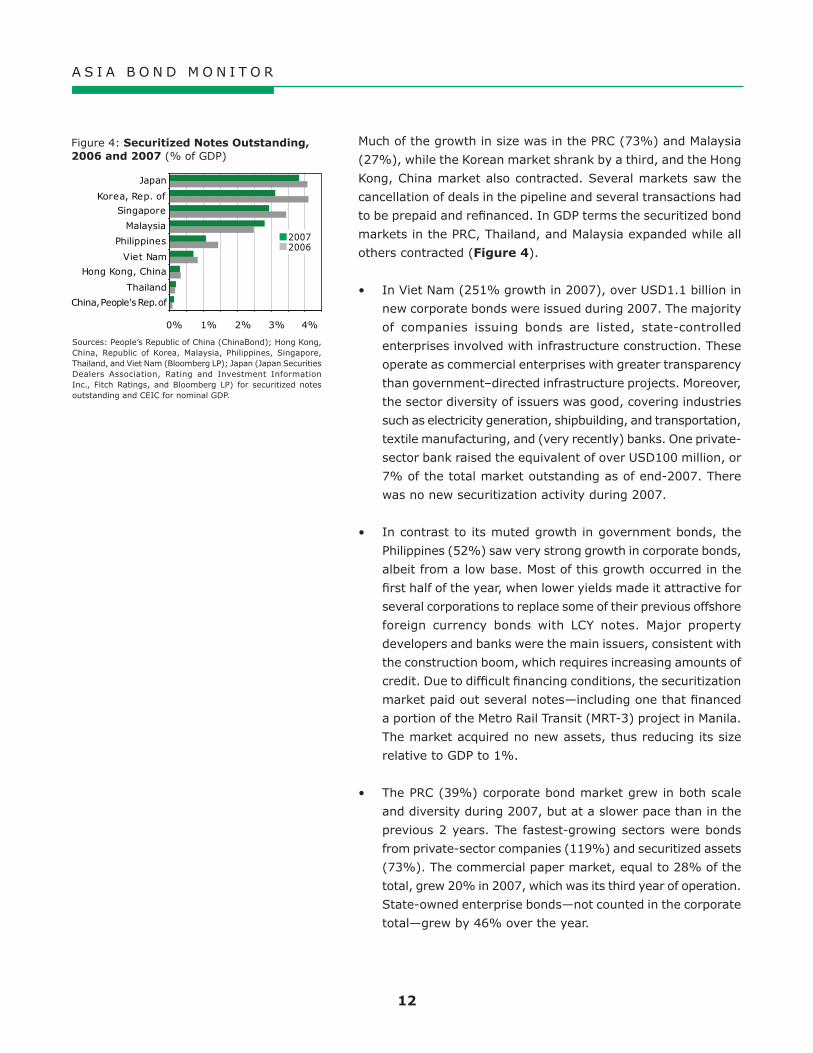
Much of the growth in size was in the PRC (73%) and Malaysia
(27%), while the Korean market shrank by a third, and the Hong
Kong, China market also contracted. Several markets saw the
cancellation of deals in the pipeline and several transactions had
to be prepaid and refinanced. In GDP terms the securitized bond
markets in the PRC, Thailand, and Malaysia expanded while all
others contracted (Figure �).
In Viet Nam (251% growth in 2007), over USD1.1 billion in
new corporate bonds were issued during 2007. The majority
of companies issuing bonds are listed, state-controlled
enterprises involved with infrastructure construction. These
operate as commercial enterprises with greater transparency
than government–directed infrastructure projects. Moreover,
the sector diversity of issuers was good, covering industries
such as electricity generation, shipbuilding, and transportation,
textile manufacturing, and (very recently) banks. One private-
sector bank raised the equivalent of over USD100 million, or
7% of the total market outstanding as of end-2007. There
was no new securitization activity during 2007.
In contrast to its muted growth in government bonds, the
Philippines (52%) saw very strong growth in corporate bonds,
albeit from a low base. Most of this growth occurred in the
first half of the year, when lower yields made it attractive for
several corporations to replace some of their previous offshore
foreign currency bonds with LCY notes. Major property
developers and banks were the main issuers, consistent with
the construction boom, which requires increasing amounts of
credit. Due to difficult financing conditions, the securitization
market paid out several notes—including one that financed
a portion of the Metro Rail Transit (MRT-3) project in Manila.
The market acquired no new assets, thus reducing its size
relative to GDP to 1%.
The PRC (39%) corporate bond market grew in both scale
and diversity during 2007, but at a slower pace than in the
previous 2 years. The fastest-growing sectors were bonds
from private-sector companies (119%) and securitized assets
(73%). The commercial paper market, equal to 28% of the
total, grew 20% in 2007, which was its third year of operation.
State-owned enterprise bonds—not counted in the corporate
total—grew by 46% over the year.
•
•
•
Figure 4: Securitized Notes Outstanding, 200� and 2007 (% of GDP)
Sources: People’s Republic of China (ChinaBond); Hong Kong, China, Republic of Korea, Malaysia, Philippines, Singapore, Thailand, and Viet Nam (Bloomberg LP); Japan (Japan Securities Dealers Association, Rating and Investment Information Inc., Fitch Ratings, and Bloomberg LP) for securitized notes outstanding and CEIC for nominal GDP.
0% 1% 2% 3% 4%
20072006
Thailand
Hong Kong, China
Viet Nam
Philippines
Malaysia
Singapore
Korea, Rep. of
Japan
China, People's Rep. of

A S I A B O N D M O N I T O R
1�
Indonesia’s (29%) corporate bond market quadrupled its
previous year’s growth rate. Reforms to the secondary
market—making its pricing more transparent—combined
with tax incentives for listed companies, led to a significant
increase the number of new issues. Clarification of accounting
rules for mutual funds and for bank investments also created
substantial new demand for LCY bonds. A decline in bond
yields during the first half of the year also helped attract more
issuers, especially in the popular 5-year tenor.
In Korea (22%), the corporate bond market growth continued
to accelerate in 2007, led by financial institutions, whose
bonds outstanding grew 29%. Increasing competition for
deposits from securities companies offering cash-management
accounts over the last year has forced banks to raise more
funds from the short-term bond market—both onshore and
offshore. The majority of corporate issues remained at 2- and
3-year tenors. The asset-backed securities market declined
throughout 2007, falling rapidly during the second half in
response to increased worries about the reliability of ratings
in the face of rising default rates on credit cards and other
loans. It was the second-weakest-performing securitization
market in the region during 2007, after several years of
strong growth.
Malaysia’s (17%) corporate bond market grew at a faster
pace than in the last 2 years, but only half the rate of the
government bond market. Islamic securities comprised
61% of the new bonds, including some issues by property
developers from the Middle East and other foreign companies.
In both the conventional and Islamic markets, financial
issuers accounted for the largest portion of the increase, with
infrastructure—especially utilities—next. A significant factor
in corporate bond market growth and its appeal to foreign
issuers in 2007 has been the rapid expansion of coverage
by the independent bond-pricing agency, Bondweb Malaysia
Sdn Bhd, established in 2006. Several new corporate market
issues were in the form of securitized notes, which contributed
to the 27% growth in that sector during the year.
In Singapore (8%), the corporate bond market growth
was similar to 2006 but remained below the growth in the
government bond market. Financial market uncertainty
during the second half of 2007, discouraged many potential
•
•
•
•

A S I A B O N D M O N I T O R
1�
issuers as credit spreads widened. The number of foreign
issuers also dropped off slightly. While property developers
and real estate investment trusts (REITs) provided most
of the new supply during the first half, banks became the
main issuers in the second half of the year. The shoring up
of capital with subordinated bonds became more common
while some issuers began to rely on the equity market’s
strength to issue convertible bonds as a way to lower yields.
Several new REITs planned for the second half of the year
were delayed by market turbulence. While the stock of LCY
securitized instruments increased slightly it did not match
the growth in GDP.
Thailand’s (4%) corporate bond market grew slower than in
the previous 2 years—despite a significant decline in market
yields during the first half of 2007. Many issuers appeared
to still be waiting for a clear sign that yields had bottomed
out when the market reversed direction in August. Under the
influence of falling rates and surging foreign portfolio inflows,
the equity market became a more attractive source of funds
during the first 9 months of the year. The securitization market
in Thailand expanded 13% in 2007 to 0.2% of GDP.
Hong Kong, China (2%) saw slower growth in its LCY corporate
bond market than in its much smaller government market.
Banks and property companies were the largest issuers, with
a number of banks from around the region taking advantage
of the low LCY yields available during the second half of the
year. These deals tended to be in 2- and 3-year maturities,
with a substantial number of banks also issuing HIBOR-based
floating rate notes to take advantage of the liquid LCY swap
market. In addition, a growing number of PRC banks and
companies issued bonds in the LCY market before swapping
part of those issues into CNY. Without any new securitization
deals the LCY market for securitized notes eroded slightly
during the year.
•
•

A S I A B O N D M O N I T O R
1�
Turnover
Turnover, a measure of market liquidity, increased in most emerging East Asian government markets in 2007, but remained weak in most of the region’s corporate markets.
Government bond market turnover in emerging East Asia generally
rose in response to deepening yield curves and a combination
of falling yields in the first 6 months of the year and a flight to
safety in the second half. A shortage of new bond supply reduced
government bond turnover ratios in Korea and the Philippines,
while a surge in the supply of new higher-yielding corporate paper
severely reduced turnover in government securities in Viet Nam
(Figure �).
The region’s corporate bond market turnover fell in the PRC,
Korea, and Malaysia, which all experienced moderate declines in
corporate liquidity as yields, and credit spreads rose during the
year. There was little change in corporate turnover ratios in Hong
Kong, China; or Thailand. But Indonesia had a healthy increase
in liquidity on the back of accelerating issuance and renewed
investor interest. (Figure �).
In the PRC, bond market turnover was mixed in the midst
of turbulent market conditions—inflation increased to
4.8%, interest rates rose by more than 1%, and equity
markets surged 126% on the Shanghai Stock Exchange by
October 2007, before pulling back 21% by the end of the
year. Government bond market turnover rose 30% to 1.46
times the average value of bonds outstanding for the year.
Despite the issue of more long-dated corporate bonds and
a more diversified issuers base, corporate trading fell 37%
to a ratio of 2.29 for the year, compared with the very high
3.60 ratio in 2006. New corporate bond supply from power
generators, airlines, and property developers met good
demand from insurance companies, who are principally buy-
and-hold investors, and mutual funds. Ninety-four percent
of corporate bond trading is done on the interbank bond
market, under central bank supervision. The rest is traded
on the Shanghai Stock Exchange, where outright trading in
corporate bonds remains subdued. However, insurance and
securities companies and mutual funds use the exchange
increasingly to execute repurchase agreements for Treasury
•
0.0 0.5 1.0 1.5 2.0 2.5 3.0 3.5 4.0
China, People's Rep. of
Japan
Thailand
Malaysia
Korea, Rep. of
Indonesia
Hong Kong, China
200720062005
Figure 6: Corporate Bond Turnover Ratios1
1 Calculated as LCY trading volume (sales amount only) divided by average LCY value of outstanding bonds during each full-year period.
Sources: People’s Republic of China (ChinaBond); Hong Kong, China (Hong Kong Monetary Authority); Indonesia ( Indonesia Stock Exchange); Republic of Korea (KoreaBondWeb); Malaysia (Bank Negara Malaysia); Thailand (Thai Bond Market Association) and Japan (Japan Securities Dealers Association).
Figure 5: Government Bond Turnover Ratios1
1 Calculated as LCY trading volume (sales amount only) divided by average LCY value of outstanding bonds during each full-year period.
Sources: People’s Republic of China (ChinaBond); Hong Kong, China (Hong Kong Monetary Authority); Indonesia ( Indonesia Stock Exchange); Republic of Korea (KoreaBondWeb); Malaysia (Bank Negara Malaysia); Philippines (Bureau of the Treasury); Singapore (Monetary Authority of Singapore); Thailand (Thai Bond Market Association); Viet Nam (CEIC) and Japan (Japan Securities Dealers Association).
0 1 10 100
China, People's Rep. of
Japan
Viet NamThailand
SingaporePhilippines
MalaysiaKorea, Rep. of
Indonesia
Hong Kong, China
200720062005

A S I A B O N D M O N I T O R
1�
bonds—exchange based turnover of repos in 2007 nearly
equaled that of Treasury bond turnover on the interbank
market.
In Hong Kong, China the combination of active equity issuance,
particularly for PRC-based firms—and increasing financial
integration with PRC markets—led to rapid capital flows to
and from local markets. The depth of the local money market
(96% of government securities turnover) accommodated
this turbulence with relatively little disturbance to the real
economy. The magnitude of these flows appeared in a 31%
rise in the already high turnover levels for government
securities—to 91 times the average value outstanding.
Bills market turnover rose 31% to 163 times average bills
outstanding while the notes market turnover rose 110% to
9 times average notes outstanding. A rise in both foreign
currency and LCY corporate bond issuance also supported
a moderate increase in the corporate market’s turnover, to
0.17 times the average value outstanding.
Indonesia continued its strong increase in bond market
liquidity during 2007. Improved price transparency and
consistent accounting treatment were the biggest factors
in investor’s willingness to trade the market rather than
purchasing bonds and holding them to maturity. October’s
switch auction also stimulated trading by repricing a large
group of outstanding bonds against a specific offer. Such
repricings tend to draw other investors into the market
in search of similar yields. Turnover in the government
sector rose 64% to 1.44 times the average value of bonds
outstanding, while corporate bond market liquidity improved
by a similar amount to 0.49 times.
Korean bond market turnover in 2007 continued its declining
trend, observed since 2002. Bond futures contracts trading
volume has also fallen considerably while futures monthly
open interest5 is rising—suggestive of changing investor
behavior to a more passive portfolio management style. While
higher interest rates caused trading to contract, high levels of
un-invested cash during the first half allowed new issues to
be purchased by investors without significant sales of older
issues to raise cash. The pattern of passive investing was
5 Open interest in government bond futures is the outstanding number of bond futures contracts at the end of the trading period.
•
•
•

A S I A B O N D M O N I T O R
17
further supported by the relatively short maturity of bonds
and the fact that more than half the year’s new supply of
bonds were issued during the first half. There is little incentive
to actively switch bonds from portfolios if there is a lack of
fresh supply of longer dated instruments. Government bond
turnover fell to 1.49 times the average value of outstanding
bonds, while the corporate sector also fell to 0.43 times.
In Malaysia, turnover rose 26% to 2.47 times average value
of outstanding bonds, led during the second half of the year
by BNMN issues, actually meant to absorb excess liquidity.
BNMN turnover doubled to 3.73 times their average value.
Trading in longer-term government bonds also improved after
a switch auction allowed investors to trade in older notes for
new issues focused on the benchmark 3-, 5-, and 10-year
maturities. By comparison, the corporate bond market saw
turnover decline for a second year—by 14% to 0.51 times the
2007 average value outstanding. The steepening yield curve
during the second half created some opportunities for traders,
but overall the market’s liquidity declined over the period
because of increased uncertainty. Rapid MYR appreciation
during the second half brought some new buyers of short-
term notes to the market, but the bias of most investors
remained toward holding positions until maturity, especially
in the corporate sector.
Philippine government bond market turnover declined for
a second year to 1.41 times the average value of bonds
outstanding, amid weak overall growth in supply and several
fiscal and monetary policy adjustments. After falling during
the first quarter of 2007, interest rates rose over the rest of
the year, deterring some traders. The absence of a regular
Bureau of the Treasury issuance calendar discouraged trading
as only 91-day bills were consistently offered to the market.
The bond supply aimed at institutional investors declined for
a second consecutive year, making it difficult for investors
to trade. The phasing in of regulatory changes to over-the-
counter trading rules (OTC rules) in 2007 may also have
contributed to the drop in turnover ratio.
Singapore’s investors and traders responded to the increased
supply of benchmark government bonds with a commensurate
increase in trading. Turnover rose 15% to 2.99 times the
average value of government bonds outstanding during the
•
•
•

A S I A B O N D M O N I T O R
18
year. The impact of the subprime credit crisis was evident
during the second half and new bond issues were virtually
limited to government markets. Trading of new corporate
issues slowed and traders and investors sought refuge in low
risk government debt.
In Thailand, new bonds issued by the central bank had
the highest turnover ratio—7.28 times the average value
outstanding. This helped lift overall government bond
turnover 110% to 3.53 times. This may have drawn some
liquidity away from the corporate market, but a steep decline
in market yields during the first half balanced this trend,
keeping corporate market turnover at the same rate as in
2006—0.15 times the average value of bonds outstanding.
Trading in Viet Nam’s government bonds slowed by almost
50%, returning to its 2005 level of 0.37 times the average
value of government bonds outstanding. Despite an 83%
increase in the stock of tradable bonds during the year,
government interest rate ceilings frequently made the bonds
unattractive. This was resolved in November 2007 when the
government removed rate ceilings and allowed the market to
set rates. Market yields rose 40bp to 120bp within a matter
of weeks and trading activity surged.
Bond Yields
Heightened inflation risk and fear of an external demand shock led to increased volatility in LCY yield curves in 2007, when the trend was toward steeper yield curves.
Domestic and imported inflation began to appear in many markets,
even as some central banks were still easing interest rates during
the first quarter of the year. These inflationary expectations led
most yield curves to steepen by the end of March 2007, with the
exceptions of Thailand and Malaysia, where demand for longer-
dated debt instruments was still strong and yield curves flattened.
However, by the end of the second quarter, these yield curves
had also steepened. By mid-year interest rates in most markets
were higher than end-2006 and most yield curves had steepened
considerably. The exceptions were Indonesia, which continued to
ease policy rates, and the Philippines, which saw its yield curve
•
•

A S I A B O N D M O N I T O R
1�
flatten because of a tightening policy during the second quarter.
External credit tightening—triggered by the US credit squeeze
and the subsequent fear of a demand shock—caused yields in
some markets to follow the US and fall again during the second
half (Philippines; Singapore; and Hong Kong, China). But a
majority of markets remained more worried about inflation as
higher prices for crude oil and food such as grains and palm oil
carried through to producers and consumers (PRC, Indonesia,
Korea, Malaysia, and Thailand) (Figure 7). Short-term interest
rates rose in the fourth quarter of 2007 in all markets except
Hong Kong, China and Singapore, where they fell. Over the first
quarter of 2008 the US Fed’s drastic rate cuts pulled short-term
rates down in all markets but the Philippines—although the extent
of the rate reductions varied. With the exception of the PRC and
the Philippines, yield curves in 2008 have steepened from a year
earlier (Figures 8, �).
In the PRC continuously rising inflation became a major
concern of the central bank, which employed increasingly
aggressive tightening measures. Policy rates rose more than
100bp during the first half and the yield curve, as indicated by
the 2–10 year yield curve spread,6 steepened almost 40bp. As
the central bank tightened more aggressively in the second
half and foreign investment inflows slowed, short-term rates
rose much faster than 10-year yields, causing the yield curve
to flatten by 40bp. After the US Fed aggressively cut its rates
in 1Q08, the CNY yield curve flattened to 22bp below where
it was in January 2007.
Hong Kong, China’s yield curve steepened until the third
quarter, closely tracking yield curve movements in the
US—largely because of the Hong Kong dollar currency peg.
Heightened inflation concerns drove bond pricing and yields up
100bp in 10-year bonds, but by less at the shorter maturities.
As a result, the yield curve spread steepened from 20bp at
end-2006 to 41bp at mid-year 2007. The credit squeeze in
the US caused local markets to tighten somewhat—despite
the ample liquidity inflows for subscriptions to equity
listings of PRC companies. Stock and equity issuance slowed
6 In any discussion of yield curve movements the 2-10 year yield spread is used. The spread is calculated by subtracting the yield on the 2-year local currency government bond from the yield of the 10-year local currency government bond. If the result is positive, the yield curve is said to be normal. If the result is negative the yield curve is said to be inverted. The greater the absolute number, the “steeper” the slope of the curve. Yield curves can be normal, flat, or inverted. Both normal and inverted curves can be steep.
•
•

A S I A B O N D M O N I T O R
20
Figure
7:
Co
mm
od
itie
s D
aily T
rad
ing
Pri
ces
(USD
)
Sourc
es:
Blo
om
ber
g L
P an
d R
eute
rs.
2500
3000
3500
4000
4500
5000
Jan-
07
Feb-
07
Mar
-07
Apr-
07
May
-07
Jun-
07
Jul-
07
Aug-
07
Sep
-07
Oct
-07
Nov-
07
Dec
-07
Jan-
08
Feb-
08
Mar
-08
USD / 64 mb, 133 mhz
Chip
2200
2500
2800
3100
3400
Jan- 07
Feb-
07M
ar-
07Apr
-07
May
-07
Jun-
07Ju
l-07
Jul-
07Aug
-07
Sep
-07
Oct
-07
Nov
-07
Dec
-07
Jan- 08
Feb-
08M
ar-
08
USD / metric ton
Alu
min
um
50
60
70
80
90
100 Ja
n-
07
Feb-
07
Mar
-07
Apr-
07
May
-07
Jun-
07
Jul-
07
Aug-
07
Sep
-07
Oct
-07
Nov-
07
Dec
-07
Jan-
08
Feb-
08
Mar
-08
USD / lb
Cott
on
500
700
900
1100
1300
1500
Jan-
07
Feb-
07
Mar
-07
Apr-
07
May
-07
Jun-
07
Jul-
07
Aug-
07
Sep
-07
Oct
-07
Nov-
07
Dec
-07
Jan-
08
Feb-
08
Mar
-08
USD / tonne
Palm
Oil
750
800
850
900
950
1000
Jan-
07
Feb-
07
Mar
-07
Apr-
07
May
-07
Jun-
07
Jul-
07
Aug-
07
Sep
-07
Oct
-07
Nov-
07
Dec
-07
Jan-
08
Feb-
08
Mar
-08
MYR / kg
Rubber
9000
1200
0
1500
0
1800
0
2100
0 Jan-
07
Feb-
07
Mar
-07
Apr-
07
May
-07
Jun-
07
Jul-
07
Aug-
07
Sep
-07
Oct
-07
Nov-
07
Dec
-07
Jan-
08
Feb-
08
Mar
-08
USD / metric ton
Tin
10
12
14
16
18 Ja
n-
07
Feb-
07
Mar
-07
Apr-
07
May
-07
Jun-
07
Jul-
07
Aug-
07
Sep
-07
Oct
-07
Nov-
07
Dec
-07
Jan-
08
Feb-
08
Mar
-08
USD / lb
Sugar
500
650
800
950
1100 Ja
n-
07
Feb-
07
Mar
-07
Apr-
07
May
-07
Jun-
07
Jul-
07
Aug-
07
Sep
-07
Oct
-07
Nov-
07
Dec
-07
Jan-
08
Feb-
08
Mar
-08
USD / troy oz
Gold
10
13
16
19
22 Ja
n-
07
Feb-
07
Mar
-07
Apr-
07
May
-07
Jun-
07
Jul-
07
Aug-
07
Sep
-07
Oct
-07
Nov-
07
Dec
-07
Jan-
08
Feb-
08
Mar
-08
USD / troy oz
Silv
er
40
60
80
100
120 Ja
n-
07
Feb-
07
Mar
-07
Apr-
07
May
-07
Jun-
07
Jul-
07
Aug-
07
Sep
-07
Oct
-07
Nov-
07
Dec
-07
Jan-
08
Feb-
08
Mar
-08
USD / barrel
Bre
nt
Cru
de
Oil
1000
1300
1600
1900
2200
2500 Ja
n-
07
Feb-
07
Mar
-07
Apr-
07
May
-07
Jun-
07
Jul-
07
Aug-
07
Sep
-07
Oct
-07
Nov-
07
Dec
-07
Jan-
08
Feb-
08
Mar
-08
USD / troy oz
Plat
inum
5000
5800
6600
7400
8200
9000 Ja
n-
07
Feb-
07
Mar
-07
Apr-
07
May
-07
Jun-
07
Jul-
07
Aug-
07
Sep
-07
Oct
-07
Nov-
07
Dec
-07
Jan-
08
Feb-
08
Mar
-08
USD / metric ton
Copper

A S I A B O N D M O N I T O R
21
Figure
8:
Inte
rest
Rate
Sp
read
—2
-Year
an
d 1
0-Y
ear
Lo
cal C
urr
en
cy B
on
ds
Sourc
e: A
sian
BondsO
nlin
e.
-30
10
50
90
130
170
210
250 Ja
n-
07
Feb-
07
Mar
-07
Apr-
07
May
-07
Jun-
07
Jul-
07
Aug-
07
Sep
-07
Oct
-07
Nov-
07
Dec
-07
Jan-
08
Feb-
08
Mar
-08
Spread (basis points)
Hong K
ong,
Chin
a
US
-30
10
50
90
130
170
210 Ja
n-07
Feb-
07M
ar-
07Apr
-07
May
-07
Jun-
07Ju
l-07
Aug
-07
Sep
-07
Oct
-07
Nov
-07
Dec
-07
Jan-
08Fe
b-08
Mar
-08
Spread (basis points)
Chin
a, P
eople
's R
ep.
of
US
-500
50
100
150
200
250 Ja
n-
07
Feb-
07
Mar
-07
Apr-
07
May
-07
Jun-
07
Jul-
07
Aug-
07
Sep
-07
Oct
-07
Nov-
07
Dec
-07
Jan-
08
Feb-
08
Mar
-08
Spread (basis points)
Kore
a, R
ep.
of
US
-30
20
70
120
170
220 Ja
n-07
Feb-
07M
ar-
07Apr
-07
May
-07
Jun-
07Ju
l-07
Aug
-07
Sep
-07
Oct
-07
Nov
-07
Dec
-07
Jan-
08Fe
b-08
Mar
-08
Spread (basis points)
Indones
iaU
S
-100
-50050
100
150
200 Fe
b-
07
Apr-
07
Jul-
07
Sep
-07
Dec
-07
Mar
-08
Spread (basis points)
Mal
aysi
aU
S
-30
20
70
120
170
220 Ja
n-
07
Feb-
07
Mar
-07
Apr-
07
May
-07
Jun-
07
Jul-
07
Aug-
07
Sep
-07
Oct
-07
Nov-
07
Dec
-07
Jan-
08
Feb-
08
Mar
-08
Spread (basis points)
Phili
ppin
esU
S
-30
10
50
90
130
170
210
250 Ja
n-
07
Feb-
07
Mar
-07
Apr-
07
May
-07
Jun-
07
Jul-
07
Aug-
07
Sep
-07
Oct
-07
Nov-
07
Dec
-07
Jan-
08
Feb-
08
Mar
-08
Spread (basis points)
Sin
gap
ore
US
-30
10
50
90
130
170
210 Ja
n-
07
Feb-
07
Mar
-07
Apr-
07
May
-07
Jun-
07
Jul-
07
Aug-
07
Sep
-07
Oct
-07
Nov-
07
Dec
-07
Jan-
08
Feb-
08
Mar
-08
Spread (basis points)
Thai
land
US
-300
30
60
90
120
150
180
210 Ja
n-
07
Feb-
07
Mar
-07
Apr-
07
May
-07
Jun-
07
Jul-
07
Aug-
07
Sep
-07
Oct
-07
Nov-
07
Dec
-07
Jan-
08
Feb-
08
Mar
-08
Spread (basis points)
Japan
US

A S I A B O N D M O N I T O R
22
Figure
9:
Ben
chm
ark
Yie
ld C
urv
es—
Lo
cal C
urr
en
cy G
overn
men
t B
on
ds
Sourc
e: A
sian
BondsO
nlin
e.
Mala
ysi
a
2345
05
10
15
20
25
30
Tim
e to
mat
urity
(yea
rs)
Yield (%)
3-J
an-0
731-M
ar-0
8
Kore
a, Rep. of
02356
05
10
15
20
25
30
Tim
e to
mat
urity
(yea
rs)
Yield (%)
3-J
an-0
731-M
ar-0
8
Chin
a, People
's R
ep. of
012345
05
10
15
20
25
30
Tim
e to
mat
urity
(yea
rs)
Yield (%)
2-J
an-0
731-M
ar-0
8
Indonesi
a
57911
13
05
10
15
20
25
30
Tim
e to
mat
urity
(yea
rs)
Yield (%)
3-J
an-0
731-M
ar-0
8
US
0123456
05
10
15
20
25
30
Tim
e to
mat
urity
(ye
ars)
Yield (%)3-J
an-0
731-M
ar-0
8
Sin
gapore
012345
05
10
15
20
25
30
Tim
e to
mat
urity
(yea
rs)
Yield (%)
3-J
an-0
731-M
ar-0
8
Thaila
nd
02468
05
10
15
20
25
30
Tim
e to
mat
urity
(yea
rs)
Yield (%)
3-J
an-0
731-M
ar-0
8
Hong K
ong, C
hin
a
01234
05
10
15
20
25
30
Tim
e to
mat
urity
(yea
rs)
Yield (%)
3-J
an-0
731-M
ar-0
8
Japan
012345
05
10
15
20
25
30
Tim
e to
mat
urity
(yea
rs)
Yield (%)
4-J
an-0
731-M
ar-0
8
Phili
ppin
es
35689
05
10
15
20
25
30
Tim
e to
mat
urity
(yea
rs)
Yield (%)
3-J
an-0
731-M
ar-0
8
Vie
t N
am
678910
05
10
15
20
25
30
Tim
e to
mat
urity
(yea
rs)
Yield (%)
3-J
an-0
731-M
ar-0
8

A S I A B O N D M O N I T O R
2�
dramatically as a result of the darkening global mood and
initial public offering—related balances in banks drained away.
Successive policy rate cuts by the US Fed led the Hong Kong
Monetary Authority to follow and local rates fell by as much as
they had risen earlier. However, uncertainty and increasingly
volatile cash balances to and from the PRC meant that the
Hong Kong, China yield curve spread fluctuated more wildly
than the US yield curve in the latter part of 2007. From the
beginning of 2007 until end-March 2008, the local currency
yield curve has steepened by 115bp while the US yield
curve steepened 188bp during the same period. Persistent
worries over inflation continue in the face of an economic
slowdown.
In Indonesia, the monetary easing beginning in 2006
continued through most of 2007, as the central bank reduced
its policy rate by a total of 150bp in six increments of 25bp.
During the first half, demand for longer-dated bonds was
strong as the market expected more rate cuts and the yield
curve spread flattened by 39bp. Although money-market rates
continued to follow the policy rate lower in the third quarter,
bond yields increased 25–75bp in response to concerns about
global credit conditions. From a low of 93bp in the 2–10yr
yield curve spread in September 2007, it has steepened to
189bp by the end of March 2008, the result of long-term yields
rising by over 150bp. Half of that 96bp steepening occurred
following the US Fed's drastic rate cuts.
Korean bond yields rose slightly across the yield curve during
the year. The central bank’s efforts to restrain excess liquidity
first with quantitative, and later with policy rate, intervention
raised interbank rates 21bp over the first half of 2007. A
sudden 20bp steeping of the yield curve during the second
quarter was prompted by rising inflation and early warnings of
property defaults in the US. When the central bank raised its
policy rates in two increments of 25bp during the third quarter,
the yield curve flattened by 50bp and was inverted by year-
end as fears switched from inflation to economic slowdown.
When the US Fed cut rates aggressively in January 2008,
the Korean yield curve normalized from its inverted slope of
-23bp to 19bp, reflecting a significant decline in the demand
for short-term funds in the economy. The longer-term yields
rose in response to a steady and rapid rise in inflation, which
almost doubled during the last 6 months of 2007.
•
•

A S I A B O N D M O N I T O R
2�
In Malaysia, the yield curve was almost flat for the first 9
months of the year due to strong demand for longer-dated
bonds by international investors expecting a combination
of currency appreciation and lower short-term rates. In
response to the central bank’s active issuance of BNMNs to
absorb liquidity, the yield on short- to medium-term notes
fell slightly over the course of the year. Longer-dated bond
yields fell slightly during the first half, in line with the short-
term market, before rising 47bp to finish the year above
4%, in response to growing concerns about inflation. As a
result, the yield curve steepened by 37bp during the last 3
months of 2007. Yet, growing concerns over slowing external
markets and increased political tensions at home pulled long-
term yields back down 34bp and flattened the yield curve by
14bp over 1Q08.
In the Philippines, excess liquidity in the banking system
during the first quarter of 2007 caused short-term bond
yields to fall significantly and the 2-10yr yield curve spread
steepened from 82bp to 211bp. In the second quarter, the
central bank adopted a tightening stance to battle excess
liquidity, but after the US Fed began cutting rates because
of the credit crisis, the Bangko Sentral ng Pilipinas (BSP)
reversed direction and began easing. The BSP cut its policy
rate four times during the second half. Short-term rates fell
more slowly than 10-year yields largely due to limited supply
of long-dated bonds. As a result the yield curve flattened
to 81bp by end-March 2008 from the highs of 211bp seen
a year earlier. Despite falling yields and a flattening yield
curve, the interest rate differential between the Philippines
and the US has contributed to the peso’s 17% appreciation
during 2007.
Low inflation in Singapore during most of the first half of 2007
led to a decline in short-term rates by more than 50bp. The
government increased its sales tax by two percentage points
in July, just as high food prices reached the local markets
and before US markets began to falter in the face of property
defaults. The domestic interbank market tightened briefly,
but Singapore was seen as a regional safe haven and new
funds poured in from abroad, driving short-term yields down
another 50bp in the second half and the currency up 6.3%
for the year. As a result of large amounts of surplus short-
term cash moving into short-term government bonds, the
•
•
•

A S I A B O N D M O N I T O R
2�
yield curve steepened by 80bp over the course of the year
and another 130bp in the first quarter of 2008, even though
short- to medium-term yields fell by over 50bp.
Thailand’s central bank cut its policy rate by 150bp in four
increments during the first half of 2007 to stimulate domestic
demand as export growth slowed and the currency appreciated.
The yield curve steepened by 83bp to 126bp, reflecting the
market’s preference for short-term instruments. While the
steepening yield curve may have represented increased
inflationary expectations, the appreciating currency—12%
against the US dollar in the same period—held down import
costs and inflation became less of an issue. However the
external market’s turbulence and the approaching domestic
election began to change risk perceptions and led to yields
rising across the curve during the second half. Short-term
yields rose faster than long-term yields, flattening the yield
curve by 17bp. In January 2008, the central bank eased
rates to counter the strong currency with yields falling nearly
100bp. Longer-dated bond yields fell more than short-dated
bond yields due to speculation that the reserve requirement
on debt instruments purchased by international investors
would be abolished, as happened in late February 2008.
After that capital account relaxation, long-term yields rose by
almost 50bp and the yield curve steepened to a level 100bp
higher than in January 2007.
In Viet Nam, the continued high economic expansion brought
large amounts of money into the markets from abroad.
The central bank’s task of controlling inflation was further
complicated by high levels of foreign currency liquidity within
the domestic market. In the first half of 2007, the measures
used were limited to quantitative tightening and attempts at
moral suasion, but the rising cost of finance was insufficient
to slow the economy. A protracted debate ensued between
government factions who were more worried about inflation
and those preferring a policy of cheaper finance, which delayed
a clear policy direction until the fourth quarter. By end-2007,
the central bank finally lifted its lending rates and issued its
own bills to join the Treasury in trying to soak up some of the
excess liquidity. Bank reserve requirements were also lifted.
As a result of these measures market yields, as indicated by
successive new bond issues, increased almost 200bp over
the course of the year and the yield curve steepened by over
50bp in the year to end-March 2008.
•
•
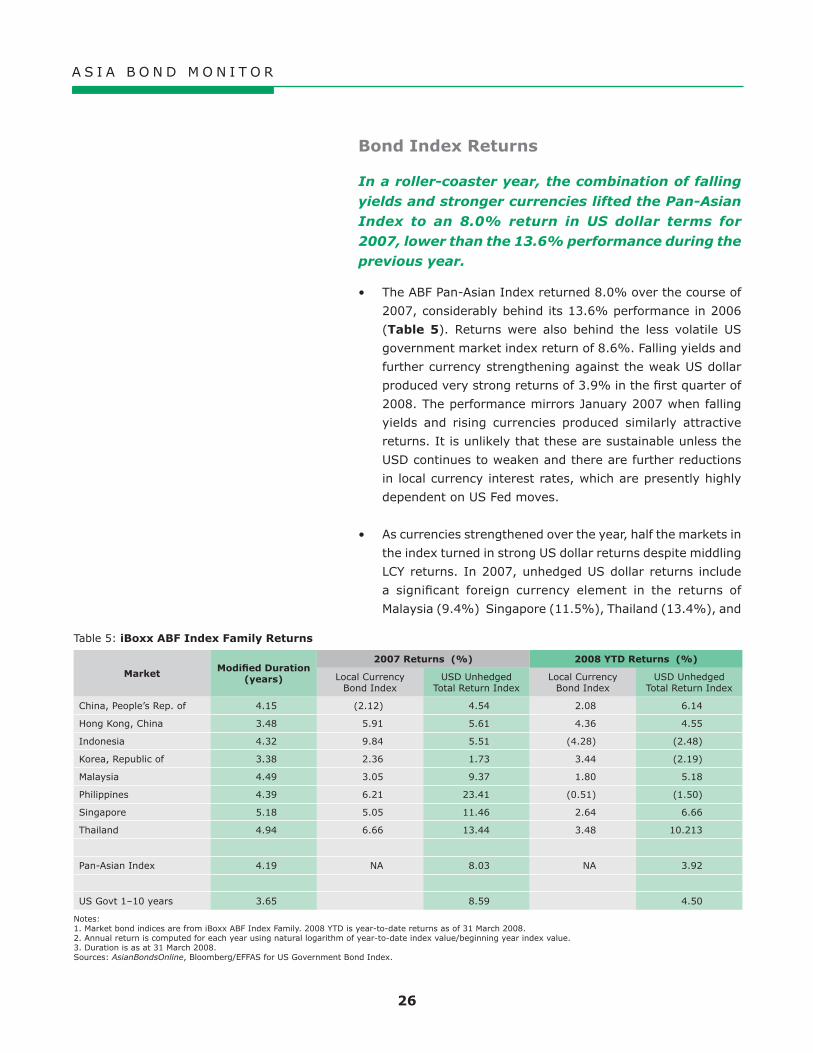
A S I A B O N D M O N I T O R
2�
Bond Index Returns
In a roller-coaster year, the combination of falling yields and stronger currencies lifted the Pan-Asian Index to an 8.0% return in US dollar terms for 2007, lower than the 13.6% performance during the previous year.
The ABF Pan-Asian Index returned 8.0% over the course of
2007, considerably behind its 13.6% performance in 2006
(Table �). Returns were also behind the less volatile US
government market index return of 8.6%. Falling yields and
further currency strengthening against the weak US dollar
produced very strong returns of 3.9% in the first quarter of
2008. The performance mirrors January 2007 when falling
yields and rising currencies produced similarly attractive
returns. It is unlikely that these are sustainable unless the
USD continues to weaken and there are further reductions
in local currency interest rates, which are presently highly
dependent on US Fed moves.
As currencies strengthened over the year, half the markets in
the index turned in strong US dollar returns despite middling
LCY returns. In 2007, unhedged US dollar returns include
a significant foreign currency element in the returns of
Malaysia (9.4%) Singapore (11.5%), Thailand (13.4%), and
•
•
Table 5: iBoxx ABF Index Family Returns
Market Modified Duration (years)
2007 Returns (%) 2008 YTD Returns (%)
Local Currency Bond Index
USD Unhedged Total Return Index
Local Currency Bond Index
USD Unhedged Total Return Index
China, People’s Rep. of 4.15 (2.12) 4.54 2.08 6.14
Hong Kong, China 3.48 5.91 5.61 4.36 4.55
Indonesia 4.32 9.84 5.51 (4.28) (2.48)
Korea, Republic of 3.38 2.36 1.73 3.44 (2.19)
Malaysia 4.49 3.05 9.37 1.80 5.18
Philippines 4.39 6.21 23.41 (0.51) (1.50)
Singapore 5.18 5.05 11.46 2.64 6.66
Thailand 4.94 6.66 13.44 3.48 10.213
Pan-Asian Index 4.19 NA 8.03 NA 3.92
US Govt 1–10 years 3.65 8.59 4.50
Notes:1. Market bond indices are from iBoxx ABF Index Family. 2008 YTD is year-to-date returns as of 31 March 2008.2. Annual return is computed for each year using natural logarithm of year-to-date index value/beginning year index value.3. Duration is as at 31 March 2008.Sources: AsianBondsOnline, Bloomberg/EFFAS for US Government Bond Index.

A S I A B O N D M O N I T O R
27
Philippines (23.4%). Indonesia; Korea; and Hong Kong, China
all lost some return due to weakening currencies. Indonesia
had attractive LCY returns to start with (9.8%) as a result
of central bank easing, but lost 4.3% due to the weakening
rupiah. The PRC was the worst performer in LCY terms, losing
2.12% because of steady tightening throughout the year, but
its solid currency gains (6.7%) produced positive returns in
USD unhedged terms of 4.5%.
Institutional and Regulatory Developments
Reforms in 2007 concentrated on the secondary market, with the key themes: the establishment of better risk management tools, better price discovery, and greater choice of fixed-income assets for local and international investors.
While yield curve extension and consolidation in government debt
markets continued over the past year, regulators have begun
supplementing these reforms with initiatives aimed at raising
the efficiency of the secondary markets for both government and
corporate bonds. These include introducing derivatives and term
repurchase agreements to improve risk management capacity
in their markets, implementing new execution platforms and
standards for trading and reporting to aid price discovery, and
increasing the range of investable assets available to nonresidents
and residents. Expanding the range of domestic and nonresident
investors has also been a priority.
In the PRC, a number of reforms were enacted in the first half
of the year and helped stimulate more corporate issuance,
in spite of steadily rising yields. Many of the reforms focused
on the interbank7 market that operates under the central
bank’s supervision. Although the People’s Bank of China— the
PRC central bank—is not the securities regulator, it takes an
active role in the bond market under its financial stability
responsibilities. Since 2007, corporate bonds already listed
on the exchanges could also be traded on the interbank bond
market, replacing the previous system where some corporate
7 The People's Republic of China interbank market is effectively an over-the-counter market, with over 5,000 participants including mutual funds and insurers.
•

A S I A B O N D M O N I T O R
28
debt securities were restricted to trading on exchanges.8
These changes have yielded positive results for bond market
turnover as trading locale is less restricted—94% of the
increased corporate bond transaction volumes now take place
on the interbank market. The Shanghai stock exchange’s
bond market, where securities firms are the executing agents
for investors, has successfully repositioned itself to provide
access to small trades by the investing public, and provide risk
management tools such as repos. While OTC derivatives can
be traded on the interbank market, other hedging tools such
as exchange traded financial futures have been authorized and
are now planned for later in 2008 if the repo market initiative
continues to be a success. Focusing capacity-building efforts
initially on a single platform for exchange-traded derivatives
makes it easier for the regulator to monitor the market and
learn from experience under a centralized approach—the
quality of risk-pricing information is also improved. The PRC
is moving toward a universal-bank approach—meaning that
banks can deal in insurance products as well as securities
on behalf of clients—and it is expected that the Shanghai
exchange will grow in importance as participants require
improved access to risk management products to hedge
balance sheet risk. In February 2008, the China Banking
Regulatory Commission and Financial Services Agency of
Japan reached an agreement related to the Qualified Domestic
Institutional Investor system signaling closer bilateral co-
operation between financial services regulators. The State
Administration of Foreign Exchange also announced plans
to expand the quota for both foreign and domestic qualified
institutional investors, which should enlarge the demand for
domestic fixed-income securities.
In addition to Hong Kong, China’s many steps toward
becoming a full-service offshore financial center for the PRC, it
also aims to become another of Asia’s Islamic finance centers.
The Hong Kong Shariah Advisory Council was established
to vet new instruments for compliance with Islamic code.
The first such product is an Islamic China equity index fund
launched in November, targeting Middle Eastern investors with
PRC based assets. Other, similar funds are also being planned.
An Islamic bond market has been touted to begin operation
8 Article 1 of Announcement 2005 No. 30, issued by the People’s Bank of China on 13 December 2005 provided that corporate bonds meeting certain requirements could be traded on interbank bond markets. The approval system was expanded in 2007.
•

A S I A B O N D M O N I T O R
2�
sometime in 2008. These initiatives are strengthened as the
HKMA has implemented a delivery-versus-payment (DvP) link
with Bank Negara Malaysia, the Malaysian central bank. This
system is an improvement on the previous payment-versus-
payment system and will allow real-time settlement of MYR-
USD trades in either market. The system should help develop
the region’s capabilities as an Islamic financing hub. The Hong
Kong Monetary Authority also launched an electronic trading
platform for government bonds in December 2007.
Indonesia’s central bank shifted its policy rate in January 2008
from its 1-month rate to an overnight rate and will become
much more active in day-to-day liquidity management this
year. It also plans to extend the maturity of the bills it offers
to include 6- and 9-month certificates and will extend its
Shariah-compliant bills out to 1- and 3-month maturities. The
government plans to extend its debt switch-auction format
to offer a range of longer-maturity bonds in exchange for the
short-term notes tendered. In order to develop the structured
finance market, Bapepam LK, the securities regulator has
issued four regulations governing different aspects of the
offering and management of REITs.
In Korea’s recent bid to become an Asian financial hub, its
National Assembly passed the Capital Markets Consolidation
Act in July 2007 to streamline financial regulations and
liberalize capital flows. The plan to adopt a Korean version
of the International Financial Reporting Standards by 2011
is one example of supporting measures. In preparation
for further opening the capital account, the central bank
and the Financial Supervisory Commission (FSC), the
securities regulator, are establishing new monitoring and risk
management functions. The FSA announced in October its
plan to launch a 10-year bond futures contract in 2008. Its
introduction will complement existing swap and interest-rate
forward contracts and should help to encourage acceptance
of longer-dated corporate bonds as well as allowing efficient
hedging of the 10-year Treasury bond. The major regulatory
benefit of creating a futures contract is that it allows the FSA
to monitor system risk more precisely than it can through
the over-the-counter derivative market.
•
•

A S I A B O N D M O N I T O R
�0
In Malaysia, the clearing arrangement between HKMA and
Bank Negara Malaysia reinforces the impression that Middle
Eastern funds will soon be able to access Shariah compliant
products that can take advantage of PRC growth prospects.
Combined with the HKMA’s right (since December 2000) to
clear USD payments locally, rather than wait 12 hours for New
York daytime, the DvP link would allow US dollar investors
from the Middle East to settle their ringgit investments in
Malaysian daytime. The Securities Commission issued new
guidelines in July on collective investment vehicles to allow
direct distribution in Malaysia of funds from recognized
jurisdictions. While Dubai became the first such recognized
jurisdiction, the new DvP link suggests that funds from Hong
Kong, China might soon follow.
In the Philippines, the Securities and Exchange Commission
(SEC) has phased in regulations governing OTC trading.
From end-January 2008, all interdealer transactions are
required to be reported through a self-regulating organization
(SRO)—currently the Philippines Dealing Exchange is the
only licensed SRO. Dealers and brokers are required to be
members of an SRO before trading. The aim is to improve
disclosure and transparency, although there have been
difficulties implementing the rules, which have hurt turnover.
The government is also planning a range of bond-related
instruments to appeal to nonresident investors. The central
bank recently approved the February issue of PHP2 billion
(equivalent to 3.7% of current LCY bonds outstanding) in
currency warrants. The warrants allow holders to convert
US dollar bonds into the peso Treasury note of 2016. The
major attraction of these warrants is that domestic banks can
hold US dollar bonds with a risk weighting of zero for Basel
purposes, while US dollar bonds otherwise carry a 100%
weighting. This approach may relieve some of the buying
pressure on the peso. Against this, the Bureau of the Treasury
bought back USD1.8 billion worth of its foreign currency debt
last year. In 2008, two public housing mortgage companies
are investigating whether to refinance part of their portfolios
with mortgage-backed securities. However, several pieces
of enabling regulations remain to be issued or enacted. The
same hurdles have so far discouraged use of the securitization
law passed 2 years ago. Another bill under consideration in
the Senate would regulate real estate investment trusts, but
key aspects of the tax treatment are yet to be clarified.
•
•

A S I A B O N D M O N I T O R
�1
The Monetary Authority of Singapore issued a series of new
guidelines for the REIT market after year-long consultations
with participants. To improve distribution, the changes require
greater clarity in the offering documents, more investor
safeguards, and disclosure on the use of yield-enhancing
arrangements. The latter often include higher-leverage levels
in the final investment, the consequences of which may
be hard for the final investor to understand. Promotional
techniques that may have created a conflict of interest among
different classes of investors, such as pre-listing discounts
to institutional investors, will also be restricted. Investment
rules now also stipulate that at least 75% of assets must be
invested in income-producing property. One implication of
these new rules is that REIT promoters were more interested
in generating sales commissions with new offerings than
in providing a sustainable flow of investments that were
consistent with the advertised risk and return expectations.
Thailand’s National Legislative Assembly passed a major
amendment to the Public Debt Management Act in November
2007, which allows the government to issue bonds when
the budget is in surplus for refinancing and bond market
development purposes. This makes the debt market supply
more reliable and allows the Ministry of Finance to consolidate
their issuance and raise benchmark size more effectively.
As a result, the Ministry of Finance announced that the new
5- and 10-year Treasury bonds will be offered in larger, less
frequent auctions to support easier distribution. It is also
requiring primary dealers to make institutional-size firm,
two-way quotes on both bonds at least once a day, late in
the morning session with a minimum bid-ask spread of 5bp
as a first step toward easier price discovery for investors.
The Bank of Thailand, the central bank, is reforming its
repurchase agreement (repo) market to shift it from one
designed primarily for open market operations to control
banking system liquidity to one that can finance portfolio
investments. The bilateral repo market went into effect in
October with four new dealers added to the nine previous
ones. The ability to finance bond purchases or to affect short
sales through repos provides an important risk management
tool that encourages market liquidity. The combination of
these new initiatives may have been a factor in the doubling of
turnover within the government market last year. In February
2008, the Bank of Thailand also announced the abolition of
•
•

A S I A B O N D M O N I T O R
�2
the December 2006 capital control requirement on foreign
investor holdings of bonds.
Viet Nam‘s bond market has evolved considerably over the
past year. To help absorb excess liquidity produced by foreign
investments, the central bank began issuing a range (1–12
month tenors) of bills on a continuous basis. The bills support
monetary policy but, more importantly, offer an important
ingredient in the country’s nascent money market. In parallel,
the Ministry of Finance stopped setting ceiling rates on its
Treasury bonds, allowing the market to determine rates. This
has boosted turnover considerably since November. It also
plans to launch an online government bond market in 2008
not associated with the stock exchange but would list all
types of government bonds traded on a dedicated exchange
in Hanoi. Trading membership would be open to securities
companies and all banks with offices in Viet Nam.
Outlook, Risks, and Policy Challenges
External Market Environment
The global economy is expected to slow moderately in 2008 in response to the effects of a weakening US economy, continuing workout of the US subprime-generated financial turmoil, tighter credit conditions, and rising inflation.
Economic growth in Organization for Economic Co-operation and
Development (OECD) member states slowed to 2.7% in 2007,
and a further deceleration is expected in 2008, the result of a
sharper and broader slowdown in major industrial economies. The
outlook for the United States (US) economy appears particularly
uncertain with gross domestic product (GDP) growth falling to an
annualized 0.6% in the final quarter of 2007. The economy grew
by 2.2% over the full year and is forecast to decelerate to 1.5%
this year. Many expect a contraction during the first 2 quarters
of 2008, with considerable downside risk not ruling out a more
severe and protracted contraction on the horizon.
•
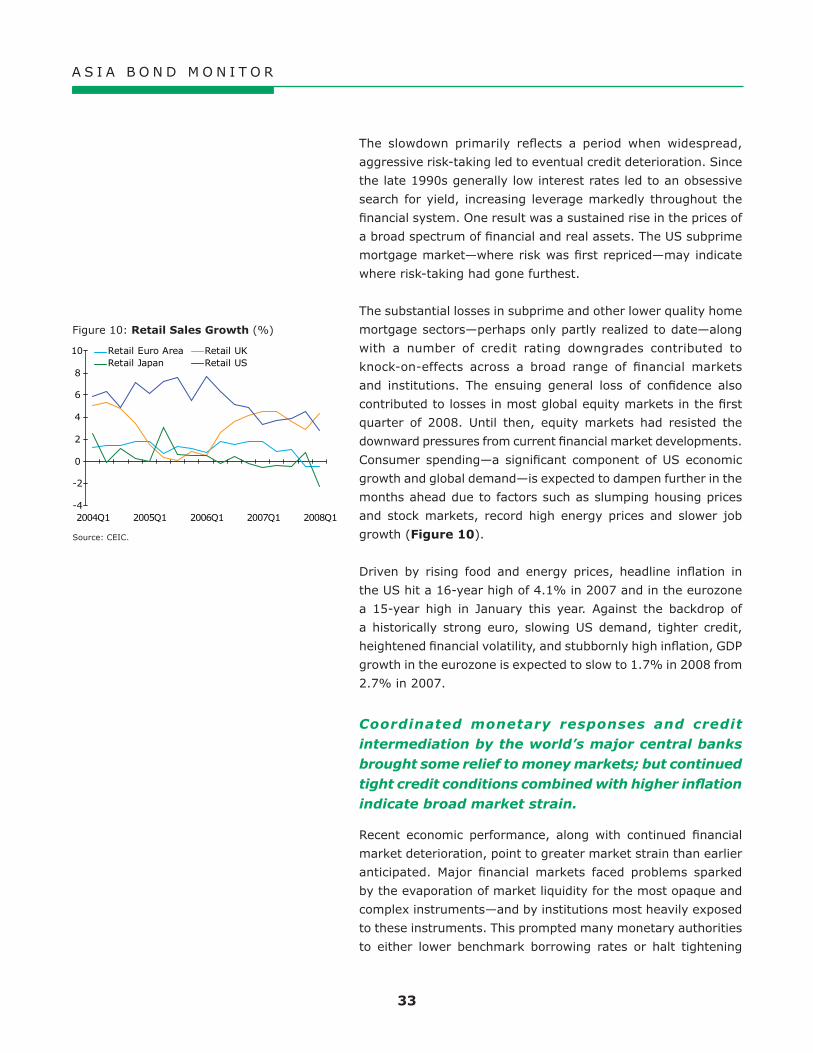
A S I A B O N D M O N I T O R
��
The slowdown primarily reflects a period when widespread,
aggressive risk-taking led to eventual credit deterioration. Since
the late 1990s generally low interest rates led to an obsessive
search for yield, increasing leverage markedly throughout the
financial system. One result was a sustained rise in the prices of
a broad spectrum of financial and real assets. The US subprime
mortgage market—where risk was first repriced—may indicate
where risk-taking had gone furthest.
The substantial losses in subprime and other lower quality home
mortgage sectors—perhaps only partly realized to date—along
with a number of credit rating downgrades contributed to
knock-on-effects across a broad range of financial markets
and institutions. The ensuing general loss of confidence also
contributed to losses in most global equity markets in the first
quarter of 2008. Until then, equity markets had resisted the
downward pressures from current financial market developments.
Consumer spending—a significant component of US economic
growth and global demand—is expected to dampen further in the
months ahead due to factors such as slumping housing prices
and stock markets, record high energy prices and slower job
growth (Figure 10).
Driven by rising food and energy prices, headline inflation in
the US hit a 16-year high of 4.1% in 2007 and in the eurozone
a 15-year high in January this year. Against the backdrop of
a historically strong euro, slowing US demand, tighter credit,
heightened financial volatility, and stubbornly high inflation, GDP
growth in the eurozone is expected to slow to 1.7% in 2008 from
2.7% in 2007.
Coordinated monetary responses and credit intermediation by the world’s major central banks brought some relief to money markets; but continued tight credit conditions combined with higher inflation indicate broad market strain.
Recent economic performance, along with continued financial
market deterioration, point to greater market strain than earlier
anticipated. Major financial markets faced problems sparked
by the evaporation of market liquidity for the most opaque and
complex instruments—and by institutions most heavily exposed
to these instruments. This prompted many monetary authorities
to either lower benchmark borrowing rates or halt tightening
-4
-2
0
2
4
6
8
10
2004Q1 2005Q1 2006Q1 2007Q1 2008Q1
Retail Euro Area Retail UK Retail Japan Retail US
Figure 10: Retail Sales Growth (%)
Source: CEIC.

A S I A B O N D M O N I T O R
��
cycles—with the aim to ensure monetary policy objectives are met
and to alleviate disruptions in the interbank market. Authorities
were forced to use innovative approaches to inject liquidity and
rescue failing institutions.
Continued cuts in the US Federal Reserve (US Fed) federal
funds rate, the decision in March 2008 to provide up to USD200
billion in US Treasuries to primary dealers, and the corporate
bailout—including Bear Sterns and Northern Rock—indicates
authorities nervousness over the current situation. At the same
time, both the Bank of Japan and European Central Bank (ECB)
have kept interest rates unchanged (Figure 11). Some credit
market segments remain under stress due to a lack of liquidity and
heightened investor scrutiny. Attempts by monetary authorities
to forestall or stem recession have also been complicated by
higher inflation.
The current financial market dislocation has led to increased uncertainty over the extent and distribution of subprime-related losses—and to tightened credit standards for borrowers.
Subprime-related losses are continuing to grow among financial
institutions and investors are requiring increasingly higher risk
premiums on their holdings of mortgage-based and complex
derivative securities. So far, banks worldwide have reported
more than USD175 billion in write-downs and more losses are
expected. Concern over the value of illiquid instruments and the
large quantities of asset-backed commercial paper (ABCP) linked
to US subprime mortgages has also led to a sharp rise in money
market spreads and a marked decline in ABCP outstanding. The
uncertainty over the distribution of the losses has resulted in a
flight to quality to government bonds and led to tightening credit
supply. The flight to quality since the August market sell-off has
pushed US, euro, UK, and Japanese government bond yields
substantially lower, but yield curves steepened on expectations of
further easing (Figures 12, 1�). Deteriorating credit conditions
amid slowing global growth are also reflected in widening credit
spreads on corporate debt (Figure 1�).
The tightening of financial conditions, with a diminished supply
of secured credit and tighter lending standards for mortgages,
is likely to add further pressure on already highly-indebted
consumers, raising the specter of increased defaults. For
5.00
4.504.75
3.75
2.50
4.004.004.50
5.755.25
0.25
0.00
0.50
1
2
3
4
5
6
7
0
0.2
0.4
0.6
0.8
1
Japan (RH)
US
Euro
UK
2.25
JPN (in %)
EU, US, UK (in %)
Jan-06
Jul-06
Jan-07
Jul-07
Jan-08
0.50
Figure 11: Global Policy Rates (%)
Source: Bloomberg LP.
1.0
1.5
2.0
2.5
3.0
3.5
4.0
3.0
3.5
4.0
4.5
5.0
5.5
6.0
Japaneurozone
UKUS
eurozone, UK, USJapan
Jan-04
Jan-05
Jan-06
Jan-07
Jan-08
Figure 12: 10-year Government Bond Yields (% per annum)
Source: Bloomberg LP.
-1.0
-0.5
0.0
0.5
1.0
1.5
2.0
Japan
UK
US
eurozone
Jan-04
Jan-05
Jan-06
Jan-07
Jan-08
Figure 13: 10-year and 2-year Government Bond Yield Spreads (% per annum)
Source: Bloomberg LP.

A S I A B O N D M O N I T O R
��
example, some highly indebted European and US companies
are facing growing difficulties in refinancing borrowings. The
cost of protecting corporate bonds—as measured by crossover
credit default swap (CDS) spreads—from default, increased
with perceptions of credit quality deteriorating at a time when
the corporate earnings outlook is under pressure from financial
market turbulence (Figure 1�). The temporary affirmation of
AAA ratings for monoline insurers MBIA and Ambac has eased
pressures on this specialized sector, but their still-high CDS
spreads for insurance companies show market participants’ doubts
about the sustainability of their credit ratings and the lingering
risk of another round of defaults (Figure 1�). Delinquency rates
also continue to climb in both the US residential mortgage and
construction loan markets—sectors that have been hardest hit by
the economic uncertainty—and are increasing on US commercial
loans and credit card loans as the quality of other bank assets
worsen (Figure 17).
The recent global financial market turbulence uncovered the need for better oversight, enhanced transparency and strengthened risk management.
The importance of fluid, effective and efficient financial systems
in today’s global economy—with high prevailing debt levels
and a myriad of instruments to spread and manage risk—is
essential to avoid a further unwinding of financial markets that
could contribute to further deterioration of economic conditions.
Authorities, regulators, and market players have coalesced around
three general trends that need to be addressed:
The effectiveness of the fragmented US system of financial
regulation has come under increased scrutiny as the
consequences of the meltdown in the US subprime mortgage
market and as the resulting global market turmoil continues to
unfold. The blueprint for regulatory reform9 released by the US
Treasury 31 March recommends a regulatory model structured
by regulatory objective rather than by the type of financial
institution. The idea is to allow for an easier, faster, and more
flexible response to an ever-evolving and increasingly complex
marketplace. Three top level regulators would suffice: (i)
one to focus on market stability across the entire financial
sector; (ii) another to ensure the safety and soundness
9 US Treasury, Remarks by Secretary Henry M. Paulson, Jr. on Blueprint for Regulatory Reform, March 31, 2008. hp-897
•
202
32
72
362
141
10067
6458
370
50
100
150
200
250
300
350
400
US
eurozone
basis points
Japan
Jan-06
Jul-06
Jan-07
Jul-07
Jan-08
Figure 14: Corporate Bond Spreads (% per annum)
1Refers to the difference between yields of 5-year bonds issued by BBB-rated finance companies and yields of sovereign benchmark bonds of the same tenor.Source: Bloomberg LP.
0
100
200
300
400
500
600
700
basis points
0
100
200
300
400
500
600
700
ITRAXX European Union XO S8 Senior 5 YearCDX North America XO S9 Senior 5 Year
basis points
Sep-07
Nov-07
Jan-08
Mar-08
Figure 15: CDX NAXO Crossover �-year (basis points)
Source: Thomson DataStream.
Source: Thomson DataStream.
0
50
100
150
200
250
300
350
400
Jan-06
May-06
Sep-06
Jan-07
May-07
Sep-07
Jan-08
basis points
US Insurance Sector CDS Index 5 Year
EU Insurance Sector CDS Index 5 YearUK Insurance Sector CDS Index 5 Year
Figure 16: CDS Spreads for Insurance companies

A S I A B O N D M O N I T O R
��
of institutions supported by a US federal guarantee, and
(iii) the third to focus on protecting consumers and investors.
According to US Treasury Secretary Henry Paulson, the
current US regulatory structure has not been built to address
modern financial systems—with its diversity of market
participants, innovation, complexity of financial instruments,
convergence of financial intermediaries and trading platforms,
global integration, and interconnectedness among financial
institutions, investors, and markets. With financial services
companies becoming larger, more complex, and thus more
difficult to manage, the current regulatory system tends to
be reactive—a pattern of creating regulations as a response
to market innovations or to market stress.
Because of the effects of globalization on the transmission of
shocks across international markets, the process of reviewing
broader arrangements for regulation and supervision should
not be the sole responsibility of the US. Regulatory reform
is likely to generate controversy and debate among financial
market regulators worldwide. But this is essential to ensure
long-term financial market stability and economic growth.
Sovereign wealth funds' (SWFs) recent capital injections into
several financial institutions—for example, into US and other
Group of Seven (G7) financial institutions—were stabilizing
factors in the turmoil (Box 1). They came at a critical time,
when risk-taking capital was scarce and market sentiment
was pessimistic. But, the growing role of SWFs has raised
questions regarding the smooth functioning of financial
markets. They have also raised investment policy questions,
including concerns in recipient countries about protecting
national security and transparency. Central to the current
debate on SWFs primarily reflects the desire of recipient
countries to be given adequate information about SWF
governance, objectives, and strategies. The concern is that
SWF investments may be driven partly by non-commercial
strategic interests, and could bring about a protectionist
reaction as a result, if there is less than complete and robust
information.
Risks inherent in complex instruments and relevant risk-
management standards have been addressed in a wide
variety of forums. But these instruments continue to expose
•
•
1
2
3
4
5
6
7
8
1985Q1 1987Q1 1989Q1 1991Q1 1993Q1 1995Q1 1997Q1 1999Q1 2001Q1 2003Q1 2005Q1 2007Q1
Percentage of loan balance delinquent 60 days or more
All Consumer loans- of which: credit cardsAll R/E loans- of which: residential
Figure 17: Loan Delinquency Rate at US Banks (in % of loan balance)
Source: US Federal Reserve.

A S I A B O N D M O N I T O R
�7
Sovereign Wealth Funds (SWFs) have been around for more than 50 years. What has peaked observers’ interest are the economic and governance settings under which they operate, the source of the finances they control, and in some cases an unease with national funds controlling private sector assets.
Interest—and some concern—over SWFs has increased in several OECD economies where recent capital infusions into prominent banks signaled a portfolio shift in fund use from maintaining liquid debt instruments to buying strategic transnational equity holdings. This prominence also reflects the increase in both the number and size of SWFs. Their growing presence has indirectly created a material investor group of governments. With huge investible sums available, the potential to influence the efficiency of global markets and commercial activity generally has become an issue. Estimates suggest that the aggregate size of SWFs exceeds USD2-USD3 trillion—influential perhaps, but merely a fraction of the USD100 trillion capitalization of all global debt and equity securities.1
Broadly speaking, SWFs are investment vehicles owned or controlled by state agencies such as central banks, state investment companies, state pension funds, and oil funds. Globally there may be as many as 40 SWFs. They are typically categorized according to the source of funds, based on commodity or non-commodity revenues. Many SWFs deploy wealth generated from taxes or fees associated with commodity or natural resource exports, while non-commodity funds are typically used to more effectively manage excess foreign exchange reserves.
Many SWFs were created with national economic welfare in mind to (i) help insulate budgets and economies of commodity exporters from volatile
1 The International Monetary Fund estimates that the total size of SWFs has the potential to grow to USD6-USD10 trillion by 2013.
commodity prices; (ii) preserve wealth for future generations; and (iii) achieve returns higher than those expected from traditional international reserve management.
The rapid build-up of the Asia’s foreign exchange reserves since the Asian crisis have, for example, led to widespread calls for more active management of the region’s excess reserves. In response, governments across the region have begun establishing SWFs,2 signaling a strategic shift from passive liquidity management to active profit-seeking investment in managing excess reserves.3
SWFs invest across a var ied range of asset classes and, similar to commercial sector fund managers, use an assortment of investment strategies. Some are broadly diversified and hold small stakes in a variety of firms. But a minority is accustomed to buying strategic stakes in domestic or foreign targets. Others invest only in sovereign or quasi-government bonds. Most tend to outsource a portion of their resources to third-party fund managers. As opposed to commercial funds, SWF performance is more likely to be judged in terms of absolute returns or relative to an interest rate index, although many will use popular commercial
2 Singapore’s funds—Temasek Holdings and Government of Singapore Investment Corporation—are the oldest in the region and widely thought to have been exceptionally successful in terms of investment performance. Examples of new Asian sovereign funds include China Investment Corporation and Korea Investment Corporation, established in September 2007 and July 2005, respectively. Singapore’s funds and the newer Asian funds are all non-commodity funds derived from receipts from the export of manufactured goods and services3 The China Investment Corporation is responsible for managing part of the People’s Republic of China’s foreign exchange reserves with USD200 billion United States dollars of assets under management. This sovereign wealth fund officially began operations in September 2007. It bought a USD3 billion stake of Blackstone Group in June and a 9.9% stake of Morgan Stanley worth USD5 billion on 19 December 2007.
index benchmarks for comparative assessments. SWFs tend not to be active investors, except in relation to management of liquid debt instruments. The majority generally do not seek controlling stakes in foreign companies, though some SWFs have sought control of private equity funds.
In the search for greater yield, SWFs’ portfolios have diversified from traditional low risk and highly liquid assets—such as government bonds—to other assets such as securities and derivatives. This could increase liquidity in less active market segments. As long-term sources of investment, SWFs can provide a stabilizing effect on some firms. Their ability to prop up or come to the rescue of troubled firms—certain US banks may be recent examples—SWFs can arguably be contributors to financial system stability.
Transparency is central to the current debate on transnational SWFs—primarily reflecting the desire of host states and investment targets to receive sufficient details on SWF governance, objectives, and strategy. The concern is also that SWF investment may be driven partly by noncommercial strategic interests, raising the possibility of a protectionist rebuff. As usual, sound policy is best founded on complete and robust information.
SWF investment affects the legitimate interests of both investing and host countries. As such, a global dialogue in which interests of both investing and host countries are fully and fairly represented would benefit both parties. Several efforts are being taken to address these issues, including discussions by the US Treasury Department,4 the International Monetary Fund, the World Bank, the
4 Financial Services Subcommittee on Domestic and International Monetary Policy, Trade and Technology, and the Subcommittee on Capital Markets, Insurance, and Government Sponsored Enterprises Hearing. Foreign Government Investment in the U.S. Economy and Financial Sector, Wednesday, 5 March 2008.
Box 1: Why All the Fuss about Sovereign Wealth Funds?

A S I A B O N D M O N I T O R
�8
OECD5 and others to develop voluntary codes of SWF best practices, building on accepted standards of practice for international reserve management. Regional institutions can also help draw Asian governments together to discuss SWFs and their role within the region. An increase in the quality and quantity of information about SWF activity could help allay nationalistic concerns, and lessen expectations that their actions, or rumors of actions, would
5 Sovereign Wealth Funds and Recipient Country Policies, Report of the OECD Investment Committee to G7 Ministers, 4 April 2008.
increase market volatility and become destabilizing. The same discussions may also help avoid discriminatory rules that penalize SWFs in favor of commercial investors.
Box 1 Table 1: Disbursements by Sovereign Wealth Funds
Economy Fund Name Launched UD$ billion % of 200� GDP
UAE (Abu Dhabi) ADIA 1976 625.0 520.70%
Norway Norway Government Pension Fund 1990 322.0 102.60%
Singapore GIC 1981 215.0 169.00%
Kuwait Kuwait Investment Authority 1953 213.0 268.70%
China, People's Rep. of China Investment Corporation 2007 200.0 8.00%
Russia Russia Stabilisation Fund 2004 127.5 14.20%
Singapore Temasek 1974 108.0 84.90%
Qatar Qatar Investment Authority 2005 60.0 185.30%
US (Alaska) Permanent Reserve Fund 1976 40.2 0.30%
Brunei Brunei Investment Authority 1983 30.0 309.40%
Korea KIC (Korea Investment Corporation) 2005 20.0 2.20%
Malaysia Khazanah Nasional BHD 1993 17.9 12.30%
Venezuela National Development Fund 2005 17.5 10.50%
Canada (Alberta) Alberta Heritage Savings 1976 16.4 1.30%
Taipei,China National Stability Fund 2001 15.2 4.00%
Kazakhstan National Fund 2000 14.9 15.60%
Chile Economic & Social Stability Fund 2006 9.7 7.60%
UAE (Dubai) Istithmar 2003 8.0 6.70%
UAE (Dubai) DIC 2004 6.0 4.00%
Oman State General RF 1980 6.0 16.00%
Total 2072
Source: Standard Charterd Bank

A S I A B O N D M O N I T O R
��
investors to significant losses as interest rates, foreign-
exchange rates, and other market indexes change. Recent
lapses in risk management, oversight, and prudence in risk-
taking—such as with Société Générale10—have reinforced
the need for continued strengthening of risk management
practices, especially given the problems in capturing credit
and liquidity risks.
While the shift from the originate-and-hold to an originate-
and-distribute banking model has many advantages, the
US subprime problems highlighted several weaknesses. The
traditional originate-and-hold strategy involved originating
loans and holding them on balance sheets until they were
repaid or written off. With the shift to the originate-and-
distribute strategy, banks can spread the underlying risk of
the original loans to final investors such as pension funds,
insurance companies, hedge funds, mutual funds, and other
banks. This unbundling and repackaging credit risk enables
market participants to assume exposures in accordance with
their risk appetites and capacities. This risk diversification
contributes to the efficiency and stability of the global financial
system. However, it is critical that both originating and
investing firms understand the risks in transactions relating to
credit risk transfer. During the recent financial market turmoil,
the originate-and-distribute strategy may have contributed
to reduced incentives for banks to undertake adequate credit
risk assessment at the time of origination, assuming that
the risk would be offloaded later. Moreover, the markets for
credit risk transfer are especially vulnerable whenever there
is impaired market liquidity.
Regional Economic Trends and Outlook for 2008
Despite the worsening external economic environment facing emerging East Asia, GDP growth, while moderating, is expected to remain robust.
Emerging East Asian economies face strong headwinds as
external demand weakens, global oil and commodity prices
remain elevated, the global IT recovery is delayed, and
10 Societe Generale SA’s oversight procedures were in 2007 called into question after the discovery of a trader's unauthorized bets causing a EUR4.9 billion (USD7.7 billion) trading loss for the bank.

A S I A B O N D M O N I T O R
�0
subprime-generated financial turmoil continues. The region’s
economies have so far weathered these external shocks relatively
well—due to sound economic policies, external balances and
regional financial market conditions. There has been limited and
indirect exposure to US subprime-related losses. Together with
improved macroeconomic fundamentals and prudent economic
management, aggregate GDP growth is expected to moderate
yet remain robust in 2008. This resilience, however, could be
further tested in the coming months as uncertainty over global
financial turbulence continues.
In Japan, GDP is expected to slow significantly in 2008 as exports
show signs of slowing and the JPY continues to strengthen
against the US dollar. In the People’s Republic of China (PRC) a
gradually appreciating CNY; continued monetary tightening; and
an expected deceleration in the growth of external demand should
lead to some cooling of the economy. However, the offsetting
stimulus of increased public spending—especially related to
the 2008 Olympic Games and to efforts to encourage the rural
economy—should sustain relatively rapid growth throughout the
year.
Inflation continues to rise across the region, largely due to record oil and other high commodity prices, but also due to strong domestic demand in economies such as the PRC.
Headline inflation (Figure 18) continues to pick up across the
region, largely due to resurgent food, oil and other commodity
prices, and strong domestic demand. Consumer price inflation
reached multiple-year highs in several economies in the region,
including a 25-year high in Singapore (6.6%); an 11-year high
in the PRC (8.7%) and Viet Nam (15.7%); and a 10-year high
in Hong Kong, China (3.8%). Japan’s inflation also edged into
positive territory (0.7%) in January 2008. Overall, relatively tight
labor markets and higher food and energy prices are expected to
increase inflationary pressures throughout the region in 2008.
8.7
5.3
3.95.34.8
10.7
4.1
6.0
3.3
0.70.8
-1
1
3
5
7
9
11China, People's Rep. of
ASEAN-4
NIE-3
Emerging East Asia1
JapanJan-04
Jan-05
Jan-06
Jan-07
Jan-08
Figure 18: Regional Inflation—Headline Rates (y-o-y, %)
1Includes People's Republic of China, NIE-3 and ASEAN-4.Source: OREI staff calculations based on CEIC data.

A S I A B O N D M O N I T O R
�1
Perhaps the most immediate and visible impact of the subprime fallout in the region has been an increase in volatility in securities markets across the region.
The region’s financial markets have already tumbled twice since
the beginning of the year (in mid-January and early March) and
some of the region’s largest financial markets—including the
PRC; Hong Kong, China; Japan; and Republic of Korea (Korea)
were affected by the March sell-off. The decline resulted from
several factors, including some liquidation of portfolio holdings by
foreign financial institutions, global market uncertainty, and also
by more realistic risk evaluation in global financial markets as a
whole, and an adjustment in the expected returns of underlying
investments. Also, domestic credit—supported by ample domestic
savings—continues to provide resources for investment even as
portfolio equity and bond flows taper off.
Capital outflows from Asian economies have helped stabilize
mature markets. Notable examples are the large injections of
funds into major G7 banks from several Asian-based SWFs, which
helped stabilize some bank share prices. But as global financial
turmoil spreads further malaise, heightened anxiety threatens to
trigger a sharp withdrawal of financial flows from the region. With
the two largest regional economies—Japan and the PRC—showing
signs of slowing, concerns are mounting that continued financial
volatility might weaken the growth momentum in regional demand
and overshadow current robust growth performance.
Early in the recent credit tightening, emerging East Asian local currency bond markets benefited as investors sought attractive yields outside the US. But amid growing risk aversion, the illiquidity of the region’s markets is a limiting factor (Box 2).
At the initial stages of the recent credit tightening, emerging East
Asian local currency bond markets benefited as investors sought
attractive yields outside US markets. However, with growing risk
aversion, foreign investors began withdrawing from most of the
region’s bond markets. The pace of government and corporate
issuance in the region has slowed but not to the same extent as
the reduction in global bond issuance. The region’s offshore bond
issuance market has slowed markedly and securitization markets
have largely dried up.

A S I A B O N D M O N I T O R
�2
The November 2006 edition of the Asia Bond Monitor published an AsianBondsOnline survey of various measures of liquidity across the region. The survey was updated during the first quarter of 2008 and is presented below. Some 40 market makers and operations experts from exchanges, bond platforms, or depositories from emerging East Asian economies responded to questions concerning their specific markets. In the two surveys, participants compared market conditions for 2006 and 2007. Respondents were also asked to make qualitative judgments on the effectiveness of certain initiatives in raising liquidity in both government and corporate local currency bond markets. The survey also polled market makers on use of derivatives markets, repurchase agreement markets, and their foreign cu r r en cy bond exposure . Th i s section summarizes the survey results (Table B2-1) based on a scoring system that ranges from 4 (“very important”) to 0 (“don’t know/not applicable”). A score approaching 4 suggests that most market makers feel significant attention i s needed in a particular category in order to foster improvements in overall liquidity. L o w e r s c o r e s mean that market make r s a s s i gn less importance to these initiatives in their markets.
Some caution should be taken when comparing and interpreting the scores from the two surveys as both participants and the number of participants changed between the survey dates.
Increasing investor diversity scored highest in both government and corporate bond markets.
Increasing investor diversity remains the most important policy goal for developing liquid bond markets, in both government (3.5) and corporate (3.4) bond markets, highlighting concerns over the present narrow investor base. Scores were high regardless of the relative state of bond market development, with no market grouping assigning a rating less than 3.0 to the importance of this type of initiative. Over 58% of the respondents felt corporate bond markets were particularly illiquid, with buy-to-hold investors dominating the underwriting process, leading to bonds being rapidly absorbed into portfolios without secondary market
turnover. Although this indicates healthy demand from the contractual savings sector, the illiquid secondary market makes it difficult to obtain a continuous market valuation of credit risk. Many respondents expressed the view that greater foreign participation
in their markets would enhance liquidity as overseas investors based their investment decisions on different investment criteria to those of local investors.
Increasing avai labi l i ty of hedging tools was the second-most important factor for increasing bond market liquidity.
Greater access to hedging products was seen as important for increasing liquidity in both government and corporate bond markets, suggesting some urgency to fill unmet demand from market participants. The scores for improving repurchase markets (2.9) and for expanding the availability of hedging products (3.3) in the government market were also reflected in the corporate
bond market, where the need to increase the availability of hedging products (3.1) and credit derivatives (3.1) scored high. While scores for the need to develop hedging products were evenly distributed among the e conom ies , t h e s c o r e s f o r both repurchase markets and credit derivatives varied somewhat, reflecting less familiarity with these tools. Access to these products encourages a greater diversity of investor par t i c i pan ts—as they allow dynamic hedging of interest
rate and credit risks, which eventfully leads to greater pricing certainty and lower transactions costs. Markets with active futures, derivatives, and repurchase markets rated access to derivatives products as less important.
Box 2: What’s Needed to Build Liquidity—an AsianBondsOnline Survey
Table B2–1: AsianBondsOnline Survey Results, 2007
Average Score
Government Bond Market Reforms 2007 200�
Increasing diversity of investors 3.5 3.6
Increased availability of hedging products 3.5 3.2
Increasing intraday price transparency 3.1 2.8
Improving repurchase markets 2.9 3.2
Improvements to clearing and settlement 2.7 2.6
Mandatory bid-ask spreads by market makers 2.5 2.8
Corporate Bond Market Reforms 2007 200�
Increasing diversity of investors 3.4 3.5
Increased availability of hedging products 3.1 3.1
Greater access to credit derivatives 3.1 3.1
More consistent secondary market pricing 3.1 3.2
Increasing tax incentives 2.9 2.8
Credit rating harmonization 2.8 2.7
Introducing pricing agencies 2.7 2.6
Greater access to guarantees 2.6 2.4
Greater multilateral issuance 2.6 2.3
Source: AsianBondsOnline.

A S I A B O N D M O N I T O R
��
A greater level of diversity in derivative market contract tenors (maturities) reflects either more choice or more variety of users—in either case, more active markets. There were also more tenors indicated for currency hedging than for interest-rate hedging in these markets. This pattern held to a lesser extent in the less-established markets. The survey asked participants what tenors are liquid for a range of conventional derivatives—forward contracts, futures, swaps, and option contracts. The responses varied, as does the use of derivatives from market to market. On the whole, forwards and swaps contracts were most common, providing roughly two-thirds of market hedges, while futures and options were less commonly used since they are generally traded on commodity exchanges, which are not yet available in most markets.
Common uses for swap contracts are to hedge currency risk and to convert floating-rate interest to fixed-rate (or vice versa) for a bond, either for the issuer or the investor. This usage is reflected in the higher percentage of swap contracts with 2-year and 5-year (constituting 40–100% of swap liquidity) tenors across the region. For shorter maturities, forwards or futures are more commonly used.
Pricing certainty continues to be a concern.
More consistent secondary market pricing (3.1) rated second in importance
in raising liquidity in corporate bond markets. Respondents from more developed bond markets generally saw consistent pricing by market makers as less important. Intraday price transparency (3.1) in the government market rated third in importance. Pricing in both the corporate and government bond market retained the same average rating as in the previous survey.
The relatively low scores for formal bond pricing agencies and credit rating harmonization suggest that market makers in the corporate bond market do not view them as a universal remedy to the market pricing issue. More highly developed bond markets tend to attach less importance to credit rating harmonization. Improvements to clearing and settlement (2.7) and introducing mandatory bid-ask spreads (2.5) were seen as less important in raising liquidity in government bond markets.
Views diverge on the value of tax incentives for increasing liquidity.
Market makers from low tax environments continue to attach relatively little importance to further tax reform. Tax incentives as an impediment to liquid bond markets ranked higher among market makers in the corporate bond market because corporate bonds are not a mandatory investment as government bonds are for many participants, making them more sensitive to after-tax yield than government bonds.
There is greater importance attached to regional initiatives to promote more liquid regional bond markets.
Multilateral institution’s issuance (2.6) and guarantee mechanisms (2.6)—creating benchmark yield curves for corporate bond markets—which ranked low in both surveys in terms of impact on liquidity, have other tangible benefits, as they raise international awareness of a market’s development, and also ensure greater issuer diversity. Thirty-four percent of the respondents said they do or would hold a high percentage (31% on average) of foreign currency assets, indicating the value of work on improving conditions for cross-border investment. Because nonresident investors choose to invest in a market’s bonds mainly for their expected total return and for risk diversification, trading decisions will consistently differ somewhat from those of domestic investors. In this way, they provide a vital source of investor diversification, a key element in market liquidity and accurate risk pricing.

A S I A B O N D M O N I T O R
��
This is also seen in the iTraxx Asia ex-Japan Credit Default Swap,
which measures how offshore financing costs have increased for
a basket of issuers—including East Asian banks and nonbanks as
well as governments (Figure 1�). The higher CDS spreads for
Asian debt compared with European and US high-yield spreads
reflect rising concerns about deteriorating credit quality and the
ability of Asian high-yield borrowers to refinance in the more
difficult environment.
Credit tightening has not been as severe in Asia, although corporate yields are higher than in mid-2007 and some borrowers have delayed bond issues, relying instead on short-term finance.
Banks are also being extremely cautious in providing finance
to corporate clients. Interbank risk premiums remain high in
international markets because financial institutions are uncertain
of each other’s true credit quality. As risk premiums have risen
substantially elsewhere, many Asian based corporations have
shifted their bond issuance programs to domestic markets,
resulting in some “crowding out” of second-tier borrowers.
However, the existing pools of liquidity in local currency markets
have ensured that the impact has been limited. It is expected
that the Asian offshore markets will remain subdued into the
second half of the year.
As long as inflation-fighting remains the region’s central bank
bias, domestic local currency bond markets are likely to see
higher yields. The combination of an uncertain export sector and
potentially higher interest rates would discourage companies from
accessing credit markets until the economic outlook becomes
clear. Governments are also likely to meet their recent promises
of increased spending to support domestic demand, which should
translate into higher levels of LCY government bond issuance.
Risks to the Outlook
Following the sharp deterioration in financial market conditions
in the second half of 2007, downside risks to the outlook have
increased considerably. It is likely that financial market conditions
will be stressed for some time, with no regions escaping entirely
unscathed. There are three main risks that—if they transpire
Figure 19: iTraxx Asia ex-Japan Crossover �-year
0
50
100
150
200
250
0
50
100
150
200
250
ITRAXX Asia Excluding JapanITRAXX Japan S8 Senior 5 Year
basis points
basis points
Sep-07
Nov-07
Jan-08
Mar-08
Source: Thomson DataStream.

A S I A B O N D M O N I T O R
��
singularly or in combination—could cause problems with the
global economy: (i) a sharper-than-expected and/or more
protracted downturn in the US; (ii) financial disruption in another
asset class; and (iii) sustained inflationary pressures. These
vulnerabilities—heightened by the fact that recent financial
events have undermined market confidence in several financial
system participants—also weaken the ability of the global financial
system to cope with an intensified or more broad-based financial
crisis.
Global financial market disruption could worsen if the US economic contraction becomes protracted or deepens.
A deeper-than-expected US GDP contraction could instigate a
more significant global economic downturn through trade and
financial linkages. The slumping US housing market continues
to spill over into business and the real sector and threatens to
damage the US labor market. Heightened anxiety in financial
markets over credit tightening could drag still-resilient business
investment and household consumption into the morass.
Consumers already face significant headwinds as household debt
remains high, job prospects worsen, and rising inflation erodes
real income.
Aggressive monetary easing by the US Fed also raises the specter
of a further decline in the value of the US dollar, exacerbating
current swings in global financial flows and markets. While a
weaker dollar helps US trade perform better, adverse terms-of-
trade effects would reduce exports from US trading partners and
slow growth elsewhere. The dollar decline could also become
more abrupt, risking a disorderly adjustment in global currency
and financial markets, as underlying global payment imbalances
emanating from the large US current account deficit remain
significant. Should global investor appetite for dollar assets
suddenly wane, a sharp contraction of US aggregate demand and
a severe disruption in financial markets would have a significant
impact on emerging East Asian markets and foreign exchange
reserve holdings. Another related concern is that aggressive
easing by the US Fed and the concomitant decline in dollar-value
may risk fuelling inflation further, forcing the US central bank
to cut short its monetary easing before a firm recovery takes
hold.

A S I A B O N D M O N I T O R
��
Continued financial market volatility places pressure on market participants to cover rapidly shifting positions, increasing possible new credit disruption that could affect both global and regional financial markets.
Several forces have contributed to current financial market
volatility: (i) a combination of payments imbalances, which
continue to impact foreign exchange and capital markets;
(ii) successive decreases in interest rates; (iii) higher energy
and food prices; together with (iv) an increase in the risk of a
recession in the US. Meanwhile, there has been an adjustment
in equity markets of emerging economies resulting from a
reassessment of the risks by investors.
Financial markets may have to adjust to these new conditions that
reflect reduced availability of cheap credit and to higher volatility
in both debt and equity markets. Liquidity conditions are likely
to remain tighter than in recent years, and the potential impact
of financial market or economic shocks on firms is likely to be
greater now than it was just one year ago. The ongoing fallout
from the credit tightening and the uncertainty over the size of
any potential demand shock on regional exports to the US—on
top of further expected cuts in US dollar interest rates—reflects
investor concern that more bad news is on the way concerning
subprime mortgage write-downs. Financial markets can also
take a turn to the worse if investors en masse decide to dump
risky assets from their portfolios, pressuring the credit tightening
further (Figure 20).
Economies in the region that experienced rapid increases in
capital inflows and higher rates of credit growth over the past few
years—including Indonesia, Korea, and Philippines—also remain
vulnerable to a sudden reversal in capital flows. Recent swings
in global financial flows and heightened volatility can be further
exacerbated by a sudden unwinding of the yen carry trade or
rapid currency movements in response to major US monetary
policy movements.
0
2
4
6
8
10
12
14
16
2004 2004 2005 2005 2006 2006 2007 2007 2008
Volatility (in % of mean return)
Equities (Weighted Average Equity Market Indices)Bonds (EMBI)Currencies (JPMorgan)
Figure 20: Increased volatility in Equities, Bonds and Currencies
Source: Bloomberg LP.

A S I A B O N D M O N I T O R
�7
Inflation continues to exert pressure on most regional economies where sustained increases in food and energy prices pose a significant risk, constraining policy options amid slowing growth.
Aside from high commodity prices, additional inflationary pressure
emanates from higher asset prices as the region remains flush
with liquidity due to strong private capital inflows. A dilemma
confronts many monetary authorities—while accommodative
policies may ease funding pressure for critical-but-impaired
credit intermediaries, those same policies may stoke inflation.
Aggressive tightening in the region to deal with inflation risks could
fuel more capital inflows and asset price inflation, precipitating
greater currency appreciation in the process (Figure 21).
Higher prices and resulting higher production costs could reduce
corporate real current and future cash flows, increasing volatility
in equity markets, causing the value of long-term savings to
decline, and widen bond spreads. Any decline in equity markets
and bond portfolios would adversely affect corporate pension
provisioning and cause associated balance sheets to deteriorate,
and also reduce alternative funding sources available. Financial
firms could see increasing losses as businesses struggle to meet
debt obligations and a fall in consumer disposable and real
incomes leave them unable to repay mortgages and unsecured
loans. A significant commodity price shock could depress
currencies of commodity-importing nations and lead to sharp
movements in the price of emerging market debt. Despite the
higher costs, higher inflation together with continued rate cuts
could benefit some highly indebted consumers through eroding
the real value of their debt.
Policy Challenges
Bond market development continues to be one of the most
significant policy goals in Asia. It is widely considered an important
step toward preventing another financial crisis. The world
economy has, however, entered a difficult phase, with financial
market turmoil spreading to the real economy. The rapid growth
in complex instruments sold by banks to investors and the lack
of transparent information about many contracts has exacerbated
the loss of confidence in debt markets. To restore this confidence,
concerted efforts are needed among policy makers in the region
China, People's Rep. of
Korea, Rep. of
0
2
4
6
8
10
12
14
Indonesia
Philippines
ThailandJapan
Jul07
Interest rates(in percentage)
Hong Kong, China
Jan-04
Jan-05
Jan-06
Jan-07
Jan-08
Figure 21: Regional Policy Rates
Source: Bloomberg LP.

A S I A B O N D M O N I T O R
�8
and from monetary authorities, financial institutions, and credit
rating agencies in individual economies. The challenge is to find
a balance that fosters innovation without leaving the system too
vulnerable to the excesses and risks that tend to accompany
large structural change.
Against the backdrop of the recent turbulence, several systemic
shortcomings have shown themselves, mostly in markets, but also
in the regulatory and supervisory systems—both in mature and
emerging markets. These include the need to (i) improve legal and
regulatory frameworks to ensure certainty and transparency; (ii)
remove constraints to market entry and investment and encourage
broadening investor diversity (to promote greater demand for
local currency bonds); (iii) develop derivative and swap markets;
(iv) strengthen financial market infrastructure—including relevant
data compilation and comparison; and (v) increase regional
cooperation to better understand the links between changes in
the real economy and those in financial markets—and in the wider
ramifications of how continued uncertainty can affect regional
financial stability.
Bolster investor confidence by strengthening legal protection and thus certainty, improve standards of corporate governance and transparency, and adhere to international accounting standards.
To encourage private and quasi-public corporations to issue
local-currency bonds, government policies to facilitate the
issuance of local bond issuance and promote the demand for
local currency bonds will be needed. In particular, legal and
regulatory frameworks should be established to make it possible
for companies to issue other debt instruments for infrastructure
and other securitized instruments. Discriminatory taxes, such
as transaction taxes, must also be diminished and removed to
make the trading of local currency bonds less costly. In addition,
strengthening legal protection, improving standards of corporate
governance and transparency, and enforcing international
accounting standards are also needed to provide certainty
and increase investor confidence in the local currency bonds.
A governance structure that enforces contracts and resolves
disputes in a reliable and speedy manner is crucial to developing
financial markets. In recognizing the importance of internationally
accepted standards and codes of practice, most Asian economies
have taken steps to comply with the International Organization

A S I A B O N D M O N I T O R
��
for Securities Commission (IOSCO) principles for securities
regulation to help the development of the capital markets and
protect investors.
Regulatory capacities also need to be strengthened with regard
to safeguarding against risks associated with non-transparent
instruments and excessive risk-taking or herding behavior.
Securities market regulation needs to enforce rules and regulations
that can effectively protect investors; ensure that markets are
fair, efficient and transparent; and reduce systemic risk.
Reduce constraints to market entry, investment, and encourage investor diversity to promote greater demand for local currency bonds.
Improving the regulatory environment, lowering cross-border
transaction barriers, and encouraging more provident, pension,
and insurance funds to participate can greatly encourage the
participation of international financial intermediaries and foreign
investors in regional bond markets. The further relaxation of
capital and exchange controls and removal of transaction taxes,
withholding taxes on interest, and taxes on capital gains earned
by foreign investors are some measures that can facilitate this
process (Box �).
Develop derivative and swap markets to broaden the investor base, increase market liquidity, and allow a wider dispersal of risk.
Developing derivatives and swap markets is another critical
measure for broadening the investor base and for increasing
liquidity in both government and corporate bond markets. These
markets allow a wider dispersal of risk as derivatives and swaps
help reduce costs, enhance returns, and allow investors to
manage risks with greater certainty and precision. Derivative and
swap markets also help address exchange and interest rate risks.
The development of inter-dealer platforms can also contribute to
broadening investor diversity as they allow monitoring of trading
activity and prices from several competing dealers.

A S I A B O N D M O N I T O R
�0
A diversified investor base for fixed-income securities is important for ensuring high liquidity and stable demand in the financial market.
In a 2008 survey—an update of the more encompassing 2006 AsianBondsOnline survey on market liquidity—market-makers in East Asia ranked increasing investor diversity as the most important step required to develop both government and corporate local currency bond markets. A heterogeneous investor base with different maturity horizons, risk preferences, and trading motives ensures active trading, which creates high liquidity. Investor diversity is, however, not simply a case of encouraging a larger pool of investors to participate in bond markets, particularly if they all invest in the same way. The “herd” mentality—investors enter and exit markets at the same time—does not create robust financial systems, as the recent experience with the US subprime mortgage crisis shows.
The current low level of turnover characterizing East Asian local currency bond markets could be enhanced through policies that encourage the development of a diverse investor base. The investor base in emerging East Asia tends to be dominated by government-controlled institutional investors, such as provident funds and insurance companies, who tend to operate relatively passive portfolio strategies. Once a bond is issued, it normally disappears into the portfolios of buy-and-hold investors. Foreign investors in local currency debt markets are generally more active, focusing their strategies on exchange rate differentials and relative growth prospects, for example. But foreign investors are notably missing from several markets in the region, where withholding taxes or the absence of hedging instruments such as currency swaps discourage participation. Hedge funds and funds
like fixed-income cash management funds—which tend to trade more actively—largely avoid East Asian markets with low turnover except for opportunistic or directional trades.
P o l i c i e s t h a t e n c o u r a g e investment diversity
Developing derivative markets; examining the role of dominant investors; reevaluating regional cooperation strategies; and reforming tax systems are all critical measures that can encourage more provident, pension, and insurance funds to participate in East Asia’s local currency bond markets. Reducing cross-border transactions barriers to encourage participation of international financial intermediaries and foreign investors in these markets would also help.
Derivative markets in general attract a wider array of investors—foreign investors in particular.
The importance of developing deep forward foreign exchange and interest rate swap markets is critical to widening the investor base generally and to attracting foreign investors in particular. The challenge is to create appropriate market instruments that entice investors to become market participants. Derivatives make it possible for both borrowers and lenders to customize their risk exposures and adjust them over time. They are a useful tool for risk management as they can help reduce costs, enhance returns, and allow investors to manage risks with greater certainty and precision. Effective hedging mechanisms can also encourage asset managers to transact larger parcels of bonds and assume greater portfolio risk, increase turnover in both derivatives and bond markets, and contribute to narrower bid-ask spreads. Transactions costs in derivative markets are generally lower and encourage investors to take short-term trading positions—wide bid-ask
spreads and other transaction charges in physical bond markets discourage short-term trading.
Government-controlled institutional investor strategies must adapt to and support capital market development goals.
Dominant investor groups such as state-owned pension and mutual funds play an important role in the early stages of bond market development. They help mobilize savings and create a demand base for local currency debt securities. But it is a fine balancing act—as large investors can dominate new issues, restricting bond supply to the secondary market. Also, their relatively restrictive investment policies can compromise market innovation and reduce returns. Some jurisdictions—such as Hong Kong, China—outsource provident systems to a number of money managers to encourage diversity, while some Eastern European countries have broken up state-owned financial conglomerates along product lines. Even though counterintuitive, granting government pension funds investment flexibility—such as allowing limited offshore investment— can improve turnover in local currency debt markets and enhance a fund’s risk-return characteristics with less exposure to local currency debt markets.
Taxing financial instruments has significant implications for financial market development.
Considering the importance of financial markets in the development of a national economy, it is important that tax policies are compatible with financial market development goals, while not seriously compromising principles of good taxation. Focusing tax strategies on promoting turnover of debt portfolios rather than taxing the investment vehicles themselves may prove to have greater effect. Tax free status for mutual funds in Thailand, for
Box 3: Are There Ways to Broaden Investor Diversity?

A S I A B O N D M O N I T O R
�1
instance, gave these funds an automatic tax advantage over other investment vehicles. However, it has hurt market turnover as mutual funds adopted passive investment strategies.
Do large retail markets encourage investor diversity?
Catering to the needs of retail investors is often seen as an essential part of the overall strategy to develop a more diversified investor base for government securities. However, the presence of more retail investors in
bond markets does not automatically mean greater investor diversity. First, retail investors tend to prefer buy-and-hold strategies, similar to long-term institutional investors. They add little to the price-discovery process as there is little secondary market retail turnover.1 Second, where a market’s
1 A recent National Association of Securities Dealers (NASD) study found that while retail transactions account for approximately 60% of the number of transactions in US corporate bond markets, they constitute less than 4% of transactions volume in US dollar terms—a very small percentage of turnover. Anecdotal evidence suggests that East Asia’s experience is very similar.
total government bond supply is limited by budget surpluses, special issues for retail investors can crowd out wholesale bond issues used to establish benchmark prices—further compromising liquidity. Third, retail bond issues can draw contributions away from the contractual savings industry if retail bonds are offered above wholesale market rates.
Improve re levant data compi la t ion and comparison.
Recent financial market turmoil has highlighted the importance
of adequate data in order to make reliable assessments of the
risk in financial institutions and markets. Limited aggregated
data on emerging East Asian bond markets has been a long
standing problem. The analysis of local currency bond markets
is particularly limited in the areas of currency composition
and maturity, and coverage of corporate bond markets. While
initiatives have been taken by international financial institutions,
local bond markets are also encouraged to improve the quality,
comparability, and consistency of local bond market data.
Strengthen broader arrangements for regulatory oversight and regional cooperation in the areas of information-sharing and in coordinated actions to maintain financial stability.
Just as the origins and the development of the financial turmoil
lie in the interaction of macroeconomic and financial market
policies, the resolution of the turmoil will require action in
both areas. Continued cooperation among policy makers in the
region and efforts in national economies to address issues of
restoring confidence in financial markets offers the best hope
for ensuring the stability of global financial markets. There is a
need to strengthen cooperation in the areas of (i) the capacity
of monetary and regulatory authorities to address near-term

A S I A B O N D M O N I T O R
�2
stress and longer-term financial stability; (ii) information-sharing
in monitoring and regulating financial institutions; and (iii)
coordinated actions among agencies responsible for supervisory
regulation and oversight.
To ensure that monetary and regulatory authorities have the
capacity to react rapidly to changes, measures are needed to
strengthen not only the capacity of monetary and regulatory
authorities to address any near-term stress and longer-term
financial stability, but also the broader arrangement for financial
market oversight. This could include measures to reestablish
counterparty confidence and soundness of financial institutions
that would allow interbank markets to function normally, and for
intermediation to continue. Risk management and stress-testing
techniques need to be improved to avoid collective bad outcomes
and to account for incentives for risk-taking.
National and cross-border financial stability arrangements
for information-sharing in monitoring and regulating financial
institutions could be strengthened. There needs to be greater
convergence on what kind of institutions qualify for liquidity
support, what kind of collateral to accept, and on the terms of
liquidity provided. Auditors and supervisors will need to encourage
greater consistency across financial institutions on how assets
are valued and how write-downs are determined.
To facilitate effective, timely, and coordinated responses to
financial system stress, measures could also be considered to
strengthen coordinated actions among the agencies responsible
for supervisory regulation and oversight, the provision of liquidity,
and bank resolution.

A S I A B O N D M O N I T O R
��
India's Bond Market—Developments and Challenges Ahead
Market Development and Outlook
India remains bank-dominated but its financial system is transforming rapidly—equity and government bond markets have developed strongly, while corporate bond markets lag behind.
India’s economy has expanded an average of about 8.5% annually
for the past 4 years, driven by rising productivity and investment.
After rising sharply in early 2007, inflation has ebbed, and the
current account deficit has moderated. India’s bright prospects
have attracted record capital inflows, even amid heightened global
uncertainty and slowing growth in the United States (US).
The Indian financial system is now in a process of rapid
transformation marked by strong economic growth, increased
market robustness, and a considerable increase in efficiency.11
Bank and financial intermediation, however, remain undeveloped
with respect to lending and deposits, and most banks remain
largely controlled by public sector institutions, limiting the
development of a true credit culture, the skills to assess credit
risks, and a willingness to accommodate any but the lowest risk
borrowers.
Overseas investors bought a net USD18.8 billion of stocks and
bonds during January–November 2007, compared with the
previous record of USD9.5 billion in the same period in 2006.
Long-term interest rates hover around 8%. Real estate markets
have been buoyant, although they have cooled recently, and the
banking system remains sound and well capitalized. In March
2007, the capital adequacy ratio stood at 12.3%, well above the
8% minimum prescribed under the Basel I accord. Amid strong
credit growth, the ratio of scheduled commercial banks’ gross
11 ADB has disbursed loans and technical assistance to develop India’s capital market in areas that include, regulation and supervision of derivative instruments, development of secondary debt market, and development and reform of mutual fund industry, among others.
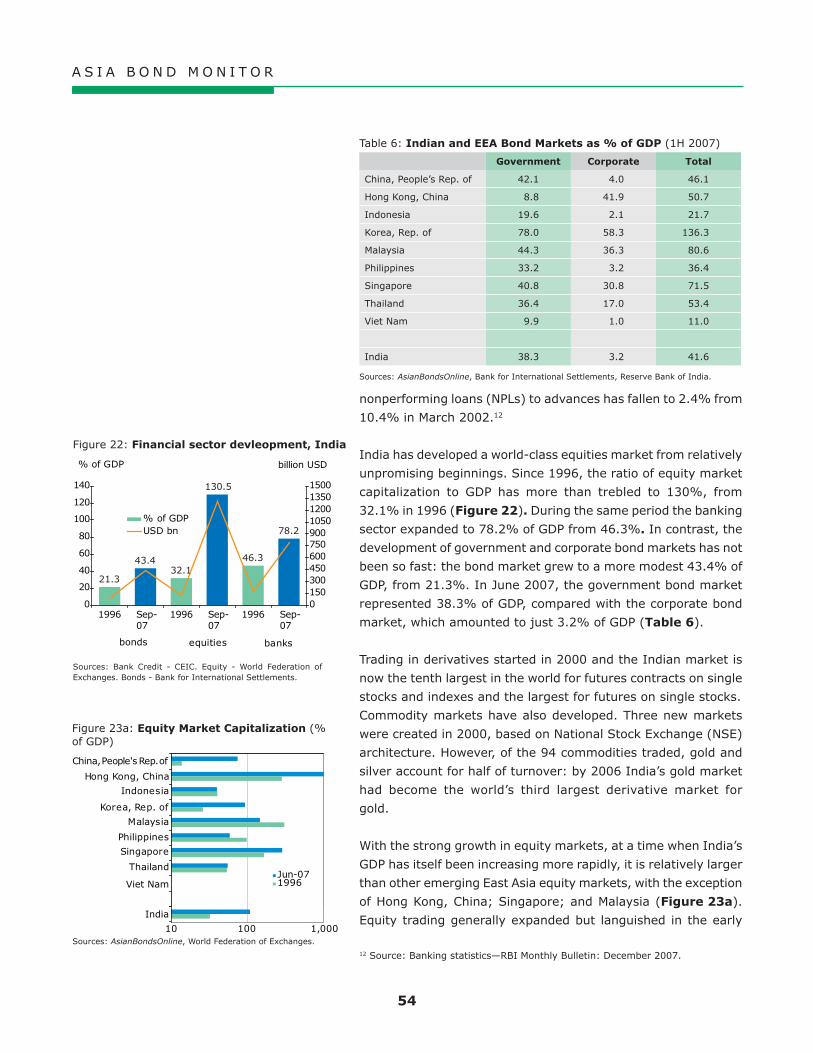
A S I A B O N D M O N I T O R
��
nonperforming loans (NPLs) to advances has fallen to 2.4% from
10.4% in March 2002.12
India has developed a world-class equities market from relatively
unpromising beginnings. Since 1996, the ratio of equity market
capitalization to GDP has more than trebled to 130%, from
32.1% in 1996 (Figure 22). During the same period the banking
sector expanded to 78.2% of GDP from 46.3%. In contrast, the
development of government and corporate bond markets has not
been so fast: the bond market grew to a more modest 43.4% of
GDP, from 21.3%. In June 2007, the government bond market
represented 38.3% of GDP, compared with the corporate bond
market, which amounted to just 3.2% of GDP (Table �).
Trading in derivatives started in 2000 and the Indian market is
now the tenth largest in the world for futures contracts on single
stocks and indexes and the largest for futures on single stocks.
Commodity markets have also developed. Three new markets
were created in 2000, based on National Stock Exchange (NSE)
architecture. However, of the 94 commodities traded, gold and
silver account for half of turnover: by 2006 India’s gold market
had become the world’s third largest derivative market for
gold.
With the strong growth in equity markets, at a time when India’s
GDP has itself been increasing more rapidly, it is relatively larger
than other emerging East Asia equity markets, with the exception
of Hong Kong, China; Singapore; and Malaysia (Figure 2�a).
Equity trading generally expanded but languished in the early
12 Source: Banking statistics—RBI Monthly Bulletin: December 2007.
Table 6: Indian and EEA Bond Markets as % of GDP (1H 2007)
Government Corporate Total
China, People’s Rep. of 42.1 4.0 46.1
Hong Kong, China 8.8 41.9 50.7
Indonesia 19.6 2.1 21.7
Korea, Rep. of 78.0 58.3 136.3
Malaysia 44.3 36.3 80.6
Philippines 33.2 3.2 36.4
Singapore 40.8 30.8 71.5
Thailand 36.4 17.0 53.4
Viet Nam 9.9 1.0 11.0
India 38.3 3.2 41.6
Sources: AsianBondsOnline, Bank for International Settlements, Reserve Bank of India.
10 100 1,000
Jun-071996
China, People's Rep. of
India
Thailand
Singapore
Philippines
Malaysia
Korea, Rep. of
Indonesia
Hong Kong, China
Viet Nam
Figure 23a: Equity Market Capitalization (% of GDP)
Sources: AsianBondsOnline, World Federation of Exchanges.
21.3
43.432.1
130.5
46.3
78.2
banksequitiesbonds
0
20
40
60
80
100
120
140
1996 Sep-07
1996 Sep-07
1996 Sep-07
% of GDP
01503004506007509001050120013501500
billion USD
% of GDPUSD bn
Figure 22: Financial sector devleopment, India
Sources: Bank Credit - CEIC. Equity - World Federation of Exchanges. Bonds - Bank for International Settlements.

A S I A B O N D M O N I T O R
��
2000s, when world equity markets were falling and Indian
government debt was rising strongly.
India remains a bank-dominated market (Figure 2�b), and the
relative importance of bank assets as a percentage of GDP has
continued to grow partly as banking penetration has deepened
with financial liberalization, and partly as a result of the ongoing
need for deficit financing. However, the ratio of bank assets to
GDP is still low by comparison with other emerging East Asian
economies, indicating that India still has some way to go before
its banking sector is fully developed. The same pattern is also
seen in the People’s Republic of China (PRC), which like India has
a largely state-owned/controlled financial sector. Other emerging
East Asia markets have seen a decline in banking assets as a
percentage of GDP since 1996, reflecting greater diversification
into other forms of finance, especially for corporate borrowers,
following the Asian financial crisis.
India’s government bond market has grown steadily—largely due to the need to finance the fiscal deficit—and is comparable to many government bond markets in emerging East Asia.
At 38% of GDP, the Indian government debt market compares
well with markets such as Thailand, Singapore, Malaysia and
PRC (Figure 2�c). In absolute terms, however, given India’s
greater overall size, the Indian government bond market is
considerably larger than most other emerging East Asian markets
(Table 7).
0 20 40 60 80
Jun-071996
China, People's Rep. of
India
Thailand
Singapore
Philippines
Malaysia
Korea, Rep. of
Indonesia
Hong Kong, China
Viet Nam
Figure 23c: Government Bonds (% of GDP)
Sources: AsianBondsOnline, Bank for International Settlements, Reserve Bank of India.
Table 7: Indian and EEA Bond Markets (USD billion) (1H 2007)
Government Corporate Total
China, People’s Rep. of 1,250.79 117.63 1,368.42
Hong Kong, China 17.20 82.00 99.20
Indonesia 78.55 8.49 87.04
Korea, Rep. of 736.16 550.17 1,286.33
Malaysia 76.52 62.63 139.15
Philippines 45.38 4.36 49.74
Singapore 60.90 45.98 106.89
Thailand 93.18 43.33 136.51
Viet Nam 6.41 0.67 7.08
India 364.26 30.57 394.84
Sources: AsianBondsOnline, Bank for International Settlements, Reserve Bank of India.
0 40 80 120 160
Jun-071996
China, People's Rep. of
India
Thailand
Singapore
Philippines
Malaysia
Korea, Rep. of
Indonesia
Hong Kong, China
Viet Nam
Figure 23b: Bank Assets (% of GDP)
Sources: AsianBondsOnline, Reserve Bank of India, International Financial Statistics (IMF), CEIC.

A S I A B O N D M O N I T O R
��
The need to finance a large fiscal deficit has stimulated issuance
and growth of the government bond market. Since 1992, deficit
finance has relied increasingly on market borrowing rather than
the previous policy of monetizing the deficit. The government
market comprises approximately 104 issues with a total nominal
value of about USD364 billion.
The corporate bond market is less developed than most in emerging East Asia, with private placements dominating.
At 3% of GDP, corporate bonds are comparable to levels in the
Philippines and Indonesia where corporate finance is less well-
developed, and with the PRC where state-ownership remains
dominant (Figure 2�d). That said, corporate bond markets
remain small in much of the region, with the exception of Hong
Kong, China and the Republic of Korea (Korea). Even in absolute
terms India’s corporate bond market is minuscule in relation to
its economic size.
The role of various sources of corporate finance demonstrates that
there is no single model for corporate finance—some economies
rely more heavily on equity finance, while others more on bank
finance. However, few rely so little on corporate bonds as India
does.
The turnover ratio for government bonds is lower than in most markets in emerging East Asia—the corporate ratio compares well, but the small number of outstanding bonds means the secondary market is small and illiquid.
The turnover ratio for Indian government bonds, according to the
central bank—Reserve Bank of India (RBI)—was 109%, meaning
that, on average, government bonds changed hands slightly
more than once a year.13 Although some caution is necessary
when making international comparisons because of differing
methodologies,14 government bond market turnover ratios in
other emerging East Asian markets were higher (Figure 2�a).
13 Turnover ratio is calculated as 12 months trading as a percentage of market capitalization.14 Indian banks and some other investors are required to hold a certain percent of their assets in government bonds. These holdings can be traded but arguably the “free float” of Indian government bonds is likely to be quite low, hence the caution of too much reliance on turnover ratios.
1 10 100 1,000 10,000
200720062005
China, People's Rep. of
India
Viet NamThailand
SingaporePhilippines
MalaysiaKorea, Rep. of
Indonesia
Hong Kong, China
Figure 24a: Indian and EEA Government Securities Turnover (% of Average Outstanding, in Log Scale)
Source: AsianBondsOnline, Reserve Bank of India.
0 20 40 60
Jun-071996
China, People's Rep. of
India
Thailand
Singapore
Philippines
Malaysia
Korea, Rep. of
Indonesia
Hong Kong, China
Viet Nam
Figure 23d: Corporate Bonds (% of GDP)
Sources: AsianBondsOnline, Bank for International Settlements, Reserve Bank of India.

A S I A B O N D M O N I T O R
�7
Economic growth in India has picked up in recent years, and like other integrating Asian economies, it too requires large amounts of efficiently intermediated capital to sustain its development. However, an important constraint to financial reform has been dealing with the vestiges of financial “repression”—deliberate policies that crowd out the private sector from credit markets and limit the ability of financial markets to develop as intermediaries for saving.
Years of deficit financing have led to large-scale intervention and state ownership of financial intermediation. High statutory reserve requirements, extensive directed lending to priority sectors (including mandatory holdings of government securities by banks), regulated interest rates, credit ceilings, and other controls are examples.
Financial market liberalization
Reforming and liberalizing financial markets began in the wake of the country’s 1991 balance-of-payments crisis. The thrust of these reforms was to promote a diversified, efficient and competitive financial system, with the ultimate objective of improving the allocation of resources through operational flexibility, improved financial viability, and institutional strengthening. The pace of reform was, however, slower than those in product markets, partly because the introduction of stricter prudential controls on banks revealed significant problems in asset portfolios. Prior to the reforms, state-owned banks controlled 90% of bank assets—compared with approximately 10% at end-2005—and channelled an extremely high proportion of funds to the government. Interest rates were determined administratively; credit was allocated on the basis of government policy and approval from the Reserve Bank of India (RBI) was required for individual loans above a certain threshold. Capital markets were underdeveloped, with stock markets
fragmented across the country. The major stock market1 acted mainly in the interest of its members, not the investing public. Derivative markets did not exist and comprehensive capital controls meant that companies were unable to bypass domestic controls by borrowing abroad.
Concerns over the 1997/98 Asian financial crisis and its contagion effects further spurred Indian authorities to strengthen the domestic financial system. Reforms were, and continue to be, based on several principles: (i) mitigate risks in the financial system; (ii) efficiently allocate resources to the real sector; (iii) make the financial system competitive globally; and (iv) open the external sector. The goal was to promote a diversified, efficient, and competitive financial system which would ultimately improve the efficiency of resource allocation through operational flexibility, enhanced financial viability, and institutional strengthening.
Banking sector reform
Reform of the banking system has been gradual and sequenced, focusing on improved prudential control, recapitalization of public-owned banks, and the introduction of greater competition. Reforms have included the establishment in 1994 of a Board of Financial Supervision within Reserve Bank of India; substantially tightened rules on bad loans, and convergence of regulatory norms with international best practices. Various legal and technology-related measures have likewise been implemented, such as the strengthening of credit information and creditors’ rights, and the development of a dedicated communication backbone for banks.
1 A number of exchanges exist, the National Stock Exchange of India Limited (NSE) and the Bombay Stock Exchange are the two most significant stock exchanges in India, and between them are responsible for the vast majority of share transactions.
Work to introduce the new Basel II regulatory system is underway and a pilot project was launched in 2003 to operate a risk-based supervision system. The introduction has, however, been postponed to 2009 for banks with only domestic operations, and to 2008 for other banks as it takes time to raise capital. Enhanced competition has also been introduced by allowing new entries into the market. A dozen private Indian banks have been created and about 30 new foreign banks had entered the market and started operations by end-2006. Prudential reforms have been implemented. But while interest rates have been deregulated, controls remain in four areas—savings deposit accounts, small loans in priority areas, export credits, and nonresident transferable rupee deposits. The reduction in the lending requirement to government from 63.5% to 30.0% of bank assets has given banks greater lending latitude. Other measures include ending the RBI’s participation in the primary market for government securities and lending to the government; removal of the legal ceiling on the statutory liquidity ratio; and abolishment of limits on both the floor and ceiling of the cash reserve ratio, allowing RBI to alter these ratios depending on prevailing monetary and economic conditions.
Banking sector reforms have been sequenced to correspond with changing regulations of the foreign exchange market. The government has allowed the exchange rate to gradually float (as opposed to a “crawling” peg), and full current account convertibility has been introduced, with de facto capital account convertibility for nonresidents, and calibrated liberalization for residents. Other recent measures include foreign participation in the Indian foreign exchange market, unlimited hedging of genuine foreign exchange risk, and the introduction of new instruments such as interest rate and currency swaps, options, and forward contracts.
Box �: Reforming India’s Financial Sector
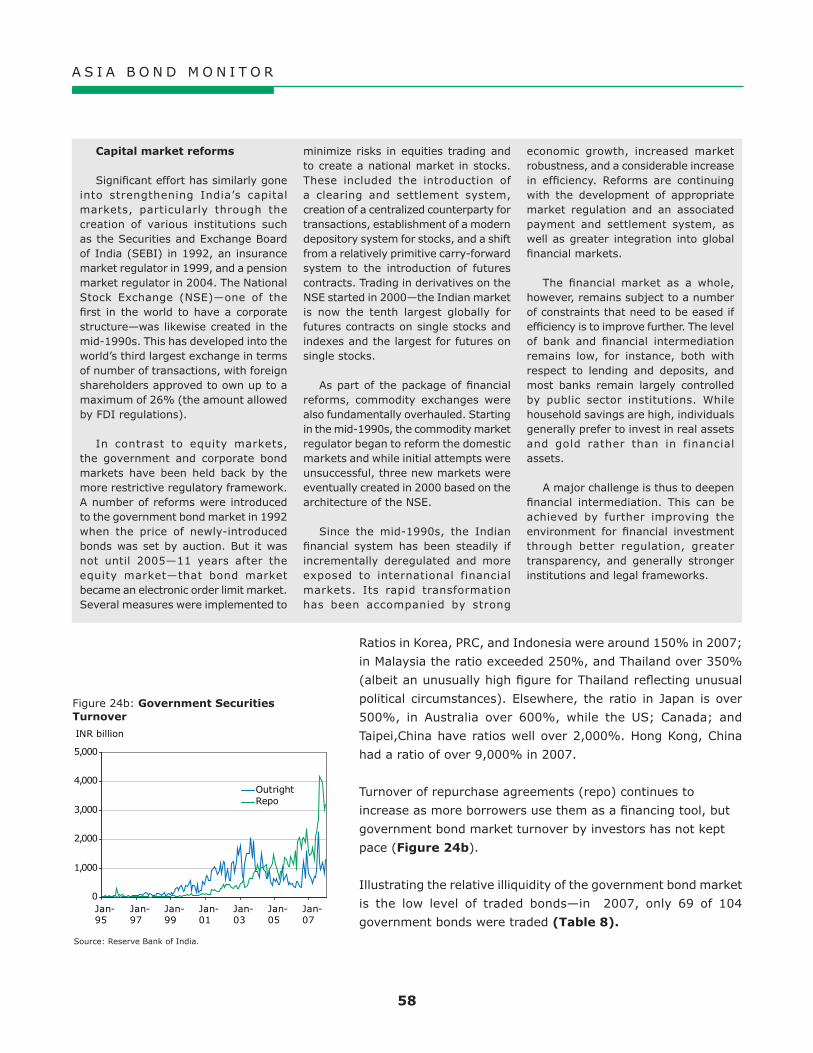
A S I A B O N D M O N I T O R
�8
Capital market reforms
Significant effort has similarly gone into strengthening India’s capital markets, particularly through the creation of various institutions such as the Securities and Exchange Board of India (SEBI) in 1992, an insurance market regulator in 1999, and a pension market regulator in 2004. The National Stock Exchange (NSE)—one of the first in the world to have a corporate structure—was likewise created in the mid-1990s. This has developed into the world’s third largest exchange in terms of number of transactions, with foreign shareholders approved to own up to a maximum of 26% (the amount allowed by FDI regulations).
In contrast to equity markets, the government and corporate bond markets have been held back by the more restrictive regulatory framework. A number of reforms were introduced to the government bond market in 1992 when the price of newly-introduced bonds was set by auction. But it was not until 2005—11 years after the equity market—that bond market became an electronic order limit market. Several measures were implemented to
minimize risks in equities trading and to create a national market in stocks. These included the introduction of a clearing and settlement system, creation of a centralized counterparty for transactions, establishment of a modern depository system for stocks, and a shift from a relatively primitive carry-forward system to the introduction of futures contracts. Trading in derivatives on the NSE started in 2000—the Indian market is now the tenth largest globally for futures contracts on single stocks and indexes and the largest for futures on single stocks.
As part of the package of financial reforms, commodity exchanges were also fundamentally overhauled. Starting in the mid-1990s, the commodity market regulator began to reform the domestic markets and while initial attempts were unsuccessful, three new markets were eventually created in 2000 based on the architecture of the NSE.
Since the mid-1990s, the Indian financial system has been steadily if incrementally deregulated and more exposed to international financial markets. Its rapid transformation has been accompanied by strong
economic growth, increased market robustness, and a considerable increase in efficiency. Reforms are continuing with the development of appropriate market regulation and an associated payment and settlement system, as well as greater integration into global financial markets.
The financial market as a whole, however, remains subject to a number of constraints that need to be eased if efficiency is to improve further. The level of bank and financial intermediation remains low, for instance, both with respect to lending and deposits, and most banks remain largely controlled by public sector institutions. While household savings are high, individuals generally prefer to invest in real assets and gold rather than in financial assets.
A major challenge is thus to deepen financial intermediation. This can be achieved by further improving the environment for financial investment through better regulation, greater transparency, and generally stronger institutions and legal frameworks.
Ratios in Korea, PRC, and Indonesia were around 150% in 2007;
in Malaysia the ratio exceeded 250%, and Thailand over 350%
(albeit an unusually high figure for Thailand reflecting unusual
political circumstances). Elsewhere, the ratio in Japan is over
500%, in Australia over 600%, while the US; Canada; and
Taipei,China have ratios well over 2,000%. Hong Kong, China
had a ratio of over 9,000% in 2007.
Turnover of repurchase agreements (repo) continues to
increase as more borrowers use them as a financing tool, but
government bond market turnover by investors has not kept
pace (Figure 2�b).
Illustrating the relative illiquidity of the government bond market
is the low level of traded bonds—in 2007, only 69 of 104
government bonds were traded (Table 8).
0
1,000
2,000
3,000
4,000
5,000
Jan-95
Jan-97
Jan-99
Jan-01
Jan-03
Jan-05
Jan-07
INR billion
OutrightRepo
Figure 24b: Government Securities Turnover
Source: Reserve Bank of India.

A S I A B O N D M O N I T O R
��
Liquidity is clearly concentrated in a few bonds and does not
extend along the length of the yield curve, which has emerged
over a spectrum of 30 years. It is highly concentrated in 10-year
issues (bonds maturing in 2016/17 comprised 50% of all trading)
and 5-year issues (bonds maturing in 2010–12 were 20% of all
trading).
Until 2007, information on Indian corporate bond market turnover
was incomplete and largely anecdotal. In 2007, however, the
Securities and Exchange Board of India (SEBI) launched initiatives
to ensure more comprehensive reporting of the over-the-counter
(OTC) bond market (Figure 2�a). Current volumes are running
at low levels—around 150 transactions amounting to about
USD100 million per day. But corporate bond markets worldwide
are typically illiquid,15 so it may be overly optimistic to expect India
to develop a uniquely liquid corporate bond market. Nonetheless,
a more liquid market should eventually contribute to lower costs
of capital for issuers.
India’s corporate turnover ratio is quite high at 61%, comparing
favorably with most other emerging East Asian corporate bond
markets (Figure 2�b). However the small total of outstanding
corporate bonds in India means that the secondary market is
small and relatively illiquid, irrespective of the turnover ratio. The
same is also true for the PRC, which has a high turnover ratio
and a very small value of corporate bonds outstanding (relative
to GDP).
Government Bond Market
The government bond market has developed steadily—with an increased supply of bonds, market reforms, and infrastructure enhancements—while new fiscal discipline aimed at controlling the deficit may reduce new bond issuance.
Borrowing by the Indian government since the late 1990s has
been large and has grown rapidly. Government deficits have also
been large. The revenue deficit increased to 5% of GDP in fiscal
year 2001–02. Since then, although the deficit appears to be
15 Corporate bond markets even in developed markets—for example the Eurobond market— are notoriously illiquid with most bonds only trading actively for a brief period after issue and around the time of significant events, such as re-rating or redemption. They also tend to be institutional markets, so such trading as occurs tends to be in large blocks, putting further pressure on liquidity.
0 50 100 150 200 250 300 350 400
200720062005
China, People's Rep. of
India
Thailand
Malaysia
Korea, Rep. of
Indonesia
Hong Kong, China
Figure 25b: Indian and EEA Corporate Bonds Turnover (% of average outstanding)
Note: no available data for India in 2005 and 2006; 2007 turnover covers Jan to Oct onlySource: AsianBondsOnline, Securities and Exchange Board of India.
0500
1,0001,5002,0002,5003,0003,5004,0004,500
Jan Feb Mar Apr May Jun Jul Aug Sep Oct
Trades
0
20
40
60
80
100
120
140
160
Value INR billion
Trades (LHS)Value INR billion (RHS)
Figure 25a: Corporate Bond Turnover (2007)
Source: Securities and Exchange Board of India.
Table 8: Government Bonds—days traded in 2007
Days traded in 2007 Number of stocks
Over 200 3
150–199 5
100–149 13
50–99 15
25–50 11
Less than 25 22
0 35
10�
Source: Clearing Corporation of India.

A S I A B O N D M O N I T O R
�0
more under control at about 2.5% of GDP, growth has remained
strong and suggests the actual deficit has continued to increase,
calling for further government borrowing (Figure 2�).
The enactment of the Fiscal Responsibility and Budget Management
Act (FRBM) in 2003 was the culmination of a lengthy attempt
to devise a control strategy for public finances. The act requires
the government to follow a strategy to reduce the fiscal deficit
to less than 3% of GDP by 2009. Additionally the government is
required to produce a Medium Term Fiscal Policy Statement as
part of the annual budget, in which it explains the sustainability
of policies, how they are consistent with the FRBM, and to make
projections for the current and following 2 years.
The discipline this has imposed has led to the possibility of
breaking the upward momentum of the absolute deficit—though
it has shown considerable volatility over the past few years. More
importantly, the sharp acceleration in GDP growth since 2001 has
led to a major decline in the deficit as a proportion of GDP. From
its peak in 2001–02 the percentage has declined substantially,
and is now below the FRBM target for 2009. Despite the progress,
however, government borrowing remains high in absolute terms
and highly volatile (Figure 27). And government demands on
the market remain large, with outstanding debt at more than
90% of GDP.
0
200
400
600
800
1,000
1,200
94-95
95-96
96-97
97-98
98-99
99-00
00-01
01-02
02-03
03-04
04-05
05-06
06-07
07-08
(budget)
Indian fiscal year
INR billion
0.00.51.01.52.02.53.03.54.04.55.0
% of GDP
INR billion (LHS)As % of GDP (RHS)
Figure 27: Government Borrowing for Deficit Funding
Source: Reserve Bank of India.
0
200
400
600
800
1,000
1,200
1,400
1,600
1,800
2,000
1980-1981
1982-1983
1984-1985
1986-1987
1988-1989
1990-1991
1992-1993
1994-1995
1996-1997
1998-1999
2000-2001
2002-2003
2004-2005
2006-2007
Indian fiscal year
INR Bn
CentralState
Figure 26: Indian Government Market Borrowing
Source: Reserve Bank of India.

A S I A B O N D M O N I T O R
�1
Issuance, trading, settlement, and regulation in the government bond market follow conventional models. But the market features many small, illiquid issues and lacks bond-related derivative products.
The RBI operates the government bond market, and therefore acts
as monetary authority and debt manager, as well as regulator of
the government bond market and its key participants—primary
dealers and banks.16 Other participants are regulated by SEBI,
the Insurance Regulatory and Development Agency (IRDA), or
the Provident Fund regulator.
New securities are issued by auction, with primary dealers required
to participate. Trading is a mix of OTC bilateral negotiation and
an order matching system. Banks and primary dealers are the
main participants, but other investors have access to trading.
Some limited retail trade occurs on the stock exchanges. Bond
holdings have been dematerialized, existing as entries on the
books of depositories. India uses Real-Time Gross Settlement
(RTGS) and settlement is done on a net basis using delivery
versus payment (DVP).
Significant characteristics of the government bond market include
(i) a large number of issues that can be quite small; (ii) a large
proportion of electronic trading; (iii) the absence of bond-related
derivatives while equity market derivatives are
very active; and (iv) statutory requirements on
investors.
The government bond market has a long history
and, consequently, a very large number of
issues—of which many can be quite small. Each
column in Figure 28 represents the total value of
the government bonds outstanding which matures
in that year. The splits in each column represent
the value of each individual issue maturing in that
year. Thus in 2009–10, eight of the issues are due
to mature. It is clear that at most maturities there
are several issues, none of which is very large (or
therefore very liquid).
16 The trend in developed countries has been to separate the functions because of potential conflicts of interest and the difficulty of convincing the market that the debt management function is not using monetary policy to manipulate the government bond market. This discussion is occurring in India but a rapid change is not expected.
•
Mix of individual bonds maturing each fiscal year
0
5
10
15
20
25
30
35
($ billion) (Nominal)
2007-0
8
2009-1
0
2011-1
2
2013-1
4
2015-1
6
2017-1
8
2019-2
0
2021-2
2
2023-2
4
2025-2
6
2027-2
8
2031-3
2
2034-3
5
Figure 28: Indian Government Debt by Maturity
Source: Reserve Bank of India.

A S I A B O N D M O N I T O R
�2
A significant proportion of trading is conducted electronically.
The negotiated dealing system (NDS) allows a range of
trading styles including anonymous negotiation and order
matching. The order matching system is now the dominant
form of trading approaching an unusual 90% of market share
(Figure 2�). Several markets have tried to initiate some
form of electronic trading system for government bonds,
but none have had as much success as India in attracting
significant business.
As with bond markets in emerging East Asia, India has no
bond-related derivative market. An attempt to introduce
interest rate futures was unsuccessful, largely because banks
were only permitted to use the market for specific hedging
transactions. By contrast equity market derivatives have
been highly successful in India and now rank among the most
traded in the world.
India retains a number of statutory requirements on
investors. Banks, insurance companies, and pension funds are
required to hold 25% of assets in government securities. In
contrast, foreign investors have limited access to government
securities.
The Reserve Bank of India has introduced a number reforms since 1992 in an effort to move toward a more transparent and market-driven structure.
The process of auctioning new issues was introduced in 1992,
replacing the previous system whereby government issues were
allocated to investors—largely banks and state-owned investment
institutions. Until prohibited under the FRBM in 2006, the RBI
frequently intervened in the auction, taking substantial holdings
onto its own books (“devolvements”) to ensure the auction
achieved the right price.
Primary dealers were introduced in 1996 to support the auction
system. Primary dealers may be independent or may be linked to
banks. In 2006, the primary dealer structure was modified to allow
banks to operate directly as primary dealers (separate primary
dealer subsidiaries of banks were permitted to reintegrate into
the parent bank). There are currently six primary bank dealers
and 11 "stand-alone" primary dealers. Primary dealers have
privileged access to preferential finance at the RBI through the
•
•
•
30
40
50
60
70
80
90
100
Aug-05
Nov-05
Feb-06
May-06
Aug-06
Nov-06
Feb-07
May-07
Aug-07
Nov-07
% of total GSEC market
By tradesBy value
Figure 29: NDS-OM Market Share of Government Securities Trading
Source: Clearing Corporation of India Ltd.

A S I A B O N D M O N I T O R
��
liquidity access facility and through repos. Primary dealers are also
given favored access to the RBI's open market operations. They
are permitted to borrow and lend in the money market, can raise
resources through commercial paper, and have the same access to
finance from commercial banks as any other corporate borrower.
Issuance is a two-stage process with primary dealers bidding to
underwrite the issue and then bidding for the issue itself. Primary
dealers are assessed on their performance in auctions and in the
secondary market. The auction process permits non-competitive
retail bids to be submitted through primary dealers.
A “when-issued (grey) market” was introduced in May 2006 and
initially was only permitted when the issue was a re-opening of
an existing bond (that is, one that was currently trading). The
rules were subsequently relaxed to allow when-issued trading in
selected new issuances (that is, bonds that were not re-openings
of old bonds).
In 2001 there was a published timetable for treasury bill auctions
but not for longer dated bonds. In part this was a consequence of
weak control of the budget deficit, leading to frequent revisions
in the funding requirement during the course of the year. Since
September 2006, the RBI has published a yearly issuance
timetable for dated bonds.
Indian state governments raise finance through omnibus
issues organized by the RBI. State issues are not government
guaranteed. The omnibus issues are sold at fixed coupons and
prices (the same for every state). Potential buyers subscribe at the
fixed coupon rate for the bonds of a particular state (the amount
on issue for each state is not announced). The subscription is
closed after 2 days even if some issues are under-subscribed.
Current government bonds are fixed-coupon with maturities from
1 to 30 years. The RBI has experimented over the years with a
number of different types of bonds. These include (i) zero coupon
bonds; (ii) capital-indexed bonds (inflation-linked principal);
and (iii) floating rate bonds. None has generated much interest
and all have now been discontinued. The RBI is now working to
develop a market for Separate Trading of Registered Interest and
Principal of Securities.17
17 Separate Trading of Registered Interest and Principal of Securities allow investors to hold and trade the individual principal and coupon components of eligible Treasury notes and bonds.

A S I A B O N D M O N I T O R
��
Primary dealers are obliged to support the secondary market
by providing continuous two-way quotes. In practice, until the
prohibition on short-selling of government bonds was relaxed,
it was difficult for primary dealers to meet this obligation and
market opinion was that they did not. Short-selling was absolutely
prohibited until March 2006. It was then relaxed, allowing primary
dealers and scheduled commercial banks to run intra-day short
positions. In January 2007, this was further relaxed to allow
short positions to run for 5 days. Market opinion is, however,
that the remaining restrictions still pose a significant barrier—for
example; the limiting of short positions to a maximum of 0.25%
of an issue can be restrictive in the case of the many small issues
that still exist. However, the direction of policy is clear and the
barrier caused by short-selling restrictions is likely to continue
to decline in importance.
The government bond repo market is open to primary dealers
and banks, which are free to repo their non-Statutory Liquidity
Reserve (SLR) holdings.18 Government bond repos are almost
exclusively between the market and the RBI and there are few
third-party repos. The RBI also uses repos and reverse-repos to
conduct money market operations. Daily rates are announced
and set a band between the repo and reverse-repo rates, where
the call money market operates. The volume of repos has grown
sharply in recent years (Figure �0). In the financial year 2006/07,
primary dealers were the counterparty in nearly 40% of repo
transactions, foreign banks took another 40% and non-primary
dealer domestic banks accounted for the remaining 20%.
The Clearing Corporation of India Ltd. (CCIL), the clearing
agency, operates a market for Collateralized Borrowing and
Lending Obligations (CBLOs). CBLOs are a form of tripartite
repo (approved by the RBI) which allows market participants
to create borrowing facilities by placing collateral securities at
CCIL. Borrowers can then bid for funds (up to their collateral’s
value less a discount margin) through the CBLO system—a
transparent, electronic order book. Established in 2001, CCIL is
India's first exclusive clearing and settlement institution to provide
guaranteed settlement facility for transactions in government
securities, money market instruments, and foreign exchange).
CCIL, owned by industry participants, also manages bond lending
transactions and operates the CBLO facility.
18 Banks are required to keep a Statutory Liquidity Reserve (SLR) equal to at least 25% of deposit liabilities.
0
10,000
20,000
30,000
40,000
50,000
60,000
2003/04 2004/05 2005/06 2006/07 2007/08 (up to 07-12)
INR billion
CBLO
Repo
Figure 30: Repo and CBLO Volumes
Source: The Clearing Corporation of India.

A S I A B O N D M O N I T O R
��
CBLOs are offered for a variety of terms—most are overnight
(75%) but dates out to 1 year are possible. The CBLO offers
significant advantages over repos: (i) the instrument is tradable,
allowing a borrower to reverse the position and repay the loan
before its term expires; and (ii) CBLOs are very secure because
of the involvement of CCIL as guarantor of each transaction.
This means (i) failures are rare and (ii) CBLOs can be used by
participants with lower credit ratings.
There are currently 161 participants in the CBLO market. In
December 2007, mutual funds were the largest lenders of cash
(57%) followed by public sector banks (28%). The main borrowers
were public sector banks (37%), private sector banks (21%),
and foreign banks (16%). The advantages of CBLOs have led to
a rapid expansion of the market since its introduction in January
2004. CBLO volumes now outstrip repo volumes by a significant
margin.
The Reserve Bank of India has significantly enhanced India’s trading and settlement infrastructure.
Until 2002 the government bond secondary market was a purely
OTC telephone market. The main participants were banks and
primary dealers with agency brokers acting as intermediaries.
In February 2002, the RBI launched the Negotiated Dealing
System (NDS). The NDS was designed as complementary to the
OTC trading structure, with the aim of gradual replacement. In
practice the NDS was mainly used for post-trade reporting of OTC
trades. This brought about considerable efficiencies in settlement
but had little impact on trading.
In August 2005, the RBI introduced its Negotiated Dealing
System–Order Matching Segment (NDS-OM). This is a screen-
based anonymous trading and reporting platform enabling
electronic bidding in primary auctions and disseminates
trading information with a minimum time lag. NDS-OM has
had considerable success and has taken a dominant share of
government securities market trading.
Holdings of government bonds are in scripless form. Participants
have Securities General Ledger (SGL) accounts if they are direct
participants or Constituents’ Subsidiary General Ledger (CSGL)
accounts operated by SGL account holders if they are indirect
participants.

A S I A B O N D M O N I T O R
��
Real Time Gross Settlement for cash was introduced in 2004.
Settlement of government securities is now 1 day following the
transaction (T+1) using the DvP-III model whereby both bond
and cash positions are settled on a net asset basis.
Corporate Bond Market
Several changes have helped improve transparency in the corporate bond market, including better documentation requirements and improved credit rating. But it remains undeveloped relative to the government market.
Four key developments have affected corporate bond markets
over the past decade:
the dematerialization of holdings, as required by SEBI in
2002;
increased transparency of trading as a consequence of
compulsory reporting of trades. There are currently three
trade reporting venues for corporate bonds and SEBI has
published details of trading since January 2007;
documentation requirements for private placements have
been enhanced. Five years ago the term sheet sent out to
potential buyers was little more than half a page and many
key pieces of information were omitted or implied. The
documentation now runs to about three or four pages, which
practitioners regard as appropriate;
linking of local rating agencies (of which there are five offering
bond ratings) to international rating agencies (Table �).
Authorities are examining recommendations for improving the corporate market, including the possibility of a uniform stamp duty and reform of issuance procedures.
The recent Report of the High Level Expert Committee on
Corporate Bonds and Securitisation—commissioned by the
Union government and chaired by R. H. Patil in 2005—made a
number of recommendations for improving the corporate bond
and securitization markets. The government is examining its
i.
ii.
iii.
iv.
Table 9: Indian Credit Rating Agencies
CRISIL Standard & Poor's are major shareholder
CARE 61% owned by 3 major Indian banks (IDBI, SBI, Canara)
ICRA Moody’s is a major shareholder
Duff & Phelps (India) Subsidiary
Fitch (India) Subsidiary
Source: Agency websites

A S I A B O N D M O N I T O R
�7
recommendations on stamp duty tax, issuance procedures/
disclosure requirements for public issues, and modifying
the investment rules relating to institutions. A number of
improvements recommended in the report, including one for
trading conventions, have been implemented.
In actual fact, most issues in the corporate bond market are not really bonds but private placements, and most issues are not made by corporations.
Corporate bonds can be issued as public issues (that is, bonds
offered to a wide range of investors and which conform to the
regulatory standards required of public issues of bonds) or as
private placements to a maximum of 50 “Qualified Institutional
Buyers” (that is, professional investors). Public issues require a
prospectus approved by SEBI, while private placements have
much less documentation. Public issues have to be open at a
fixed price for a month to allow investors—particularly retail
investors—to subscribe. There are almost no public issues of
corporate bonds, however, and practically all issues are private
placements (Figure �1).
The disclosure requirements for public issues are viewed by many
as excessive:
Prospectuses for bond issues are reported to be several
hundred pages long.
Disclosure requirements are identical, irrespective of whether
the company is already listed or not. This is not normal
international practice.
There is no provision for shelf registration whereby a program
of tranches can be covered by a single prospectus.
The issue process is reportedly slow, taking several months,
which, with high marketing and other costs, makes public issues
very expensive. The slow process also makes issues risky as
the price is fixed throughout the offer period. In contrast with
public issues, the documentation for a private placement is small,
although requirements have been increased in recent years.
Placements can be issued very quickly with book building and
pricing usually completed within a day.
•
•
•
0
200
400
600
800
1,000
1,200
1,400
1,600
1,800
97-98
98-99
99-00
00-01
01-02
02-03
03-04
04-05
05-06
06-07
Indian fiscal year
Number
0
200
400
600
800
1,000
1,200
1,400
1,600
INR billion
Number
Value INR Bn
Figure 31: Private Placements Outstanding
Source: Reserve Bank of India.

A S I A B O N D M O N I T O R
�8
The small number of investors makes it relatively easy to
renegotiate terms. Typically, for example, a change in interest
rates will lead to a renegotiation of the coupon on a placement
during the currency of the issue. This makes private placements
very flexible.
Private placement issues are generally quite small, averaging about USD20 million.
Issuers wanting to raise a larger amount may well make a
number of separate placements, sometimes on the same day.
Since the number of investors is limited, the separate issues will
all, practically speaking, go to the same investors, usually under
similar terms. The result is that many of the “bonds” are actually
syndicated loans—an impression confirmed by the fact that the
largest investors are banks.
Corporate bonds are issued by a range of entities—private sector
companies, banks, and public sector companies. Issuance in
2006–07 was USD35 billion in 1,678 issues. Public sector entities
accounted for 42% of the value and 8% of the number of issues.
Public sector issues were also relatively large, averaging USD107
million. Private financial companies—largely banks raising money
to lend on to clients—represented 35% of the value and 39% of
the volume. Private, non-financial corporate issuers represented
only 23% of value, but 53% of the volume, indicating an average
value of USD10 million (Figures �2, ��). Issuers who are the
main participants in other corporate bond markets—that is,
private sector, non-financial—represent only a small proportion
of the value of corporate bonds in the Indian market.
Demand for corporate bond finance is limited.
Corporate demand is limited for genuine bond finance (as opposed
to loans disguised as bonds). Traditionally companies have
borrowed from banks to meet their financing needs: indeed, bank
credit continues to dominate corporate funding. Banks account
for 90% of financial assets (and state-owned banks represent
75%) (Figure ��).
The main source of finance for smaller companies is from former
“development banks,” which have emerged from state-owned
development banks but are now private and profit-oriented,
and dominate corporate lending. They finance themselves not
Private non-financial23%
Private financial35%
Public financial34%
Public non-financial8%
Figure 32: Value of Private Placements by Issuer Type (2006/07)
Source: Reserve Bank of India.
Private financial39%
Private non-financial53%
Public financial6%
Public non-financial2%
Figure 33: Number of Private Placements by Issuer Type (2006/07)
Source: Reserve Bank of India.

A S I A B O N D M O N I T O R
��
through deposits—from which they are generally barred—but
through debt issues. The development banks are active in the
private placement market, borrowing wholesale to lend to smaller
corporations.
Private placements have dominated debt issuance and banks or
even a single bank will often take up the entire issue. The decision
as to whether to issue a bond or take a loan is determined by
non-strategic factors:
At various times the RBI has prohibited banks from lending at
rates below their published lending rate but the prohibition did
not apply to investments in private placements. Therefore, a
bank that wanted to offer a very tight rate to a highly rated
corporate borrower would present the loan as a bond.
Interest rate expectations may influence the choice—when
rates are falling, as they have been for several years,
borrowers will prefer a variable rate loan and lenders a fixed-
rate bond.
Large bank loans are required to pass an internal approval
process, usually by the board or a board committee. Private
placement investments are not subject to the same scrutiny
(or delay), again, giving banks an incentive to grant loans
but present them as bonds.
Loans are not subject to stamp duty, whereas bonds are,
making loans desirable for tax sensitive borrowers.
•
•
•
•
0
2,500
5,000
7,500
10,000
12,500
15,000
SBI Nationalised banks Other Commercial Banks
Foreign banks
INR billion
Deposits
Investments
Advances
Capital and reserves & surplus
Figure 34: Deposits, Investments, and Advances by Bank Type
Source: Reserve Bank of India.

A S I A B O N D M O N I T O R
70
Loans may be preferable for banks since they are not currently
marked to market (but will be under Basel II—rules which
are due to begin implementation in 2008). Bonds (not in the
held-to-maturity category) are marked to market but, in the
absence of reliable secondary market prices; there is scope
for manipulation and window dressing.19
Similarly, corporations tend to regard loans and bonds as
interchangeable. This occurs to some extent in most markets.
But in India there is a strong focus on managing or arbitraging
micro-features as described above.
The level and complexity of stamp duty encourages the arbitrage-
based approach to corporate finance so that decisions are often
tax-driven rather than strategy-driven. There is a stated, but as
yet unscheduled, intention to reform the stamp duty, probably
by introducing a standard national rate with a maximum rate, as
recommended in the Patil report.
Companies with high credit ratings dominate corporate issuance, while smaller corporate issuers are generally excluded.
The distribution of corporate bonds issued by rating (Table 10)
indicates that the number of sub-investment grade issues is
minimal and the proportion below AA is small—8% by value in
2006–07. Only the largest corporations are likely to achieve an
AAA rating. Others are thus excluded from the bond market and
obliged to rely on bank finance.
19 The Reserve Bank of India allows banks to hold bonds in “trading book”, “available-for-trading” and “held-to-maturity”. The latter are not marked to market under current rules
•
Table 10: Distribution of Corporate Bonds Issued by Rating
AAA AA A BBB Below Inv. grade
% of total No. Value No. Value No. Value No. Value No. Value
1999–00 35 83 25.9 9.4 25 6.1 7.7 0.8 6.4 0.6
2000–01 38.3 76.6 33.6 10.1 21.4 11.6 3.1 1.3 3.7 0.3
2001–02 31.7 61.6 33.5 27.8 24 9.3 7.8 1.1 3 0.2
2002–03 45.6 76 27.1 13.8 18.2 7.5 6.3 1.6 2.8 1
2003–04 50.4 77.5 24.8 14.9 17.3 6.1 6.5 1.1 1 0.4
2004–05 56.7 72.2 22.4 22 11.8 3.7 7.1 1.9 1.8 0.3
2005–06 54.6 75.1 30.8 16.7 9.4 7.8 4.4 0.3 0.8 0
Source: Securities and Exchange Board of India.

A S I A B O N D M O N I T O R
71
Wholesale trading in the corporate bond market is entirely over-the-counter, with some major banks acting as unofficial market makers.
The declining role for brokers in the government bond market has
led to their general withdrawal from the market. The NSE and
Bombay Stock Exchange (BSE) offer order-driven, bond trading
platforms that are used for post-trade reporting but rarely for
trading. The exchange trading platforms are mainly used by a
small number of retail participants.
Delivery versus payment (DvP) clearing is available for the few
trades transacted on the stock exchanges’ dealing platforms (that
is, by order matching) but not for OTC trades, which are the
bulk of the market. However, corporate bond OTC transactions
are settled bilaterally between the counterparties (that is, there
is no central counterparty to start the process and so reduce
settlement risk). SEBI introduced regulations in 2002 requiring
corporate bonds to be held in scripless form. However, cash is still
settled inter-office—sellers instruct CCIL to move bonds before
they have the funds from the buyer, so the system is not truly
DvP, and sellers are at risk during settlement. This potentially
imposes a barrier to trade. But because the market is in practice
limited to a small number of major players, the risk is considered
manageable.
Repurchase agreements are not permitted on corporate bonds.
The RBI is the regulatory authority for this part of the market
since corporate bond repos would be regarded as money market
instruments. The RBI has been considering allowing corporate
bond repos for some time and now seems to be moving toward
permitting them. CBLOs have been increasingly taking over the
role of repos but are also limited to government bonds.
Conventional securities lending is theoretically available as
an alternative to repos, but general market illiquidity makes
it impractical. India does have efficient, automated securities
borrowing and lending infrastructure for equities which was
introduced when “badla”—the indigenous carry-forward system—
was outlawed in the early 2000s but conventional securities lending
systems have not been developed for corporate bonds.20
20 "Badla" was a feature of most markets in the subcontinent. Essentially it involved the carrying over of positions rather than settling them—in effect, un-margined OTC futures. The growth and opacity of badla led the Securities and Exchange Board of India to finally ban the practice and force the unwinding of positions.

A S I A B O N D M O N I T O R
72
If the market were to expand to encompass a wide range of
investors, then it would require better settlement infrastructure.
Other factors that have a limiting impact on trade include: (i)
tax deducted at source—which complicates trades between
tax-exempt and non-exempt entities; (ii) no single database of
bonds; and (iii) no universal conventions for day count, interest
calculation.
Securitization Market
Securitization has a long history but development has been slow and limited to a few asset types.
India began securitization early among Asian markets, with
transactions going back to the early 1990s. Growth accelerated
from 2000, reaching USD9.4 billion (INR370 billion) in fiscal
2006/07 (Figure ��). However, the securitization market has
not yet taken off. Volumes tend to be low and asset types limited.
Volumes appear to be mainly influenced by tax or regulatory
arbitrage considerations rather than by underlying financial
factors. The market is also subject to regulatory, legal, and tax
uncertainties.
Indian securitizations have tended, like those in Korea and the
Philippines, to be Asset-backed securities (ABS). Other assets
have fluctuated with mortgage-backed securities (MBS), which
are more significant in Malaysia and Singapore, showing steady
growth to 2005. But they have since declined, while collateralized
debt and loan obligation (CDO/CLO) securitizations have surged,
including a significant volume of single loan securitizations in
2006/07 (Figures ��, �7).
Securitization was generally small in emerging East Asian markets
in 2001, amounting to less than 0.2% of GDP, including India.
By 2006 a number of the region’s economies—Korea, Malaysia,
Philippines, and Singapore—had expanded securitization levels
considerably (to between 1.5% and 4% of GDP). In the cases of
Korea, Philippines, and Malaysia, they did this through policies
designed to recapitalize the banking sector. In India, reasonable
growth brought securitization volumes to roughly 1% of GDP.
Auto loans were the mainstay of the securitization market in
the 1990s. Since 2000, residential mortgage backed securities
(RMBS) have also contributed to market growth, though RMBS
0
50
100
150
200
250
300
350
400
2001/02 2002/03 2003/04 2004/05 2005/06 2006/07
INR billion
OthersPartial GuaranteeCDO/CLOMBSABS
Figure 35: Structured Finance
Source: ICRA.
0.00.20.40.60.81.01.21.41.61.8
PRC HKG INO KOR MAL PHI SIN THA VIE IND
CDOABSMBS
Figure 36: Indian and EEA Securitization as % of GDP (2001)
Source: AsianBondsOnline, ICRA, Reserve Bank of India.
0.00.51.01.52.02.53.03.54.04.5
PRC HKG INO KOR MAL PHI SIN THA VIE IND
CDOABSMBS
Figure 37: Indian and EEA Securitization as % of GDP (2006)
Source: AsianBondsOnline, ICRA, Reserve Bank of India.

A S I A B O N D M O N I T O R
7�
activity has slowed significantly during the last two years. Asset-
backed securities (ABS) claimed the biggest share in the market,
accounting for 63% in FY2007, followed by CDO/CLO (32%).
RMBS, hindered by limited investor interest, amounted to less
than 5% of the total in FY2007. 21
Credit card securitizations have been limited, partly because
of stamp duty costs, but also because the credit card market
in India—while showing rapid growth—remains small. There
have also been limited future flow securitizations, such as toll
receipts, and some infrastructure financing. The demands for
infrastructure financing in India are now recognized and it is
expected that securitization of receivables from those projects
should expand rapidly.
As the nature of the securitized assets suggests, the originators
have mainly been banks and nonbank financial institutions. The
originators include former development banks that have been
privatized and which have become major players in the consumer
lending market, and housing finance companies. ICRA estimates
the top five originators account for about 80% of issuance. There
has also been some securitization of corporate loans, again with
substantial credit enhancement. These have included single loan
securitizations.
Investors in securitized notes are predominantly banks and insurance companies.
Insurers are subject to restrictive investment mandates (discussed
below) and thus securitized assets are structured to achieve a
very high rating and, often, to minimize prepayment risk. To gain
these ratings, successful issues require very substantial levels of
credit enhancement. Methods of enhancement have included: (i)
direct recourse to the originator (often structured as put options);
(ii) originator or third party guarantees; (iii) over collateralization;
and (iv) cash collateral and reserves.
Until recently, securitizations with subordinated tranches were
not offered in India and remain a rarity. This is because there
is: (i) little investor demand for such lower-rated notes; and
(ii) there was no capital penalty for originating banks retaining
the first-loss tranche. RBI guidelines (described below) have
removed the latter reason and the market is now seeing some
use of subordinated tranches.
21 Update on Indian Structured Finance Market—ICRA July 2005
A S I A B O N D M O N I T O R
7�
India currently does not have credit insurance or an active market
for credit derivatives. This means these risk management tools
are not available for structuring deals and the use of credit default
swaps to create synthetic securitizations is impractical.
Regulatory responsibility within the securitization market is
unclear, but the strong involvement of banks means that the RBI’s
regulatory actions will have a significant impact. For example, RBI
recently published regulations on the capital provision required
for securitizations by banks. These are similar to, but stricter
than Basel II requirements.
There are several distinguishing features of India’s securitization
market:
as a common law jurisdiction, India does not require specific
legislation to permit the formation of special purpose vehicles
(SPVs).
This gives considerable flexibility, but at the same time
means that many features are left unclear until decided by
case law.
for tax reasons, SPVs are set up as single-purpose trusts
rather than corporate entities, as is common in other
jurisdictions.
arbitrage considerations are regarded as crucially important
and tax and regulatory environment will determine the decision
to securitize, as well as the structure of a securitization to
a far greater extent than in other markets. As an example,
the recent RBI rules on capital provision led to a number of
direct assignment deals (that is, transfers of cash flows but
without an SPV) since the new rules specifically applied only
to transactions involving an SPV.
The pace of change in the securitization market has been slow.
The Securitisation and Reconstruction of Financial Assets &
Enforcement of Security Interest Act, which was intended to clarify
the status of securitization, has been enacted, but is regarded as
having had little effect. The implementation of Basel II may have
an impact, and India plans to begin implementation in 2008. The
•
•
•
•

A S I A B O N D M O N I T O R
7�
RBI regulations—which as noted are stricter than Basel II—have
encouraged more direct assignments (that is, cash flow transfers
without SPVs). The Patil report also made recommendations on
securitization relating to the stamp duty and taxation.
Developing a securitization market requires financial institutions that have an incentive to securitize and a set of standard assets to securitize.
Financial institutions will securitize if they are (i) constrained by
their balance sheets and securitization allows them to reduce the
size of the balance sheets; or if they are (ii) under competitive
pressure. Securitization permits them to realize profits on their
current assets by selling them on.
A securitization market also requires a supply of assets that
typically can be securitized at the start of the market. These are
the standard assets such as mortgages, auto loans, and credit
card receivables, as well as infrastructure projects where future
cash flows can be securitized.
India’s banks have not felt pressure on their balance sheets so
far—though credit demand suggests they may. Other entities
such as auto finance companies have been active but they are
small relative to the bank market. In considering which assets
to securitize: (i) India is still developing its credit card market;
(ii) auto loans are being securitized but the residential mortgage
market is still too small for securitization on any scale; and
(iii) India’s infrastructure demands are huge—but the main
expenditure is in the future.
As a result, there has so far been limited incentive for
securitization. But this may change as credit demand and
infrastructure expenditure increase. The use of securitization to
finance infrastructure development and remit the cash flows could
diversify the investor base for infrastructure debt.
The stamp duty is a major barrier to the development of
securitization. Transfers of assets require written instruments
which are subject to stamp duty. Rates of duty on asset transfers
vary among the states, but are generally high—most states
charge between 3% and 16% on the value of the property being
transferred.

A S I A B O N D M O N I T O R
7�
Tax uncertainty remains and there are no clear rulings on the
taxation of SPVs. Market practice and current opinion is that
taxation of interest paid on SPV bonds will be levied on the
investors rather than being paid by the SPV. However, this has
not been tested.
There is also a general lack of clear regulatory structure. A legal
amendment is underway which clarifies the position of SEBI
as the principal regulator for securitizations, although, as in
corporate bonds, the RBI will retain a significant role because of
the involvement of banks.
Market participants
Regulatory responsibility in India’s bond markets is fragmented—and there is the perception among market participants that they are also at cross-purposes.
Corporate bonds are regulated by SEBI, which is responsible
for authorizing the public issue prospectus and for setting
standards regarding private placements. It also regulates some
of the participants—the brokers (who have all but disappeared
from the market) and mutual funds. Other participants are
subject to different regulators. Banks and primary dealers are
regulated by the RBI, insurance companies (including the Life
Insurance Corporation of India) by the Insurance Regulation and
Development Agency and provident/pension funds by their own
regulator.
The bankruptcy system is time-consuming and inefficient,
although the law is based on United Kingdom law and, as such, is
judged to be reasonably clear. There are, however, (i) significant
political pressures against declaring enterprises insolvent; and
(ii) serious delays in the court process—several years is the
quoted time for resolution of insolvencies. In practice bankruptcy
is hardly an issue in the corporate bond market because: (i) very
few issues are rated below AA; and (ii) the terms of the private
placement (and the small number of investors) mean it is easier
to renegotiate terms if necessary, rather than to go through the
legal processes for insolvency.

A S I A B O N D M O N I T O R
77
The requirement on banks, insurance companies, and pension funds to hold government bonds restricts liquidity.
Banks, life insurance, and pension funds are required to hold a
minimum of 25% of their time deposit liabilities in government
securities—the Statutory Liquidity Requirement (SLR). Only
holdings in excess of the SLR requirement can be traded and
repurchased. Bank holdings have declined as a proportion of the
total issuance of government bonds over time as interest rates
have fallen and loan demand has risen (Figure �8). However, in
absolute terms, 2006 was the first year in which banks’ holdings
of government bonds fell.
The life insurance sector remains dominated by the Life Insurance
Corporation of India (LIC). LIC now faces competition from
private sector insurers but in terms of investment it represents
98% of the market. Although LIC is only required to hold 25%
of its assets in government bonds, it still holds about 75% of its
assets in government bonds. Private sector insurers are similarly
conservative.
Also pension funds tend to hold a larger percent of government
bonds than required. The pension fund sector is mainly controlled
by various state-run provident schemes. A new pension system
based on individual accounts is being introduced, though the time
of completion has not been published.
0
10
20
30
40
50
60
70
80
90
100
1991 1993 1995 1997 1999 2001 2003 2005
OtherPDsProv fundsUTI
LICComm banksRBI
Figure 38: Holdings of Government Bonds by Investor Group (%, end March)
Source: Reserve Bank of India.

A S I A B O N D M O N I T O R
78
Life insurers and pension funds are also constrained by legal
mandates as to the proportion of corporate bonds and to quality
and rating. Like banks, these investors tend to buy and hold,
partly because that is their nature and partly because of the lack
of liquidity. The current structure of investors includes many with
heavy state involvement. In addition competition is limited—for
example in the low-premium life business. These investors may
lack the incentive (and the skills) to engage in more active
investment strategies. Bond mutual funds in practice invest mainly
in short-term instruments to match the short expected holding
period of their investors.
The requirement to hold government bonds constrains liquidity
by restricting the main liquidity traders to arbitrage transactions
rather than directional trading. This means that the market tends
to dry up in anticipation of a fall in interest rates because the
natural suppliers of bonds cannot sell below their required holding
level. It also ensures that the amount of government bonds
held by mutual funds and other entities that are not required to
hold a certain proportion of government bonds is small relative
to the more static holdings of the banks, insurance companies,
and pension funds.
There is likely to be a movement away from government bonds
over the longer term, as the New Pension System (NPS) is
implemented and as the private sector insurance companies
gradually chip away the dominance of LIC. However, unless there
is a change in the mandates of the state-controlled investors, the
range and size of corporate bond investors will remain limited.
Mutual funds have developed rapidly in India, but invest mostly in short-term bonds and bills.
The mutual fund market has developed rapidly in India and is
now almost exclusively private. Specialist “gilt funds” (which have
access to the RBI liquidity facility) have been set up to invest
exclusively in government securities.22 However, the nature of
the Indian bond mutual fund industry’s customer base—largely
corporates using mutuals for short-term treasury management—
means that the bond funds are treated as money-market funds
and must invest mostly in short-term bonds and bills.23
22 Gilt funds, as they are conveniently called, are mutual fund schemes floated by asset management companies to invest exclusively in government securities.23 Corporate use of bond mutual funds developed when there was a tax exemption for income from bond mutual funds. The tax exemption has now been removed but the practice continues.

A S I A B O N D M O N I T O R
7�
Foreign investors are restricted by exchange regulations.
Foreign investors are restricted by exchange control regulations
to an aggregate of USD1.5 billion in corporate bonds and
USD3.2 billion in government bonds. In practice, foreign investors
do not even approach these limits. This is in contrast to the
domestic stock market where foreign investors are significant
participants.
Policy Issues
A rationalized and consolidated regulatory and supervisory structure of India’s local currency bond market could contribute to substantial efficiencies spurring innovation, economies of scale, liquidity, and competition.
After years of strong economic growth, and financial market
development, India’s financial sector is at a turning point. The
regulatory and financial supervisory framework plays an important
role in developing a vibrant local currency bond market and
financial market generally. Streamlining regulatory structures
to lessen regulatory inconsistencies, gaps, overlap, and arbitrage
can help ensure a level playing field by making players performing
a function report to the same regulator regardless of their size
or ownership. It can also help regulatory systems adapt to
increasing globalization and rapid innovation of new financial
instruments. Substantial efficiencies can thus be gained allowing
scope economies to be realized, improve liquidity and increase
competition and innovation.24
Deep and liquid bond markets provide a safety valve when access to bank credit tightens—by providing an alternative source of financing.
To address the lack of bond market liquidity, authorities could
(i) relax exchange controls on bonds to facilitate investment
by foreign investors and broaden the domestic investor base;
24 There is no perfect regulatory system. The problems with Northern Rock in the United Kingdom are being attributed to the fact that the United Kingdom had moved to a single supervisor, the Financial Services Authority (FSA), with the monetary authority having no supervisory powers. At the same time, the Bear Stearns debacle in the United States is being attributed to the absence of a single supervisor. What is essential is effective cooperation between all the concerned authorities, which transcends the specifics of organizational architecture.

A S I A B O N D M O N I T O R
80
(ii) ease investment mandates on contractual savings institutions
that encourage funds to hold bonds to maturity; (iii) develop
exchange and OTC derivatives and swap markets; and (iv)
consolidate the outstanding stock of government bonds.
Relax exchange controls on bonds to facilitate
investment by foreign investors and broaden the
domestic investor base.
The restriction on foreign holdings of bonds is anomalous in
that it is more onerous than the corresponding restrictions on
foreign investment in equities, on foreign direct investment,
and on foreign investment in derivatives. The potential benefit
achieved by allowing more foreign interest—especially trading
interest—would be significant in encouraging greater liquidity
and investor diversity in the government bond market. However,
to date, foreign investors have not taken up even the modest
amounts available to them. Due to the limitations imposed on
foreign investors, Indian corporate issuers who want access to
foreign investors have to issue in the Euromarket rather than
domestically. This contributes to further fragmenting the already
limited liquidity.25
RBI has announced that it would open up the Indian debt market
further for foreign investors after putting in place a more efficient
settlement system.
Ease investment mandates on contractual savings
institutions to hold bonds to maturity.
Banks are active traders of government bonds but the SLR limit
means that a considerable part of their stock of assets cannot
be traded. The result is to reduce the profitability of the banking
system.
Institutional investors are the main support for corporate bond
markets in most jurisdictions. Life insurance and pension sector
institutions are subject to strict investment mandates which mean
that their ability to invest in non-government debt instruments
is limited. To avoid the risks of a too-rapid easing of investment
mandates, relaxation should be controlled and phased. The Patil
Committee recommends using risk-based guidelines. However,
such guidelines can only be useful when the relevant skill set
25 Foreign institutional investors are required to be registered with SEBI as such.
i.
ii.

A S I A B O N D M O N I T O R
81
within the institution is at an appropriate level and the historic
data on risk is available.
Develop Derivatives and Swaps Market.
Liquidity in bond markets is often primarily not about trading the
cash bond itself but in changing the risk profile of the portfolio,
using risk management tools. However, derivatives, bond lending
and borrowing, repurchase agreements (repos) and swaps as well
as OTC credit derivatives and credit insurance are not available
in the bond market.
Developing derivatives and swap markets is a critical measure
for broadening the investor base and for increasing liquidity
in both government and corporate bond markets. It is also
crucial to funding massive infrastructure investment needs and
providing corporations with the tools they need to manage the
risks associated with India’s financial globalization. These markets
allow a wider dispersal of risk as derivatives and swaps help
reduce costs, enhance returns, and allow investors to manage
risks with greater certainty and precision. Derivative and swap
markets also help address exchange and interest rate risks.
The development of these markets needs to be underpinned by
improving regulatory, legal, and infrastructure frameworks.
Discussions about reintroducing exchange-traded derivatives
have focused on technical aspects. It has been proposed that
bond indexes—both corporate and government—be created and
futures and options on the same be introduced along the same
lines of what has been permitted in equity. The possibility of
introducing exchange traded single bond futures and exchange
traded credit derivatives is also being explored.
Consolidate the outstanding stock of government
bonds.
There is now a budget provision to finance the consolidation of
the outstanding stock of government bonds. The RBI should thus
move away from its policy of passive consolidation (which has
not led to significant improvements in the number and size of
issues) to more active retirement of small issues, with the aim
of creating a limited number of large benchmark issues along
the yield curve.
iii.
iv.

A S I A B O N D M O N I T O R
82
Reforming stamp duty and disclosure for public offers are additional measures that, in particular, can help develop the corporate bond market.
Reform stamp duty.
Stamp duty is a significant barrier to the development of both
the corporate bond and the securitization markets. Stamp duties
are typically 0.375% for debentures (that is, on creation of
corporate bonds) and, as they are strictly ad-valorem, there is no
volume discount.26 The rate of duty is variable depending upon
location (various states have set their own rates). Recently official
comments have suggested that individual states have agreed to
waive stamp duties but this has yet to be announced as official
policy. Rates also vary with the nature of the issuer. Rates may
also vary with the nature of the initial purchaser (for example,
promissory notes bought by commercial and some other banks
are subject to only 0.1% duty, compared with 0.5% if issued to
other investors). Interest payments are taxable as income and
capital gains are taxable. The Patil report27 recommended that
there should be a uniform low rate across all states and that the
maximum payable should be capped. Plans are being drawn up
to address this but the timescale is unclear.
Reform disclosure for public offers of corporate
bonds.
The current process is considered by issuers to be expensive
and risky. Existing regulations could be reformed to allow for
disclosures that are appropriate for public issues into a largely
professional market by entities that are already well-known to the
investment community. The regulations could also be changed
to allow techniques such as shelf registration.28 The public issue
process is also unduly long to allow for postal submissions—a
recent proposal by the RBI to allow online applications might
help by shortening the time an issuer is on risk.
26 Stamp duty on secondary market transactions was removed for dematerialised stock transfers in 2000.27 Report of the High Level Expert Committee on Corporate Bonds and Securitization (December 2005).28 A registration of a new issue which can be prepared up to two years in advance, so that the issue can be offered quickly as soon as funds are needed or market conditions are favorable.
i.
ii.

About the Asian Development Bank
ADB’s vision is an Asia and Pacific region free of poverty. Its mission is to help its developing member countries substantially reduce poverty and improve the quality of life of their people. Despite the region’s many successes, it remains home to two thirds of the world’s poor. Nearly 1.7 billion people in the region live on $2 or less a day. ADB is committed to reducing poverty through inclusive economic growth, environmentally sustainable growth, and regional integration.
Based in Manila, ADB is owned by 67 members, including 48 from the region. Its main instruments for helping its developing member countries are policy dialogue, loans, equity investments, guarantees, grants, and technical assistance. In 2007, it approved $10.1 billion of loans, $673 million of grant projects, and technical assistance amounting to $243 million.
Asian Development Bank6 ADB Avenue, Mandaluyong City1550 Metro Manila, Philippineswww.adb.org Publication Stock No. BBK116008 Printed in the Philippines