ashok leyland · pdf filethis presentation has been prepared by ashok leyland limited ......
TRANSCRIPT

Corporate Presentation June 2014

2
Disclaimer
This presentation has been prepared by Ashok Leyland Limited (“Company") solely for information purposes without any regard to any specific objectives, financial situations or informational needs of any particular person. This presentation may not be copied, distributed or disseminated, directly or indirectly, in any manner. Failure to comply with this directive may result in a violation of the applicable law in certain jurisdictions. By reviewing this presentation, you agree to be bound by the restrictions contained herein, and to maintain absolute confidentiality, regarding the information disclosed in these materials. This presentation does not constitute or form part of and should not be construed as, directly or indirectly, any offer or invitation or inducement to sell or issue, or any solicitation of any offer to purchase or subscribe for, any securities of the Company by any person in any jurisdiction, including in India, nor shall it or any part of it or the fact of its distribution form the basis of, or be relied on in connection with, any investment decision or any contract or commitment therefor. This presentation contains statements that constitute forward looking statements. These statements include descriptions regarding the intent, belief or current expectations of the Company or its directors and officers with respect to the results of operations and financial condition of the Company. These statements can be recognized by the use of words such as ''expects", "plans", 'will", "estimates", "projects", or other words of similar meaning. Such forward-looking statements are not guarantees of future performance and involve risks and uncertainties, and actual results may differ materially from those in such forward-looking statements as a result of various factors and assumptions which the Company believes to be reasonable in light of its operating experience in recent years. The risks and uncertainties relating to these statements include, but not limited to, risks and uncertainties, regarding fluctuations in earnings, our ability to manage growth, competition, our ability to manage our international operations, government policies, regulations, etc. The Company does not undertake any obligation to revise or update any forward looking statement that may be made from time to time by or on behalf of the Company including to reflect actual results, changes in assumptions or changes in factors affecting these statements. Given these risks, uncertainties and other factors, viewers of this presentation are cautioned not to place undue reliance on these forward looking statements. This presentation may contain certain currency exchange rates and the same have been provided only for the convenience of readers. No representation is made that the Rupee amounts actually represent such USD amounts or could have been, or could be, converted into USD at the indicated rates. This presentation is not a complete description of the Company and may not be all inclusive and may not contain all of the information that you may consider material. The information contained in this presentation has not been independently verified. No representation, warranty, guarantee or undertaking, express or implied, is or will be made as to, and no reliance should be placed on, the accuracy, completeness, correctness or fairness of the information, estimates, projections and opinions contained in this presentation. Viewers of this presentation must make their own assessment of the relevance, accuracy and adequacy of the information contained in this presentation and must make such independent investigation as they may consider necessary or appropriate for such purpose. Such information and opinions are in all events not current after the date of this presentation. Further, past performance is not necessarily indicative of future results. Any opinions expressed in this presentation or the contents of this presentation are subject to change without notice. This presentation should not be construed as legal, tax, accounting, investment or other advice. Any person placing reliance on the information contained in this presentation or any other communication by the Company does so at his or her own risk and none of the Company nor any of its affiliates, advisers or representatives, any placement agent, promoters or any other persons that may participate in any offering of any securities of the Company shall have any responsibility or liability whatsoever, whether arising in tort, contract or otherwise, for any errors, omissions, insufficiencies or inaccuracies in such information or opinions or for any loss, cost or damage suffered or incurred howsoever arising, directly or indirectly, from any use of this presentation or its contents or otherwise in connection with this presentation. Securities of the Company may not be offered or sold in the United States absent registration or an applicable exemption from registration under the United States Securities Act of 1933, as amended. This presentation has not been and will not be registered as a prospectus with any Registrar of Companies in India. This presentation is not a prospectus, a statement in lieu of a prospectus, an offering circular, an advertisement, a private placement offer letter or an offer document under the Companies Act, 2013 and the rules made thereunder, the Securities and Exchange Board of India (Issue of Capital and Disclosure Requirements) Regulations, 2009, as amended, or any other applicable law.

3
Hinduja Group – an Overview
• Promoted by the Hinduja Family
• Operations in over 35 countries
• Products and services available in more than 100 countries
• Employs over 72,000 personnel
• Multi-billion dollar turnover Group
“My dharma (duty) is to work so that I can give”
4
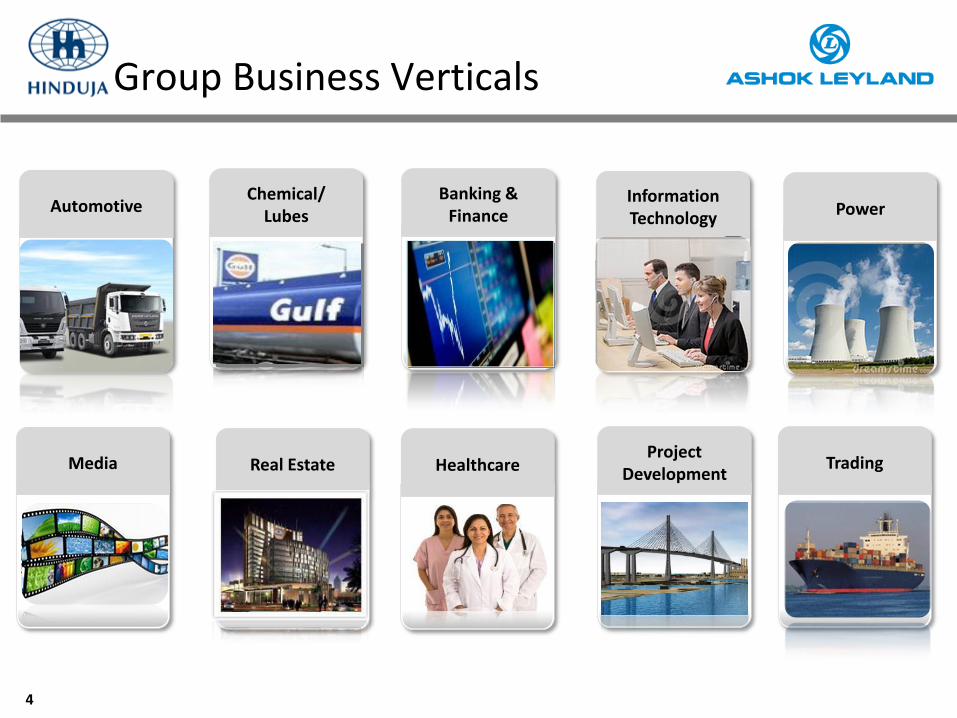
Group Business Verticals
Banking & Finance
Chemical/ Lubes
Automotive Power
Real Estate Media
Information Technology
Healthcare Project
Development Trading

5
Ashok Leyland: An Introduction
Established presence
Global footprint
2nd largest medium and heavy commercial vehicle (Truck and Bus) player in India
Among the largest bus-makers in the World
Exports to 34 countries
Targeted expansion strategy in 5 geographic clusters
Rich history and track record
Over 65 years of operations with unbroken track-record of profitability
History of innovation in products - Multi-axle trucks, Articulated buses
History of innovation in technology - Air brakes, CNG vehicles, Plug-in hybrids
Diversified, de-risked portfolio
Presence in heavy trucks, heavy buses, light commercial vehicles, defence logistics, power solutions, spare parts , and construction equipment
Vision:
Be in the global Top 10 in Medium & Heavy Commercial Vehicle Trucks (>7.5t GVW) and global Top 5 in Medium & Heavy Commercial Vehicle Buses (8 m and above) in volume terms

6
1,936 2,714 3,273 4,413 4,693 1,900
4,237 6,313 5,660
4,337 294
FY 04 FY 05 FY 06 FY 07 FY 08 FY 09 FY 10 FY 11 FY 12 FY13 FY14
Profitable over Cycles …
49 55 62 83 83 54 64 94 102 114 89
39,273 48,108 60,531 83,047 89,471
66,666 78,726 121,530 137,208 132,985
105,608
Sales volume (‘000 nos)
Sale revenue (gross) (in Rs.mn)
Profit after tax (PAT) (in Rs.mn)
Note: Figures mentioned above are standalone. Sales volume includes MHCV, LCV and defence vehicle volumes. Revenues include aftermarket business as well Source: SIAM, Company Audited Financials

7
Heavy Commercial Vehicles (HCV): GVW >12T and not exceeding 49T
Medium Commercial Vehicles (MCV): GVW >7.5T and not exceeding 12T
189 251 263
190 139
28.7 31.2 28.3
32.0 30.8
0
5
10
15
20
25
30
35
0
50
100
150
200
250
300
FY10 FY11 FY12 FY14 FY13
HCV TIV
HCV MS
82
75 59
4.9 6.4
8
12.7
14.8
0
5
10
15
0102030405060708090
FY11 FY10
53
FY14 FY13 FY12
69
MCV TIV
MCV MS
TIV
(‘0
00
)
MS
(%)
TIV
(‘0
00
)
MS
(%)
…and Retaining Market share in India Despite Entry of New Rivals
Source: SIAM
8
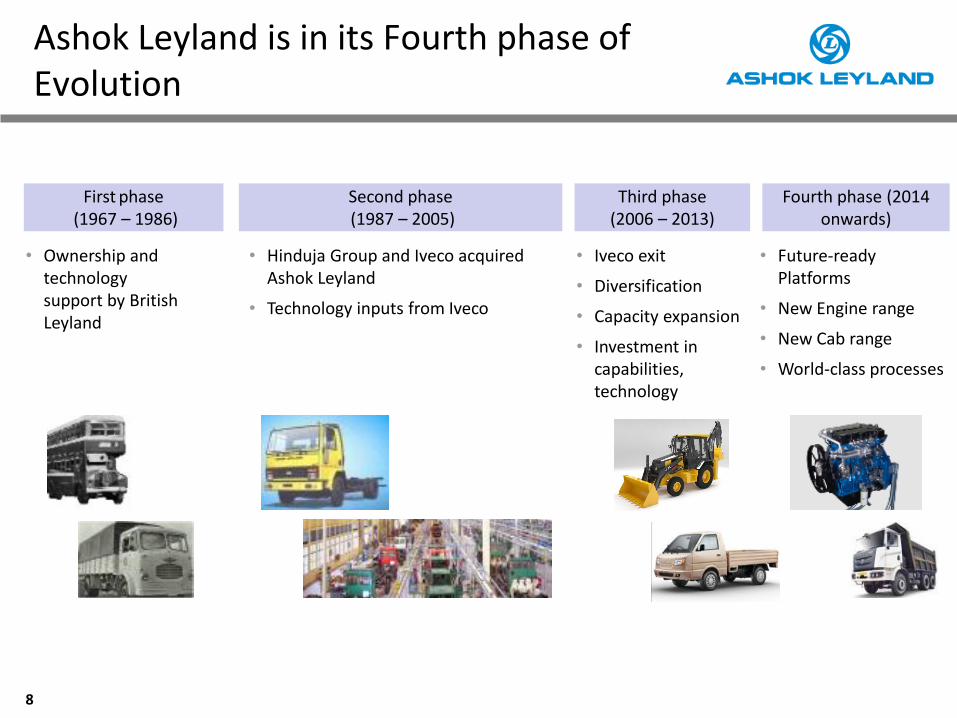
Ashok Leyland is in its Fourth phase of Evolution
First phase (1967 – 1986)
Second phase (1987 – 2005)
Third phase (2006 – 2013)
Fourth phase (2014 onwards)
• Future-ready Platforms
• New Engine range
• New Cab range
• World-class processes
• Ownership and technology support by British Leyland
• Hinduja Group and Iveco acquired Ashok Leyland
• Technology inputs from Iveco
• Iveco exit
• Diversification
• Capacity expansion
• Investment in capabilities, technology

9
When Market Conditions Created a Perfect storm…
Source: SIAM
• New entrants and
incumbents driving prices down
• Under-utilization of investments
• Rising costs of debt
349
269
-25%
FY14 FY13
201
FY12
-23%
2 years of continual reduction in M & HCV industry volume… ‘000 nos
..exacerbated by competition and debt costs

10
Restructuring
• Fixed costs
• Manpower
• Working Capital
• Debt
• Non-core assets
• Defects
…AL used this as an Opportunity to Restructure and Grow
Growth
• New products
• Network
• Processes
• Capabilities
• Delivered Quality
• Exports and services

11
FY13 FY14
Restructuring Outcomes
FY13 FY14
FY13 FY14
Admin Overheads Cost Manpower Cost
Operating Working Capital (1)
-7%
Note: (1)Operating working capital defined as Inventory + Debtors – Creditors for Materials Source: Audited financials
-69%
20 8
Days of sales
10,755
9,997
7,860
2,440
5,371
4,610
Aug'13 Mar'14
61,632
46,898 -24%
Debt
Rs. mn
-14%
NOT TO SCALE

12
Restructuring: Result-oriented and Business-focused Organization Structure
Managing Director
Global Buses
LCV Defence
Operations
Product Development
Finance
Human Resources
Business Planning
Information Technology
Legal & Secretarial
Project Planning
Central Quality
International Sales
Managing Director
Power Solutions
Aftermarket Global Trucks
Each business is measured on volume and market share goals

13
Launched Sep ‘13
10-12T GVW
Contemporary cab with European features
Automated Manual Transmission option – industry first
CV of the year 2013 – Commercial Vehicle Magazine
Additional variants under development (Left Hand Drive, higher power nodes)
Boss First product launched
Jan ’14 (25T tipper)
Platform suitable for tippers, multi-axle trucks and tractor trailers (up to 49T GVW)
Contemporary, modular cab compliant with latest EU crash requirements
State-of-the-art features – hub reduction axle, V-Rod suspension, HVAC, 4 point cab suspension, air suspended seats
Captain
Growth: Developed Contemporary Truck Platforms from 2.5T to 49T GVW
Partner Launched Jan ‘14
6-7.2T GVW
Contemporary platform developed with Nissan inputs
Featuring 3L ZD30 diesel engine with power output of 117 hp, 420 nm torque
Ergonomic cabin with tilt steering, AC option, cable shift and other features
Additional variants under development (Left Hand Drive, 4 tyre variants)
Dost Launched Sep ‘11
2.5T GVW
Featuring all-new P15 engine (1.5L, Common rail), 58 hp, 157 Nm torque
Modern cabin with power steering, AC options
LCV Cargo Carrier of the year 2012- Apollo CV Awards
Additional variants under development (Rigid suspension, CNG)

14
Launched Jan ‘14
16-25 seats
Derived from Partner platform
Mitr
Innovative low floor (Entry+1 step) front engine bus
Diesel and CNG, AC and Non AC versions
Automated Manual Transmission option
First set of orders received for 1,444 buses
4 patents applied
Jan Bus
Growth: Bus platforms from 16 to 80 seats in Capacity
Metrodecker
Launched May ‘14
Monocoque double-decker developed by Optare
Metrocity
Launched in Euro Bus Expo 2012
Urban transit midibus developed by Optare
Versa EV
Electric vehicle developed on Optare Versa platform
SMMT 2012 Award for automotive innovation

15
5.3L 4 Cyl and 8L 6 Cyl engines
160-360 hp, 600 -1475 nm, flat torque curves
3rd generation common rail, 4 valves/ cylinder
Available in Euro 3, Euro 4, upgradable to Euro 5, 6
Launched in Vehicles and Power Solutions
Neptune
Growth: Critical Aggregates Engineered to Support Future Growth
1.5L 3 cyl engine
58 hp, 157.5 Nm Torque
Common Rail direct injection
Available in Euro 3, Euro 4, CNG variants
Applied in Dost light commercial vehicles
Variants offering higher power and torque under development
P15 H Series 3.8L 4 cyl and 6L 6 cyl
engines
120-230 hp range, 500-850 Nm torque
Mechanical and Common Rail options
Upgraded to Euro 3, Euro 4 and CNG Variants
Widely used across most current and upcoming vehicle platforms and power solutions

16
203 226 253 264
155 178
171 159
64 49
152
639
+28%
FY14 FY13
4 9
FY11
358
FY12
417 27
500
Dealer outlets Containerized workshops Authorized service centres
Retail parts stores
Growth: Distribution Network nearly Doubled in past 3 years
• Focus on less-penetrated markets: North, West, and East India
• Increased Parts distribution stores
• Innovation in distribution • Containerized
workshops
• Low cost outlets

17
Contemporary, Branded Sales & Service Outlets in Innovative and Efficient Formats
• Rebranded outlets • Showrooms and service centres in innovative formats • Display pavilions • Containerized workshops

18
Growth: New Processes Implemented across the Value Chain
Design and Development
Manufacturing Sales and Marketing
PSales and Marketing Excellence
RISM
• Portfolio of shop-floor initiatives for continuous workplace improvement
• Initiatives across productivity, safety, cost, quality and other metrics
• New product development process , benchmarked against global best-practices through external consultants
• ‘Stage-gate’ process , enabling development first time right
• Breakthrough process focusing on improving process efficiency in front end marketing, sales. service and spares delivery
• Developed with inputs from leading consultants
SAP driven business transformation driving business process efficiency – Implementation completed across all functions, verticals

19
Growth: Substantial Investments in Capabilities…
• 850 strong R&D Team
• Advanced testing facilities
• High speed, torture and ride-and handling testing
• NABL certified 6 post chassis dynamometer
• State-of-the-art modeling and CAE facilities
• Advanced simulation capabilities
• Frontal Impact
• Multidynamic modelling
• Frame and body simulation
• Noise, Vibration and Harshness

20
Growth: …as well as in Manufacturing
All new integrated plant at Pantnagar, with capacity of 50,000 units in 2 shifts
Press Shop Camshaft line CWP Line
Boss- Welding robots NGC Inspection Axle machining
Assembly Panorama
21
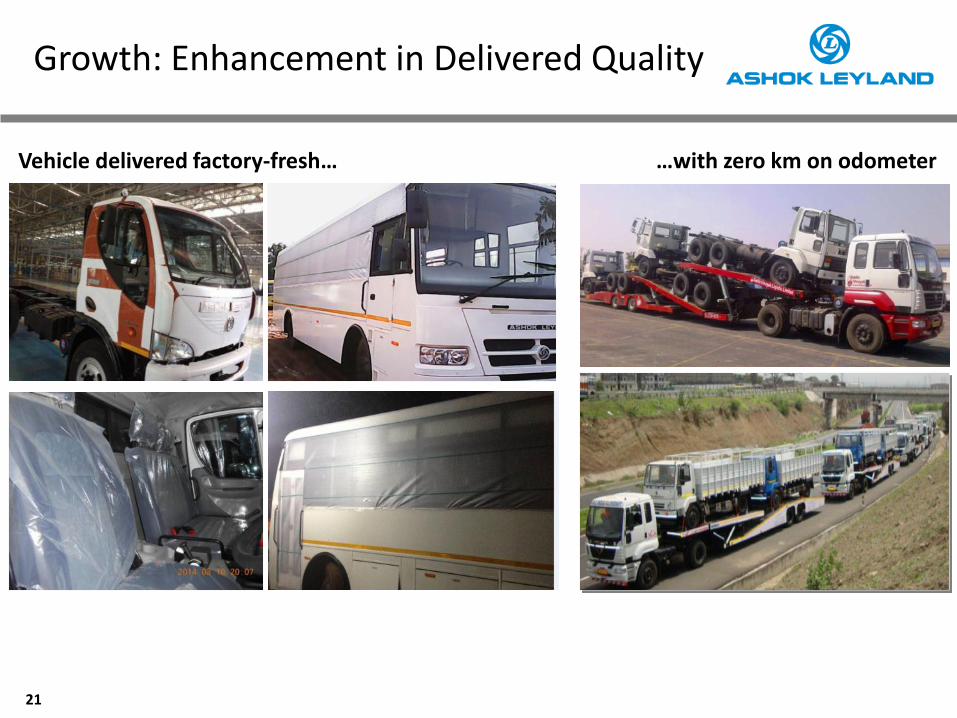
Growth: Enhancement in Delivered Quality
Vehicle delivered factory-fresh… …with zero km on odometer

22 Source: Audited financials * EBITDA & EBITDA Margin Excludes other income
Efforts Evident in Improved Q4FY14 Financial Results
Cost of Goods Sold Revenue
EBITDA*/ EBITDA Margin Employee & Other Operating Expenses
Rs. mn
Rs. mn Rs. mn
Rs. mn
Q4FY13 Q4FY14
37,285
30,768
17.5%
Q4FY13 Q4FY14
28,245
23,164
18.0%
Q4FY13 Q4FY14
Employee Benefit Cost Other Expenses Q4FY13 Q4FY14
1,983
1,839
4,235 3,292
2,821 2,473
5.3% 6.0%
• Despite revenue decline, EBITDA margin expanded due to
• Favorable revenue mix
• Manpower rationalization
• Overhead cost reduction

23
We are Ready to Capture the Next Wave of Growth
1. Full range of contemporary products (2.5T-49T GVW, 16-80 seats) and Globally benchmarked business processes
2. World-class manufacturing facilities with capacity to volume upside (150500 vehicles p.a.)
3. Footprint in five targeted international clusters
4. Portfolio of businesses with less cyclicality
– Light Commercial Vehicles
– Defence Logistics
– Aftermarket
– Power Solutions

24
Contemporary Products and Globally benchmarked Processes
PSales and Marketing Excellence
RISM
Full portfolio of contemporary products
Globally benchmarked processes
• Trucks from 2.5T GVW to 49T GVW
• Buses from 16 to 80 seats
• Engines from 58 hp to 360 hp, 150 Nm to 1475 Nm
• Future-ready – CRS, AMT, Euro VI compatible, LH/RH Compatible
• Contemporary, feature-rich cabs for complete range
• In-house ownership of design, manufacturing capability for all critical aggregates– Cabs, Engines
• New processes across design, manufacturing, sales and service
• Developed with inputs from external consultants
• Tuned over multiple cycles
• Rolled out covering 100% of organization
1

25
World-class Manufacturing Facilities with Capacity to Capture Demand Upside
UAE: Bus
manufacturing in
partnership with
RAKIA
Ashok Leyland, India • Seven facilities with capacity of 150500
per annum
• Fully integrated plant at Pantnagar
• Fully built bus facility at Alwar
• Revamped machining and assembly facility at Ennore
• Hosur facilities revamped for LCV manufacture AL UAE LLC, Ras Al Khaimah, UAE
• Established as a JV with Ras Al Khaimah Investment Authority
• Well-equipped vehicle manufacturing facility
• Capacity 2000 per year, expandable with limited investments
Optare PLC, Leeds, UK
• Modern assembly line bus body facility
• Replaces dated facilities used previously by Optare
• Capable of assembling diesel, hybrid and electric buses
UK: Optare bus
manufacturing
facility
India: Six
manufacturing
facilities with total
capacity of 150500
vehicles p.a.
2
26
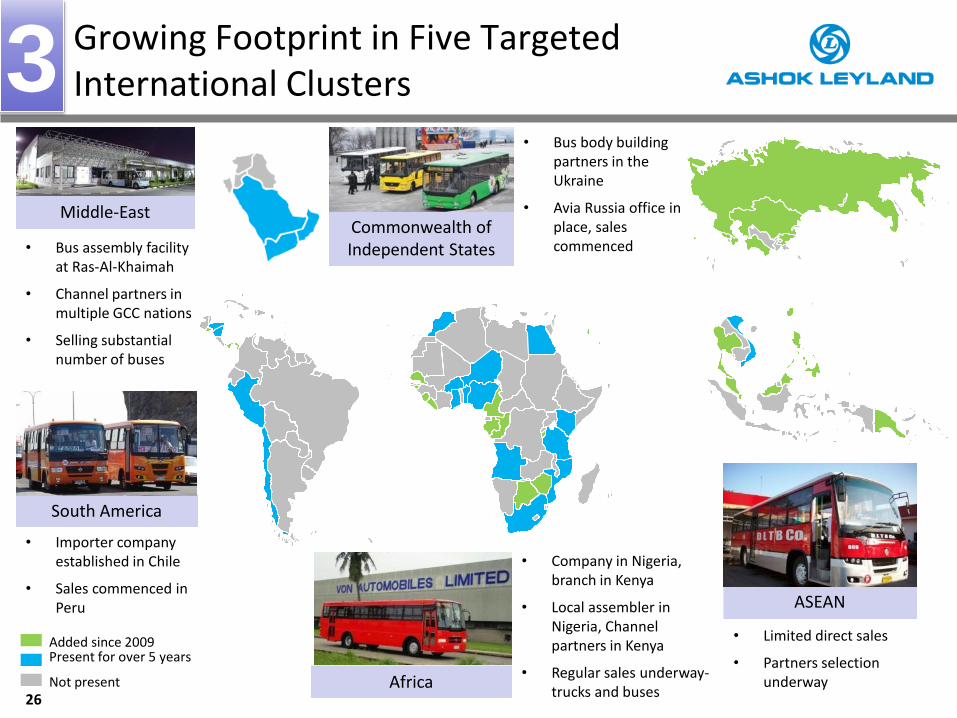
Growing Footprint in Five Targeted International Clusters
26
Commonwealth of Independent States
ASEAN
South America
Africa
Added since 2009 Present for over 5 years
Not present
Middle-East
• Bus assembly facility at Ras-Al-Khaimah
• Channel partners in multiple GCC nations
• Selling substantial number of buses
• Importer company established in Chile
• Sales commenced in Peru
• Bus body building partners in the Ukraine
• Avia Russia office in place, sales commenced
• Company in Nigeria, branch in Kenya
• Local assembler in Nigeria, Channel partners in Kenya
• Regular sales underway- trucks and buses
• Limited direct sales
• Partners selection underway
3

27
LCV and Construction Equipment
Business
Defence and Aftermarket
business
Power Solutions Business
LCV(1)
Portfolio of Businesses with Less Cyclicality
Note:
1.LCV business is a JV with Nissan Motor Co.
Partner
Dost
Defence Logistics
Aftermarket
MiTR
4
28
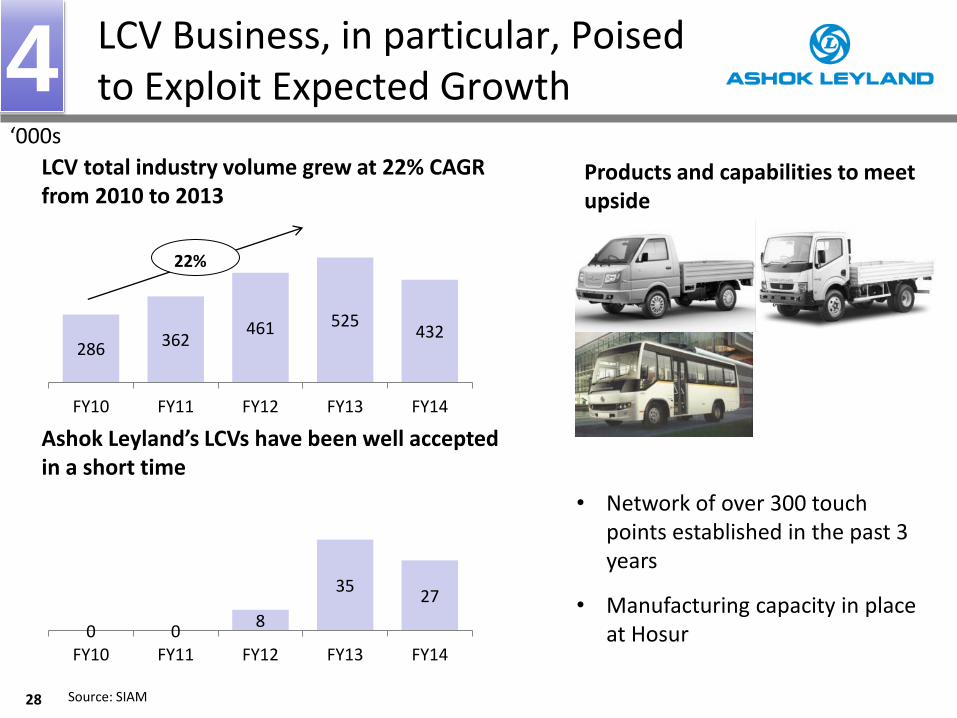
LCV Business, in particular, Poised to Exploit Expected Growth
Products and capabilities to meet upside
LCV total industry volume grew at 22% CAGR from 2010 to 2013
Ashok Leyland’s LCVs have been well accepted in a short time
286 362 461 525
432
FY10 FY11 FY12 FY13 FY14
22%
0 0 8
35 27
FY10 FY11 FY12 FY13 FY14
• Network of over 300 touch points established in the past 3 years
• Manufacturing capacity in place at Hosur
‘000s
Source: SIAM
4

29
Platforms and Capabilities for Growth in Defence Business Products
Stallion 4X4
Stallion 6X6
Super Stallion 6X6
Super Stallion 8X8
Prototypes under development
Garuda 4X4 Super Stallion 6X6 - New Cab
10X10
Capabilities
Prototype facility, Sengadu
Plant, Hosur
4

30
Near-term Goals
1. Capture volume upsides from expected market recovery through
– new product platforms
– ready capacity and capabilities
2. Drive growth in non-cyclical and counter-cyclical businesses
– Light Commercial Vehicles
– Power Solutions
– Defence
– Spares
3. Increase sales in Middle East and Africa
4. Pursue debt reduction and operating leverage improvement
5. Pursue exits from non-core businesses

31
Medium-term Strategy
1. Move from being a predominantly India-centric player to a regional player- grow across all 5 targeted clusters
2. Deliver differentiation and increased value relative to competition through new, contemporary platforms- Boss, Captain, Neptune, Dost, Partner and Mitr
3. Continue driving operational excellence
4. Further de-risk against cyclicality
– Defence logistics, parts
– Adjacent services e.g. AMCs
5. Leverage other global products, such as those from Optare
32
Summary Take-aways
• Core business transformed
• Globally competitive, contemporary products in place
• Own critical aggregates and technologies
• Targeted capacity expansion completed
• Well poised to capture expected recovery in volume growth in the near term
• Clear plan for de-risked growth in the medium term
• Continued thrust on debt reduction, exit from non-core businesses
33
APPENDIX

34
Summary FY14 Financials
Income Statement (Rs. mn) Standalone Standalone Consolidated
FY13 FY14 FY14
Revenue 124,812 99,434 114,867
COGS 91,231 76,026 81,385
Gross Profit 33,581 23,408 33,482
Gross Margin % 26.9% 23.5% 29.1%
Employee Benefit Expense 10,755 9,997 13,456
Other Expenses 14,061 11,746 15,806
EBITDA 8,765 1,666 4,220
EBITDA Margin % 7.0% 1.7% 3.7%
D&A 3,808 3,770 5,300
EBIT 4,957 (2,105) (1,079)
Interest 3,769 4,529 8,055
Other Income 624 665 924
Exceptional Items 2,896 5,057 5,208
PBT 4,707 (912) (3,002)
Tax Expense 370 (1,206) (685)
PAT 4,337 294 (2,317)
PAT Margin % 3.5% 0.3% (2.0%)
Select Balance Sheet Items (Rs mn)
Long Term Debt 27,378 32,965 54,912
Short Term Debt (including Current Maturities of Long Term Debt) 16,176 13,938 30,088
Total Debt 43,554 46,903 85,000
Shareholder's Equity 44,551 44,479 39,892
Minority Interest - - 6,521
Total Shareholders' Equity & Liabilities 130,967 128,080 175,343
Cash and Cash Equivalents and Short Term Investments 78 3,895 5,713
Fixed Assets 59,708 58,414 70,875
Non-current Investments 23,376 24,053 6,902
Total Assets 130,967 128,080 175,343
Key Ratios
Total Debt / Equity(1) 1.38x 1.43x 3.02x
Net Debt / Equity(1) (2) 1.37x 1.31x 2.81x
Note: (1) Equity net of Revaluation Reserves. (2) Net Debt = Total Debt less Cash and Cash Equivalents and Short Term Investments Source: Audited financ.al statements

35
Thank You