asfa 2007 web
TRANSCRIPT

Super Fund Investments in a Climate Change World
Frank MullerProfessorial Visiting Fellow
Institute of Environmental Studies, UNSW

Take home messages
• Take long-term view of carbon risk/opportunity
• Understand major economic transformation needed
• Recognise as fiduciary duty, not just social responsibility
• Beware of short-term political fixes & special interests
• Expect surprises – don’t count on change being gradual

A major economic transformation
Periodically, major new forces dramatically reshape the business world – as globalization and the information technology revolution have been doing for the past several decades. Climate change, in its complexity and potential impact, may rival them both. While many companies may still think of global warming as a corporate responsibility issue, business leaders need to approach it in the same hardheaded manner as any other strategic threat or opportunity.
Porter & ReinhardtHarvard Business Review, Oct. 2007

Deep emissions cuts are needed
Ultimate CO2Concentration
(ppm)
Global Av. Temp Increase
(°C)
Peaking Year for Global
Emissions
Global Emissions Change in 2050 (% of 2000 level)
350-400 2.0 - 2.4 2000 - 2015 -85 to -50
400-440 2.4 - 2.8 2000 - 2020 -60 to -30
440-485 2.8 – 3.2 2010 - 2030 -30 to +5
Source: IPCC 4th Assessment Report, WGIII

Cutting emissions won’t break the bank
CO2-e Level
(ppm)
2030 GDP reduction
2050 GDP reduction
Reduction in average annual GDP growth rate
590 – 710 -0.6 to 1.2 -1 to 2 <0.06
535 – 590 0.2 to 2.5 Slightly –ve to 4 <0.1
445 – 535 <3 <5.5 <0.12
Note: GDP loss is relative to baseline and assumes least-cost trajectory
Source: IPCC 4th Assessment Report, WGIII
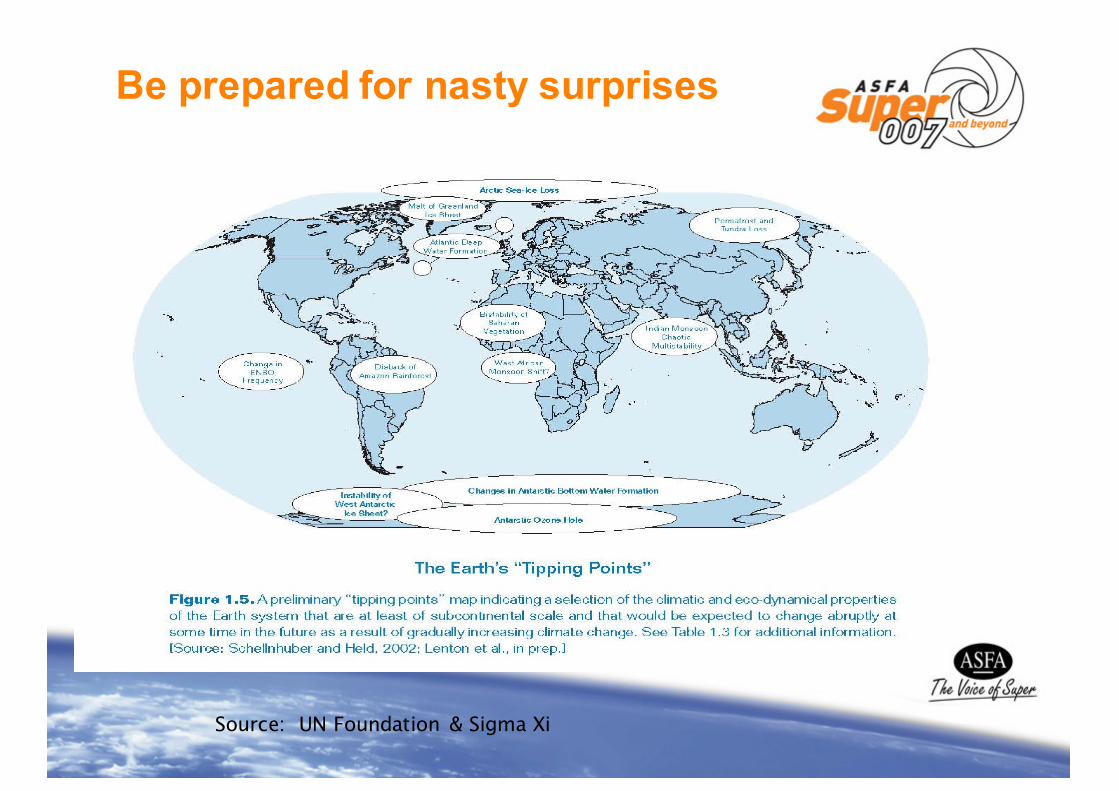
Be prepared for nasty surprises
Source: UN Foundation & Sigma Xi

Australia’s Greenhouse Emissions, 2005
Waste3%
Agriculture16%
Land Clearning & Forestry
6%
Electricity Generation
35%
Transport14%
Fugitive6%
Other Stationary Energy
15%
Industrial Processes5%
Data Source: Australian Greenhouse Office
Energy
70%
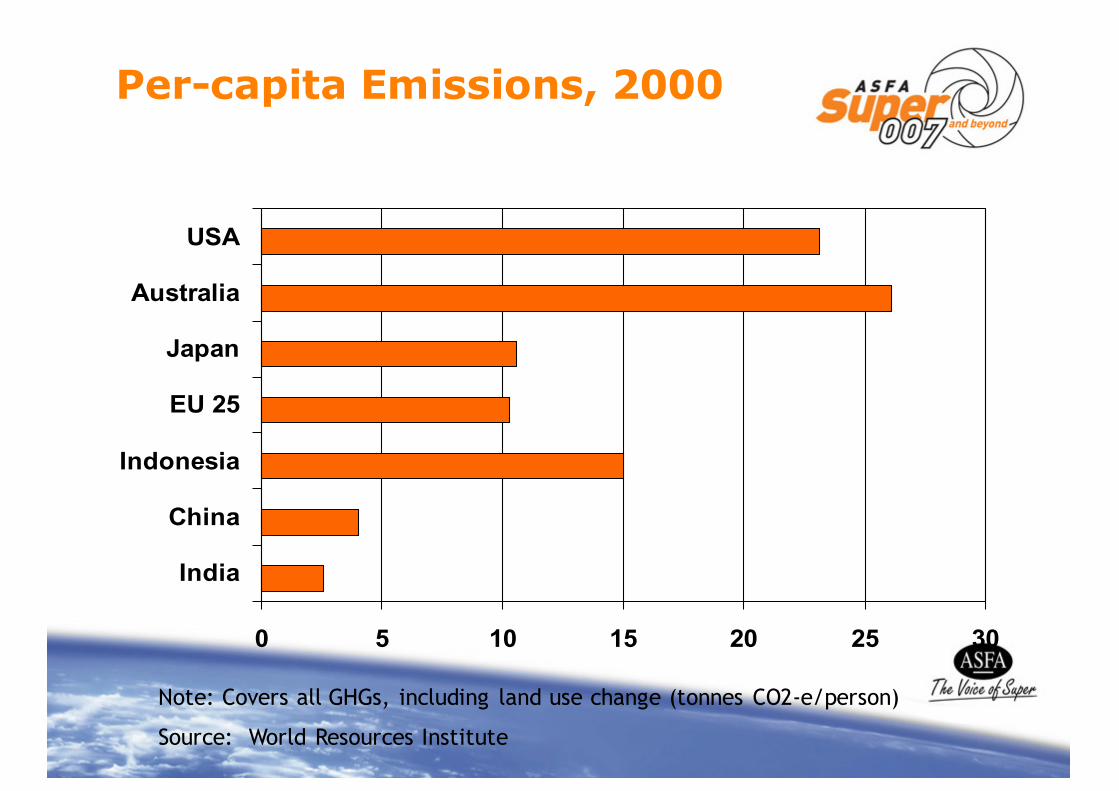
Per-capita Emissions, 2000
0 5 10 15 20 25 30
India
China
Indonesia
EU 25
Japan
Australia
USA
Note: Covers all GHGs, including land use change (tonnes CO2-e/person)
Source: World Resources Institute


“...firms can actually benefit from properly crafted environmental regulations that are more stringent (or are imposed earlier) than those faced by their competitors in other countries. By stimulating innovation, strict environmental regulations can actually enhance competitiveness.”
M.E. Porter & C. van der Linde

Renewables: Growing Capacity è Declining Costs
Global Average Capacity Growth
2000-2004
Costc/kWh
(USD)
Cost Trends (cost reduction per doubling of capacity)
On-shore
Wind
28% p.a. é 4-6 12-18% ê
Grid-connected
Solar PV
60% p.a. é 20-40 20% ê
Source: Renewables 2005: Global Status Report (www.ren21.net)

Energy EfficiencyThe largest, cheapest & first option
IPCC WG3
(May 07)
•… often more cost-effective to invest in end-use energy efficiency improvement than in increasing energy supply …
•By 2030, about 30% of the projected GHG emissions in the building sector can be avoided with net economic benefit
McKinsey Global Inst.
(May 07)
•By capturing the potential available from existing technologies with an internal rate of return (IRR) of 10 percent or more, we could cut global energy demand growth by half or more over the next 15 years.
•Base case energy demand growth of 2.2% p.a. -- can be cut to less than 1%, without compromising economic growth.
•While market forces alone will not lead to this outcome, targeted policies can overcome the policy distortions and market imperfections that are currently acting as barriers …
Intl. Energy Agency
(2006)
•In many countries, new buildings could be made 70% more efficient than existing buildings. Some of the exciting new technologies that can contribute to this transformation have not yet been commmercialised, but most have.
•In industry there is huge potential to reduce energy demand and CO2 emissions…

Clean Energy OptionsBuildings can be 70% more efficient
• Windows – 3x insulation value
• Gas furnaces – 95% efficient
• Air conditioners – 30-40% energy cut last 10 yrs
• Lighting – cost-effective savings up to 60%
• Cut standby power = 10% home electricity
• Efficient refrigerators, water heaters, washing machines & dishwashers
• Smart meters, PVs, micro co-generation, district heating, heat pumps, etc
Source: International Energy Agency

A Clean Energy Scenario for AustraliaCO2 Emissions from Stationary Energy, 1990-2040
0
50
100
150
200
250
300
350
1990 1994 1998 2002 2006 2010 2014 2018 2022 2026 2030 2034 2038
Mt/a CO2 equiv.
Energy Efficiency
Renewable and gas fired generation
Baseline or weak efficiency
Baselinewith mediumefficiency
Clean EnergyFuture
50% reductionin CO2 emissions
Note: Time path is notional. Source: Saddler, Diesendorf & Dennis, 2004.

Clean Electricity Scenarios for Australia
Black Coal9% Natural Gas
17%
Oil1%
Hydro7%
Biomass27%
Wind20%
Solar4%
Cogeneration15% Black Coal
28%
Brown Coal6%
Natural Gas26%
Hydro7%Biomass
20%Wind11%
Solar2%
2040 with 50% cut from 1990Saddler, et. al., 2004
2050 with 60% cut from 2000Aust. Bus. Roundtable on CCIncludes CCS for fossil fuels

Embodied emissions for home construction
0
2
4
6
8
10
12
14
Floor structure Floor covering Wall frame Roof frame Windows
tonnes CO2-e
Concrete Steel Cermaic tiles Brick Aluminium Timber
Source: Forest & Wood Products R&D Corp & CRC for Greenhouse Accounting
Don’t mask price signals with special deals

Social responsibility or fiduciary duty?
• Universal ownership frames fiduciary duty– Comprehensive view of whole portfolio– Externalities matter (+ve and –ve)
• Long-term investment liability matches time horizon of climate change risks & opportunities
• Broad membership – interests of many, not few• Low-cost institutions – understand need for policy frameworks that minimise skimming

Practical steps for super funds
• Support reporting, rating & indexing initiatives
• Factor carbon price into investment decisions
• Act now on energy efficiency of property holdings
• Invest in clean energy, sustainable infrastructure, etc.
• Engage with companies and vote proxies for reasonable shareholder proposals
• Engage on public policy to counter special interests & short termism– effective & fair emissions trading– energy efficiency priority
– sustainable infrastructure (public transport, rail freight)

Take home messages
• Take long-term view of carbon risk/opportunity
• Understand major economic transformation needed
• Recognise as fiduciary duty, not just social responsibility
• Beware of short-term political fixes & special interests
• Expect surprises – don’t count on change being gradual