aset research bursary · 2017-09-24 · aset research bursary final report ... quantitative data...
TRANSCRIPT

ASET Research Bursary
Final Report
An Investigation into the maximum number of hours that an
undergraduate student can work during the semester without adversely
impacting on their academic commitments.
James Hanton

Executive Summary
Introduction
Students, Employment and Finance
Positives and Negatives of Work
The ‘Critical Threshold’
Research Aims
Locational Context
A Note on Widening Participation
Methodology
Research Approach
Interviews
Focus Group
Personal Communication
Survey
Results: Focus Group, Personal Communication & Interview
Financing and Completing University
The Positives and Negatives of STE
The Current Recommendations and Policies
Understandings of ‘Academic Commitments’
Discussion: Focus Group, Personal Communication & Interview
Summary and Comparison to Literature
Results: Survey
Demographic of Respondents
Details of Work
University and Work
Student Life and Work
Working Hours and Academic Commitments
Reasons for Working
Closing Questions
Discussion: The Survey
Working Patterns and Differences
Academic Commitments
Reasons for Working
Research Limitations
Focus Group
Survey
1
2
2
4
6
7
8
8
9
9
9
9
10
11
12
12
13
14
15
15
15
17
17
19
24
31
36
48
51
55
55
57
59
60
60
60

Conclusion
Summary
Recommendations
Further Investigation
Closing Thoughts
Acknowledgements
Notes
Bibliography
Appendices
Appendix 1 – Sample Consent Form
Appendix 2 – Sample Data Slip
Appendix 3 – The Online Survey
Appendix 4 – Breakdown of Average Working Hours by School
62
62
63
63
65
65
65
67
71
71
72
73
84

1
Executive Summary
This report provides the findings from the research funded by ASET into student employment.
It was an investigation into the maximum number of hours that an undergraduate student can
work during the semester without adversely impacting on their academic commitments.
Working while studying is an undertaking for a significant proportion of students, motivated by
financial insecurity but also hopes of improving their future career prospects. Employers are
increasingly looking for graduates who have some kind of work experience by the time they
leave university, meaning that employment is viewed with increasing importance. The worry
remains however that too much work during the semester can negatively affect a student’s
academic performance – once they reach a ‘critical threshold’ – and different universities have
different reccomendations as to where the limit on working hours should be.
This research was carried out among students at the University of Edinburgh, among full-time
undergraduate students only. Qualitative data was collected through interviews, personal
communication via email & social media, and a student-led focus group. These were analysed
through coding to find common themes, with a particular focus on the definition of ‘academic
commitments’ as well as the positive and negative effects of working during the term.
Quantitative data was collected through an online survey, the questions within it being
informed by the focus group participants.
Participants in the focus group generally believed that:
Work was a necessary part of their student life as student loans were not enough to meet
their living costs.
Money was the main positive result of employment.
Their extra-curricular and social activities had been the most badly affected by
employment.
Students recognised academic commitments as including studying, reading, class time,
meeting deadlines and (in some cases) ‘co-curricular’ activities.
This informed the construction of the survey, which covered points raised by the focus group
as well as factors drawn up by the researcher (not all factors proved to be significant). The
survey found that:

2
There are particular working hour brackets after which students were less likely to be
fulfilling certain academic commitments.
However, students below or meeting this bracket still report struggles with regards to study
time, use of university facilities and other academic activities.
The suggested reasons behind this are to do with time management and the financial
insecurity felt by a vast number of students.
This report concludes that for any guidelines to be feasible, more support for students is
needed to mitigate the negative impacts of financial and temporal constraints. It also suggests:
Further areas of study which can contribute to the wider body of research surrounding the
impact of employment on academic study.
Ways in which this research and guidelines can contribute to improvements in the overall
student experience.
Limitations and areas of further study which merit new research to address other topics
not covered by this report.
Introduction
Students, Employment and Finance
Semester-Time Employment (STE) is increasingly a factor in the average student’s life, and
not just during vacation time. Hakim (1998) explains how various studies in the 1990s showed
that a growing proportion of full-time (F/T) students hold down part-time (P/T) jobs during the
semester as well as during the holidays. That was twenty years ago and this pattern has
continued into the present day. A press release by the insurance provider Endsleigh (2015)
found that 63% of their respondents had a P/T job, with 33% working P/T during term.
Furthermore, 14% of students had a full-time job – either during vacation, term-time, or both.
The same report mentions that the average amount earned by students through working is
£412 a month. For students aged 21-24 on the National Minimum Wage of £7.05 per hour (UK
Government, 2017a) that works out as a mean average of 14.61 hours per week.
Many students are subject to a great degree of financial instability and insecurity. The largest
jump in student employment came after the introduction of tuition fees and abolishing of
student grants, which triggered an 11% rise in the number of students working P/T during the
semester (Callender, 2008). Before 2012, UK universities were able to charge a maximum of
£3465 in tuition fees for UK students, but this then rose to £9000 (Mercer et al, 2016) and will

3
rise a further £250 for 2017/2018 (Gray, 2017). University is an increasingly expensive
undertaking.
This appears to have a crippling effect on current students’ feelings about their financial
security. The NUS (2012) found that 48% of full-time undergraduates agree or strongly agree
that they often worry about not having enough money to cover basic living expenses, while
approximately 45% either strongly agree or agree that they have little control over their
financial situation. This is consistent with Callender (2008: p.368) who reported that over 80%
of students worked because “they ‘need the money for basic essentials’.” This has been found
to have knock-on effects on stress levels and mental health, a topic discussed by Carney et
al (2005) and Richardson (2011) among others.
This financial insecurity is undoubtedly a motivation pushing students into work. Watts (2002:
p.71) spoke to a student who sought employment because she “didn’t realise it would be this
expensive” to be at university. She is not alone. Endsleigh (2015) found that 56% of students
say that they had found university to be more expensive than expected. Sarah Newall,
Manager of Student and Graduate Markets at Endsleigh, is quoted in Endsleigh (2015) as
saying “unexpected costs at university mean that many are looking for jobs to help ends meet.”
STE is what allows many students to remain in higher education.
However, the likelihood of being in STE while at university is complicated by the various
sources of income used by different students. Figure 1.1 shows how the Students’ Award
Agency for Scotland (SAAS) awards both student loans and bursaries to students for the
academic year based on their status as ‘young’ or ‘independent’ as well as household income,
which significantly affects the student’s loan entitlements1. Furthermore, as Barke et al (2000)
briefly mention, parental support is a key factor. If a student from a richer family receives no
financial support from their family, it is reasonable to suggest that they may seek alternative
sources of income which may include employment. Household income is far from a solid
predictor of whether a student will work during term time.

4
Fig. 1.1: Funding Availability from SAAS Based on Student Status and Household Income (adapted
from SAAS, 2017).
Positives and Negatives of Work
Skills and attributes which, it is suggested, benefit from STE include communication, time
management, customer service and team work (Robotham, 2013). While the effects of STE
and the attributes which it helps to develop are increasingly valued by HE institutions, this has
not always been the case. Watts (2002: p.70) quotes one of her participants who states that
the academic community “don’t consider that you do work they just assume that you’re a
student and that’s what you do,” a view echoed by Curtis (2003) who found a lack of both
awareness and sympathy regarding students engaged in STE among academics. Curtis &
Lucas (2001: p.51) also claimed that “the benefits of working are not yet accepted by
universities,” in spite of STE’s growing significance in the average student’s experience of
university and the personal development which it can facilitate.
That was the case fourteen to fifteen years ago. The situation appears to have changed
dramatically, and now universities generally seem to embrace the potential which STE can
help to unlock. The University of Edinburgh (2016b) notes how “a degree is no longer enough”
and that companies are looking for “work ready graduates,” something which STE can help to
create while students are still working towards their degree. New skills and abilities could prove
invaluable in securing a job after graduation, as well as helping to fund continued education.
Employers also prize the skills which STE allows students to acquire and improve. The Group
Graduate Programme Manager for the Co-Operative has said that:
Young Independent
Gross Household Income Bursary Loan Bursary Loan
£0 - £18,999 £1875 £5750 £875 £6750
£19,000 - £23,999 £1125 £5750 £0 £6750
£24,000 - £33,999 £500 £5750 £0 £6250
£34,000+ £0 £4750 £0 £4750

5
“Graduates with a wealth of good quality work experience (voluntary or paid) have varied
learning experiences and challenges that develop skills and competencies such as -
commercial awareness, results focus, self-development, tenacity, project management,
diplomacy, flexibility, resilience and customer focus” (Glasgow Caledonian University, 2017).
This highlights the benefits of experience in a work environment, both for the graduate and
the employer, who can choose from a selection of highly skilled and experienced workers.
High Fliers Research (2016) found that almost half of the surveyed recruiters at top graduate
employers said that it was either ‘not likely at all’ or ‘not very likely’ that a graduate lacking any
previous work experience would be successful during the selection process and be offered a
job, regardless of which university they had graduated from. Employment is a valuable source
of work experience which sets graduates up for success after university.
However, the decision to seek STE is not a straightforward one for students to make.
Howieson et al (2012) as well as Richardson (2011) make note of the ‘zero sum model’. This
stresses the negative effects of work on various aspects of their life, especially with regards
to educational attainment. There is a warning that:
“Students’ educational attainment is reduced by competing activities that bear no relationship
to their studies – such as a Saturday job as a shop assistant, or evening jobs [such] as barman
or waitress” (Hakim, 1998: p.174).2
While Hakim (1998) was writing almost twenty years ago, it is something which has remained
a cause for concern. The problem is that measuring the drawbacks of STE has proved far
from straightforward. Watts (2002) found that students working the same number of hours
reported inconsistent feedback regarding whether employment impacted positively or
negatively on their studies. Perhaps the relationship is far from direct – Howieson et al (2012)
conclude that, rather than employment directly detracting from academic study, it has found
space in the lives of schoolchildren alongside (and often to the detriment of) other
commitments such as socialising and sport. It is not a simple case of work and study negatively
correlating.
Research into the link between STE and academic study has overwhelmingly covered either
attainment and grades (Callender, 2008; Carney et al, 2005; Curtis & Shani, 2002; Watts,
2002) or drop-out rates (Hovdhaugen, 2015). In focusing on these quantitative measurements
of academic performance, it is possible to argue that these studies are being conducted with

6
the underlying terms and understandings (of ‘study’ and ‘work’ among other things) being
defined by the academics and by the institutions, rather than by the students themselves.3
The ‘Critical Threshold’
There have been efforts to try and identify exactly how many hours a student can work without
impacting on their university studies. Howieson et al (2012: p.323) call this the “critical
threshold” –the point where the number of hours worked by a student is associated with poorer
academic attainment. Hovdhaugen (2015) found that working more than 20 hours per week
correlates with Norwegian students being likely to leave university before their degree is
completed. Callender (2008) notes a range of suggestions ranging from 10 to 14 hours a week,
while Salamonson et al (2012: p.583) described a maximum of 16 hours a week as “the tipping
point” and “consistent with previous studies.” There is no concrete agreement as to where the
limit actually is.
It would also appear to be the case that different universities across the UK have their own
suggestions as to where this ‘critical threshold’ lies. Of the 24 Russell Group (RG) Universities,
22 offer official guidance as to the maximum number of hours a student should work in a P/T
job alongside their studies (Figure 2.1).4 The mode recommendation is 15 hours, and the mean
average is almost the same (14.82). However, there is still no clear consensus as to there the
‘threshold’ may lie – those recommending 15 hours a week still make up less than half of the
RG Universities.
Fig. 2.1: Proportional representation of recommended working hours across the RG universities.

7
The University of Southampton has no official recommendation. However, their Careers and
Employability Service (2017) said in an email on the 8th June that they run a part-time
internship programme on campus where none of the positions exceed 10 hours per week.
Queen Mary University of London (QMUL) also has no official recommendation – the Careers
Service (2017) said over the phone on the 7th June that it is up to the student to decide on the
workload that they are capable of dealing with.
This kind of policy has the potential to be problematic, in that it assumes unimpeded freedom
of decision making on the part of the student. Hovdhaugen (2015) suggests that students who
are working to improve employability have chosen to work, while those working to deal with
expenses and debt have no choice. To elaborate:
“Ideally, students would make an informed individual decision about whether the benefits of
working outweigh the risks… in reality, financial necessity may remove their choice”
(Richardson, 2011: p.6).
A student feeling forced into employment will find that there is suddenly a lack of clear
guidance, something which Richardson (2011) attaches to the ambiguity of STE research
conclusions to date. Watts (2002: p.73) is an example of this, arguing simply that “it is up to
the individual to balance the demands of combining academic study with paid employment.”
Such conclusions, which offer nothing in the way of fixed advice, will be of little help to students
who engage in STE out of sheer necessity.
Research Aims
This report will investigate the maximum number of hours that F/T undergraduate students
can work during the semester without adversely impacting on their academic commitments.
The research aims, as proposed by the University of Edinburgh Careers Service, are the
following:
1. Gather a sample of views from as large a representative sample of students as possible
about their experiences of working during the semester.
2. Uncover how the students perceive the positive and negative impacts of this on their
academic study.
3. Recommend guidance to help students develop strategies to balance semester-time work
with their academic commitments.

8
The scope of the research includes undergraduate students who are enrolled full-time on a
course at the University of Edinburgh who are working or have worked during the semester.
A full-time student will be a student who completes at least 120 course credits per academic
year (The University of Edinburgh, 2017b).
Locational Context
Edinburgh is the capital city of Scotland, with a population of over 498,000 (Grant, 2016). The
city is home to four universities, as listed by Marketing Edinburgh (2017) in no particular order:
University of Edinburgh.
Edinburgh Napier University.
Heriot Watt University.
Queen Margaret University.5
The University of Edinburgh is the oldest of these institutions, dating back to 1583 (Marketing
Edinburgh, 2017). The Guardian (2016) identifies the university as the highest ranked HE
institution in Edinburgh and second only to St Andrews in Scotland. As of the end of January
2017, the university had a total of 37, 861 fully matriculated students – 21, 338 (56.36%) of
whom are full-time undergraduates (The University of Edinburgh, 2017a).
There is already some idea of how common employment is among the university’s students.
High Fliers Research (2017) surveyed 801 final year students and found that 50% had
engaged in STE while studying. This statistic alone is suggestive of how large a role STE plays
in the student experience at the University of Edinburgh
A Note on Widening Participation (WP)
The University of Edinburgh (2015) outlines prospective students to be considered as having
WP status if they are:
Their family’s first generation to consider higher education.
Those students from lower socio-economic groups.
Attendees of schools which see relatively few students go on to higher education.
Residents of low participation neighbourhoods.
Mature students.
Care leavers and accommodated children.

9
For this report, WP status is accounted for by considering entitlement for additional support,
caring responsibilities, widening access programmes and if the student was the first member
of their family to attend university.
Methodology
Research Approach
Qualitative data was collected in the form of interviews, a focus group, personal
communication with students via email and a conversation over social media with a recent
graduate. Rather than being the primary method of data collection, the focus group was set
up to inform the questions which would appear in the subsequent survey, which was the
primary method used for data collection. The survey data was quantitative.
Interviews
The first piece of primary research undertaken for the project was qualitative in nature; an
interview with a member of staff at the Advice Place student support centre based in the
Potterrow student association building at the University of Edinburgh. For ease she will be
referred to as Rebecca (not her real name). Another conversation was arranged with Bobi
Archer, the EUSA Vice President for Education, who by this point had been in the role for
about four weeks.
Focus Group
The purpose of the focus group was to discuss student experiences of STE alongside F/T
study, and to further explore the understandings of what an ‘adverse effect on academic
commitments’ may look like from a student perspective. The data resulting from the focus
group was used as a basis upon which to form the survey questions, thereby defining the
questions and the terminology in the students’ terms rather than the researcher’s as much as
possible. This was felt to be important to make the survey a more valid collection of student
opinions and to avoid any assumptions or bias from the researcher.
Students who were interested in volunteering as a participant replied to an email. They were
then asked to reply again including the following information:

10
Gender
Nationality
Fee Status (how much the student pays in tuition fees per year)
Year of Study
Degree
School
Place of Work
Nature of Work
Contracted Hours
Average Hours
The focus group was held in a quiet seminar room on the 3rd floor of the Main Library. Consent
forms and data slips were presented to the participants to complete upon arrival. These can
be seen in Appendix 1 and Appendix 2 respectively.
The group had five participants, of whom:
Four were female, one was male.
Three were from the UK, one from the USA and one from Libya
Two paid £9000 a year tuition, one paid £25,000 a year, and two paid no tuition fees.
Two studied in the School of Philosophy, Psychology and Language Sciences, one in the
School of Chemistry, one in the School of Social and Political Science and one in the
Business School.
Two worked between 5-10 hours per week, two worked between 20-24 hours per week
and one worked 36 hours per week.
The group was recorded on a digital dictophone to supplement the note-taking. Participants
were informed that they would be recorded and the moderator clearly stated when the
recording was started and when the dictophone was switched off. While identifying markers
were present in the notes taken during the group, all participants were anonymised in the final
report. Focus group participants were not prohibited from filling out the subsequent survey.
Personal Communication
Several students who were interested in the focus group but unable to make the advertised
date and time sent emails detailing some of their experiences of working while studying.

11
A recent graduate from the University was also contacted through social media, who will be
referred to as Mike (again, not his real name). While a student, he had worked for the
Edinburgh University Students’ Association (EUSA) as a retail team leader since starting
university and graduated with a First class degree in Computer Science.
Survey
A survey was identified as the best way to contact a large cohort of students at once in a short
time frame. The survey was built around the questions which the research was set out to
answer as well as the themes which emerged from the focus group and the other qualitative
research. Mercer et al (2016) have already noted how factors such as age, degree programme
and contracted hours likely make STE a different experience for different students, but this
survey accounts for many additional factors on top of these. The full survey is attached as
Appendix 3. As a brief overview, the research questions led to the survey asking about the
following:
Fee Status
Contracted Working Hours
Average Working Hours
Working Pattern
Type of Work
Industry Sector
Number of Organisations/Individuals Who the Student Works for
University Contact Hours
Extra-Curricular Activities
Motivations for Being in STE
Benefits and Drawbacks of STE
Quality of Academic Work
Tiredness & Stress
Limitations on Reflective Learning and Meeting With Peers/Staff
Missing Classes and Deadlines
The focus group, email communications, the online conversation with a recent graduate and
the interviews also saw the following areas added to the survey:.
Student Loan Entitlement
Course-Related/Study Material Costs
Co-Curricular Activities (specifically academic societies)

12
Students Who Have Spent an Optional Year Abroad
Keeping up With Course Reading
The Amount of Private Study Time
Commuting
The survey was published online through the University of Edinburgh’s Careers Portal, which
requires a student login to access. This meant that only current students, recent graduates
and administrative staff would be able to access the survey. It also meant that other data such
as year of study, degree, school, gender and nationality were collected automatically, and
therefore were unnecessary to include in the survey questions. The data was analysed
through Microsoft Excel once the report had been downloaded from the portal. In total, 653
valid responses were recorded.
Results: Focus Group, Personal Communication & Interviews
Finance and Completing University
All the focus group participants agreed that debt is an “overhanging theme” of their time at
university and a deep cause for concern. As such, money is the main reason they work.
Participants A and C, who were both English, complained about their maintenance loans and
that employment was necessary to remain at university:
“My maintenance loan didn’t actually cover my rent. So, I had to [find work]. I got interviews
and stuff before I came to university” (Participant A).
Maintenance loans were consistently raised as an issue throughout the duration of the group
for their perceived inadequacy and unfairness. For example, when asked if anyone had
influenced their decision to find STE while at university, Participant C replied “The government
for the size of our loans.” The income from STE was viewed more as essential rather than
disposable income.
General course costs were also raised as an issue. Participant B said that they had spent in
excess of £300 on textbooks, while Email Respondent B had spent over £400 in the past
academic year to fund materials and supplies for their Performance Costume degree, further
commenting that they would not be able to fund their studies without STE. The income from

13
employment is used in part to cover these expenses, which if not paid would seriously impede
their time at university.
All but one of the students agreed that tuition fees were not a factor in their take-up of STE,
instead saying that the size of their student loans was a far more significant reason.6 The
exception, Participant E, gave this explanation:
“My tuition fees are £20,050 a year… the big thing for me is that if tuition fees were less then
my parents could help me out more. Coming from the States, my parents have been planning
to pay loads and loads of money for my university tuition since before I was born basically.
They have been planning for that, but it is still just so much money. I don’t feel comfortable
asking them for any more than they are already helping me” (Participant E).
It is not the tuition fees directly which push this student towards STE. Rather, it is a feeling of
guilt about asking their parents for money since they already pay so much. The rest of the
group made the point that tuition fees for them are not an expense that they see yet, and unlike
their loan does not affect their immediate experience of university. To conclude, none of the
participants were motivated to work directly by their fee status.
The Positives and Negatives of STE
There was a consensus within the group that STE is good for improving time management
skills and helping to find future work. Participant E recognised how even seemingly mundane
tasks can potentially prove very valuable after graduation:
“Working in the shops is very, very simple. But it is still experience of working on a till, and
closing and opening the shops, and customer service and things like that. A variety of skills is
helpful” (Participant E).
Identified negative aspects of STE focused on not being able to participate in extra-curricular
and social activities. Participant A explained how they can be called into work with as little as
2 hours’ notice. The late night studying which followed increased tiredness and reduced their
participation in social activities. The main risk, as Bobi Archer sees it, is “a complete
overburden” which would simply overwork the student to an unhealthy level.

14
Two students contacted via email confirmed that work had detracted from degree-related
activities. Email Respondent B said that they were unable to work on their projects at the
weekend as most of their friends did as a result of STE. Email Respondent C also explained
how their attendance had been impacted.
“I’ve found that I could do between 6-15 hours [of work] each week. Although I have achieved
exactly what I was aiming for at uni, this work pattern stopped me from attending occasional
morning lectures due to tiredness” (Email Respondent C).
The Current Recommendations and Policies
The cost of living in the Scottish capital was an issue which led the group participants to
challenge the near-universal funding levels provided to students across the UK. Participant D
simply said that “rent here is so expensive,” while Bobi Archer also said that Edinburgh is “an
incredibly expensive city to live in.” Participant C mentioned that only London has higher loan
levels to counter the effects of higher living costs, while the provisions are equal across the
rest of the country.7 They gave this example:
“My sister is at uni in Leeds, and her rent is £70 a week. If we got that here, that would just be
amazing! I would applaud whoever found a decent flat within walking distance of the uni for
£70 a week!” (Participant C).
Rebecca disapproves of a fixed working hour recommendation. She said that it also does not
account for mature students who may have to work more hours to support their families, and
those students with heavily timetabled degree programmes who may not have the time to seek
STE. This was also the view expressed by Bobi Archer, who said that Medicine and Veteriniary
Medicine students can undertake placement opportunities but may struggle to work during the
term. Ms Archer also added that students are old enough to be given the freedom of choice
to make the decision themselves:
“I think that students should be able to work more than 15 hours if they feel capable” (Bobi
Archer VPE).
She elaborated on this by saying that some students may feel the need or the desire to work
more, and that any kind of guidance should be adaptable to week-by-week changes in
15
academic demands (the difference between the first week of term and exam time, for example)
as well as between years of study.
Understandings of ‘Academic Commitments’
When the students were asked about what ‘academic commitments’ are, they gave a number
of different examples, including meeting deadlines and keeping up with course readings.
Timetabled lectures, tutorials, seminars and (for science students) lab sessions were also
given as examples, all of which can be described as ‘contact hours’ as students are usually in
direct contact with a member of academic staff. Mike added to this list by including “private
study time,” incorporating everything from group study, reading, revising, making notes and
other similar activities.
Commitment in the form of independent, self-managed learning is the dominant form of
university study for all of the group participants. An additional commitment was provided by
Participant C, who discussed their role in academic societies as opposed to student societies:
“It’s Women in Business and the Business Society that I am really quite heavily involved in. I
would class that as an academic commitment. Because while I love it, at the end of the day I
am a business student” (Participant C).
The argument was that those activities which may not necessarily seem ‘academic’ are
nonetheless important for what any given student studies and what they want to get out of
their university experience.
Discussion: Focus Group, Personal Communication & Interview
Summary and Comparison to Literature
An overwhelming word emerging from the focus group was ‘money’. Hakim (1998) claimed
that the income from P/T work is supplementary to larger sources of support such as student
loans, but in this case such a claim would be a gross miscalculation. Students both in the
group and via email explained how the money earned through working makes up for
shortcomings in financial assistance and covers essential material costs for their specific
courses. It is likely that, without this extra income, remaining at university and succeeding may
become a serious problem for these students.

16
The also challenged a common association made by previous research between tuition fees
and employment. Mercer et al (2016: p.181) describes rising STE rates as an “unsurprising
outcome” of rising tuition fees. The group participants contradict this statement. None were
directly pushed in the direction of employment by their fee status – student loans were a much
more commonly given reason. This was because the financial impact of tuition fees was
viewed as less of an immediate concern.
The group participants picked up on several benefits of being in employment while at university,
as previously discussed. They clearly felt that employment was a worthwhile undertaking given
its positive effects. Negatives were also identified, although not solely the same concerns
articulated by Hakim (1998) about students forfeiting academic success by being in work
unrelated to their degrees. As was the case with Howieson et al (2012), students reported that
STE took time away from extra-curricular activities as well as academic undertakings.
Students’ social lives bore an impact just as much as their studies did.
‘Academic commitments’ was expanded on by the participants largely in ways perhaps not
unexpected, with one notable exception: academic societies. While it was argued that such
societies are in fact academic commitments in themselves, it is perhaps more accurate to
describe such activities as ‘co-curricular’. Co-curricular activities are those which complement
and mirror what students are being taught during their time in education, and the distinction
between co-curricular and academic commitments is becoming increasingly permeable (The
Glossary of Education Reform, 2013). This can mean that certain activities are viewed as
academic undertakings.9

17
Results: The Survey
Demographic of Respondents
The student database allows the respondents to be categorised in a number of different ways.
One of these is by gender. Figure 3.1 (n=653) shows that 72% of the respondents were female,
compared to 28% male. Students are able to express a preference for gender to be
unspecified, but no students of unspecified gender appeared to respond to the survey.
Fig. 3.1: Proportional representation of survey respondents by gender
International student status was also highlighted early on as a potentially significant factor, as
international status can have dramatic effects on the cost of higher education. The official
international status of the respondents is displayed below in Figure 3.2 (n=653). Just over 10%
of respondents are international students. Further analysis showed that 72% of respondents
originally came from the UK, 18% were from the EU and 10% were from elsewhere.
Fig. 3.2: Proportional representation of survey respondents by international status.

18
Given how the focus group had emphasised the difference between pre-Honours and Honours
years at university, study year was identified as a key factor. Figure 3.3 (n=653) shows that
2nd and 3rd years gave the highest response rate to the survey. Although 0% is stated, two 5th
year students responded to the survey.
Fig. 3.3: Proportional representation of survey respondents by study year.
Students’ college of study was also recorded. This breakdown is shown in Figure 3.4 (n=653),
while a more in-depth breakdown of responses based on the individual schools is found in
Appendix 4. More than half of all the respondents study within the College of Humanities and
Social Science. One third study within the College of Science and Engineering, and the
remainder study within the College of Medicine and Veterinary Medicine.
Fig. 3.4: Proportional representation of survey respondents by college.

19
Later in the survey, respondents were asked to confirm what their living arrangements were
in the previous semester. Figure 3.5 (n=653) shows that two-thirds live in privately rented flats,
with sizable minorities also either living at home or in flats rented from the university.
Fig. 3.5: Proportional representation of survey respondents by living arrangements.
Details of Work
More than half of the respondents (57%) have had more than one job since starting university.
Figure 4.1 (n=653) features the full breakdown, showing that many students have experienced
numerous jobs.
Fig. 4.1: Proportional represention of how many jobs students have had during their time at university.

20
Students were also asked which industry sector they work in. The breakdown of this can be
seen in Figure 4.2. (n=653). More than half of the respondents indicated that they work either
in hospitality and events management, or retail and sales. However,several other sectors also
have a student workforce present within them, most notably accounting, banking and finance.
Fig. 4.2: Proportional representation of reported sectors of work.

21
Students were asked about their contracted hours, but also about their average working hours,
which are displayed together in Figure 4.3 (n=653). The results illustrate not only that students
tend to work more than their contracted hours, but also that a vast number are contracted for
no hours at all.
Fig. 4.3: Reported contract hours versus reported average working hours.
Figure 4.3 also shows that the vast majority of students work anywhere between 0 and 20
hours per week on average. These numbers explain the shape of the bar graphs in this report.
The higher working hour brackets have a smaller set of responses for each question simply
because there are fewer students within those brackets.
22
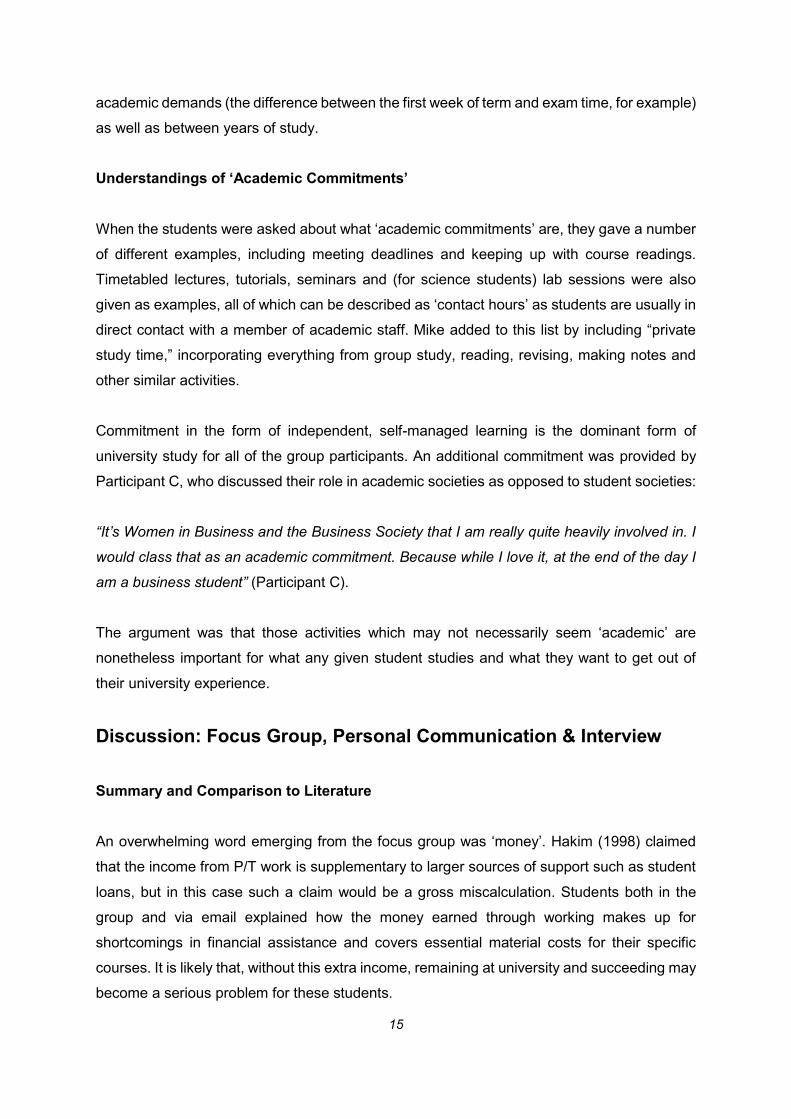
Working hours were broken down by gender. Figure 4.4 (n=653) shows thatfemale students
are slightly more likely to be working between 1-20 hours per week than male students, but
that the largest proportion of those working in excess of 30 hours are male.
Fig. 4.4: Average working hours by gender.
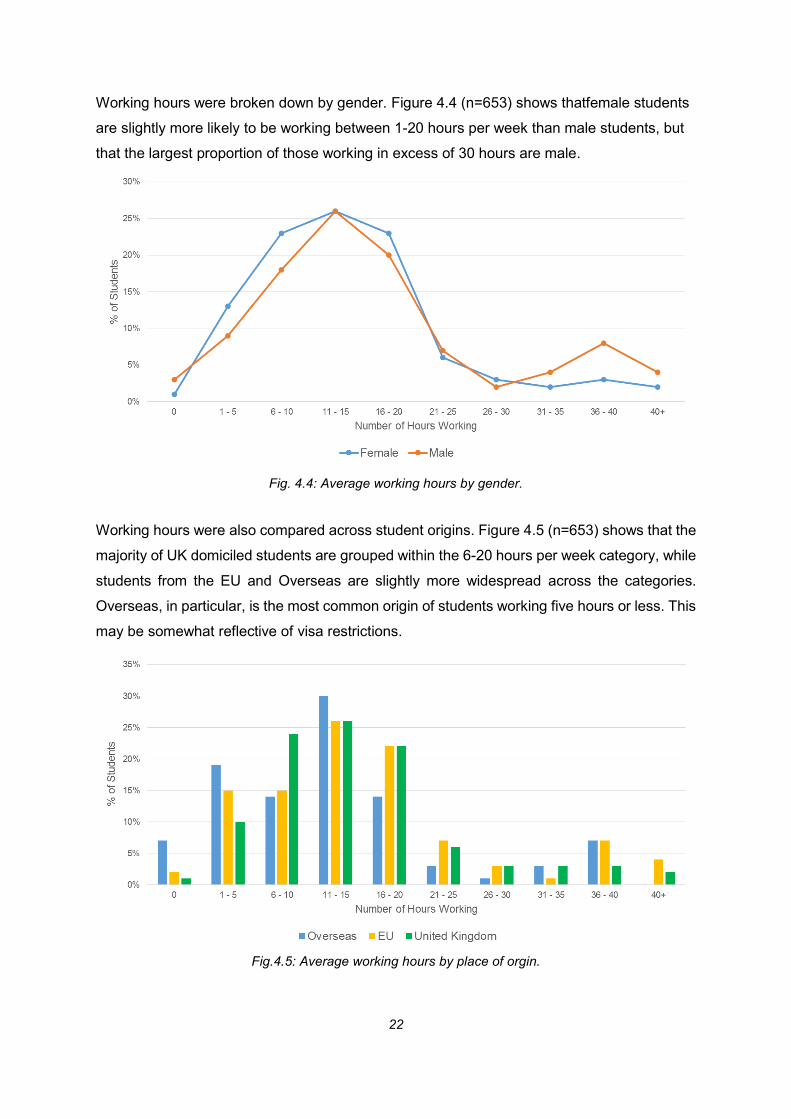
Working hours were also compared across student origins. Figure 4.5 (n=653) shows that the
majority of UK domiciled students are grouped within the 6-20 hours per week category, while
students from the EU and Overseas are slightly more widespread across the categories.
Overseas, in particular, is the most common origin of students working five hours or less. This
may be somewhat reflective of visa restrictions.
Fig.4.5: Average working hours by place of orgin.

23
Working hours was further broken down by year of study. Figure 4.6 (n=653) shows that 3rd
and final year students are the most likely to be working either just above the University of
Edinburgh’s working hour recommendation, or working what could be considered F/T hours.
Fig. 4.6: Average working hours by year of study
Finally, working hours were analysed in terms of college. Figure 4.7 (n=653) illustrates that
students studying within the College of Medicine and Veterinary Medicine are the most likely
to be working either the fewest hours or more than forty hours. Students working anywhere
between 6-15 hours are most likely to come from the College of Humanities and Social
Science, while students from the College of Science and Engineering are by far the most likely
to exceed the university’s current recommendation for working hours (15 hours per week).
Fig. 4.7: Average working hours by college of study.

24
The survey also showed that the largest proportion of students (35%) who fit within the 11-15
working hour bracket work solely at the weekend, compared to 25% who work at the weekend
and weekdays and 21% who work just during the week. Therefore, weekend workers are the
most likely to meet the university’s current recommendation.
It was also found that students working solely during the term are the most likely to work less
than 11-15 hours per week, while students who work during both the semester and vacation
will generally work more.
University and Work
It should be noted that from this point onwards, those who reported an average of zero working
hours a week were omitted from response sets to questions in which working hours are a
variable. This is because these students would seem to be working on an ad-hoc basis which
does not fit with the long-term impact of STE which this report concerns itself with.
It was hypothesised prior to the research that students with more contact hours at university
– that is, timetabled lectures, tutorials, seminars, lab time and so on – would work fewer hours.
To test this, Figure 5.1 (n=643) compares contact hours with average working hours.
Figure 5.1: Average working hours by students’ contact time at university.
This illustrates that working hours normally vary only by a few percentage points between
those with the most and the fewest contact hours. In fact, those with the most contact time are
proportionally more likely to work more hours than those with the least contact time.

25
As shown in Figure 5.2 (n=643), time spent on independent study is similar in this respect.
The unusual result, however, comes in the higher working hour bracket. When working
hours increases to above 36 per week, the proportion of those in that bracket who report
studying more than 40 hours per week rises sharply. This is contrary to what may be
expected and also goes against the other data presented in the graph. It is something which
will be touched on at a later point.
Fig. 5.2: Average working hours by reported independent study time.
26
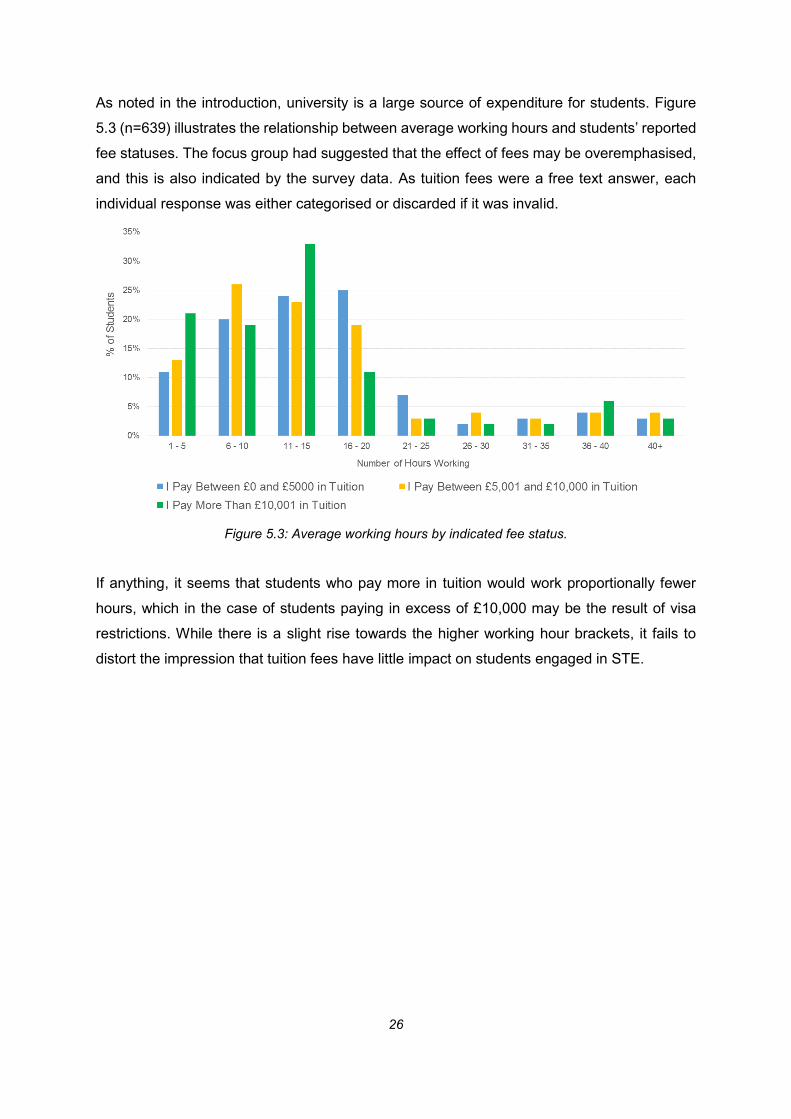
As noted in the introduction, university is a large source of expenditure for students. Figure
5.3 (n=639) illustrates the relationship between average working hours and students’ reported
fee statuses. The focus group had suggested that the effect of fees may be overemphasised,
and this is also indicated by the survey data. As tuition fees were a free text answer, each
individual response was either categorised or discarded if it was invalid.
Figure 5.3: Average working hours by indicated fee status.
If anything, it seems that students who pay more in tuition would work proportionally fewer
hours, which in the case of students paying in excess of £10,000 may be the result of visa
restrictions. While there is a slight rise towards the higher working hour brackets, it fails to
distort the impression that tuition fees have little impact on students engaged in STE.

27
More immediately connected to employment patterns is loan status. Students were firstly
asked simply if they had taken out a student loan or not. Figure 5.4 (n=643) illustrates that
students who have taken out a loan are actually slightly more likely to work more hours, with
the exceptions of working less than five hours or in excess of 31 hours. The rise in non-loan
students working in the higher hours brackets is potentially explained by a lack of alternative
sources of income, but not necessarily.
Figure 5.4: Average working hours by reported student loan status.

28
Those students who indicated that they did take out a student loan were then asked what
amount they receive. Figure 5.5 (n=421) measures these responses against working hours. It
shows that while there is some relationship between loan level and working hours up to 20
hours per week, the picture becomes less clear once this level is exceeded. It would appear
that students receiving a ‘moderate’ amount of loan are also the most likely to work a
‘moderate’ amount of hours.
Figure 5.5: Average working hours by student loan amounts.

29
Additional sources of income were also considered, such as support from bursaries, grants
or scholarships. Students were asked to indicate if they were a recipient of any such
additional financial support, and Figure 5.6 (n=643) shows this in relation to working hours.
The data indicates that students in reciept of additional support are the most likely to work
less than fifteen hours or more than 26 hours. These small gaps, however, are balanced by
the large gap seen across the 16-20 and 21-25 working hour cohorts. Furthermore, when
differences in the levels of additional support received were analysed, the impact on working
hours was found to be practically non-existent.
Figure 5.6: Average working hours by receiving of additional support.
30
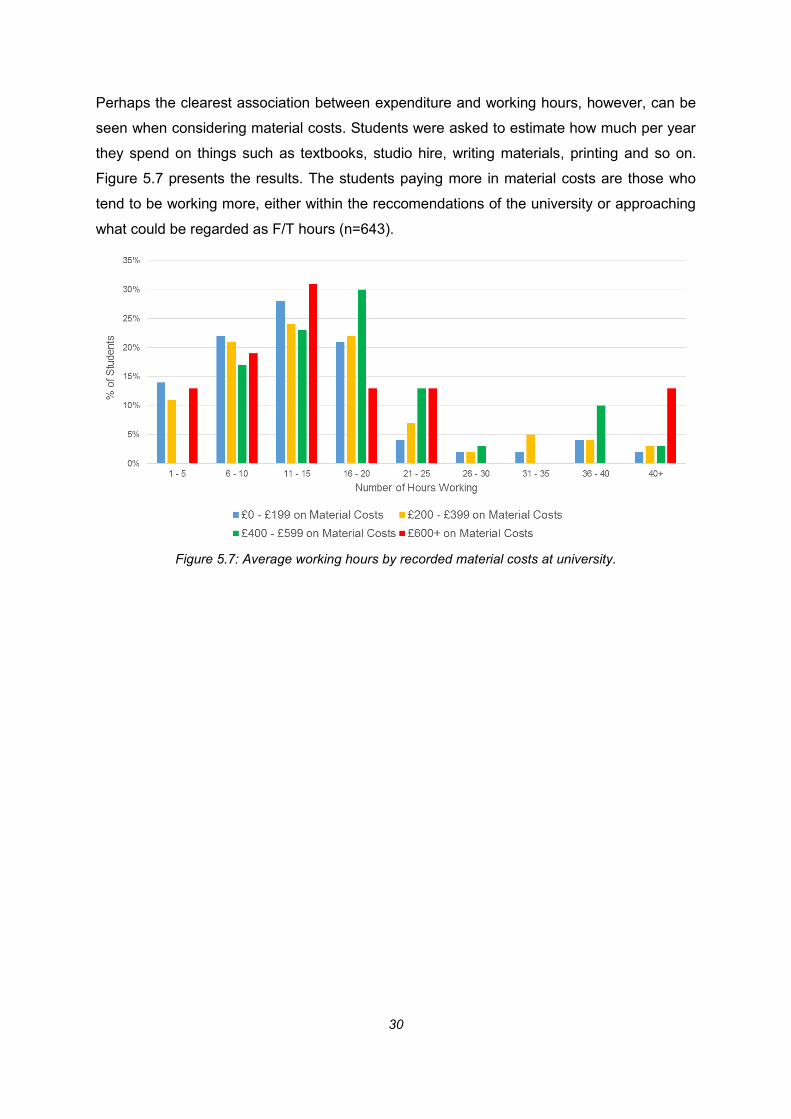
Perhaps the clearest association between expenditure and working hours, however, can be
seen when considering material costs. Students were asked to estimate how much per year
they spend on things such as textbooks, studio hire, writing materials, printing and so on.
Figure 5.7 presents the results. The students paying more in material costs are those who
tend to be working more, either within the reccomendations of the university or approaching
what could be regarded as F/T hours (n=643).
Figure 5.7: Average working hours by recorded material costs at university.

31
Student Life and Work
Non-academic undertakings were also considered, although in some cases ‘non-academic’
may be somewhat misleading. This is especially true of academic societies. Students were
asked to say whether they were part of an academic society. Figure 6.1 (n=643) illustrates
that while the ‘drop-off’ in working hours occurs sooner for students who do take part in this
co-curricular activity, the fall is more gradual. Besides this, membership in itself does not
appear to impact on working hours to a great extent.
Fig. 6.1: Average working hours by academic society membership.
Those students who were part of academic societies were then asked how many hours in the
week were taken up by these pursuits. Responses were easily categorised into those who put
less than five hours or more than five hours into these activities. Further analysis showed that
students spending more than five hours a week on an academic society will tend to work less
(the exception being those working in excess of 36 hours, who form the minority of students).
This suggests that deeper involvement in academic societies is a limitation on the number of
hours that a student can work, albeit perhaps not to the extent that some may suppose.

32
Extra-curricular (EC) activities were also an area of inquiry. Figure 6.2 (n=643) displays
average working hours as set against time spent on EC activities at university. While a general
trend is that students spending more time on one will report less time spent on the other, there
is still a substantial minority of students reported to have in-depth (or at least equal)
involvement in both EC activities and STE.
Fig 6.2: Average working hours by time spent on EC activities.
Students also accounted for any voluntary work they undertake. Students who undertook
voluntary work were not found to work considerably different hours to students who did not.
Time, however, was shown to make a difference. Figure 6.3 (n=202) indicates that those
students who undertake more voluntary work are slightly more likely to work more hours.
Fig. 6.3: Average working hours by time spent volunteering.

33
Carer status was also hypothesised as a variable in working hours. Figure 6.4 (n=643) shows
working hours for those who report having caring responsibilities versus those who do not.
After 15 hours is reached, students with caring responsibilities seem more likely to work more
hours, substantially so in the case of those working between 16-20 hours. Again, the number
of hours spent caring was taken into account. It was found that students with more than 20
hours of caring commitment per week are slightly more likely to work more hours. The exact
reasons behind this are not clear from this data.
Fig. 6.4: Average working hours by reported carer status.

34
Widening Participation (WP) status is further accounted for in this survey. Figure 6.5 (n=633)
details the working hours of those who are the first in their family to come to university versus
those who are not (of those who definitively answered yes or no). The overall trend is clear;
those students who are the first members of their family to attend university are more likely to
report working more hours, right up until 40+ hours is reached, and even then the difference
is only 1%.
Fig. 6.5 Average working hours by family history of higher education.

35
The same also appears to be true for those students who participated in a widening access
programme (such as LEAPS). Figure 6.6 (n=640) shows those students who replied either
yes or no when answering if they had participated in such programmes. It appears to be the
case that those students who came though such schemes will report working more hours than
those who did not. WP status and working hours are two things which are closely linked in this
set of data.
Figure 6.6: Average working hours by participation in widening access programmes.

36
Working Hours and Academic Commitments
‘Academic commitments’, as understood by the focus group, covers everything from classes
and contact time to deadlines and independent study. These factors are all accounted for in
the following set of results. Firstly, students were asked if they had ever missed a lecture or
other class in order to attend work. Figure 7.1 (n=643) presents the responses to this question,
again broken down by working hours. It shows that once 10 hours per week is exceeded,
students are more likely to report that they have missed a class to attend work. This swings
the other way after 31 hours, after which it is either more or equally likely that it has not
occurred.
Fig. 7.1: Average working hours by missing or not missing classes.

37
Those students who said that they had missed a class were then asked how many times this
had happened. Figure 7.2 (n=276) displays how students working more hours are those
missing the most classes. The number reporting that it has occurred five times or more rises
sharply after the 6-10 hour bracket and remains proportionally high for the rest of the graph.
Fig 7.2: Average working hours by frequency of missing classes to attend work.
38
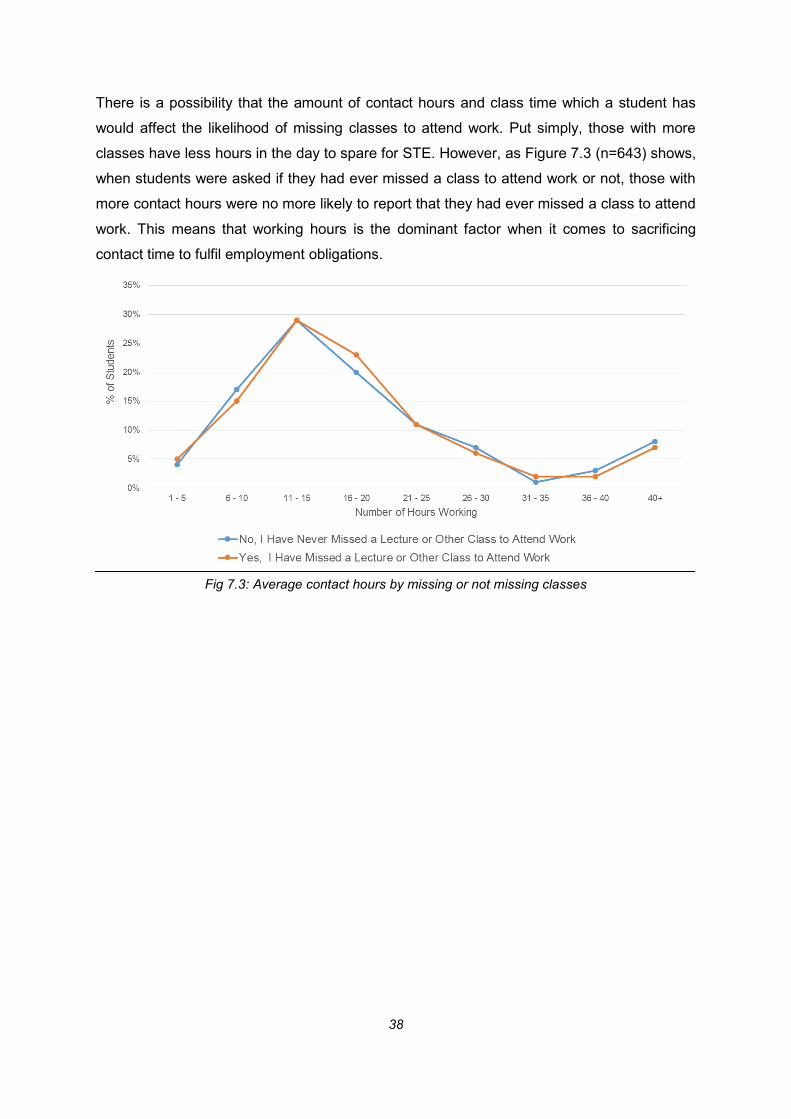
There is a possibility that the amount of contact hours and class time which a student has
would affect the likelihood of missing classes to attend work. Put simply, those with more
classes have less hours in the day to spare for STE. However, as Figure 7.3 (n=643) shows,
when students were asked if they had ever missed a class to attend work or not, those with
more contact hours were no more likely to report that they had ever missed a class to attend
work. This means that working hours is the dominant factor when it comes to sacrificing
contact time to fulfil employment obligations.
Fig 7.3: Average contact hours by missing or not missing classes

39
Students were also asked if they had ever missed a class by sleeping in as a result of tiredness
from work. Figure 7.4 (n=643) displays the results. After 15 hours per week students are far
more likely to say that they have missed a class after sleeping in, and unlike the majority of
the graphs sees no real recovery in the higher working hour brackets.
Fig. 7.4: Average working hours by sleeping in and missing classes or not.
Figure 7.5 (n=233) details the frequency of this for those students indicating that it has
happened to them. Again it appears that once 15 hours is exceeded, the likelihood of it
occurring up to and/or more than five times rises substantially (the exception being the number
of those working 36-40 hours who say it has only happened once).
Fig. 7.5: Average working hours by frequency of sleeping in and missing classes.

40
Again, contact hours was investigated as a mitigating factor. As Figure 7.6 (n=643) shows,
although contact time may be more of a factor here than for simply missing classes to attend
work, the effect remains negligible compared to average working hours.
Fig. 7.6: Average contact hours by sleeping in and missing classes or not.
Another question about academic commitments enquired as to whether working had ever
caused students to miss a deadline. Figure 7.7 (n=643) shows that exceeding 15 hours per
week sees students becoming significantly more likely to report missing deadlines, and this
remains the case until students say that they work in excess of 40 hours per week.
Fig. 7.7: Average working hours by missing a deadline due to work or not.

41
Figure 7.8 (n=80) displays the frequency of this occurring among those students indicating
that they had missed a deadline. Very few students reported it happening more than five times,
so they were grouped together with those students reporting that it had happened up to five
times. Nonetheless, the same pattern emerges; once 15 hours per week is exceeded, the
proportion of students saying that they have missed a deadline a couple of times or more
increases dramatically. This generally remains high for the following working hour brackets.
Fig. 7.8: Average working hours by frequency of missing deadlines due to work.

42
Rather than investigating contact hours as a variable for missing deadlines, independent study
time was instead measured. This made more sense as students do not (or are not meant to)
work and study independently during class time. Figure 7.9 (n=653) shows the result of this.
Those students who put less hours towards independent study are more likely to be saying
that they have missed a deadline, but the differences are small.
Fig. 7.9: Average independent study hours by missing a deadline due to work or not.
Supplementary questions about academic commitment included students from 3rd year and
above being asked if employment was harder to keep up during their Honours years. Figure
7.10 (n=308) shows that slightly more 3rd years believed that it wasn’t harder while a larger
proportion of final year students felt that it was.
Fig. 7.10: Responses from 3rd and final year students about working during Honours years.

43
All students were asked to what extent they agreed or disagreed with a variety of statements.
The first was ‘my work causes/caused me to fall behind with course readings.’ Figure 7.11
(n=643) shows the result. The largest concentration of those agreeing or strongly agreeing
appears around the 11-20 hours bracket, with students more likely to disagree or strongly
disagree if they work less than 10 hours or more than 30 hours.
Fig. 7.11: Average working hours by response to the statement ‘my work causes/caused me to fall
behind with course readings.’

44
Students were then asked to respond to the statement ‘my work causes/caused me to spend
less time studying.’ Figure 7.12 (n=643) shows a similar pattern to the previous graph in that
the largest proportions of those agreeing or strongly disagreeing are concentrated between
11-20 hours.
Figure 7.12: Average working hours by response to the statement ‘my work causes/caused me to
spend less time studying.’

45
Another statement was ‘I spend/spent less time using university facilities such as the library
as a result of being employed.’ Figure 7.13 (n=643) breaks down these responses, again
showing that students working between 11-20 hours per week are the most likely to agree or
strongly agree, while the strongest disagreers are found among students working less than 10
hours or more than 30 hours.
Fig. 7.13: Average working hours by response to the statement ‘I spend/spent less time using
university facilities such as the library as a result of being employed.’

46
Respondents then made their feelings known about the statement ‘I believe that work
causes/caused my grades to be lower than if I wasn’t employed.’ While Figure 7.14 (n=643)
shows mostly a similar pattern to previous graphs, the sizable proportional increase in
students disagreeing or strongly disagreeing after 30 hours per week is absent. Overall the
differences seen between working hour cohorts for this statement appear less pronounced,
although clear differences do still exist. A substantial proportion of students working just over
15 hours a week agree with this statement.
Fig. 7.14: Average working hours by response to the statement ‘I believe that work causes/caused my
grades to be lower than if I wasn’t employed.’

47
The final statement for students to consider was ‘working means/meant that I have less time
to reflect on my learning and meet with peers and staff.’ Figure 7.15 (n=643) shows that yet
again the same pattern emerges, with those students in the 11-20 bracket feeling the effect
most.
Fig. 7.15: Average working hours by response to the statement ‘working means/meant that I have
less time to reflect on my learning and meet with peers and staff.’

48
Reasons for Working
Towards the end of the survey, students were asked about some of the reasons why they
engage in STE. One reason which could be selected was if students worked to gain extra
income to pay for non-essential items. Figure 8.1 (n=643) displays the results. It shows that
students who do work to pay for non-essentials are more likely to be working the fewest hours,
suggesting that it is these students who place the greatest emphasis on these items.
Fig. 8.1: Average working hours by working to pay for non-essentials or not.

49
Conversley, Figure 8.2 (n=643) shows that students working in excess of 15 hours per week
are generally more likely to report working to pay for essential items, the exception being some
students in the higher working hour brackets.
Fig. 8.2: Average working hours by working to pay for essentials or not.
Another possible reason was to assist in paying rent. Figure 8.3 (n=643) features a very clear
pattern; students working in excess of 15 hours per week are more likely to report that they
work in order to meet rent payments. This is less so the case for students working the least
hours.
Fig. 8.3: Average working hours by working in order to pay rent or not.
50
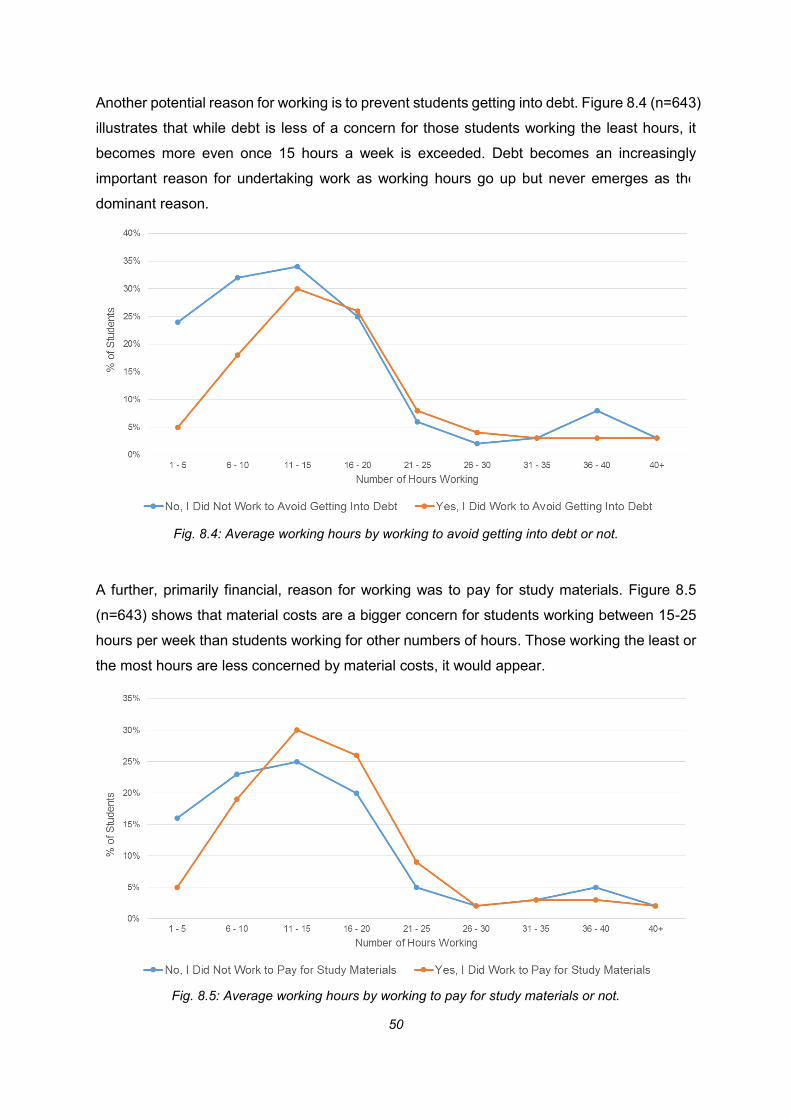
Another potential reason for working is to prevent students getting into debt. Figure 8.4 (n=643)
illustrates that while debt is less of a concern for those students working the least hours, it
becomes more even once 15 hours a week is exceeded. Debt becomes an increasingly
important reason for undertaking work as working hours go up but never emerges as the
dominant reason.
Fig. 8.4: Average working hours by working to avoid getting into debt or not.
A further, primarily financial, reason for working was to pay for study materials. Figure 8.5
(n=643) shows that material costs are a bigger concern for students working between 15-25
hours per week than students working for other numbers of hours. Those working the least or
the most hours are less concerned by material costs, it would appear.
Fig. 8.5: Average working hours by working to pay for study materials or not.

51
A number of other, non-financial reasons were available for selection, such as to gain work
experience or to meet new people. However, when analysed, these showed no significant
differences across working hours between those students who said yes or no to each of these
reasons. The biggest differences between students working certain numbers of hours occurs
when the variable in question is directly financial.
Closing Questions
The end of the survey saw some closing statements put to the students, which they rated
based on how much they agreed or disagreed with them. These questions investigated a little
further into each students’ own personal situation. The first statement was ‘I would not be able
to remain at university if I did not work during the semester.’ Figure 9.1 (n=643) displays that,
while far from a conclusive picture, the students most likely to agree that STE is essential to
their continued study are in the same cohorts which reported the biggest impact on their
academic commitments. Unlike academic commitments however, those students working the
most also seem slightly more likely to agree with the statement.
]Fig. 9.1: Average working hours by response to the statement ‘I would not be able to remain at
university if I did not work during the semester.’

52
Another statement put to students was ‘my tuition fees influence my decision to work.’ These
responses were measured against the amount students pay in fees, and the results are shown
in Figure 9.2 (n=643). Clearly, those students paying the least in fees see it as less of a
motivation behind working than those who pay more, while those paying the most are the most
likely to report that it affects their decision to work. This would contradict the findings of the
focus group, who reported that tuition fees did not factor into their decision to work. In the
survey a distinct pattern between fee status and employment does emerge.
Fig. 9.2: Tuition fee status and responses to the statement ‘my tuition fees influence my decision to
work.’

53
Students were then asked to respond to the statement ‘my student loan influences my decision
to work.’ Figure 9.3 (n=422) displays how those receiving more student loan are more inclined
to say that their student loan has no influence, although a substantial proportion say otherwise.
For students receiving the middle amount, indifference and strong disagreement were the
most common responses.
Fig. 9.3: Student loan amounts by response to the statement ‘my student loan influences my decision
to work.’
54
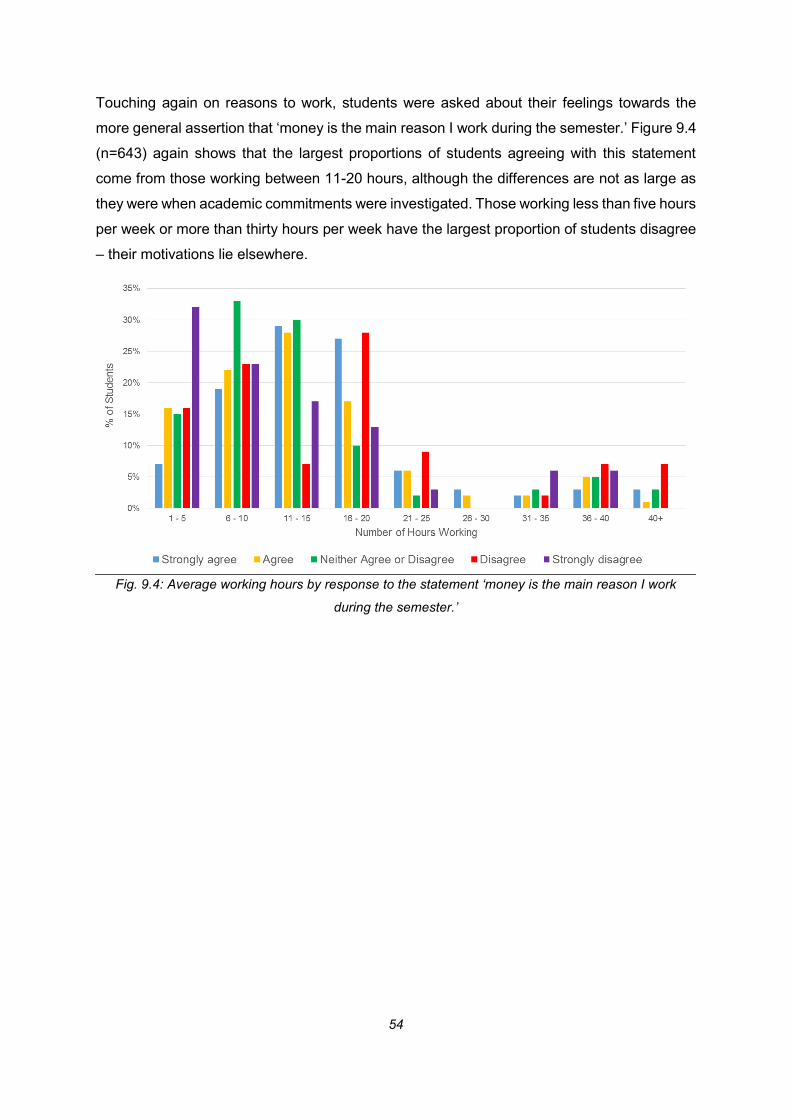
Touching again on reasons to work, students were asked about their feelings towards the
more general assertion that ‘money is the main reason I work during the semester.’ Figure 9.4
(n=643) again shows that the largest proportions of students agreeing with this statement
come from those working between 11-20 hours, although the differences are not as large as
they were when academic commitments were investigated. Those working less than five hours
per week or more than thirty hours per week have the largest proportion of students disagree
– their motivations lie elsewhere.
Fig. 9.4: Average working hours by response to the statement ‘money is the main reason I work
during the semester.’

55
A similar response pattern can be seen in students’ responses to the statement ‘working
decreases the amount of time I can spend on EC activities.’ Figure 9.5 (n=643) again shows
that those students working 11-20 hours are more likely to say that time spent on EC activities
is decreased. Those working the most hours (30+) are slightly more likely to disagree.
Fig. 9.5: Average working hours by response to the statement ‘working decreases the amount of time
I can spend on extra-curricular activities.’
Discussion: The Survey
Working Patterns and Differences
The vast majority of students (81%) work less than 20 hours per week. This means that a
significant minority of students work in excess of this and, as the data has shown, these
students may not necessarily report that their academic life is suffering because of it. Students
in their 3rd year are the most likely to work twenty hours per week, but other than this, working
hours do not vary substantially across the years in spite of the focus group and survey
respondents stating that maintaining employment in the final two years of university is harder.
This suggests that, although it is difficult, students will do it anyway.
In spite of differences in contact hours and independent study, the amount of time spent in
employment remains remarkably consistent. Hakim (1998) stated that there is a real worry of
work taking away from students’ studying, but from this data it is not apparent that academic
activities themselves negatively correlate with working hours. Time seems to be taken from
other areas outside university studies to make room for employment.

56
Callender (2008) emphasises how the largest rise in student employment rates came after the
introduction of tuition fees. Any direct association, however, cannot be established by this
research. The survey indicates that there is a direct relationship between fee status and being
in work, but this was contradicted by the focus group. What has been demonstrated is that
tuition fees are not the primary motivation for undertaking STE and the association which fee
status has with employment is not beyond scrutiny. The exact impact of tuition fees on working
hours has proved difficult to explain.
Student loan levels – a more immediate source of financial concern – has a clearer effect.
Those students who have taken out a loan tend to work slightly more hours than those who
don’t, although the impact of the amount of loan different students receive remains somewhat
unclear. Those students in reciept of a higher student loan are less inclined to say that it
influences their decision to work. What is clear, however, is that differences in loan entitlement
are more closely connected to student employment patterns than fee status. This is despite
much of the literature discussed in this report squarely placing emphasis on the latter.
Even more evidently connected to working hours is material costs, which again appears
somewhat neglected by the majority of literature into STE. Those students paying the most in
course materials work more than those who pay less, becoming the largest proportion of
students once working hours reach 11-15 per week. Significant numbers of those students
paying the most for materials work over 36 hours per week. This would imply that high course
costs are a factor driving students to work more hours.
Following Howieson et al (2012), the focus was not exclusively on academic work versus
employment. Other aspects of student life were also accounted for. Caring is one non-
academic factor which seems to be strongly associated with working hours, with carers more
likely to be working longer. Membership of academic societies on the other hand was not
found to be significantly related to average working hours, but the amount of time committed
to academic societies was a factor. The same could be said of volunteering; students stating
that they undertook voluntary work were not really more or less likely to work more hours than
students who do not volunteer, but differences among volunteering students were evident
depending on the number of hours committed to it. More broadly, extra-curricular activities
would seem to be what lose out as a result of employment. This is however a simple
generalisation, and a substantial minority of students commit many hours of their time to both.

57
Widening Participation was accounted for in a variety of ways, and the results of this proved
mixed. Students in recipt of grants, bursaries or scholarships tend to work slightly less or
slightly more than most, but the differences are not substantial. Among students receiving this
additional support, there is barely any difference in hours whatsoever regardless of the amount
that they receive. Substantial variations do occur, however, between students who are the first
member of their family to attend university and those who are not. The former group of
students are noticeably more likely to be in employment. Secondly, students who participated
in any widening access programmes are also more likely to work more hours. Howieson (2015)
notes the general perception that WP students work longer hours than their non-WP peers, a
perception which seems largely supported by this research.
As already stated, small but significant differences in working hours do exist across different
demographics of the student population. As the differences tend to be small, the wider
assertions made with reference to the impact of employment on academic commitments
should largely hold across these different demographics.
Academic Commitments
Three primary measurements were used to measure the impact of work on academic
commitments; missing classes to attend work, sleeping in and missing classes as a result of
work, and missing deadlines because of work. All three of these had definite cut-off point safter
which students were more likely to report that the abover situations would occur, and the
frequency of such occurances increased after the same points. Working 11-15 hours per week
saw students reporting that missing classes to attend work becoming more likely and more
frequent, almost irregardless of contact hours. The same is true for students who sleep in and
miss classes, the cut-off here being closer to the 16-20 hours bracket. This is the same working
hours bracket after which the likelihood and frequency of missing deadlines because of work
also increases. These three measurements alone would suggest a ‘critical threshold’ of
anywhere around the fifteen hour mark, fairly consistent with the findings of Callender (2008)
and Salamonson et al (2012) among others, as well as the University of Edinburgh’s own
recommendation. It is after this point that the impact on academic commitments becomes
decidedly negative.
But it is not as simple as this. For it is students in and around this suggested level who are
also the most likely to agree that employment has a negative impact on their studies. Factors
such as reading, studying, expected grades and peer reflection all appeared as more

58
significant problems for those students . Those students working the least report little impact
on their academic commitments, but perhaps surprisingly those students working the most
hours also report that working only has a small impact on their academic committments. It is
the middle group of students who, it seems, are affected the most by STE.
From the data alone there is no immediate clarity as to why this should be the case, especially
since these students operate within the window before factors such as missing deadlines or
missing classes take a turn for the worse. A potential answer may come from the focus group,
in which one participant who works between 36-40 hours per week said that the biggest skill
they have developed through STE is time management – and significantly, he feels that his
exam results would not have significantly improved had he not been working. Time
management was agreed by all group participants to be a positive effect of employment, and
it is a commonly reported benefit of STE more broadly (Manthei & Gilmore, 2005; Robotham,
2013), so this student will not be alone in his thinking.
This leads on to two possible suggestions: (1) those students working the fewest and the most
hours are simply better at managing their time, hence why the impact of STE on their studies
is relatively less, and (2) working fewer or more hours allows one to manage their time better,
either because it is a small factor in how a week is planned or because it provides a structure
around which a week can be planned. It should hopefully be clear that these two explanations
can occur simultaneously – maybe someone is better at managing their time because they
have either more flexibility or a rigid structure in place to help them.
By contrast, perhaps working a more medium number of hours per week does not provide
students the flexibility which would assist them in managing their time, nor does it provides a
permanent fixed structure which can form the foundations of weekly planning. Curtis & Lucas
(2001) found that more than one fifth of students dislike their working hours – which may be
because of difficulties in managing their time. This is a potential explanation as to why students
working these hours report struggling more, and why those students working the most hours
commonly report extensive involvement in academic and non-academic commitments. It
should be stressed however that this is a mere suggestion – time management itself was not
investigated in this research.
While not connected to academic commitments as such, it is interesting to note that the same
cohorts of students reporting a larger effect on their university studies are also the most likely
to report that work limits their participation in extra-curricular activities. If the suggestion about

59
the role of time management is an accurate one, this would suggest that the lack of structure
and planning has impacts which go beyond academic work, and affect the student experience
more generally in a negative way.
It should be a source of concern that students within this bracket of working hours are also the
most likely to report that they would not be able to remain at university without STE. This would
suggest that students within this group receive a lack of support with their financial situation
as well as time-management. This indicates that money is the main motivation for employment.
What this points to is not quite a ‘zero sum model.’ As Howieson et al (2012) found, some
students can commit many hours to both academic commitments and employment, seemingly
at the expense of extra-curricular activities and other undertakings. However, it is clear that
students who work do still report negative impacts on their university studies, and there are
definitive cut-off moments after which the likelihood of reporting that something is going wrong
increases. As already discussed, however, even students at or below this point report a variety
of problems resulting from STE.
Reasons for Working
The same approximate region of fifteen hours per week surfaces again when reasons for
working were investigated. It was found that this was the point after which students were more
likely to report not working for non-essentials and working for items which were essential.
Students going above fifteen hours per week were also more likely to agree that they work to
help pay their rent and to cover course related costs. Working more hours typically means a
higher income – it is therefore likely that students working longer hours are doing so to make
their time at university more financially feasible. More broadly, students largely agreed that
money was the main reason for working during the semester, again in particular those
students working between 11-20 hours per week.
This could be a reaction to the very high cost of living in Edinburgh. This was something
brought up by the focus group and by the EUSA Vice-President for Education. Furthermore,
the Guardian (2016) reports that the University of Edinburgh has a higher expenditure rating
per student than any other university ranked inside their top 50 with the exceptions of Oxford
and Cambridge. Students at this institution are not alone in having money worries - Endsleigh
(2015) reported on financial insecurity at a national level – but fears particular to the context
of this university are indicated by this data.

60
Other reasons for finding work, such as experience and networking saw no major variation in
hours between those saying they did find work for these reasons and those who did not,
certainly compared to financial motivations. While Hakim (1998) and Endsleigh (2015) both
suggest that non-financial motivations underly finding work in the first instance, it appears to
be money which most heavily affects the number of hours that working students commit to.
This would indicate that financial necessity is the main determinant of working more hours,
meaning in turn that financial necessity is more likely to be an underlying reason behind
variations in the impact on academic study. It is testimony to the tangible uncertainty
surrounding money and debt among students which was recorded by the NUS (2012)10. The
exact link between financial situations and university study is of course an area of research
which can be exhausted much further.
Research Limitations
Focus Group
The demographic make-up of the focus group is not totally representative, as it is (a)
dominated by female participants and (b) weighted in favour of students within the College of
Humanities and Social Sciences. As with all small-scale qualitative research, a representative
spread of opinions was not possible despite efforts to have as diverse a range of participants
as possible. The survey was far more successful in gauging wider opinion, albeit not in as
much detail.
Survey
This is one of many studies confined to a single university or institution (Callender, 2008;
Robotham, 2013) and therefore any application of the findings beyond the immediate setting
of this study would be difficult. However, to apply these findings to a wider context would be
to ignore the unique context in which this study was based. To extend the survey any wider
would have lost this insight into a particular HE institution.
It is also true that the response rate for the survey may have been higher if it was released
during term-time, as there would be more students around campus and more regularly using
university IT facilities. Had this survey reached a larger number of students it would be a more
representative picture of students. That being said, the response was still far beyond what had
been anticipated, resulting perhaps from intense promotion during the time that the survey
61
was live. Given that the survey was also online, and students did not need to be in Edinburgh
to fill it out, it is unclear exactly how much of a difference releasing the survey during term time
would have.
There is also a clear gender divide in survey responses, with a far greater proportion of women
responding than men. The University of Edinburgh (2017a) states that of just over 24,000 full-
time undergraduates, almost 15,000 are women, equating to just under 61%. This is noticeably
lower than the proportion of female students who completed the survey.This is perhaps not
too unexpected, as women have been found to be far more likely to respond to surveys and
questionnares than men (Smith, 2008). Nevertheless, the difference in response rates is
disappointing and therefore not a totally accurate reflection of the university population.
The largest College in the university is also underrepresented, albeit not by an incredibly
significant amount. The University of Edinburgh (2017a) also state that around 62% of
students study in the College of Humanities and Social Science, compared to 56% in this
survey. The variations are noticable, although not as immediately problematic as the
differences in gender.
The same is true of international status and origin. The University of Edinburgh (2017a) states
that a total of 16,229 undergraduate students come from the UK, equalling almost 67% of all
students at that level of study. This is only 5% points less than the proportion of UK domiciled
students who answered the survey. EU students make up 11% of all undergraduates,
compared to 18% in the survey, and overseas students form over 22% of undergraduates
while only making up 10% of survey respondents. Therefore, while the proportion of UK
students in the survey is fairly representative, the same cannot be said of EU and Overseas
domiciled students.
The indications used to gauge an impression of WP status in the survey is far from exhaustive,
not considering factors such as household income. The other topic left untouched was mature
students, for the reason that the university’s classification of what makes a student ‘mature’
could not be discerned through the analysis. Qualitative research of mature students and WP
students exclusively would compliment this research and test the findings of this report across
an additional student population.

62
Conclusion
Summary
This report investigated the maximum number of hours that F/T undergraduate students can
work during the semester without adversely impacting on their academic commitments.
Following extensive background research, a focus group was one of three methods used to
gather qualitative data. Following this, the survey was designed based on the findings of the
focus group.
One of the research aims for this study was to generate guidance which will help students find
a work-study balance during their time at university. As Richardson (2011) noted, much advice
on the issue has been frustratingly vague, more suited for students who can choose to work
than those who feel like they need to. Approximately fifteen hours per week seems like a good
level for all students in STE whether it resulted from an active decision on their part or not.
It is of course important to note that all students are different – how many hours you want to
work and feel like you can work is obviously subject to a number of variables. The important
feature of this developed guidance, however, is that it is clear. It should be a useful foundation
for any student who undertakes STE and is worried about the impact on their academic
commitments, regardless of whether they follow it to the letter.
It may not seem like a revelation that the maximum number of hours which students should
work falls around this area, but what is of real significance is that students working this many
hours are still the most likely to feel like their studies are suffering. Students perceive this
negative impact in terms of study time, library time and grade expectations among other things.
The suggested reason behind this may be differences in their ability/capacity to manage time
effectively, although as already noted this should be investigated further. It also seems that
the primary reason behind variations in working hours is money, which is a much bigger factor
here than when deciding to find work in the first place.
Most importantly, this is coming from the perspective of those most affected by the findings of
this research: the students. The focus group was deliberately designed to inform the survey
in such a way that the researcher would be making as few assumptions as possible. The data
from the focus group itself also fits with some of the broader patterns found in the survey.

63
Recomendations
Students clearly spend many hours on a variety of different tasks, so any STE advice based
around how to manage time effectively can only be of benefit. More useful help for students
about how to manage their time when employment can be such a large part of their lives
seems key to mitigating the effect STE has on university study.
What also became clear is that money is the largest variable affecting differences in working
hours between some students. London, a city with higher than average living costs, already
has context-tailored support in place for students – all of whom will be paying tuition fees in
order to attend university. While Edinburgh does not have as high a cost of living as the capital,
it is still comparable with many other cities. Support adapted to the unique context of the
Scottish capital, in a similar way seen for London, is absent. The introduction of such support
arrangements should be something to take under serious consideration.
The cost of living is a reason behind feeling compelled to work, otherwise funding time at
university becomes incredibly difficult. Financial insecurity emerged as a large theme from the
focus group and this was backed up by the survey. Having additional support in place will
theoretically decrease the influence of money on STE, and therefore will theoretically decrease
the proportions of students reporting deep concerns surrounding their academic studies.
Furthermore, strategies should be developed to make students more aware of the support
mechanisms which are already in place, which will also make it clearer to see if anything more
should be done.
This report is context specific to one university in one city, and also where unique funding
arrangements are in place. Similar projects should now take place in other universities across
the country and perhaps even globally, to develop clear, unambiguous guidance to all students
within a specific setting. This research at the University of Edinburgh can be a starting point
from which more work can – and should – follow.
Further Investigation
As already mentioned, this survey focuses on a particular group of students, namely F/T
undergraduates. While a more immediate response would be a similar study of postgraduate
students, a more interesting perspective may come from looking at those who study P/T.
Coughlan (2017) claims that the sharp drop in the number of people studying P/T at university
64
(150,000 now compared to 340,000 in 2007/2008) is related to the escalating costs of studying.
A focus on P/T students undertaking STE would likely uncover new perspectives which are
perhaps not covered when focusing solely on F/T undergraduates.
Time management was identified as the key attribute which may explain the detrimental
impact of employment on academic commitments. This suggestion now needs to be tested
rigorously through more context-specific investigations and qualitative research to see if this
is something expressed by students. This report has strived to be as representative of the
student perspective as possible, a methodological belief which needs to be continued.
This study does not go into detail about the strategies adopted by students to deal with the
work-study balance. This would be a fascinating topic for further research to build on this
report.11 The latter, in particular, could be used to test the suggestion that time management
is the key attribute which affects the impact of STE on university studies.
It has already been noted that more research directly linking financial insecurity and academic
commitments should be carried out. This could be stretched to cover other factors as well as
students who are employed, looking at health and stress in a similar way to Carney et al (2005).
If a link between academic work (as opposed to strictly results or grades) and money can be
found, then employment can be placed among a group of factors contributing more widely to
the overall student experience of university.
Adding to that point, this paper has been primarily concerned with the academic aspect of
students’ lives. While other non-academic undertakings have been mentioned, they have not
been the focus. If gauging student experience is the goal, then the effect of STE on other
aspects of student life such as extra-curricular activities should be investigated just as in-
depthly as studying. While it makes sense in many ways for the focus to be on academia,
looking at other areas will start to build a more complete picture of what it means to be a
student in the modern age.
It has become clear that the association between tuition fees and STE which Mercer et al
(2016), among others, hold to be true is not certain. The contradictory data from the focus
group and survey would suggest that while fee status is related to student employment, its
effect may not be as simple or linear as has been suggested. A more rigorous study is needed
to determine the exact impact fees have on rates of STE, especially compared to the effect of
student loans.

65
Finally, this survey also tried to represent the situations of students with caring responsibilities.
However, although the data is still presented and is still insightful, only 14 students reported
having such responsibilities. More in depth investigations of these students could uncover
more unique perspectives of STE, and will also help to keep recognising that not all student
experiences are identical.
Closing Thoughts
This report highlights a stark truth – being at university, and doing well at university, is not only
difficult but a source of considerable worry and uncertainty. This may be over money or
studying, but either way detracts from the student experience. This report has attempted to
develop guidance which can be used by students as the baseline from which they can make
their own decisions. Crucially though, this decision making process is not made by them and
them alone. Universities can and should assist in this process to make employment during
studying as beneficial as possible. There are many positives of STE which are discussed in
this report, and the increasing recognition of its value by HE institutions should be applauded.
The next step is to now use these findings to directly help students manage their time at
university and help them to prepare for life after graduation.
Acknowledgements
The author would like to thank the University of Edinburgh Careers Service – in particular
Eilidh Steele, Ruth Donnelly and Mary MacLeod for their feedback and support throughout
this research. Thanks also to ASET for funding the research and expressing a continued
interest in its outcome. Most importantly, the utmost gratitude is expressed to every single
student and individual who participated in this research in any way, shape or form. Your
assistance is greatly appreciated.
Notes
1. The majority of school leavers are classed as ‘young’ by SAAS. Students are considered to be
‘independent’ if they are over 25, have no living parents or legal guardian, do not know where their
parents live, are married, in a civil partnership, living with a partner or have a child under 18 who
normally lives with them.
2. In her interviews with undergraduate students at the University of Brighton, Watts (2002) found that
none of her interviewees said that their P/T job was definitely related to their degree. Five said that
it was not related whatsoever.

66
3. What is not being suggested is that students in fact do not refer to grades or other markers in their
own moments of self-reflection and evaluation. Rather, it is simply being noted that the perspectives
from which academic study has been approached have not incorporated the opinions and
understandings of students, which may (and probably will) see some cross over with these
statistical measures of academic performance.
4. The data for recommended hours as presented in Figure 2.1 comes from the following sources:
Edinburgh – University of Edinburgh (2016a). Glasgow – University of Glasgow Careers Service
(2017) Phone call, 7th June. Durham – Durham University (2016). University College London – UCL
(2017). Birmingham – University of Birmingham (2017). Bristol – University of Bristol (2017).
Cambridge – University of Cambridge (2017). Cardiff – Cardiff University (2017). Exeter – University
of Exeter Career Team (2017) Phone call, 7th June. York – University of York Careers Service (2017)
Phone call, 7th June. King’s College London – KCL (2017). Leeds – The University of Leeds Career
Centre (2017) Phone call, 7th June. Liverpool – University of Liverpool (2017). London School of
Economics and Political Science – LSE (2016). Manchester – University of Manchester Careers
Service (2017) Phone call, 7th June. Newcastle – Newcastle University Careers Service (2017)
Phone call, 7th June. Nottingham – University of Nottingham (2017). Oxford – Preskey (2014).
Sheffield – University of Sheffield (2017). Queen’s University Belfast Careers Service – QUB (2017)
Phone call, 7th June. Imperial College London (2017) E-mail, 7th June. Warwick – Unitemps Head
Office: University of Warwick (2017) Phone call, 8th June.
5. Queen Margaret University is officially outside the city limits, lying just outside nearby
Musselborough (Queen Margaret University, 2016) but is still classified as an Edinburgh institution.
6. Darmody & Smyth (2008) already identified available financial support as a factor which may disrupt
a simple correlation between sheer financial burden and rising STE rates, also suggesting other
variables such as trends in the wider economy and differing contact hours between courses
programmes.
7. The UK Government (2017b) state online that the maximum maintenance loan for students living
in London and away from home will be £11,002 for 2017-2018, while the maximum for students
living away from home in any other part of the country will be up to £8,430.
8. However, Salamonson et al (2012) found that more nursing students worked in their third year than
their first, with a suggested reason being that students were more experienced in achieving a
balance between work and study. This would be despite a presumably more intense workload.
9. It is wiser, however, to use the term ‘co-curricular’ rather than ‘academic’ in order to account for
how academic societies and other activities may be valued differently by different students. In other
words, another society member studying the same degree may not share the view of Participant C
that attendance is in fact an academic commitment, but both would likely agree that it is strongly
related to their course of study.
10. It is worth noting too that this research for the NUS was conducted before the effect of higher tuition
fees had been felt. Tuition fees have been found to make less difference than most previous
research has indicated, it is plausible to suggest that this has increased feelings of financial
insecurity for all students, whether they are in employment or not.

67
11. An existing example of researching the strategies used by students to find a balance is the research
conducted by Munro (2011), who found that her sample of Australian students emphasised the
positive attributes which were developed as a result of STE, such as people skills.
Bibliography
Barke, M., Braidford, P. Houston, M., Hunt, A., Lincoln, I., Morphet, C., Stone, I. & Walker, A.
(2000) Students in the Labour Market: Nature, Extent and Implications of Term-Time Employment
Among University of Northumbria Undergraduates [online]. Newcastle: University of Northumbria.
Available at: http://dera.ioe.ac.uk/4464/1/RR215.pdf [Accessed 15/06/17].
Callender, C. (2008) ‘The Impact of Term-Time Employment on Higher Education Students’
Academic Attainment and Achievement.’ Journal of Education Policy, 23 (4), pp.359-377.
Cardiff University (2017) Working During Your Studies [online]. Available at:
https://www.cardiff.ac.uk/new-students/student-life/working-alongside-your-studies [Accessed
14/06/17].
Carney, C., McNeish, S. & McColl, J. (2005) ‘The Impact of Part-Time Employment on Students’
Health and Academic Performance: A Scottish Perspective.’ Journal of Further and Higher
Education, 29 (4), pp.307-319.
Coughlan, S. (2017) 10 Charts That Show the Effect of Tuition Fees [online]. BBC News.
Available at: http://www.bbc.co.uk/news/education-40511184 [Accessed 10/07/17].
Curtis, S. (2003) ‘The Response of Academics to Students’ Term-Time Working.’ Management
Research News, 26 (10/11), pp.70-77.
Curtis, S. & Lucas, R. (2001) ‘A Coincidence of Needs? Employers and Full-Time Students.’
Employee Relations, 23 (1), pp.38-54.
Curtis, S. & Shani, N. (2002) ‘The Effect of Taking Paid Employment During Term-Time on
Students’ Academic Studies.’ Journal of Further and Higher Education, 26 (2), pp.129-138.
Darmody, M & Smyth, E. (2008) ‘Full-Time Students? Term-Time Employment
Among Higher Education Students in Ireland.’ Journal of Education and Work, 21 (4), pp. 349-
362.
Durham University (2016) Combining Work and Study [online]. Available at:
https://www.dur.ac.uk/graduate.school/finance/employment/study/ [Accessed 14/06/17].
Endsleigh (2015) 77% of Students Now Work to Fund Studies [online]. Available at:
https://www.endsleigh.co.uk/press-releases/10-august-2015/ [Accessed 12/06/17].
Glasgow Caledonian University (2017) The Employer’s Perspective [online]. Available at:
http://www.gcu.ac.uk/library/smile/beingastudent/placement/theemployersperspective/ [Accessed
12/06/17].
The Glossary of Education Reform (2013) Co-Curricular [online]. Available at:
http://edglossary.org/co-curricular/ [Accessed 23/06/17].

68
Grant, A. (2016) ‘Population Boom Sees Edinburgh set to Overtake Glasgow.’ Edinburgh Evening
News [online]. Available at: http://www.edinburghnews.scotsman.com/our-
region/edinburgh/population-boom-sees-edinburgh-set-to-overtake-glasgow-1-4199972
[Accessed 16/06/17].
Gray, J. (2017) ‘University Tuition Fees To Increase Year On Year Until 2020 As Government
Passes New Legislation.’ Huffington Post [online]. Available at:
http://www.huffingtonpost.co.uk/entry/university-tuition-fees-increase-2020-government-new-
legislation_uk_5902f9ebe4b0bb2d086c850c [Accessed 26/06/17].
The Guardian (2016) Guardian University Guide 2017 [Google Sheets Spreadsheet]. Available at:
https://docs.google.com/spreadsheets/d/1qy-
n4Hftekk3weuwRwBe8zcLgpBOPzABDugrjiXIysQ/edit [Accessed 16/06/17].
Hakim, C. (1998) Social Change and innovation in the Labour Market. Oxford: Oxford University
Press.
High Fliers Research (2016) The Graduate Market in 2016 [online]. London: High Fliers Research
Ltd. Available at: https://www.highfliers.co.uk/download/2016/graduate_market/GMReport16.pdf
[Accessed 12/06/17].
High Fliers Research (2017) University Research: University of Edinburgh. London: High Fliers
Research Ltd.
Hovdhaugen, E. (2015) ‘Working While Studying: The Impact of Term-Time Employment on
Dropout Rates.’ Journal of Education and Work, 28 (6), pp.631-651.
Howieson, C. (2015) Widening Access: Next Steps [online]. Edinburgh: Centre for Educational
Sociology, University of Edinburgh. Available at:
http://www.ces.ed.ac.uk/pdfs_new/widening_access_next_steps.pdf [Accessed 19/06/17].
Howieson, C., McKechnie, J., Hobbs, S. & Semple, S. (2012) ‘New perspectives on School
Students’ Part-Time Work.’ Sociology, 46 (2), pp.322-338.
KCL (2017) Work/Study Balance [online]. Available at:
http://www.kcl.ac.uk/campuslife/services/student-advice-support/how/employment/balance.aspx
[Accessed 14/06/17].
LSE (2016) Part-Time Work [online]. Available at:
http://www.lse.ac.uk/intranet/CareersAndVacancies/careersService/Internships/Part-
timeWork.aspx [Accessed 14/06/17].
Manthei, R.J. & Gilmore, A. (2005) ‘The Effect of Paid Employment on university Students’ Lives.’
Education & Training, 47 (3), pp.200-215.
Marketing Edinburgh (2017) Edinburgh Universities [online]. Available at:
http://edinburgh.org/study/edinburgh-universities/ [Accessed 16/06/17].
Mercer, J., Clay, J. & Etheridge, L. (2016) ‘Experiencing Term-Time Employment as a Non-
Traditional Aged University Student: a Welsh Study.’ Research in Post-
Compulsory Education, 21 (3), pp.181-195.

69
Munro, L. (2011) ‘“It’s a Lot of Hard Work”: The Experience of Student Workers in University
Term-Time Employment.’ Australian Bulletin of Labour, 37 (1), pp.33-50.
NUS (2012) The Pound in Your Pocket: Survey Results [online]. London: National Union of
Students. Available at: https://nusdigital.s3-eu-west-
1.amazonaws.com/document/documents/16166/dc829663b30605b9e5811b2b415719b3/2012_N
US_PIYP_Interim_Survey_Results.pdf?AWSAccessKeyId=AKIAJKEA56ZWKFU6MHNQ&Expires
=1500988923&Signature=5RLXCx%2FnKVaUeU%2B%2FIZ6KcasyG6w%3D [Accessed
25/07/17].
Queen Margaret University (2016) How to Get Here [online]. Available at:
http://www.qmu.ac.uk/the_university/access.htm [Accessed 16/06/17].
Richardson, J.J. (2011) Term-time Employment and Tertiary Students‘ Academic Success. MSc:
University of Canterbury.
Robotham, D. (2013) ‘Students’ Perspectives on Term-Time Employment: an Exploratory
Qualitative Study.’ Journal of Further and Higher Education, 37 (3), pp.431-442.
Salamonson, Y., Everett, B., Koch, J., Andrew, S. & Davidson, P.M. (2012) ‘The Impact of Term-
Time Paid Work on Academic Performance in Nursing Students: a Longitudinal Study.’
International Journal of Nursing Studies, 49 (5), pp.579-585.
SAAS (2017) Guide to Undergraduate Funding 2017-2018 [PDF]. SAAS: Edinburgh. Available at:
https://www.saas.gov.uk/_forms/sas4.pdf [Accessed 12/06/17].
Smith, W.G. (2008) Does Gender Influence Online Survey Participation?: A Record-linkage
Analysis of University Faculty Online Survey Response Behavior. PhD: San José State
University.
UCL (2017) Part Time Work [online]. Available at: https://www.ucl.ac.uk/current-
students/money/bursaries/financial-advice-and-Support/Parttimework [Accessed 14/06/17].
University of Birmingham (2017) Part-Time Work [online]. Available at:
http://www.birmingham.ac.uk/undergraduate/support/moneyadvice/work.aspx [Accessed
14/06/17].
University of Bristol (2017) Working Part-Time [online]. Available at: http://www.bristol.ac.uk/fees-
funding/advice/part-time-working/ [Accessed 14/06/17].
University of Cambridge (2017) Working and Studying [online]. Available at:
https://www.internationalstudents.cam.ac.uk/studying/working-and-studying [Accessed 14/06/17].
University of Edinburgh (2015) Who We Support [online]. Available at:
http://www.ed.ac.uk/student-recruitment/widening-participation/who-we-support [Accessed
22/06/17].
University of Edinburgh (2016a) Combining Work and Study [online]. Available at:
http://www.ed.ac.uk/careers/looking-for-work/part-time-vacation/combining-work-study [Accessed
14/06/17].

70
University of Edinburgh (2016b) Why is Employability Important – to Students? [online]. Available
at: http://www.ed.ac.uk/employability/staff-information/what-why-employability-important/why-
students [Accessed 12/06/17].
University of Edinburgh (2017b) Credits, grading and Transcripts [online]. Available at:
http://www.ed.ac.uk/global/study-abroad/courses-credits/credits-grading-transcripts [Accessed
12/06/17].
University of Edinburgh (2017a) The University of Edinburgh Factsheet 2016/2017 Student
Figures [PDF]. Edinburgh: The University of Edinburgh. Available at:
http://www.docs.sasg.ed.ac.uk/gasp/factsheet/StudentFactsheet310117.pdf [Accessed 12/06/17].
University of Liverpool (2017) Working During Your Studies [online]. Available at:
https://www.liverpool.ac.uk/studentsupport/international/livingandworking/workingduringyourstudie
s/ [Accessed 14/06/17].
University of Nottingham (2017) part-Time and Vacation Work [online]. Available at:
http://www.nottingham.ac.uk/careers/students/work-experience/part-timework.aspx [Accessed
14/06/17].
University of Sheffield (2017) Part-Time Work [online]. Available at:
https://www.sheffield.ac.uk/international/enquiry/money/parttime [Accessed 14/06/17].
UK Government (2017a) National Minimum Wage and National Living Wage Rates [online].
Available at: https://www.gov.uk/national-minimum-wage-rates [Accessed 26/07/17].
UK Government (2017b) Student Finance: New Full-Time Students [online]. Available at:
https://www.gov.uk/student-finance/new-fulltime-students [Accessed 22/06/17].
Watts, C. (2002) ‘The Effects of Term-Time Employment on Academic Performance.’ Education &
Training, 44 (2), pp.67-75.

71
Appendix 1 – Sample Consent Form
Focus Group Consent Form
Date of Group:
Time:
Place:
You have been asked to participate in a focus group run by the University of
Edinburgh’s Careers Service. The purpose of the group is to discuss the experiences
of undergraduate students who work part-time alongside full time study. This
information will be used to investigate the maximum number of hours that a student
can work part-time without adversely impacting their academic commitments.
You can chose whether or not to give your consent to take part in the focus group.
You may also withdraw from the group at any time by informing the group moderator.
Anything you have said will not be used in the research, and no explanation for your
withdrawal is needed.
There are no right or wrong answers to the questions raised within the group, and
the moderator will encourage people with potentially different experiences or
opinions to speak up. We want to get as broad a range of opinions as possible. All
information disclosed during the focus group is strictly confidential, and will not be
used for purposes other than the report. Your anonymity is protected.
If you have any questions at any point, please do not hesitate to ask the group
moderator.
I understand this information and agree to participate in full under the conditions
explained above.
Signed:
Print Name:
Date:

72
Appendix 2 – Sample Data Slip
Student Employment Focus Group Name: Date: Time: Place:
What is your typical shift pattern? □ Day shifts □ Evening shifts □ Night shifts □ It varies
Which days do you mostly work? □ Weekdays □ Weekends □ Both
How much class time do you have timetabled? □ 0-4 hours □ 4-8 hours □ 8-12 hours □ 12+ hours
Which industry sector do you work in? □ Private sector □ Public sector □ Voluntary sector
How many organisations do you work for? □ 1 □ 2 □ 3 □ 4+
How old are you?

73
Appendix 3: The Online Survey
Page 1
Welcome to the Survey
All information disclosed in this survey will be treated with the strictest confidence. It will not be passed onto
third parties and will not be used for any other purposes asides this research.
Please answer with reference to the year which you have just completed (for example, if you have finished 2nd
year and are going into 3rd year after summer, answer the questions based off your situation during 2nd year).
Before We Begin
Please tick this box to confirm that you are a full-time undergraduate student at the University of Edinburgh
who currently has a paid (not voluntary) job during term time or has at some point during their degree. □
How many paid jobs have you had since you started university (including your current job, if applicable)?
1 □
2 □
3 □
4 □
5+ □
Page 2
About Your Work
These questions should be answered with regards to your current term-time job, or your most recent term-time
job if you no longer work.
Which sector best fits your job? [drop-down list]
Accountancy, Banking and Finance □
Business, Consulting and Management □
Charity and Voluntary Work □
Creative Arts and Design □
Energy and Utilities □
Engineering and Manufacturing □
Environment and Agriculture □
Healthcare □
Hospitality and Events Management □
IT □
Law □
Law Enforcement and Security □
Leisure, Sports and Tourism □

74
Marketing, Advertising and PR □
Journalism, Media and Internet □
Property and Construction □
Public Services and Administration □
Recruitment and HR □
Retail and Sales □
Science and Pharmaceuticals □
Social Care □
Teacher Training, Education and Tutoring □
Transport and Logistics □
Other □
How many organisations or individuals do/did you work for during your job?
1 □
2 □
3 □
4+ □
What are/were your contracted hours?
0 □
1 – 5 □
6 – 10 □
11 – 15 □
16 – 20 □
21 – 25 □
26 – 30 □
30 – 34 □
35 – 39 □
40+ □

75
How many hours do/would you typically work in a week?
0 □
1 - 5 □
6 – 10 □
11 – 15 □
16 – 20 □
21 – 25 □
26 – 30 □
31 – 35 □
36 – 40 □
40+ □
Do/did you typically work weekdays or weekends?
Weekdays □
Weekends □
Both □
Do/Did you work only during term time or during vacation as well?
Just term time □
Term time and vacation □
What is/was your typical shift pattern?
Day shifts □
Evening shifts □
Night shifts □
It varies □
Is/Was your term-time job related to your degree or what you want to do after leaving university?
Related □
Unrelated □
I Don't Know □
Page 3
About Your Studies
How many contact/timetabled hours do you normally have at university during the semester? (lectures, tutorials,
seminars, lab sessions and so on)
0 □
1 – 5 □
6 – 10 □

76
11 – 15 □
16 – 20 □
21 – 25 □
26 – 30 □
31 – 35 □
36 – 40 □
40+ □
How many hours a week do you spend in any of the university libraries during term time approximately?
0 □
1 – 10 □
11 – 20 □
21 – 30 □
30 – 39 □
40+ □
How many hours a week do you spend on independent learning approximately? (private study, reading,
independent lab time etc.)
1 – 10 □
11 – 20 □
21 – 30 □
31 – 40 □
41 – 50 □
50+ □
How much do you pay in tuition fees per year?
Have you taken out a student loan?
Yes □
No □
Don't Know □

77
How much student loan do you receive per year (not including grants or bursaries)?
£0 - £999 □
£1000 - £1999 □
£2000 - £2999 □
£3000 - £3999 □
£4000 - £4999 □
£5000 - £5999 □
£6000 - £6999 □
£7000+ □
Do you receive any grants, bursaries or scholarships?
Yes □
No □
Unsure □
How much were you awarded for the academic year 2016/2017?.
£1 - £999 □
£1000 - £1999 □
£2000 - £2999 □
£3000 - £3999 □
£4000 - £4999 □
£5000 - £5999 □
£6000+ □
Please name the bursaries and/or scholarships you received.
How much do you approximately spend on study and material costs? (such as books, studio costs and so on)
£0 - £99 □
£100 - £199 □
£200 - £299 □
£300 - £399 □
£400 - £499 □
£500 - £599 □
£600+ □

78
Page 4
About Your Student Life
How many hours approximately do you spend on extra-curricular activities at university? (not including
academic societies)
0 □
1 – 5 □
6 – 10 □
11 – 15 □
16 – 20 □
20 – 24 □
25+ □
Are you a member of any academic societies at the university?
Yes □
No □
How many hours in the week approximately is taken up by academic societies? [question appears only if
participant answers yes to previous question]
1 – 5 □
6 – 10 □
11 – 15 □
16 – 20 □
21 – 25 □
26 – 30 □
31 – 34 □
35+ □
Do you have caring responsibilities? (parental, young carer and so on)
Yes □
No □
Prefer not to say □
How many hours in the week approximately is taken up by caring? [question appears only if participant answers
yes to previous question]
1 – 5 □
6 – 10 □
11 – 15 □
16 – 20 □
21 – 25 □

79
26 – 30 □
31 – 34 □
35+ □
Do you undertake any voluntary work as well as paid employment?
Yes □
No □
How many hours in the week approximately does voluntary work take up? [question appears only if participant
answers yes to previous question]
1 – 5 □
6 – 10 □
11 – 15 □
16 – 20 □
21 – 25 □
26 – 30 □
30 – 34 □
35+ □
Are you the first or only person in your family to attend university?
Yes □
No □
Unsure □
Did you take part in any widening access programmes? (LEAPS, Focus West, college course access and so on)
Yes □
No □
Prefer Not to Say □
Page 5
Work and Study
Have you ever missed a lecture or other class to attend work?
Yes □
No □

80
How many times has this happened? [question appears only if participant answers yes to previous question]
Once □
A couple of times □
Up to five times □
More than five times □
Have you ever missed a lecture or other class after working late and sleeping in the next morning?
Yes □
No □
How many times has this happened? [question appears only if participant answers yes to previous question]
Once □
A couple of times □
Up to five times □
More than five times □
Has working ever caused you to miss a deadline?
Yes □
No □
How many times has this happened? [question appears only if participant answers yes to previous question]
Once □
A couple of times □
Up to five times □
More than five times □
How much do you agree with the following statements? [appears as a likert scale in a grid format]
My work causes/caused me to fall behind with course readings. Strongly Agree □ Agree □ Neither Agree nor
Disagree □ Disagree □ Strongly Disagree □
My work causes/caused me to spend less time studying. Strongly Agree □ Agree □ Neither Agree nor Disagree
□ Disagree □ Strongly Disagree □
My work causes/caused extra stress when deadlines were due and exams were approaching. Strongly Agree □
Agree □ Neither Agree nor Disagree □ Disagree □ Strongly Disagree □
I spend/spent less time using university facilities such as the library as a result of being employed during the
semester. Strongly Agree □ Agree □ Neither Agree nor Disagree □ Disagree □ Strongly Disagree □

81
I believe that work causes/caused my grades to be lower than if I wasn't employed. Strongly Agree □ Agree □
Neither Agree nor Disagree □ Disagree □ Strongly Disagree □
Working long hours meant that I am/was tired during the day. Strongly Agree □ Agree □ Neither Agree nor
Disagree □ Disagree □ Strongly Disagree □
Working means/meant that I have less time to reflect on my learning and meet with peers and staff. Strongly
Agree □ Agree □ Neither Agree nor Disagree □ Disagree □ Strongly Disagree □
If applicable, did you find it harder to remain in employment once you started your final two years at university?
Yes □
No □
Did you take an optional year abroad during your Honours years? (4th year students only).
Yes □
No □
Did this make it harder to remain in employment during your final year at Edinburgh? [question appears only if
participant answers yes to previous question]
Yes □
No □
Page 6
Living in Edinburgh
These questions should be answered with regards to your current term-time job, or your most recent term-time
job if you no longer work.
Which of these best describes your living arrangements?
Privately rented flat □
University rented flat □
Private student accomodation/halls □
University student accomodation/halls □
In a house (not with family) □
At home (with family) □

82
Is your student loan on its own enough to cover your monthly rent? (including bills) [question disappears if the
answer to the previous question was ‘at home (with family)’]
Yes □
No □
Unsure □
How much time during the week do/did you spend travelling to and from work?
Less than 15 minutes □
15 - 30 minutes □
30 - 45 minutes □
45 minutes - 1 hour □
1 hour - 1 hour 15 minutes □
1 hour 15 minutes - an hour and a half □
Over an hour and a half □
Do you own and pay for your own car or motorbike?
Yes □
No □
Page 7
Why Do/Did You Work
Which of these were reasons for you finding term-time employment while at university? (Tick all that apply)
Extra income for non-essentials □
Extra income for essentials □
To pay the rent □
To gain work experience □
To improve skills and attributes □
To meet new people □
To have a new focus asides from studying □
To avoid getting into debt □
The work was related to or necessary for my degree □
To pay for study materials □
General experience of employment □
Experience of a specific industry □
Other □

83
How much to you agree with the following statements?
I would not be able to remain at university if I did not work during the semester. Strongly Agree □ Agree □
Neither Agree nor Disagree □ Disagree □ Strongly Disagree □
My tuition fees influence/influenced my decision to work. Strongly Agree □ Agree □ Neither Agree nor
Disagree □ Disagree □ Strongly Disagree □
My student loan influences/influenced my decision to work. Strongly Agree □ Agree □ Neither Agree nor
Disagree □ Disagree □ Strongly Disagree □
Money is the main reason why I work/worked during the semester. Strongly Agree □ Agree □ Neither Agree nor
Disagree □ Disagree □ Strongly Disagree □
My work affects/affected the amount of time I spend on extra-curricular activities such as student societies.
Strongly Agree □ Agree □ Neither Agree nor Disagree □ Disagree □ Strongly Disagree □
My employer is/was sympathetic of my status as a full-time student. Strongly Agree □ Agree □ Neither Agree
nor Disagree □ Disagree □ Strongly Disagree □
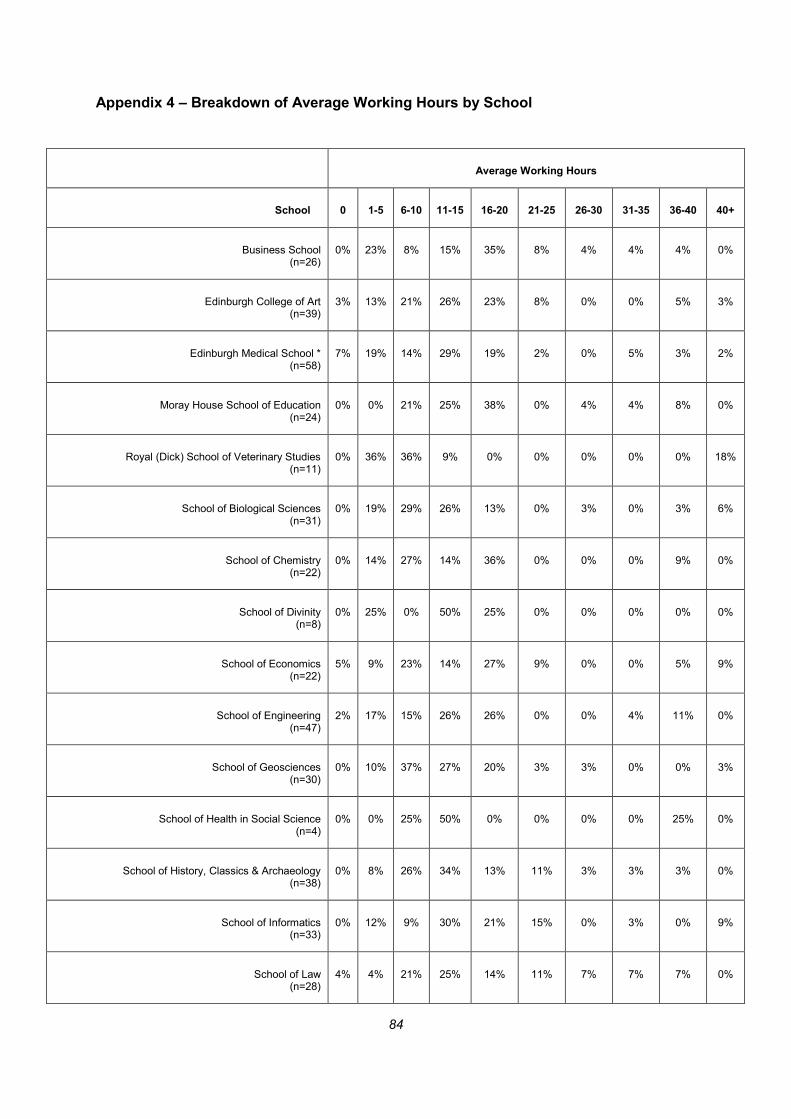
84
Appendix 4 – Breakdown of Average Working Hours by School
Average Working Hours
School 0 1-5 6-10 11-15 16-20 21-25 26-30 31-35 36-40 40+
Business School (n=26)
0% 23% 8% 15% 35% 8% 4% 4% 4% 0%
Edinburgh College of Art (n=39)
3% 13% 21% 26% 23% 8% 0% 0% 5% 3%
Edinburgh Medical School * (n=58)
7% 19% 14% 29% 19% 2% 0% 5% 3% 2%
Moray House School of Education (n=24)
0% 0% 21% 25% 38% 0% 4% 4% 8% 0%
Royal (Dick) School of Veterinary Studies (n=11)
0% 36% 36% 9% 0% 0% 0% 0% 0% 18%
School of Biological Sciences (n=31)
0% 19% 29% 26% 13% 0% 3% 0% 3% 6%
School of Chemistry (n=22)
0% 14% 27% 14% 36% 0% 0% 0% 9% 0%
School of Divinity (n=8)
0% 25% 0% 50% 25% 0% 0% 0% 0% 0%
School of Economics (n=22)
5% 9% 23% 14% 27% 9% 0% 0% 5% 9%
School of Engineering (n=47)
2% 17% 15% 26% 26% 0% 0% 4% 11% 0%
School of Geosciences (n=30)
0% 10% 37% 27% 20% 3% 3% 0% 0% 3%
School of Health in Social Science (n=4)
0% 0% 25% 50% 0% 0% 0% 0% 25% 0%
School of History, Classics & Archaeology (n=38)
0% 8% 26% 34% 13% 11% 3% 3% 3% 0%
School of Informatics (n=33)
0% 12% 9% 30% 21% 15% 0% 3% 0% 9%
School of Law (n=28)
4% 4% 21% 25% 14% 11% 7% 7% 7% 0%

85
School of Literatures, Languages & Cultures (n=71)
0% 6% 30% 28% 13% 8% 6% 3% 4% 3%
School of Mathematics (n=26)
0% 15% 27% 12% 35% 8% 0% 0% 4% 0%
School of Philosophy, Psychology & Language Sciences (n=61)
0% 8% 28% 34% 11% 10% 2% 3% 3% 0%
School of Physics & Astronomy (n=29)
3% 14% 10% 21% 34% 3% 3% 0% 7% 3%
School of Social & Political Science (n=44)
2% 9% 14% 32% 30% 5% 5% 5% 0% 0%
Grand Total 2% 12% 21% 26% 21% 6% 2% 3% 4% 2%
*--Edinburgh Medical School includes the Deaneries of Biomedical Science and Oral Health.