aser: evolution and overview - unesco
TRANSCRIPT

ASER: Evolution and overview
ASER Centre | B 4/54 Safdarjung Enclave, New Delhi 110029 | www.asercentre.org
Suman Bhattacharjea & Savitri Bobde, ASER Centre, New DelhiWorkshop on Introduction to large-scale assessments of learning
NEQMAP, Bangkok, September 23-26 2014

Grade 2 level text Letters Simple common words
Grade 1 level text

Overview
Background
Pratham: “every child in school and learning well”
Going to scale
Why scale up?
Key decisions: What, who, when, where?
What does ASER tell us?
Every year
Trends over time
Impact
In India
International impact

Pratham: “Every child in school & learning well”
CHALLENGE : At local level in communities & schools… Do we really know our children?
• Parents “send” children to school and are concerned about “inputs”. Parents often over-estimate what children can do
• Teachers “teach” the course for the grade level. Teachers often over-estimate what children can do (SchoolTELLS)
• Schools usually not structured to identify or to help those who fall behind.
Learning delayed is learning denied. Children need to learn satisfactorily at the right time to make adequate progress through the education system to complete at least the elementary stage.
Since 1996, Pratham has worked with children who have been “left out” or “left behind”.
It was relatively easy to bring children to school. But to add ‘value’, accelerated learning was needed.

High level policy positions
UNIVERSAL LEARNING?
MDG goals - No definition or reference to children’s learning goals
National (SSA) goals are broad ….“education of satisfactory quality relevant for life”….
In India, govt measurements of learning levels come out every few years.
UNIVERSAL ENROLMENT
MDG goals refer to universal enrolment
India’s national goals (SSA) refer to universal enrolment, retention and reduction of social and gender gaps.
In India, from school/village level to state & national level enrolment numbers are collected frequently, published and discussed.
Challenge: At micro & macro level …How to bring learning to centre of stage? Progress, equity?

Can children read?
Grade 2 level text Letters Simple common words
Grade 1 level text
What can we do at ground level?
Simple assessment tool was useful for instruction. Also for engaging parents and teachers about what to do.
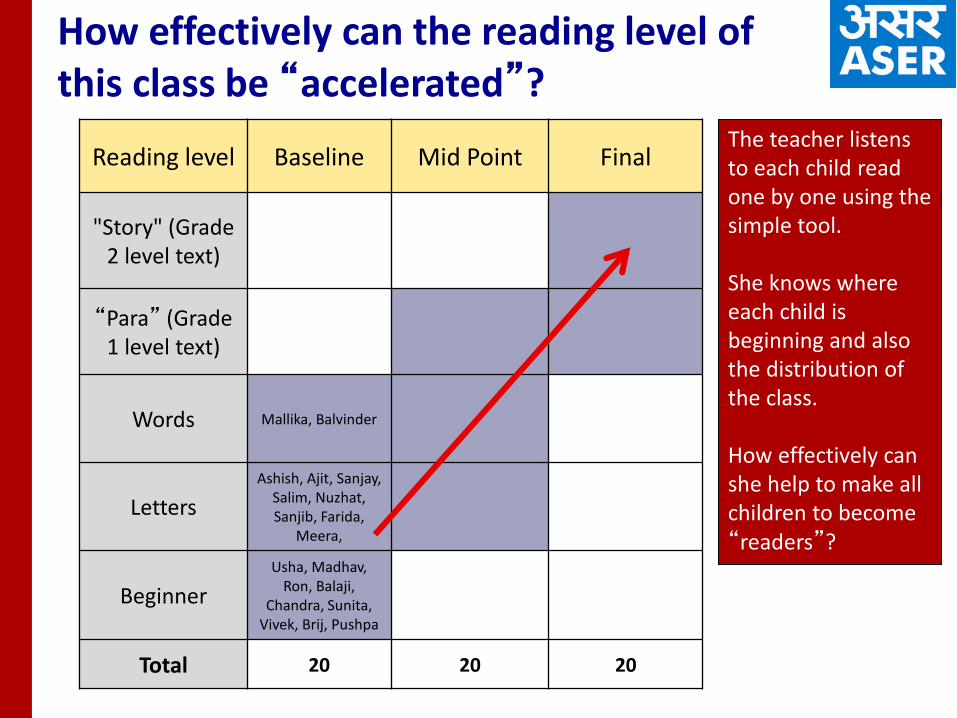
Reading level Baseline Mid Point Final
"Story" (Grade 2 level text)
“Para” (Grade 1 level text)
Words Mallika, Balvinder
Letters
Ashish, Ajit, Sanjay, Salim, Nuzhat, Sanjib, Farida,
Meera,
Beginner
Usha, Madhav, Ron, Balaji,
Chandra, Sunita, Vivek, Brij, Pushpa
Total 20 20 20
How effectively can the reading level of this class be “accelerated”?
The teacher listens to each child read one by one using the simple tool.
She knows where each child is beginning and also the distribution of the class.
How effectively can she help to make all children to become “readers”?

Discussion in small groups in each hamlet :
Local people help in making the hamlet report card.
Report card focuses on whether child goes to school & on whether child can read simple text and do basic arithmetic
Big meeting in village to discuss hamlet & village education report card.
Attended by parents, villagers, village committee members, headmaster and teachers :
100-150 people attend especially if the hamlet level discussions have been held well
Start action.
Track measurable changes in children’s learning & in school functioning
Agree on next steps…
On what can be done in village
“Demo” class run in the village for 4-5 days to show how children can learn to read quickly
What can we do at village level: Mobilizing communities
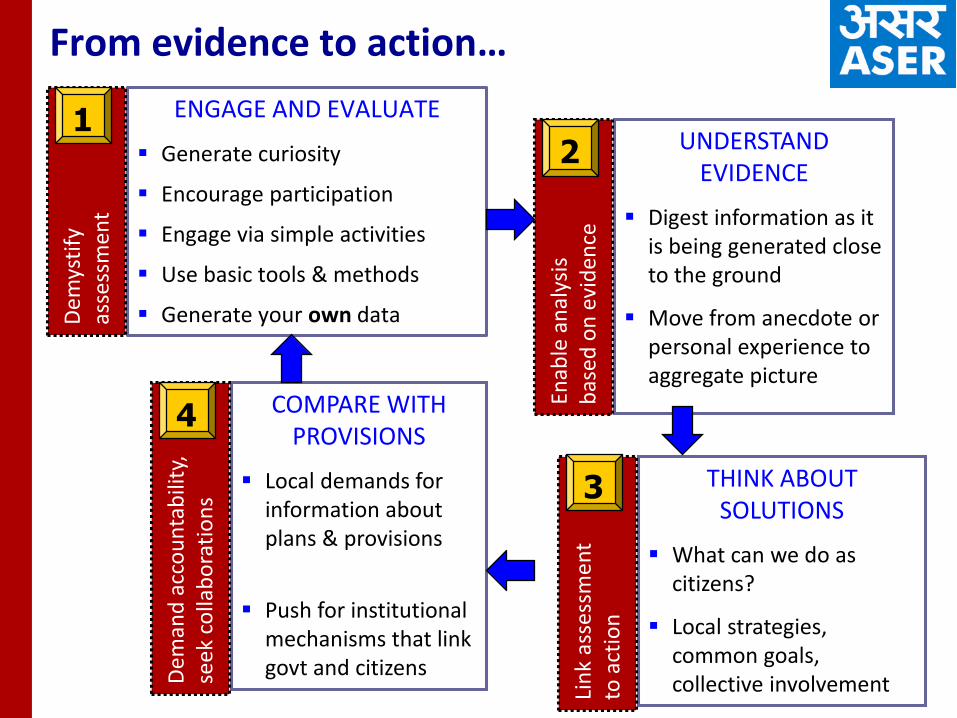
From evidence to action…
ENGAGE AND EVALUATE
Generate curiosity
Encourage participation
Engage via simple activities
Use basic tools & methods
Generate your own data
UNDERSTAND EVIDENCE
Digest information as it is being generated close to the ground
Move from anecdote or personal experience to aggregate picture
THINK ABOUT SOLUTIONS
What can we do as citizens?
Local strategies, common goals, collective involvement
COMPARE WITH PROVISIONS
Local demands for information about plans & provisions
Push for institutional mechanisms that link govt and citizens
Dem
ysti
fyas
sess
men
t 1
Enab
le a
nal
ysis
bas
ed o
n e
vid
ence
2
Lin
k as
sess
men
t to
act
ion
3
Dem
and
acc
ou
nta
bili
ty,
seek
co
llab
ora
tio
ns
4

Overview
Background
Pratham: “every child in school and learning well”
Going to scale
Why scale up?
Key decisions: What, who, when, where?
What does ASER tell us?
Every year
Trends over time
Impact
In India
International impact

Why scale up to a national survey?
“At the same time, I must caution that
outlays do not necessarily mean outcomes. The people of the country are concerned with outcomes. (…) During the course of the year… we shall put in place a mechanism to measure the development outcomes of all major programmes. We shall also ensure that programmes and schemes are not allowed to continue indefinitely from one Plan period to the next without an independent and in-depth evaluation. Civil society should also engage Government in a healthy debate on the efficiency of the delivery mechanism.”
In 2004, the new UPA government promised to focus on outcomes, not outlays.
The same year, the 2% cess for elementary edcame into effect.
Extract from the Budget Speech by the Finance Minister, P Chidambaram February 28, 2005

Going to scale: Key decisions
INPUTS ARE EASY TO MEASURE
Measurement of schools, teachers, infrastructure is relatively easy.
These are visible and do not change much over time.
Regular data collection for these variables happen annually and at every level by the government.
OUTCOMES ARE DIFFICULT TO MEASURE,
especially LEARNING OUTCOMES
What to measure: basic, grade level
Who to measure : all or sample
When to measure: once, periodically
Where to measure: school, home
Who will measure: external/internal
How to ensure data quality?
How quickly will it be available?

ASER decisions: 1. What to measure?
MANY CHOICES
Same test to all children regardless of which standard they are in OR different tests to children in different standards?
Which subjects? Some or all?
Speaking, reading, writing?
Pen & paper test/group or oral test and individual testing?
ASER DECISIONS:
Same test to all children.
Why? Because large number of children do not even learn the basics
Only reading & arithmetic each year.
Why? To keep it simple and fast
Individual one-on-one testing (in language of child’s choice)
Why? Reading cannot be done in a group.

ASER decisions: 2. Who to measure?
MANY CHOICES
Some classes/age groups or all classes/age groups?
Cover all clusters/ blocks or districts?
All children in a district or block or a sample of children?
Select from all children in a geographical area or set of schools or only from children who are in a particular program?
ASER DECISIONS:
All children tested from age 5 to 16.
Why? Because over 50% of 5 year olds are in school in India. By 14 many children have not finished Std 8.
Survey done in all rural districts.
Why? So that it can be useful in planning and implementation at district level.
Sample of children from each district.
Why? Reasonable sample can give reliable estimates & fast to do.

ASER decisions: 3. When to measure?
SEVERAL CHOICES
Once a year?
Several times a year?
Once every few years?
ASER DECISIONS:
Once a year in October or November.
Why? Middle of school year in most states and schools have “settled”down.
Done every year so that progress can be reviewed. ASER experience suggests that there can be big changes from year to year in basic learning outcomes. Since planning is done every year, review of progress should also be done every year and results available before the next year’s plans are made.
Also, annual data facilitates unrelenting focus on the issue of poor learning.

ASER decisions: 4. Where to measure?
SEVERAL CHOICES
In school? In all government schools? And in private schools?
In the community or in the household?
ASER DECISIONS:
Children tested in the community or at home.
Why? Because ASER wants to get a representative sample of children in a district:
Enrolled in govt school
Enrolled in private school
Not enrolled in school
Enrolled but not attending on day of school visit
All of these kinds of children can only be found at home.
ASER does not cover children who do not live at home or are in some other place at the time of survey.

ASER decisions: 5. Who will measure?
SEVERAL CHOICES
Internal teams…Teachers?
Internal teams... DIET faculty, students? Cluster, block or district officials?
External teams… Research agency? Citizens? Local organizations?
ASER DECISIONS:
Ordinary people. Local organizations or institutions in each district.
Why? According to SSA guidelines, community participation is welcome and local organizations and institutions should be part of planning and review process in the district Annual Work Plan process.
Also, all Indian citizens pay 2% education cess for elementary education and so should know how their money is being spent.

Ensuring data quality
Representative sampling
2 stage sampling: 30 villages selected per district using PPS sampling; 20 households randomly selected per village = total sample size of 600 HH per district or ~300,000 total
10 villages dropped and 10 new added each year -> rotating panel of villages
Technically reliable and valid tools
Rigorous piloting
Standards tests for inter-rater reliability, reliability and validity. Language experts, educationists and field practitioners consulted
Stringent quality control procedures
Comprehensive training to field teams
Extensive field monitoring and recheck procedures

Summary
Key features of ASER:
Covers all children in the age group 5-16, not just those in govt
schools: >600,000 children reached each year
Engages ordinary citizens. Simple to do, to analyze and to understand. ~25,000 local volunteers each year
Comprehensive framework for ensuring data quality and representativeness. ~1/3 villages monitored or rechecked
No delay between data collection and results. ~100 days from survey to report
Inexpensive to conduct in terms of both money and manpower. ~US$1,500/district
Provides trends over time and comparisons of key variables across units. 9 year time series

Overview
Background
Pratham: “every child in school and learning well”
Going to scale
Why scale up?
Key decisions: What, who, when, where?
What does ASER tell us?
Every year
Trends over time
Impact
In India
International impact

Every year: data on core variables
Children’s schooling status – all children age 3-16 in sampled HHs
Children’s ability to read and do basic arithmetic – all children age 5-16 in sampled HHs
Basic household characteristics (parents’ education, household assets) – all sampled HHs
Key school characteristics – largest government primary school in each sampled village
Data disaggregated by state, district

Assumption: Most children are at their grade specific learning levels
Reality: Most children are several years below grade level
Source : ASER 2013
All India, Grade 5. 2013.
47% can read at
Grade 2 level 21% can read
at Grade 1 level
14% can read
simple words but not more
13% can read letters or less
Challenging assumptions…
Huge implications for curriculum design and textbook development

Assumption: Children in each grade are homogenous
Reality: Class composition is complex… Grade 4 class in Bihar
AGE
Just 51% children in Grade 4 are 9 or 10 (“right age”)
MULTIGRADE
In 67% schools, Grade 4 children sit with at least one other grade
LANGUAGE
53% of children sampled in ASER 2011 in Bihar speak a different language at home from the medium of instruction in school.
Source : ASER 2011
Challenging assumptions…
Bihar, Grade 4
Huge implications for teacher training

Trends over time
48.0 49.0 50.446.6 45.7
53.158.8
56.252.8 53.7
0.0
10.0
20.0
30.0
40.0
50.0
60.0
70.0
80.0
90.0
100.0
0
20000
40000
60000
80000
100000
120000
2005-06 2006-07 2007-08 2008-09 2009-10 2010-11
Centr
al+
state
govt
expenditure
on
ele
menta
ry e
d(R
s 10 m
illio
n) % Std 3
childrenwho canread a Std1 leveltext
% Std 5childrenwho canread a Std2 leveltext
Is increasing expenditure leading to improved learning outcomes?

0
10
20
30
40
50
60
70
80
90
100
Std 3 Std 4 Std 5
2006
2007
2008
2009
2010
2011
% Children in rural India who can read at Std 2 level
“Desired” level
Source: ASER 2006-2011
What are we doing to move children from their actual level towards the “desired” level of basic reading?
“The big stuck”
ASER findings video

Overview
Background
Pratham: “every child in school and learning well”
Going to scale
Why scale up?
Key decisions: What, who, when, where?
What does ASER tell us?
Every year
Trends over time
Impact
In India
International impact

Impact in India
Enormous media coverage- print, TV and electronic; national and regional; English and regional languages. Huge increase in visibility of the quality issue.
Clear impact on national policy and planning documents. Examples: XII FYP, Economic Survey of India, AWP guidelines, National Achievement Surveys.
Efforts by some states to rethink assessment and instructional strategies using core elements of the ASER model. Examples: Bihar instructional goals based on ASER levels. Rajasthan doing ASER type testing.

International impact
Increasing international media coverage
Increased visibility of the model in a variety of international education platforms and publications, for example: UNESCO’s 11th Global Monitoring Report; World Bank Symposium: Assessment for Global Learning; Brookings Institution-UNESCO Learning Metrics Task Force; Save the Children paper on The Right to Learn
The model has been adapted for use in 7 countries so far; several more may join this informal south-south network soon…
Every child counts…

For more information …
www.asercentre.org
Thank you!