asean vs east asia and paciic - malaysia productivity ... the report report highlights global...
TRANSCRIPT

About The Report
Report Highlights
Global Competitiveness Index (GCI) 2017-2018 Overall Rankings
Top 10 Countries
Malaysia’s Performance among APEC & ASEAN Community
ASEAN vs East Asia and PacificMalaysia’s Performance 2008-2017
Performance by Pillar
Malaysia’s Competitiveness Landscape
Pillar 1: Institutions
Pillar 2: Infrastructure
Pillar 3: Macroeconomic Environment
Pillar 4: Health and Primary Education
Pillar 5: Higher Education and Training
Pillar6:GoodsMarketEfficiency Pillar7:LaborMarketEfficiency Pillar 8: Financial Market Development
Pillar 9: Technological Readiness
Pillar 10: Market Size
Pillar 11: Business Sophistication
Pillar 12: Innovation
Way Forward: Accelerating Implementation
The Competitiveness Marathon
Learning from Others
Classification by Each Stage of DevelopmentFast Facts
2
3
6
8
9
10
11
12
13
14
15
16
17
18
19
20
21
22
23
24
25
26
28
29
30
31
MPC | GLOBAL COMPETITIVENESS REPORT 2017-2018 1
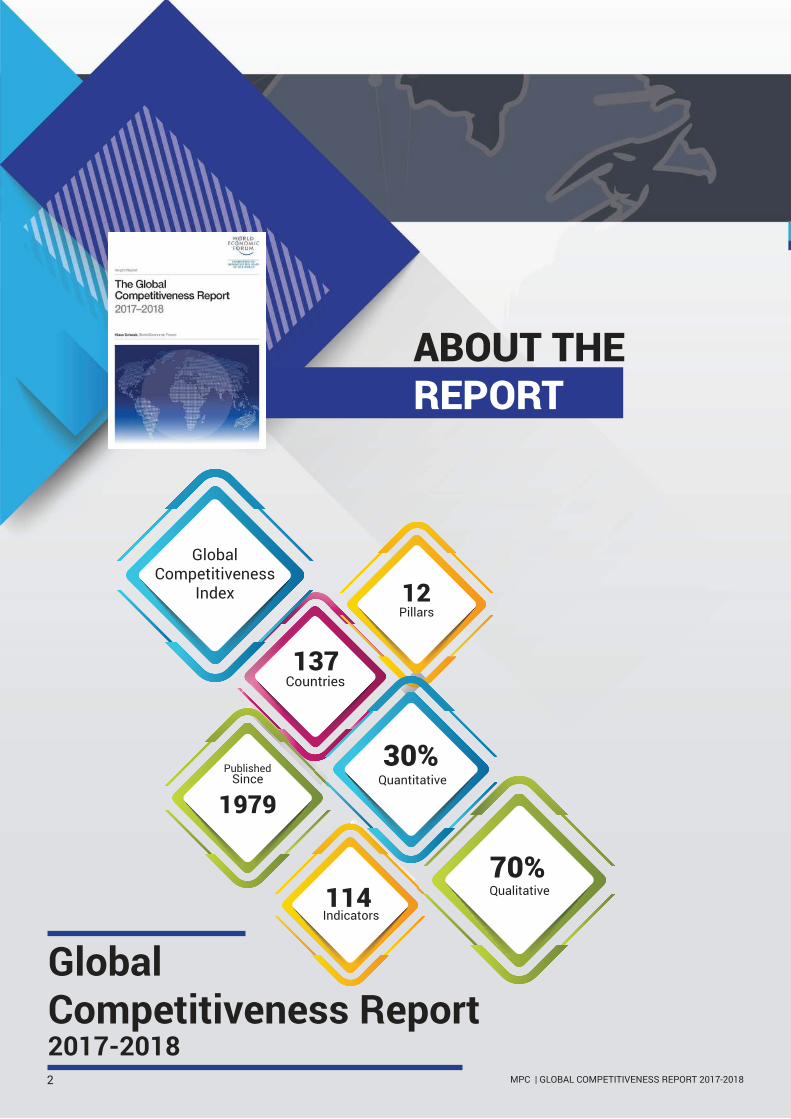
ABOUT THE
REPORT
Countries
Qualitative
Since
1979
Indicators
12Pillars
Quantitative
GlobalCompetitiveness
Index
GlobalCompetitiveness Report 2017-2018
137
114
70%
30%Published
MPC | GLOBAL COMPETITIVENESS REPORT 2017-20182
REPORTHIGHLIGHTS
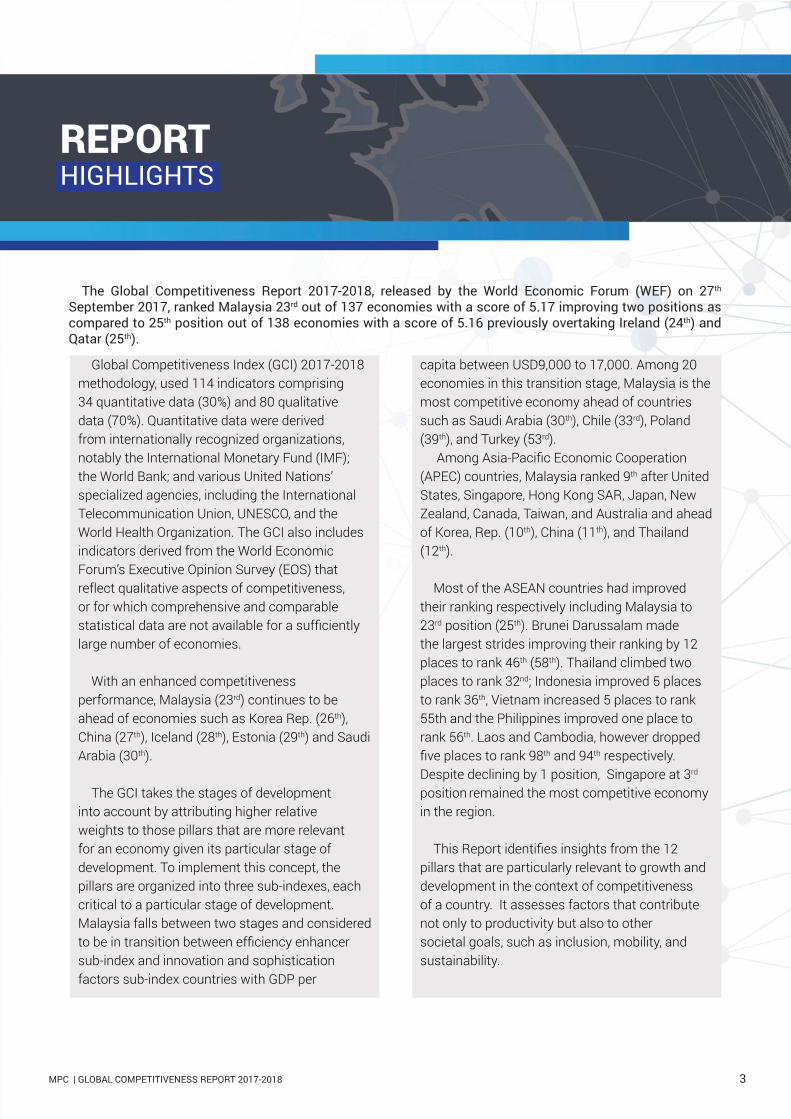
Global Competitiveness Index (GCI) 2017-2018
methodology, used 114 indicators comprising
34 quantitative data (30%) and 80 qualitative
data (70%). Quantitative data were derived
from internationally recognized organizations,
notably the International Monetary Fund (IMF);
the World Bank; and various United Nations’
specialized agencies, including the International
Telecommunication Union, UNESCO, and the
World Health Organization. The GCI also includes
indicators derived from the World Economic
Forum’s Executive Opinion Survey (EOS) that
reflect qualitative aspects of competitiveness,
or for which comprehensive and comparable
statistical data are not available for a sufficiently large number of economies.
With an enhanced competitiveness
performance, Malaysia (23rd) continues to be
ahead of economies such as Korea Rep. (26th),
China (27th), Iceland (28th), Estonia (29th) and Saudi
Arabia (30th).
The GCI takes the stages of development
into account by attributing higher relative
weights to those pillars that are more relevant
for an economy given its particular stage of
development. To implement this concept, the
pillars are organized into three sub-indexes, each
critical to a particular stage of development.
Malaysia falls between two stages and considered
to be in transition between efficiency enhancer sub-index and innovation and sophistication
factors sub-index countries with GDP per
capita between USD9,000 to 17,000. Among 20
economies in this transition stage, Malaysia is the
most competitive economy ahead of countries
such as Saudi Arabia (30th), Chile (33rd), Poland
(39th), and Turkey (53rd).
Among Asia-Pacific Economic Cooperation (APEC) countries, Malaysia ranked 9th after United
States, Singapore, Hong Kong SAR, Japan, New
Zealand, Canada, Taiwan, and Australia and ahead
of Korea, Rep. (10th), China (11th), and Thailand
(12th).
Most of the ASEAN countries had improved
their ranking respectively including Malaysia to
23rd position (25th). Brunei Darussalam made
the largest strides improving their ranking by 12
places to rank 46th (58th). Thailand climbed two
places to rank 32nd; Indonesia improved 5 places
to rank 36th, Vietnam increased 5 places to rank
55th and the Philippines improved one place to
rank 56th. Laos and Cambodia, however dropped
five places to rank 98th and 94th respectively.
Despite declining by 1 position, Singapore at 3rd
position remained the most competitive economy
in the region.
This Report identifies insights from the 12 pillars that are particularly relevant to growth and
development in the context of competitiveness
of a country. It assesses factors that contribute
not only to productivity but also to other
societal goals, such as inclusion, mobility, and
sustainability.
The Global Competitiveness Report 2017-2018, released by the World Economic Forum (WEF) on 27th September 2017, ranked Malaysia 23rd out of 137 economies with a score of 5.17 improving two positions as compared to 25th position out of 138 economies with a score of 5.16 previously overtaking Ireland (24th) and Qatar (25th).
MPC | GLOBAL COMPETITIVENESS REPORT 2017-2018 3

At the indicator level, the following indicators
achieved top 10 position have contributed
significantly to the performance of pillars and overall rankings:
i. Inflation1, ranks 1st (1st);
ii. Strength of investor protection, ranks
3rd(4th);
iii. Government procurement of advanced
technology products, ranks 4th (3rd);
iv. Burden of government regulation, ranks 5th
(6th);
v. Pay and productivity, ranks 5th (6th);
vi. Agricultural policy costs, ranks 7th (8th);
vii. Availability of scientist and engineers, ranks
7th (7th)
viii. Extent of staff training, ranks 9th (9th);
ix. Venture capital availability, ranks 9th (6th);
and
x. Extent of marketing, ranks 10th(9th);
Health & Primary Education pillar improved
significantly recording double digit (14 places) improvement to 30th position from 44th last year. The
contributing indicators to the improvements are:
i. Primary education enrollment rate, ranks
32nd (77th), improved 45 places;
ii. HIV prevelance, ranks 73rd, (85th), improved
12 places;
iii. Turberculosis Incidence, ranks 90th, (93rd),
improved 3 places; and
iv. Infant mortality, ranks 44th, (45th), improved
1 place.
Pillars that maintained their positions are Market
Size, ranks 24th, Business Sophistication, ranks 20th
and Innovation, ranks 22nd.
Pillars that declined in rankings are Institutions,
ranks 27th (26th), Higher Education and Training,
ranks 45th (41st), Goods Market Efficiency, ranks 20th (12th), Labor Market Efficiency, ranks 26th (24th),
Financial Market Development, ranks 16th (13th) and
Technological Readiness, ranks 46th (43rd).
Of the 6 declined pillars, Goods Market Efficiency pillar declined the most by 8 places. Among the
indicators that contributed to the decline are:
i. Number of procedures to start a business2,
ranks 104th (11th), declined 93 places;2
ii. Time to start a business, ranks 94th, (15th),
declined 79 places;2
iii. Prevalence of non-tariff barriers, ranks 34th,
(19th), declined 15 places;
iv. Business Impact of rules on FDI, ranks
50th,(41st), declined 9 places;
v. Effect of taxation on incentives to invest,
ranks 21st, (14th), declined 7 places; and
vi. Prevalence of foreign ownership, ranks 36th,
(30th), declined 6 places.
REPORT HIGHLIGHTS
MPC | GLOBAL COMPETITIVENESS REPORT 2017-20184

According to WEF, analysis of the Global
Competitive Index (GCI) also points to 3 main
challenges that are relevant for economic progress
and policy action. These include:
i. The need to maintain a sound financial sector to prevent recessions with deep and
long-lasting effects on productivity and
growth;
ii. Finding balance between innovation and
technological adoption, particularly those in
emerging economies such as China and
India to enable widespread of innovation’s
potential economic and societal impact; and
iii. Flexibility in the labour market and worker
protection to ensure competitiveness,
especially within the technological era;
pointing to the fact that rapid technological
progress would require reallocation of
workers.
WEF also indicated the intention of updating the
methodology used in assessing competitiveness.
The amendment which would include new concepts
and indicators, is in line with the most recent
competitiveness challenges and developments in
the areas of productivity, innovation and growth.
WEF would only utilise the new methodology on
an incremental phase, commencing 2018. The
new methodology would reduce the share of
perception data (from some 71% to less than 50%)
and provides for a more objective analysis, with the
availability of hard data.
Notes:
1 Countries with inflation rate within the range of 0.5% to 2.9% received the highest score of 7 hence number 1 ranking. Malaysia share this top
position with other countries such as Portugal, New Zealand and United Kingdom.
2 Engagement and improvement on these indicators have been conducted by PEMUDAH’s Focus Group on Starting a Business in the World Bank
Doing Business Report since October 2016. Rebuttal session with the World Bank research team was completed before the deadline in June 2017.
The results will be announced on 31st October 2017 with the launch of Doing Business 2018 report.
MPC | GLOBAL COMPETITIVENESS REPORT 2017-2018 5

GLOBALCOMPETITIVENESS INDEX2017 - 2018
MPC | GLOBAL COMPETITIVENESS REPORT 2017-20186

GLOBALCOMPETITIVENESS INDEX2017 - 2018
MPC | GLOBAL COMPETITIVENESS REPORT 2017-2018 7

TOP10COUNTRIES
MPC | GLOBAL COMPETITIVENESS REPORT 2017-20188

MALAYSIA’SPERFORMANCE AMONGAPEC & ASEAN COMMUNITY
29MALAYSIA’S
RANKING IN ASEANMALAYSIA’S
RANKING IN APEC COUNTRIES
New Zealand
Australia
Indonesia
Singapore
Malaysia
Thailand
Vietnam
Philippines
Korea
China
Russia
Canada
United States
Mexico
Peru
Chile
Japan
Brunei
Papua New Guinea
Hong Kong, China
Chinese Taipei
MPC | GLOBAL COMPETITIVENESS REPORT 2017-2018 9

ASEAN COUNTRIES vsEAST ASIA AND PACIFICANALYTICAL DIAGRAM
7th pillar : Labor Market Efficiency8th pillar : Financial Market Development
9th pillar : Technological Readiness
10th pillar : Market Size
11th pillar : Business Sophistication
12th pillar : Innovation
1st pillar : Institutions
2nd pillar : Infrastructure
3rd pillar : Macroeconomic Environment
4th pillar : Health and Primary Education
5th pillar : Higher Education and Training
6th pillar : Goods Market Efficiency
MPC | GLOBAL COMPETITIVENESS REPORT 2017-201810

MALAYSIA’S PERFORMANCE2008 - 2017
2017-2018
2016-2017
2015-2016
2014-2015
23rd
25th
18th
20th
score 5.17
score 5.16
score 5.23
score 5.16
2013-2014
24th
score 5.03
2012-2013
25th
score 5.06
2010-2011
26th
score 4.88
2011-2012
21st
score 5.08
2009-2010
24th
score 4.87
2008-2009
21st
score 5.04
MPC | GLOBAL COMPETITIVENESS REPORT 2017-2018 11

PERFORMANCEBY PILLAR
Institutions Infrastructure
MacroeconomicEnviroment
Health andPrimary
Education
Goods Market Efficiency
BusinessSophistication
TechnologicalReadiness
Labor MarketEfficiency
Market Size
HigherEducation
and Training
Innovation
Innovation & Sophistication Factors2017-2018 2016-2017
Financial Market Development
Efficiency Enhancers2017-2018 2016-2017
24th24th
20th21st
Basic Requirements2017-2018 2016-2017
26th24th
RANK
RANK
2017-2018
2017-2018
2016-2017
2016-2017
20th
22nd
20th
22nd
RANK
2017-2018 2016-2017
45th 41stRANK
2017-2018 2016-2017
46th 43rd
RANK
2017-2018 2016-2017
20th 12thRANK
2017-2018 2016-2017
24th 24th
RANK
2017-2018 2016-2017
26th 24th
RANK
2017-2018 2016-2017
16th 13th
RANK
2017-2018 2016-2017
30th 44th
RANK
2017-2018 2016-2017
34th 35th
RANK
2017-2018 2016-2017
22nd 24th
RANK
2017-2018 2016-2017
27th 26th
MPC | GLOBAL COMPETITIVENESS REPORT 2017-201812
MALAYSIA’SCOMPETITIVENESSLANDSCAPE
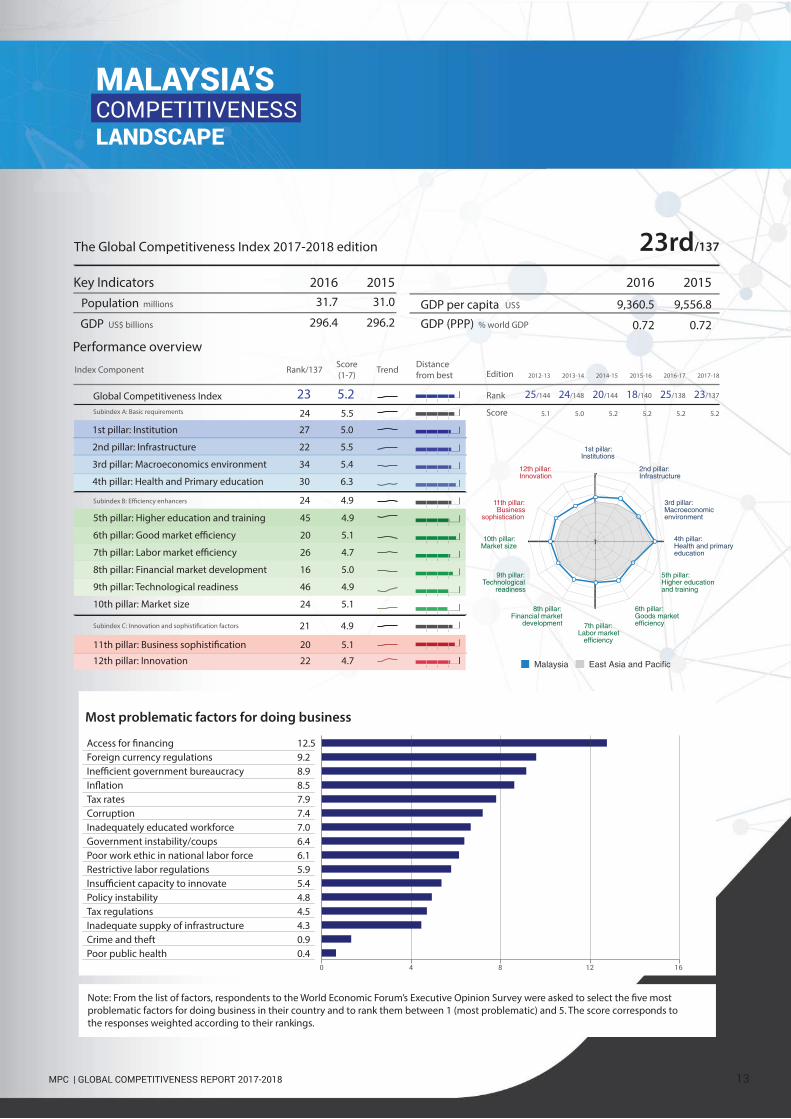
Foreign currency regulations 9.2
Tax rates 7.9
Corruption 7.4
Inadequately educated workforce 7.0
Government instability/coups 6.4
Poor work ethic in national labor force 6.1
Restrictive labor regulations 5.9
Policy instability 4.8
Tax regulations 4.5
Inadequate suppky of infrastructure 4.3
Crime and theft 0.9
Poor public health 0.4
Most problematic factors for doing business
problematic factors for doing business in their country and to rank them between 1 (most problematic) and 5. The score corresponds to
the responses weighted according to their rankings.
0 4 8 12 16
23rd/137The Global Competitiveness Index 2017-2018 edition
Key Indicators
Population
GDP GDP (PPP)
GDP per capita
Performance overview
Global Competitiveness Index
1st pillar: Institution 27 5.0
2nd pillar: Infrastructure 22 5.5
3rd pillar: Macroeconomics environment 34 5.4
4th pillar: Health and Primary education 30 6.3
5th pillar: Higher education and training 45 4.9
8th pillar: Financial market development 16 5.0
9th pillar: Technological readiness 46 4.9
10th pillar: Market size 24 5.1
12th pillar: Innovation 22 4.7
Rank/137Score
(1-7)Trend
Distance
from best
Subindex A: Basic requirements 24
23 5.2
5.5
24 4.9
21 4.9
Index Component
31.7
296.4
millions
US$ billions
US$
% world GDP
9,360.5
0.72
9,556.8
0.72
Rank
Edition
Score
25/144
2012-13
5.1
24/148
2013-14
5.0
20/144
2014-15
5.2
18/140
2015-16
5.2
25/138
2016-17
5.2
23/137
2017-18
5.2
1
7
1st pillar:Institutions
2nd pillar:Infrastructure
3rd pillar:Macroeconomicenvironment
4th pillar:Health and primaryeducation
5th pillar:Higher educationand training
6th pillar:Goods market
7th pillar:Labor market
8th pillar:Financial market
development
9th pillar:Technological
readiness
10th pillar:Market size
11th pillar:Business
sophistication
12th pillar:Innovation
11111111111
Malaysia
31.0
296.2
2016 2015 2016 2015
MPC | GLOBAL COMPETITIVENESS REPORT 2017-2018 13

MPC | GLOBAL COMPETITIVENESS REPORT 2017-201814

MPC | GLOBAL COMPETITIVENESS REPORT 2017-2018 15

MPC | GLOBAL COMPETITIVENESS REPORT 2017-201816

MPC | GLOBAL COMPETITIVENESS REPORT 2017-2018 17

MPC | GLOBAL COMPETITIVENESS REPORT 2017-201818

MPC | GLOBAL COMPETITIVENESS REPORT 2017-2018 19

MPC | GLOBAL COMPETITIVENESS REPORT 2017-201820

MPC | GLOBAL COMPETITIVENESS REPORT 2017-2018 21

MPC | GLOBAL COMPETITIVENESS REPORT 2017-201822

MPC | GLOBAL COMPETITIVENESS REPORT 2017-2018 23

MPC | GLOBAL COMPETITIVENESS REPORT 2017-201824

MPC | GLOBAL COMPETITIVENESS REPORT 2017-2018 25
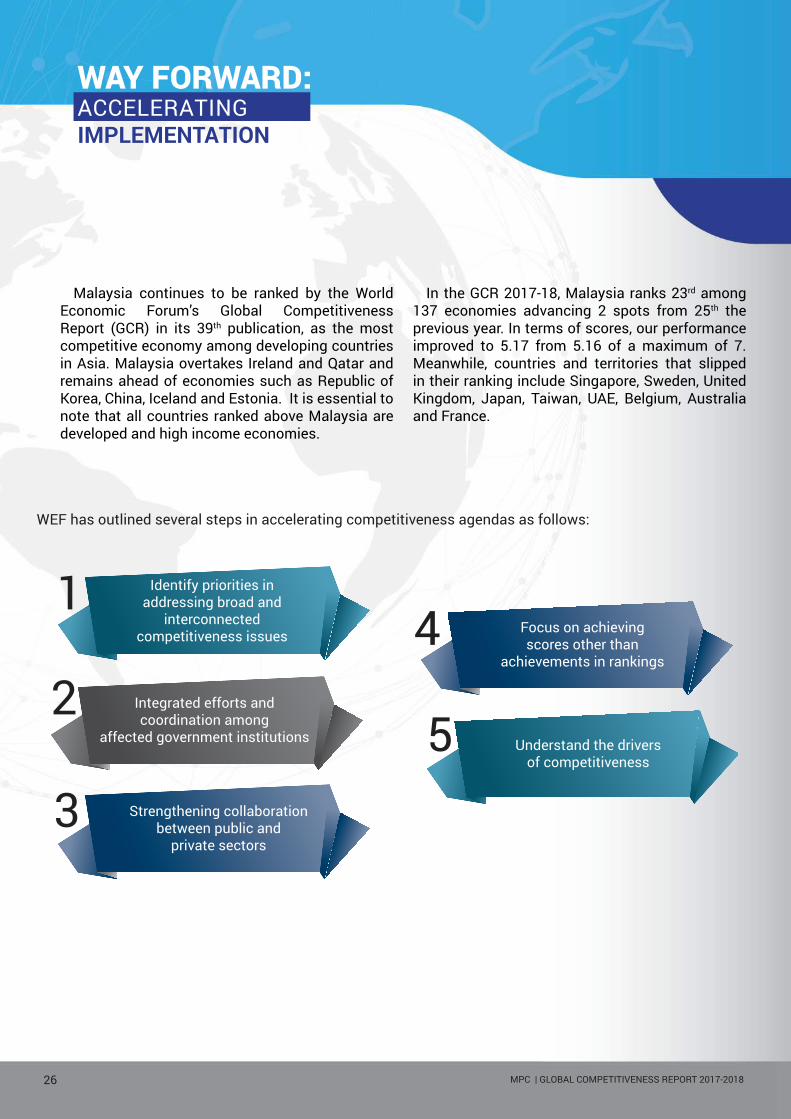
WAY FORWARD:ACCELERATINGIMPLEMENTATION
WEF has outlined several steps in accelerating competitiveness agendas as follows:
Malaysia continues to be ranked by the World Economic Forum’s Global Competitiveness Report (GCR) in its 39th publication, as the most competitive economy among developing countries in Asia. Malaysia overtakes Ireland and Qatar and remains ahead of economies such as Republic of Korea, China, Iceland and Estonia. It is essential to note that all countries ranked above Malaysia are developed and high income economies.
In the GCR 2017-18, Malaysia ranks 23rd among 137 economies advancing 2 spots from 25th the previous year. In terms of scores, our performance improved to 5.17 from 5.16 of a maximum of 7. Meanwhile, countries and territories that slipped in their ranking include Singapore, Sweden, United Kingdom, Japan, Taiwan, UAE, Belgium, Australia and France.
MPC | GLOBAL COMPETITIVENESS REPORT 2017-201826
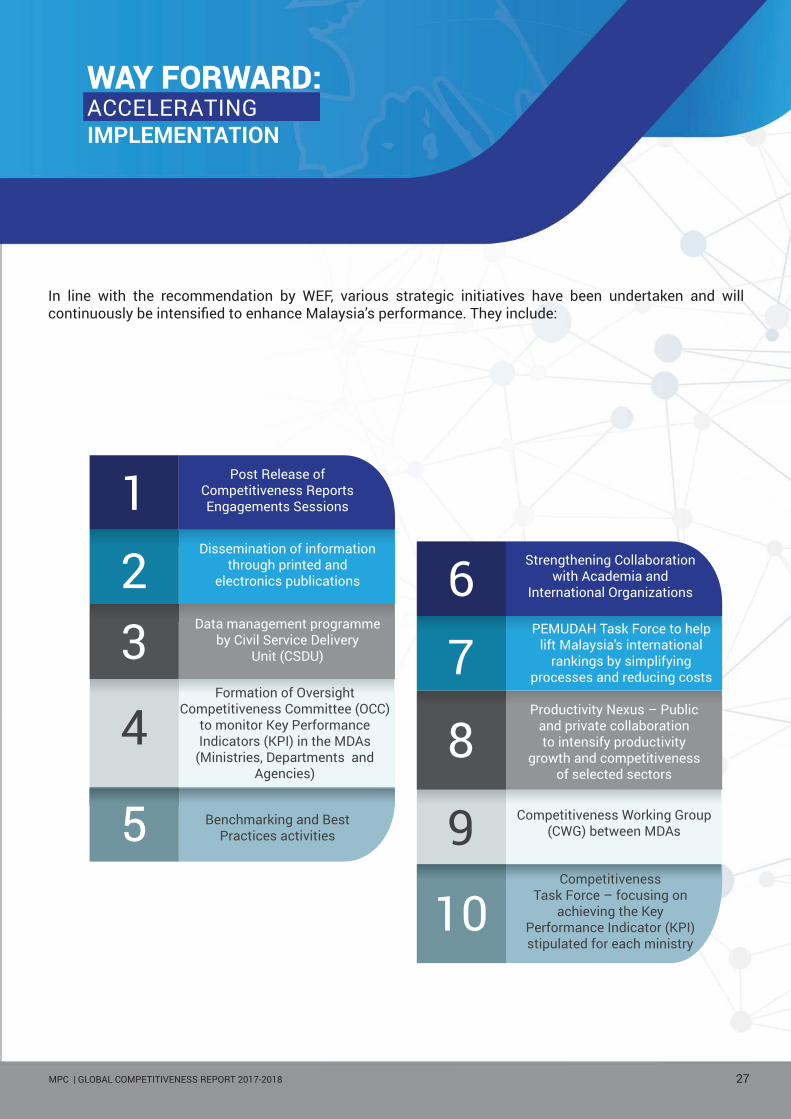
In line with the recommendation by WEF, various strategic initiatives have been undertaken and will continuously be intensified to enhance Malaysia’s performance. They include:
WAY FORWARD:ACCELERATINGIMPLEMENTATION
1
2
3
4
5
Post Release ofCompetitiveness ReportsEngagements Sessions
Dissemination of informationthrough printed and
electronics publications
Data management programmeby Civil Service Delivery
Unit (CSDU)
Formation of OversightCompetitiveness Committee (OCC)
to monitor Key PerformanceIndicators (KPI) in the MDAs
(Ministries, Departments andAgencies)
Benchmarking and BestPractices activities
6
7
8
9
10
Strengthening Collaborationwith Academia and
International Organizations
PEMUDAH Task Force to helplift Malaysia's international
rankings by simplifyingprocesses and reducing costs
Productivity Nexus – Publicand private collaborationto intensify productivity
growth and competitivenessof selected sectors
Competitiveness Working Group(CWG) between MDAs
CompetitivenessTask Force – focusing on
achieving the KeyPerformance Indicator (KPI)stipulated for each ministry
MPC | GLOBAL COMPETITIVENESS REPORT 2017-2018 27

COMPETITIVENESSM A R A T H O N
MPC | GLOBAL COMPETITIVENESS REPORT 2017-201828
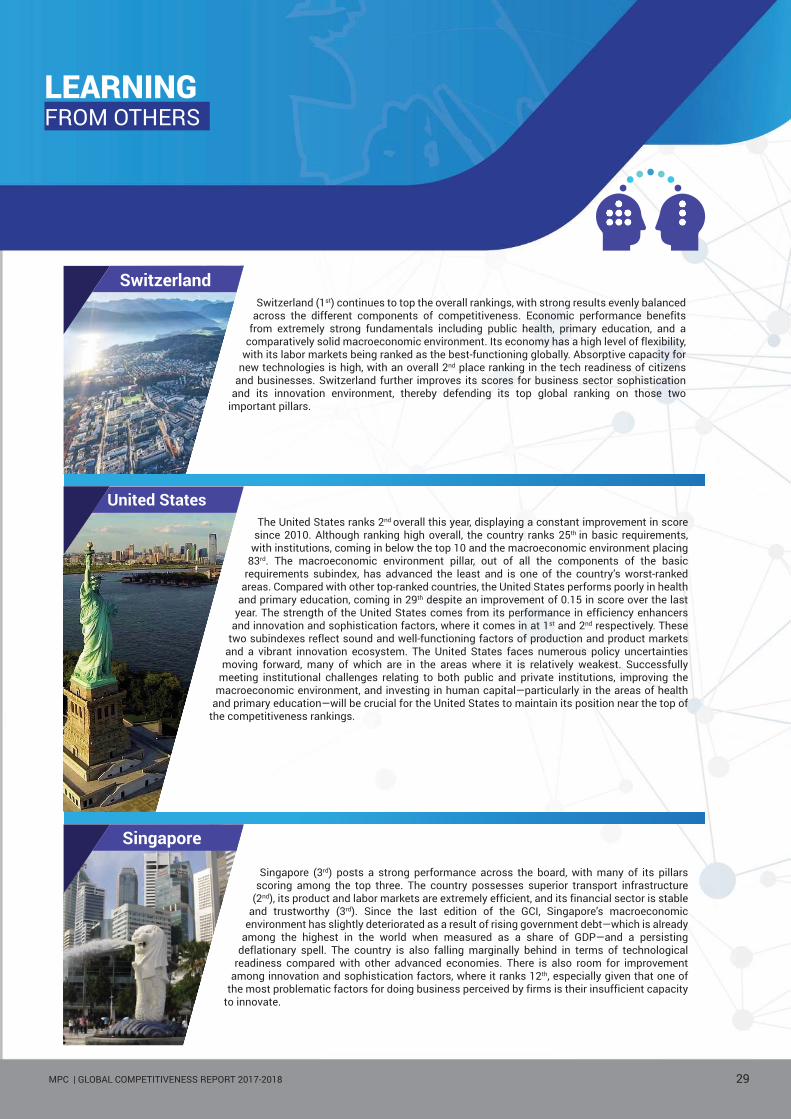
LEARNINGFROM OTHERS
MPC | GLOBAL COMPETITIVENESS REPORT 2017-2018 29

CLASSIFICATIONBY EACHSTAGE OF DEVELOPMENT
MPC | GLOBAL COMPETITIVENESS REPORT 2017-201830

FAST FACTSGCI 2017-2018 : SUBINDEX
Number Of INDICATOrS
MPC | GLOBAL COMPETITIVENESS REPORT 2017-2018 31
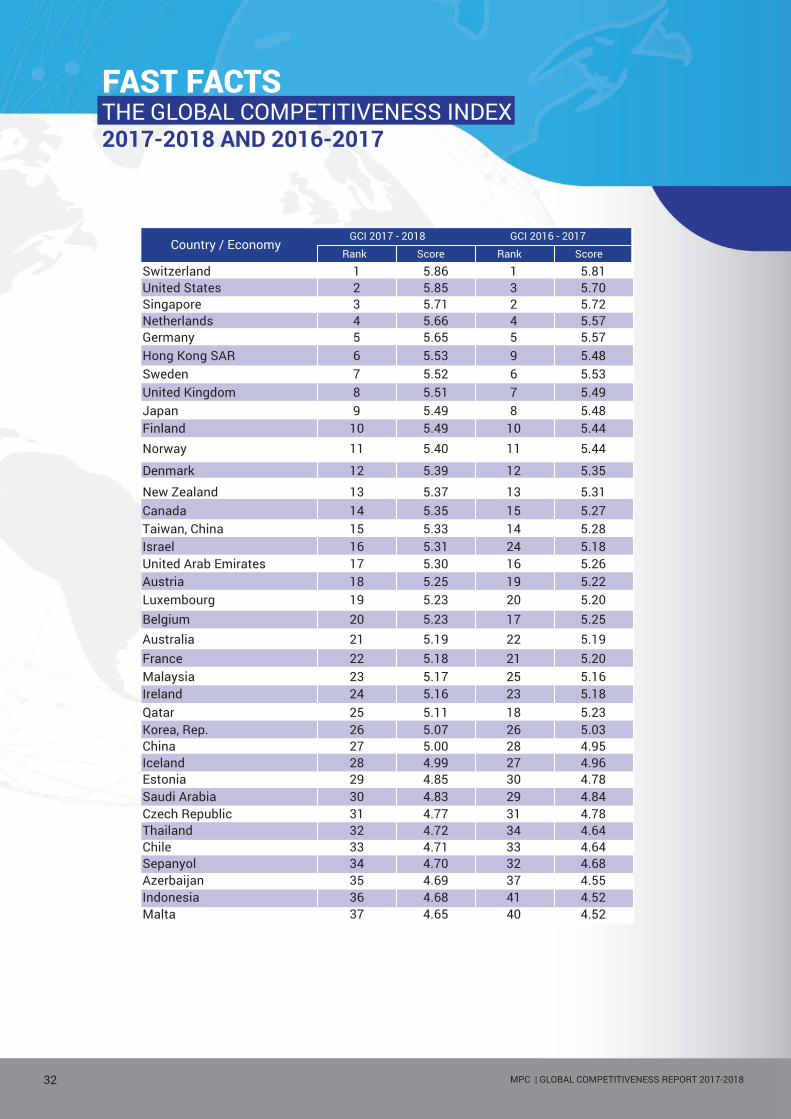
FAST FACTSTHE GLOBAL COMPETITIVENESS INDEX2017-2018 AND 2016-2017
MPC | GLOBAL COMPETITIVENESS REPORT 2017-201832

FAST FACTSTHE GLOBAL COMPETITIVENESS INDEX2017-2018 AND 2016-2017
MPC | GLOBAL COMPETITIVENESS REPORT 2017-2018 33

FAST FACTSTHE GLOBAL COMPETITIVENESS INDEX2017-2018 AND 2016-2017
MPC | GLOBAL COMPETITIVENESS REPORT 2017-201834

FAST FACTSTHE GLOBAL COMPETITIVENESS INDEX2017-2018 AND 2016-2017
MPC | GLOBAL COMPETITIVENESS REPORT 2017-2018 35

MPC | GLOBAL COMPETITIVENESS REPORT 2017-201836