asean-5 power sectors - ipp journal | energy finance ... · asean-5 power sectors 1 1` ......
TRANSCRIPT
ASEAN-5 Power Sectors
0
ASEAN-5 Power Sectors
October 2016
ASEAN-5 Power Sectors
1
1` REGIONAL COMMENTARY October 2016
ASEAN-5 Power Sectors
Analytical Contacts
Chong Van Nee, CFA
Co-Head
Infrastructure & Utilities
Ratings
(603) 7628 1028
Adeline Poh
Senior Analyst
Infrastructure & Utilities
Ratings
(603) 7628 1021
Chinthamani Thanneermalai
Senior Analyst
Infrastructure & Utilities
Ratings
(603) 7628 1013
Nurhayati Sulaiman
Analyst
Infrastructure and Utilities
Ratings
(603) 7628 1040
Ong Ju Laine
Analyst
Infrastructure and Utilities
Ratings
(603) 7628 1183
Wang Wai Wah
Analyst
Infrastructure and Utilities
Ratings
(603) 7628 1110
Overview
The ASEAN-5 countries are home to 458 million people with a cumulative GDP of USD2.1 trillion in
2015. As emerging markets, these nations have been charting healthy economic growth, with a 5-year
CAGR of 3.7% (2010: USD1.8 trillion).1 Fuelled by their robust economies, rapid industralisation and
expanding populations, electricity demand has also risen accordingly, with a 5-year CAGR of 4.8%.
This growing demand for electricity necessitates a steady source of power supply. Nonetheless, efforts
to close the supply-demand gap have often posed challenges to certain countries. While Malaysia,
Singapore and Thailand have excellent access to electricity supply, Indonesia and the Philippines have
experienced huge power deficits, as underlined by their electrification rate of less than 90% (refer to
Chart 1).
IPPs play important role in power generation. Apart from playing the role of regulator and
policy planner, the governments of some countries have assumed complete or extensive control
of their key utility companies. The power sectors of 3 of the ASEAN-5 countries are structured as
single-buyer frameworks. In Malaysia, Indonesia and Thailand, national and state utility
companies monopolise their respective jurisdictions and act as sole offtakers for independent
power producers (IPPs), thereby eliminating competition and demand risk. On the other hand,
Singapore and the Philippines operate liberalised retail electricity markets. Private participation
has played a key role in the ASEAN-5‟s power sectors, where IPPs contribute more than half of
these countries‟ aggregate installed capacity (refer to Chart 2).
1 Source: World Bank
ASEAN-5 Power Sectors
2
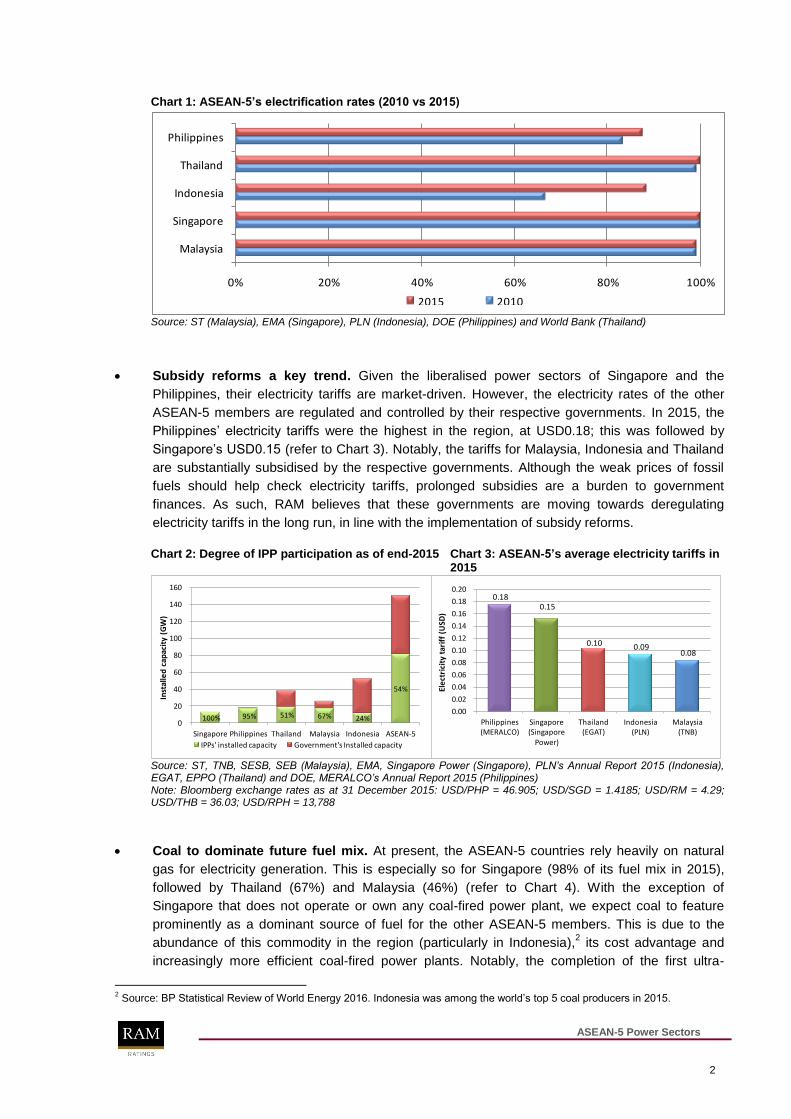
Chart 1: ASEAN-5’s electrification rates (2010 vs 2015)
0% 20% 40% 60% 80% 100%
Malaysia
Singapore
Indonesia
Thailand
Philippines
2015 2010
Source: ST (Malaysia), EMA (Singapore), PLN (Indonesia), DOE (Philippines) and World Bank (Thailand)
Subsidy reforms a key trend. Given the liberalised power sectors of Singapore and the
Philippines, their electricity tariffs are market-driven. However, the electricity rates of the other
ASEAN-5 members are regulated and controlled by their respective governments. In 2015, the
Philippines‟ electricity tariffs were the highest in the region, at USD0.18; this was followed by
Singapore‟s USD0.15 (refer to Chart 3). Notably, the tariffs for Malaysia, Indonesia and Thailand
are substantially subsidised by the respective governments. Although the weak prices of fossil
fuels should help check electricity tariffs, prolonged subsidies are a burden to government
finances. As such, RAM believes that these governments are moving towards deregulating
electricity tariffs in the long run, in line with the implementation of subsidy reforms.
Chart 2: Degree of IPP participation as of end-2015 Chart 3: ASEAN-5’s average electricity tariffs in
2015
100% 95% 51% 67% 24%
54%
0
20
40
60
80
100
120
140
160
Singapore Philippines Thailand Malaysia Indonesia ASEAN-5
Inst
alle
d c
apac
ity
(GW
)
IPPs' installed capacity Government's Installed capacity
0.18 0.15
0.10 0.09 0.08
0.00
0.02
0.04
0.06
0.08
0.10
0.12
0.14
0.16
0.18
0.20
Philippines (MERALCO)
Singapore (Singapore
Power)
Thailand (EGAT)
Indonesia (PLN)
Malaysia (TNB)
Ele
ctri
city
tar
iff
(USD
)
Source: ST, TNB, SESB, SEB (Malaysia), EMA, Singapore Power (Singapore), PLN’s Annual Report 2015 (Indonesia), EGAT, EPPO (Thailand) and DOE, MERALCO’s Annual Report 2015 (Philippines) Note: Bloomberg exchange rates as at 31 December 2015: USD/PHP = 46.905; USD/SGD = 1.4185; USD/RM = 4.29; USD/THB = 36.03; USD/RPH = 13,788
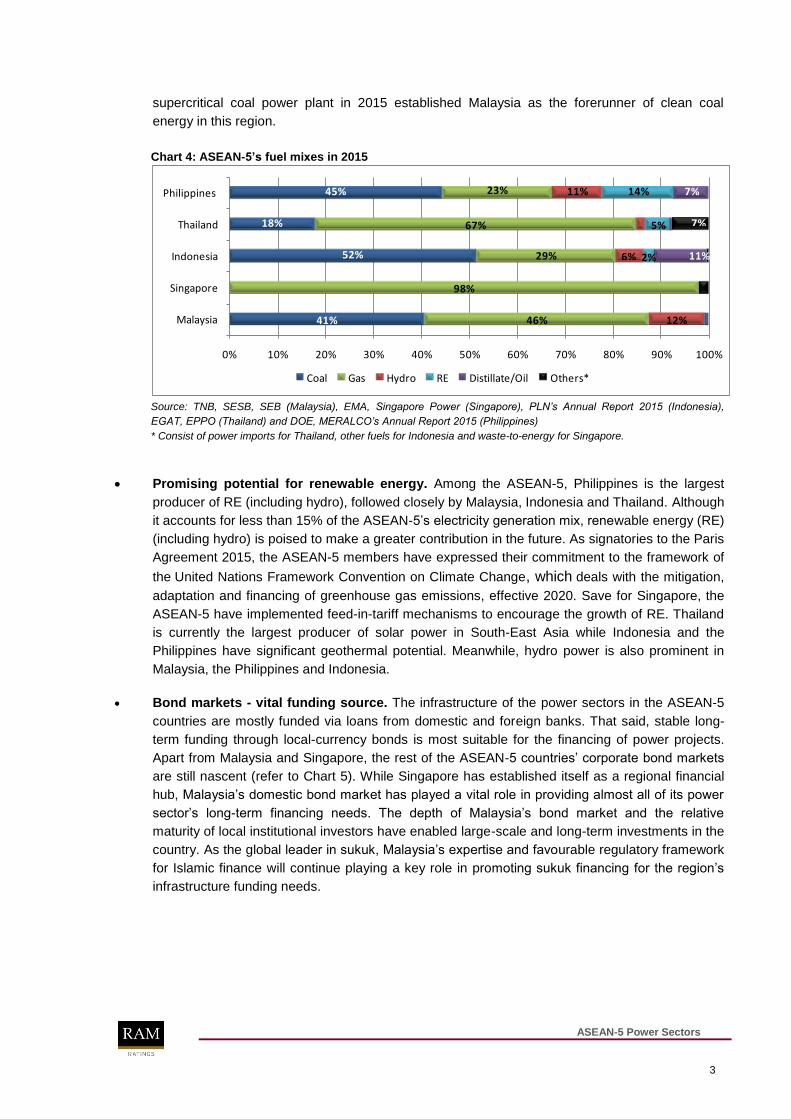
Coal to dominate future fuel mix. At present, the ASEAN-5 countries rely heavily on natural
gas for electricity generation. This is especially so for Singapore (98% of its fuel mix in 2015),
followed by Thailand (67%) and Malaysia (46%) (refer to Chart 4). With the exception of
Singapore that does not operate or own any coal-fired power plant, we expect coal to feature
prominently as a dominant source of fuel for the other ASEAN-5 members. This is due to the
abundance of this commodity in the region (particularly in Indonesia),2 its cost advantage and
increasingly more efficient coal-fired power plants. Notably, the completion of the first ultra-
2 Source: BP Statistical Review of World Energy 2016. Indonesia was among the world‟s top 5 coal producers in 2015.
ASEAN-5 Power Sectors
3
supercritical coal power plant in 2015 established Malaysia as the forerunner of clean coal
energy in this region.
Chart 4: ASEAN-5’s fuel mixes in 2015
41%
52%
18%
45%
46%
98%
29%
67%
23%
12%
11%
5%
14% 7%
0% 10% 20% 30% 40% 50% 60% 70% 80% 90% 100%
Malaysia
Singapore
Indonesia
Thailand
Philippines
Coal Gas Hydro RE Distillate/Oil Others*
2%6% 11%
7%
Source: TNB, SESB, SEB (Malaysia), EMA, Singapore Power (Singapore), PLN’s Annual Report 2015 (Indonesia),
EGAT, EPPO (Thailand) and DOE, MERALCO’s Annual Report 2015 (Philippines)
* Consist of power imports for Thailand, other fuels for Indonesia and waste-to-energy for Singapore.
Promising potential for renewable energy. Among the ASEAN-5, Philippines is the largest
producer of RE (including hydro), followed closely by Malaysia, Indonesia and Thailand. Although
it accounts for less than 15% of the ASEAN-5‟s electricity generation mix, renewable energy (RE)
(including hydro) is poised to make a greater contribution in the future. As signatories to the Paris
Agreement 2015, the ASEAN-5 members have expressed their commitment to the framework of
the United Nations Framework Convention on Climate Change, which deals with the mitigation,
adaptation and financing of greenhouse gas emissions, effective 2020. Save for Singapore, the
ASEAN-5 have implemented feed-in-tariff mechanisms to encourage the growth of RE. Thailand
is currently the largest producer of solar power in South-East Asia while Indonesia and the
Philippines have significant geothermal potential. Meanwhile, hydro power is also prominent in
Malaysia, the Philippines and Indonesia.
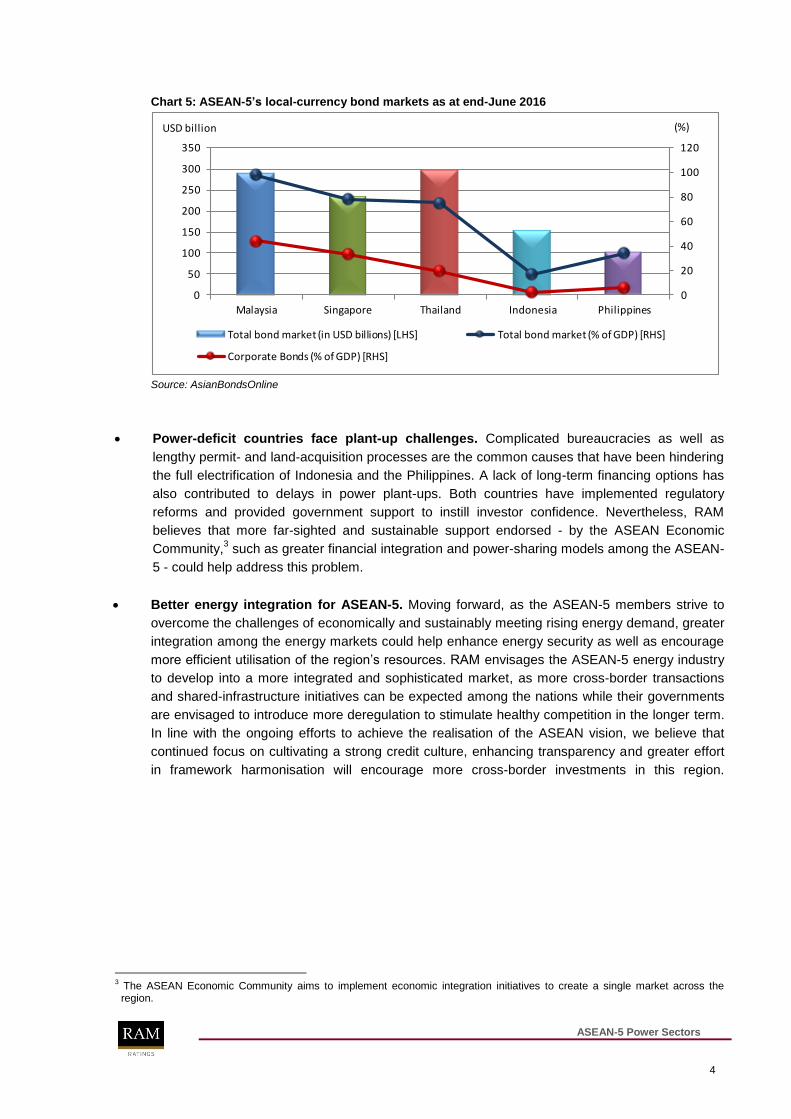
Bond markets - vital funding source. The infrastructure of the power sectors in the ASEAN-5
countries are mostly funded via loans from domestic and foreign banks. That said, stable long-
term funding through local-currency bonds is most suitable for the financing of power projects.
Apart from Malaysia and Singapore, the rest of the ASEAN-5 countries‟ corporate bond markets
are still nascent (refer to Chart 5). While Singapore has established itself as a regional financial
hub, Malaysia‟s domestic bond market has played a vital role in providing almost all of its power
sector‟s long-term financing needs. The depth of Malaysia‟s bond market and the relative
maturity of local institutional investors have enabled large-scale and long-term investments in the
country. As the global leader in sukuk, Malaysia‟s expertise and favourable regulatory framework
for Islamic finance will continue playing a key role in promoting sukuk financing for the region‟s
infrastructure funding needs.
ASEAN-5 Power Sectors
4
Chart 5: ASEAN-5’s local-currency bond markets as at end-June 2016
0
20
40
60
80
100
120
0
50
100
150
200
250
300
350
Malaysia Singapore Thailand Indonesia Philippines
Total bond market (in USD billions) [LHS] Total bond market (% of GDP) [RHS]
Corporate Bonds (% of GDP) [RHS]
USD billion (%)
Source: AsianBondsOnline
Power-deficit countries face plant-up challenges. Complicated bureaucracies as well as
lengthy permit- and land-acquisition processes are the common causes that have been hindering
the full electrification of Indonesia and the Philippines. A lack of long-term financing options has
also contributed to delays in power plant-ups. Both countries have implemented regulatory
reforms and provided government support to instill investor confidence. Nevertheless, RAM
believes that more far-sighted and sustainable support endorsed - by the ASEAN Economic
Community,3 such as greater financial integration and power-sharing models among the ASEAN-
5 - could help address this problem.
Better energy integration for ASEAN-5. Moving forward, as the ASEAN-5 members strive to
overcome the challenges of economically and sustainably meeting rising energy demand, greater
integration among the energy markets could help enhance energy security as well as encourage
more efficient utilisation of the region‟s resources. RAM envisages the ASEAN-5 energy industry
to develop into a more integrated and sophisticated market, as more cross-border transactions
and shared-infrastructure initiatives can be expected among the nations while their governments
are envisaged to introduce more deregulation to stimulate healthy competition in the longer term.
In line with the ongoing efforts to achieve the realisation of the ASEAN vision, we believe that
continued focus on cultivating a strong credit culture, enhancing transparency and greater effort
in framework harmonisation will encourage more cross-border investments in this region.
3 The ASEAN Economic Community aims to implement economic integration initiatives to create a single market across the region.
ASEAN-5 Power Sectors
5
ASEAN-5 Power Sectors
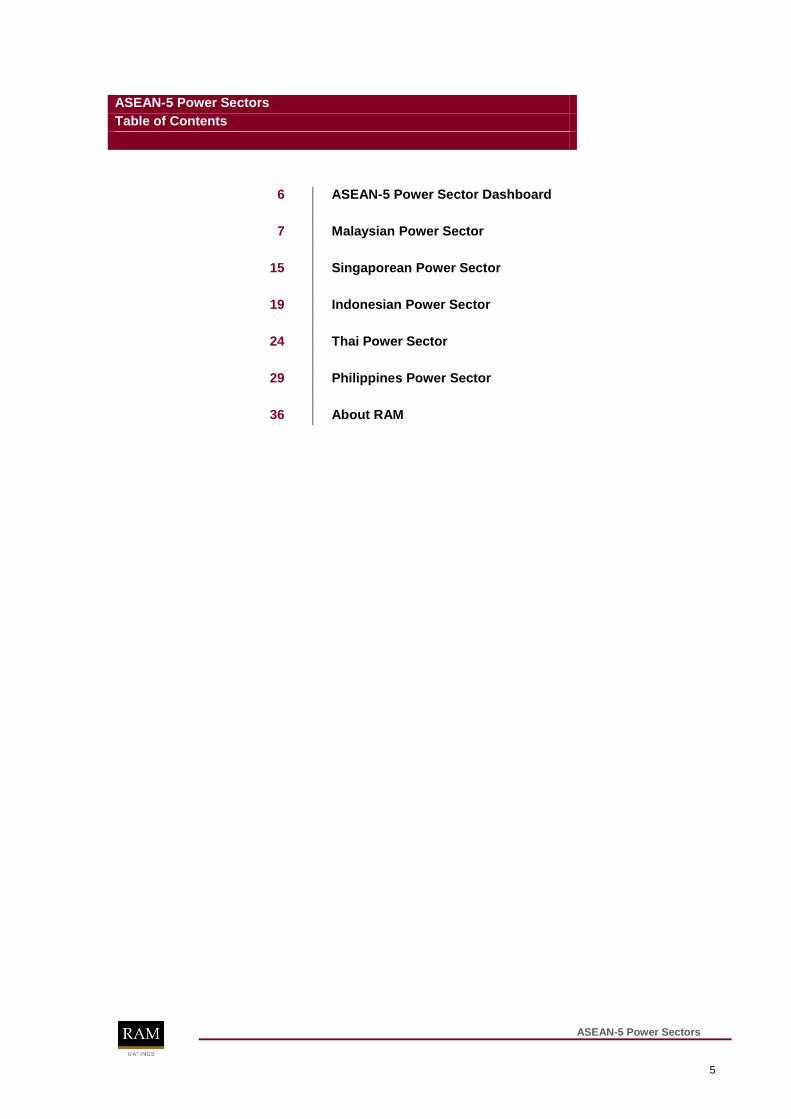
Table of Contents
6 ASEAN-5 Power Sector Dashboard
7 Malaysian Power Sector
15 Singaporean Power Sector
19 Indonesian Power Sector
24 Thai Power Sector
29 Philippines Power Sector
36 About RAM
ASEAN-5 Power Sectors
6
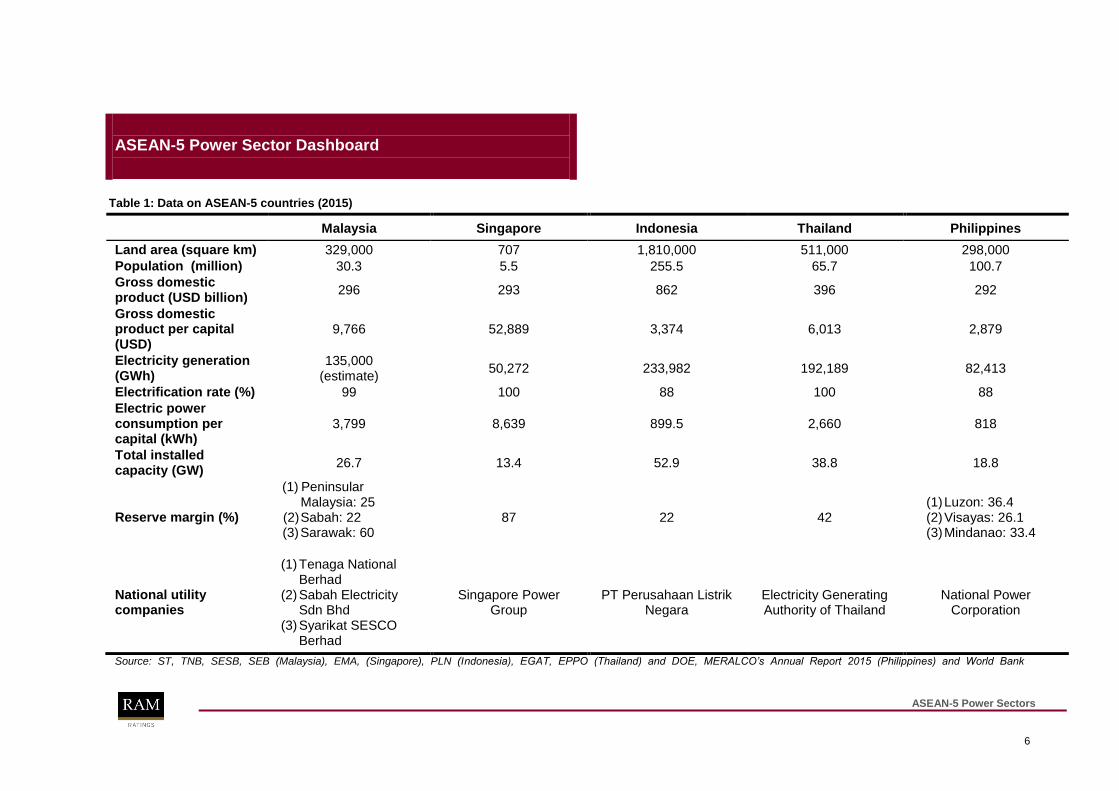
ASEAN-5 Power Sector Dashboard
Table 1: Data on ASEAN-5 countries (2015)
Malaysia Singapore Indonesia Thailand Philippines
Land area (square km) 329,000 707 1,810,000 511,000 298,000
Population (million) 30.3 5.5 255.5 65.7 100.7
Gross domestic product (USD billion)
296 293 862 396 292
Gross domestic product per capital (USD)
9,766 52,889 3,374 6,013 2,879
Electricity generation (GWh)
135,000 (estimate)
50,272 233,982 192,189 82,413
Electrification rate (%) 99 100 88 100 88
Electric power consumption per capital (kWh)
3,799 8,639 899.5 2,660 818
Total installed capacity (GW)
26.7 13.4 52.9 38.8 18.8
Reserve margin (%)
(1) Peninsular Malaysia: 25
(2) Sabah: 22 (3) Sarawak: 60
87 22 42 (1) Luzon: 36.4 (2) Visayas: 26.1 (3) Mindanao: 33.4
National utility companies
(1) Tenaga National Berhad
(2) Sabah Electricity Sdn Bhd
(3) Syarikat SESCO Berhad
Singapore Power Group
PT Perusahaan Listrik Negara
Electricity Generating Authority of Thailand
National Power Corporation
Source: ST, TNB, SESB, SEB (Malaysia), EMA, (Singapore), PLN (Indonesia), EGAT, EPPO (Thailand) and DOE, MERALCO’s Annual Report 2015 (Philippines) and World Bank
ASEAN-5 Power Sectors
7
Adeline Poh Senior Analyst Infrastructure & Utilities Ratings
(603) 7628 1021
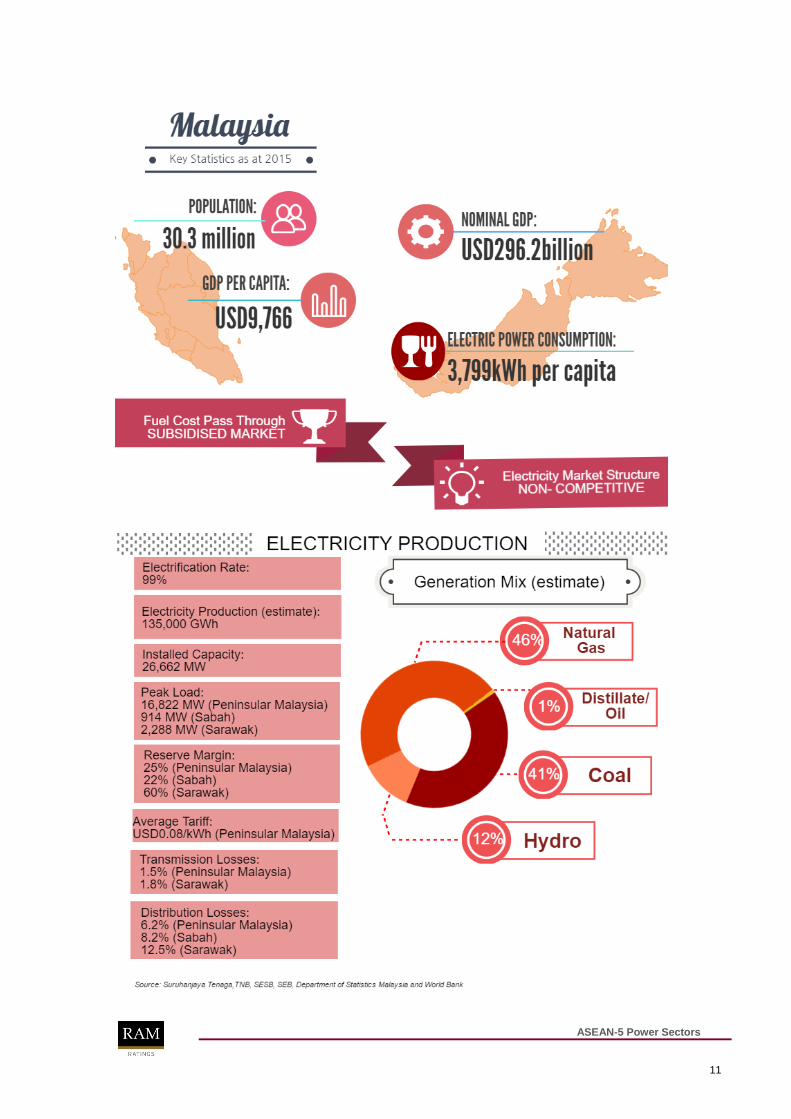
Electricity demand supported by industrial growth. Backed by its strong economic
fundamentals, Malaysia‟s growth has been resilient. In the last decade, GDP has charted a
CAGR of 5.3%. The nation has changed from an agricultural- and commodity-based economy to
one fuelled by manufacturing and services. In 2015, demand for electricity increased 2.5% y-o-y
to 124,695 GWh, driven by the expansion of electricity sales to domestic customers (+3.7%) and
the commercial sector (+3.0%).4 We expect demand to keep increasing at about 2% to 3% per
annum, supported by the continued implementation of the Economic Transformation Programme,
various development corridors and the 11th Malaysia Plan (11MP).
National and state utilities dominate. Malaysia has a well-developed power infrastructure, with
an electrification rate of 99% against its population of 30 million as of 2015.5 The sector is divided
into 3 separate grids, in accordance with geographical delineation. Tenaga Nasional Berhad
(TNB) is the national utility company that dominates the national grid in Peninsular Malaysia. In
East Malaysia, Sabah Electricity Sdn Bhd (SESB) and Sarawak Energy Berhad - via Syarikat
SESCO Berhad (SESCO) - control the respective grids of Sabah and Sarawak. These national
and state-controlled utility companies monopolise all the transmission and distribution (T&D)
assets within their respective grids.6 Except for Sabah, the utility companies also command the
lion‟s share of generating capacity. In power generation, private participation comes in the form of
IPPs. The national and state utility companies play a crucial role as the sole off-takers for the
generating capacity and electrical energy produced by all the IPPs.
Solid government support. Apart from majority ownership of TNB via various agencies,
subsidised gas and periodic tariff reviews also form part of the implicit government support
received by the national utility giant. In Sabah, SESB‟s financial profile is underscored by
significant support from the Government of Malaysia (GoM) in the form of direct fuel subsidies,
development grants and soft loans. The Sarawakian power industry, meanwhile, is tightly
controlled by the state government, which is involved in the entire supply chain – as the policy
planner, regulator and owner as well as operator of almost all the power-related infrastructure
there. While the financial profiles of the 3 utility companies are fundamentally different, RAM has
a favourable view of their credit profiles given their strategic functions and solid relationships with
the relevant governments.
More transparent tariff-setting mechanism. TNB‟s tariff adjustments take into consideration
changes in fuel prices, albeit in a less structured manner. The incentive-based regulation (IBR)
was introduced in 2014; it allows a review of electricity tariffs every 6 months to take into account
changes in fuel costs via the Imbalance Cost Pass-Through (ICPT) mechanism, to reflect the
market prices of all fuel-related and other generation-specific costs. Any excess (or reduction in)
fuel cost is passed on to consumers via tariff adjustments. We have a positive view of the IBR as
it provides TNB with stable returns throughout the 3-year regulatory periods, which should help
4 Source: TNB, SESB and SEB.
5 World Bank 6 Apart from the national and state utility companies, NUR Power Sdn Bhd is the only independent power company (220 MW) licensed to generate, distribute and sell electricity to tenants at the Kulim Hi-Tech Park in Kulim, Kedah, for 30 years until September 2028.
Malaysian Power Sector Energising a steady growth path
ASEAN-5 Power Sectors
8
preserve its long-term financial profile.
Coal – cheaper fuel source. As at end-May 2016, gas constituted the largest fuel cost for TNB
(about 51% of its total fuel expenses), closely followed by coal (40%). TNB‟s gas cost stems from
indigenous piped gas, which is subsidised by the GoM, and liquefied natural gas (LNG), which is
imported at market prices. Despite the subsidy, TNB‟s cost per unit of electricity generated by
gas-powered plants is still higher than that of coal (19.67 sen/kWh vs 9.13 sen/kWh for the 3
months ended 31 May 2016). Given its cost advantage, coal is expected to become the main fuel
component in power generation. Moreover, coal prices have declined more than 30% since
January 2014, to USD56.20/MT as at end-May 2016. While prices have been trending upwards
in recent months amid supply cuts and strong demand from China, they are still below the peak
in 2008.
Electricity tariff largely influenced by regulated piped gas price. In line with the GoM‟s
subsidy rationalisation, the price of regulated piped gas in the power sector rose to
RM19.70/mmBtu in June 2016 (from RM18.20/mmBtu previously). That said, the persistent
depression in oil and coal prices had kept the electricity tariff rebate at 1.52 sen/kWh for June
and December 2016, thus maintaining TNB‟s average net tariff at 37.01 sen/kWh. We believe the
GoM will maintain its subsidy-rationalisation programme by gradually elevating the regulated
price of piped gas. Although TNB‟s tariffs remain largely influenced by the price of piped gas, we
expect any upward revision to be moderated by the weaker coal and LNG prices.
Government-dictated tariff reviews for Sabah and Sarawak. While under the same regulatory
purview as Peninsular Malaysia, Sabah‟s tariff reviews do not follow the IBR framework. The last
revision took place in January 2014. Notably, Sabah‟s average net tariff of 33.32 sen/kWh is still
lower than Peninsular Malaysia‟s 37.01 sen/kWh, but higher than Sarawak‟s 19.94 sen/kWh.7
SESB relies heavily on more expensive diesel-powered generation and is required to incur higher
network costs given Sabah‟s low population density. As such, SESB‟s tariffs cannot cover its
hefty operating costs; hence financial support from the GoM is necessary to sustain its daily
operations. Thanks to this financial backing, SESB remains a timely paymaster to all the IPPs in
Sabah. Similarly, Sarawak‟s electricity tariffs are solely dictated by the state government. In line
with the gradual reduction of SESCO‟s operating costs amid the increasing proportion of hydro-
power capacity in its generation mix, the state government has effected tariff reductions for the
domestic, commercial and industrial segments.
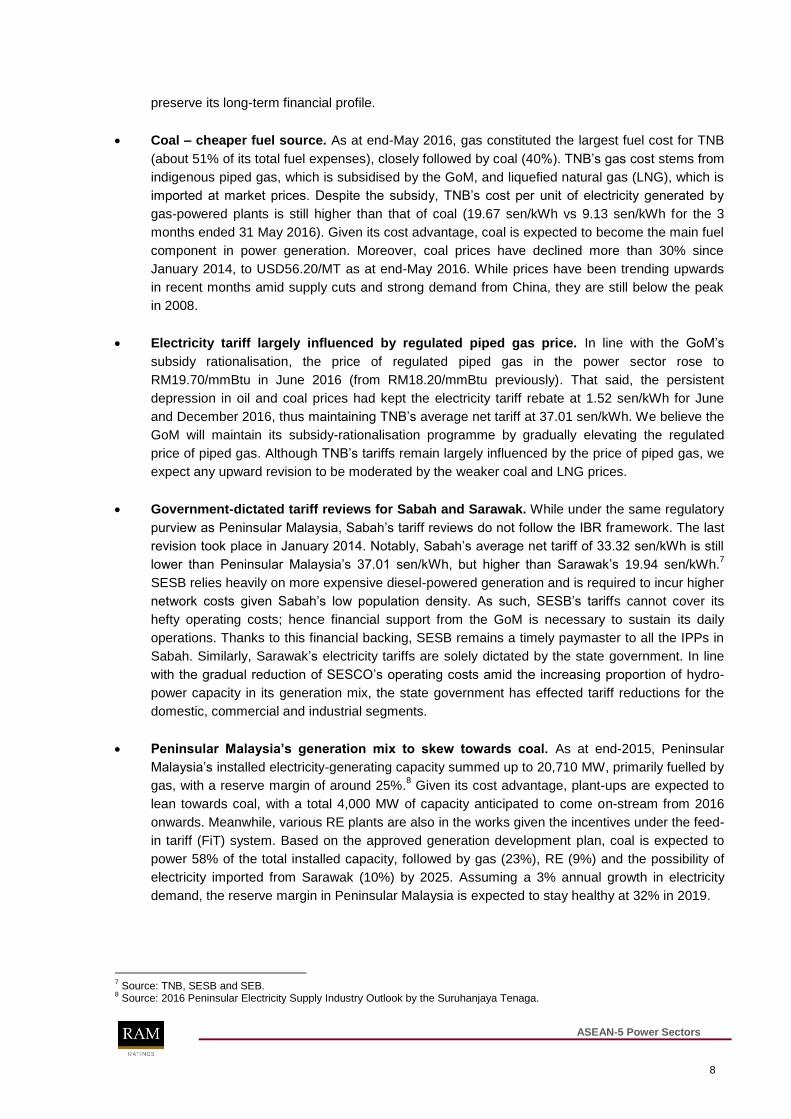
Peninsular Malaysia’s generation mix to skew towards coal. As at end-2015, Peninsular
Malaysia‟s installed electricity-generating capacity summed up to 20,710 MW, primarily fuelled by
gas, with a reserve margin of around 25%.8 Given its cost advantage, plant-ups are expected to
lean towards coal, with a total 4,000 MW of capacity anticipated to come on-stream from 2016
onwards. Meanwhile, various RE plants are also in the works given the incentives under the feed-
in tariff (FiT) system. Based on the approved generation development plan, coal is expected to
power 58% of the total installed capacity, followed by gas (23%), RE (9%) and the possibility of
electricity imported from Sarawak (10%) by 2025. Assuming a 3% annual growth in electricity
demand, the reserve margin in Peninsular Malaysia is expected to stay healthy at 32% in 2019.
7 Source: TNB, SESB and SEB.
8 Source: 2016 Peninsular Electricity Supply Industry Outlook by the Suruhanjaya Tenaga.
ASEAN-5 Power Sectors
9
Chart 1: Generation mix in Peninsular Malaysia
46%
1%
49%
4%FY Aug 2015
Coal
Distillate/Oil
Gas
Hydro
58%23%
5% 10%
4%
Coal
Gas
Hydro
Sarawak
RE
2025
Source: TNB, ST
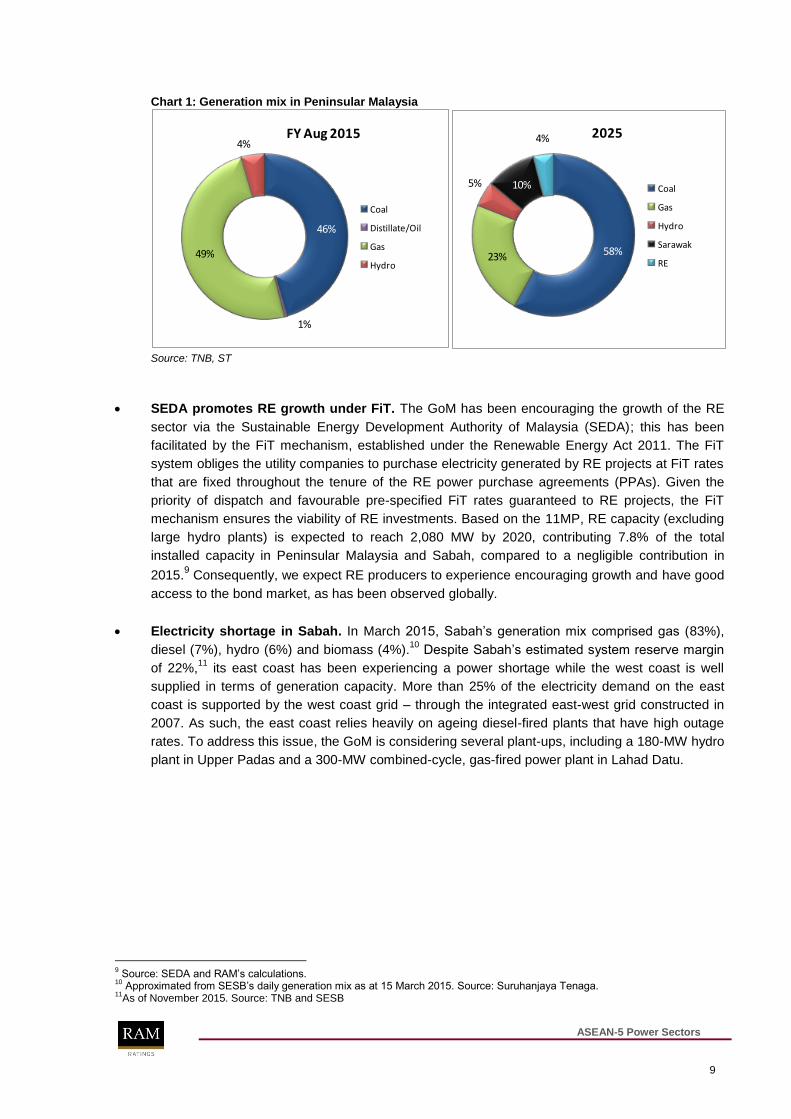
SEDA promotes RE growth under FiT. The GoM has been encouraging the growth of the RE
sector via the Sustainable Energy Development Authority of Malaysia (SEDA); this has been
facilitated by the FiT mechanism, established under the Renewable Energy Act 2011. The FiT
system obliges the utility companies to purchase electricity generated by RE projects at FiT rates
that are fixed throughout the tenure of the RE power purchase agreements (PPAs). Given the
priority of dispatch and favourable pre-specified FiT rates guaranteed to RE projects, the FiT
mechanism ensures the viability of RE investments. Based on the 11MP, RE capacity (excluding
large hydro plants) is expected to reach 2,080 MW by 2020, contributing 7.8% of the total
installed capacity in Peninsular Malaysia and Sabah, compared to a negligible contribution in
2015.9 Consequently, we expect RE producers to experience encouraging growth and have good
access to the bond market, as has been observed globally.
Electricity shortage in Sabah. In March 2015, Sabah‟s generation mix comprised gas (83%),
diesel (7%), hydro (6%) and biomass (4%).10
Despite Sabah‟s estimated system reserve margin
of 22%,11
its east coast has been experiencing a power shortage while the west coast is well
supplied in terms of generation capacity. More than 25% of the electricity demand on the east
coast is supported by the west coast grid – through the integrated east-west grid constructed in
2007. As such, the east coast relies heavily on ageing diesel-fired plants that have high outage
rates. To address this issue, the GoM is considering several plant-ups, including a 180-MW hydro
plant in Upper Padas and a 300-MW combined-cycle, gas-fired power plant in Lahad Datu.
9 Source: SEDA and RAM‟s calculations.
10 Approximated from SESB‟s daily generation mix as at 15 March 2015. Source: Suruhanjaya Tenaga.
11As of November 2015. Source: TNB and SESB
ASEAN-5 Power Sectors
10
Abundant hydro power in Sarawak. The Sarawak Corridor of Renewable Energy (SCORE) has
prompted Sarawak Energy to embark on an aggressive expansion programme, to harness the
state‟s abundant hydro-power potential of more than 20,000 MW. The full operation of the 2,400-
MW Bakun dam in July 2014 and the 944-MW Murum dam in 2Q 2015 is expected to raise
Sarawak‟s generating capacity to around 3,600 MW (on a firm basis). Meanwhile, the SCORE
continues to chart gradual growth, with 14 PPAs (accounting for about 2,764 MW of electricity
supply) already signed. Sarawak targets a long-term generation mix of 60% from hydro plants,
with another 20% each from gas and coal-fired plants, respectively.12
Funding needs well met by bond issues. As power infrastructure projects typically have
lengthy gestation periods, they generally require longer-term financing, which has been well met
by Malaysia‟s matured bond market. Furthermore, the domestic power sector is characterised by
a supportive regulatory landscape, robust PPA terms, and strong sponsors as well as
counterparties. These are the key catalysts that have been driving the growth of power bonds in
the country. Since the first IPP bond issue by YTL Power Generation Sdn Bhd in 1993, the power
industry has been one of most active sectors vis-à-vis continuously tapping the Malaysian bond
market for its funding needs, with tenures ranging from 3 to 29 years. Power bonds account for
some 37% of Malaysia‟s RM220.4 billion (USD55 billion)13
of infrastructure bonds issued in the
last decade.
Deep and matured domestic bond market. Home to one of Asia‟s deepest local-currency debt
capital markets, Malaysia‟s outstanding bonds amounted to RM1.2 trillion (USD288.8 billion) as
at end-June 2016 (equivalent to 98% of its GDP).14
It is the third-largest bond market in Asia15
relative to the size of its GDP, after Japan and South Korea. Malaysia also leads the global sukuk
market, with 54% of total outstanding sukuk as at end-May 2016. Sukuk has become more
prominent over the years, with more than 94% of IPP bond issues comprising sukuk after 2000,
compared to only 25% before that. We further highlight that all of Malaysia‟s outstanding IPP
bonds - amounting to RM40.9 billion - are sukuk issues.16
The depth of the domestic bond market
and the relative maturity of local institutional investors allow large-scale and long-term
investments in Malaysia.
12
Source: Sarawak Energy, http://www.theborneopost.com/2015/03/25/seb-to-build-more-thermal-power-plants-in-next-nine-years/
13 Source: Bank Negara Malaysia; BNM Middle Rate as at 12 August 2016: RM4.0105 per USD.
14 Source: AsianBondsOnline.
15 Asian countries here refer to the People‟s Republic of China, Hong Kong, Indonesia, Japan, South Korea, Malaysia, the Philippines, Singapore, Thailand and Vietnam.
16 Source: FAST Bank Negara Malaysia as at 11 August 2016.
ASEAN-5 Power Sectors
11
ASEAN-5 Power Sectors
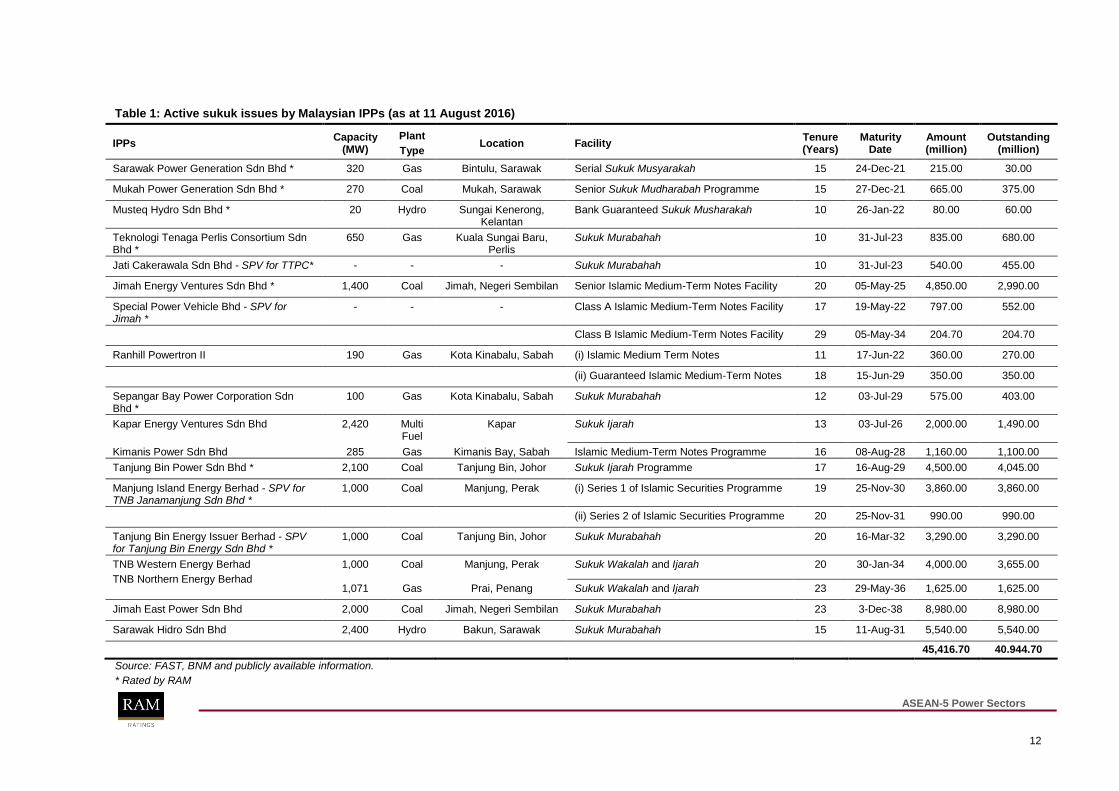
12
Table 1: Active sukuk issues by Malaysian IPPs (as at 11 August 2016)
IPPs Capacity
(MW)
Plant
Type Location Facility
Tenure (Years)
Maturity Date
Amount (million)
Outstanding (million)
Sarawak Power Generation Sdn Bhd * 320 Gas Bintulu, Sarawak Serial Sukuk Musyarakah 15 24-Dec-21 215.00 30.00
Mukah Power Generation Sdn Bhd * 270 Coal Mukah, Sarawak Senior Sukuk Mudharabah Programme 15 27-Dec-21 665.00 375.00
Musteq Hydro Sdn Bhd * 20 Hydro Sungai Kenerong, Kelantan
Bank Guaranteed Sukuk Musharakah 10 26-Jan-22 80.00 60.00
Teknologi Tenaga Perlis Consortium Sdn Bhd *
650 Gas Kuala Sungai Baru, Perlis
Sukuk Murabahah 10 31-Jul-23 835.00 680.00
Jati Cakerawala Sdn Bhd - SPV for TTPC* - - - Sukuk Murabahah 10 31-Jul-23 540.00 455.00
Jimah Energy Ventures Sdn Bhd * 1,400 Coal Jimah, Negeri Sembilan Senior Islamic Medium-Term Notes Facility 20 05-May-25 4,850.00 2,990.00
Special Power Vehicle Bhd - SPV for Jimah *
- - - Class A Islamic Medium-Term Notes Facility 17 19-May-22 797.00 552.00
Class B Islamic Medium-Term Notes Facility 29 05-May-34 204.70 204.70
Ranhill Powertron II 190 Gas Kota Kinabalu, Sabah (i) Islamic Medium Term Notes 11 17-Jun-22 360.00 270.00
(ii) Guaranteed Islamic Medium-Term Notes 18 15-Jun-29 350.00 350.00
Sepangar Bay Power Corporation Sdn Bhd *
100 Gas Kota Kinabalu, Sabah Sukuk Murabahah 12 03-Jul-29 575.00 403.00
Kapar Energy Ventures Sdn Bhd 2,420 Multi Fuel
Kapar Sukuk Ijarah 13 03-Jul-26 2,000.00 1,490.00
Kimanis Power Sdn Bhd 285 Gas Kimanis Bay, Sabah Islamic Medium-Term Notes Programme 16 08-Aug-28 1,160.00 1,100.00
Tanjung Bin Power Sdn Bhd * 2,100 Coal Tanjung Bin, Johor Sukuk Ijarah Programme 17 16-Aug-29 4,500.00 4,045.00
Manjung Island Energy Berhad - SPV for TNB Janamanjung Sdn Bhd *
1,000 Coal Manjung, Perak (i) Series 1 of Islamic Securities Programme 19 25-Nov-30 3,860.00 3,860.00
(ii) Series 2 of Islamic Securities Programme 20 25-Nov-31 990.00 990.00
Tanjung Bin Energy Issuer Berhad - SPV for Tanjung Bin Energy Sdn Bhd *
1,000 Coal Tanjung Bin, Johor Sukuk Murabahah 20 16-Mar-32 3,290.00 3,290.00
TNB Western Energy Berhad
TNB Northern Energy Berhad
1,000 Coal Manjung, Perak Sukuk Wakalah and Ijarah 20 30-Jan-34 4,000.00 3,655.00
1,071 Gas Prai, Penang Sukuk Wakalah and Ijarah 23 29-May-36 1,625.00 1,625.00
Jimah East Power Sdn Bhd 2,000 Coal Jimah, Negeri Sembilan Sukuk Murabahah 23 3-Dec-38 8,980.00 8,980.00
Sarawak Hidro Sdn Bhd 2,400 Hydro Bakun, Sarawak Sukuk Murabahah 15 11-Aug-31 5,540.00 5,540.00
45,416.70 40.944.70
Source: FAST, BNM and publicly available information.
* Rated by RAM
ASEAN-5 Power Sectors
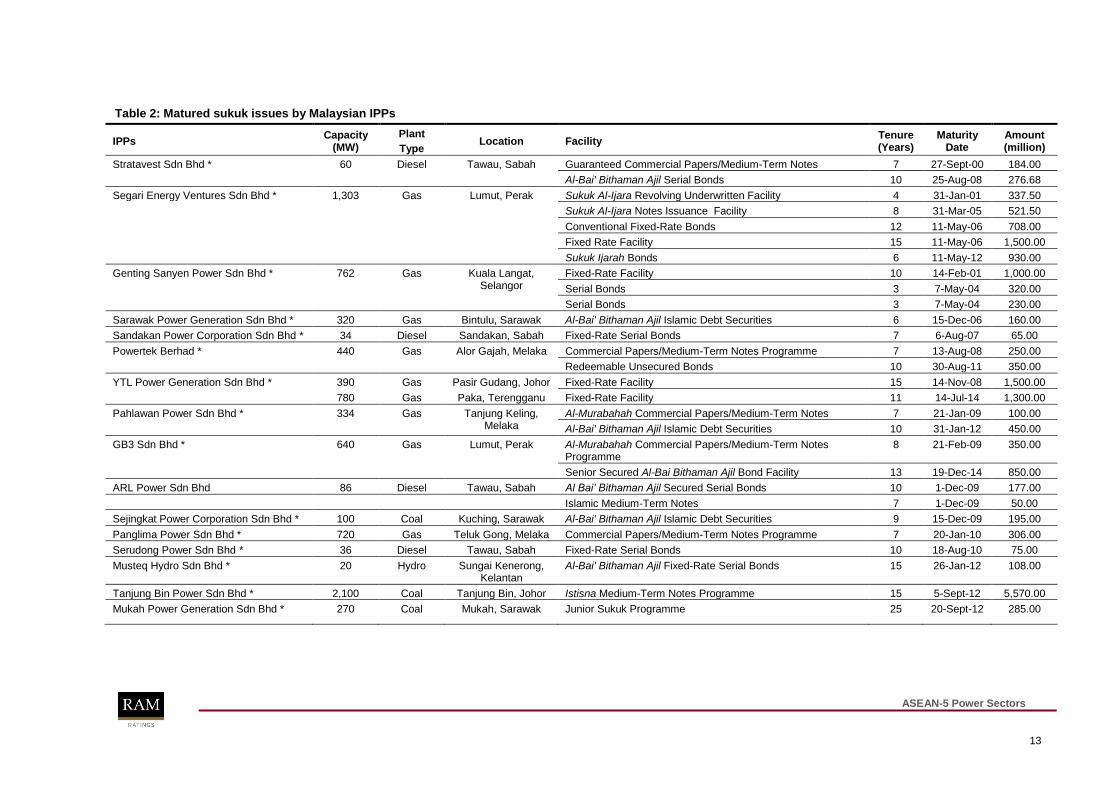
13
Table 2: Matured sukuk issues by Malaysian IPPs
IPPs Capacity
(MW)
Plant
Type Location Facility
Tenure (Years)
Maturity Date
Amount (million)
Stratavest Sdn Bhd * 60 Diesel Tawau, Sabah Guaranteed Commercial Papers/Medium-Term Notes 7 27-Sept-00 184.00
Al-Bai' Bithaman Ajil Serial Bonds 10 25-Aug-08 276.68
Segari Energy Ventures Sdn Bhd * 1,303 Gas Lumut, Perak Sukuk Al-Ijara Revolving Underwritten Facility 4 31-Jan-01 337.50
Sukuk Al-Ijara Notes Issuance Facility 8 31-Mar-05 521.50
Conventional Fixed-Rate Bonds 12 11-May-06 708.00
Fixed Rate Facility 15 11-May-06 1,500.00
Sukuk Ijarah Bonds 6 11-May-12 930.00
Genting Sanyen Power Sdn Bhd * 762 Gas Kuala Langat, Selangor
Fixed-Rate Facility 10 14-Feb-01 1,000.00
Serial Bonds 3 7-May-04 320.00
Serial Bonds 3 7-May-04 230.00
Sarawak Power Generation Sdn Bhd * 320 Gas Bintulu, Sarawak Al-Bai' Bithaman Ajil Islamic Debt Securities 6 15-Dec-06 160.00
Sandakan Power Corporation Sdn Bhd * 34 Diesel Sandakan, Sabah Fixed-Rate Serial Bonds 7 6-Aug-07 65.00
Powertek Berhad * 440 Gas Alor Gajah, Melaka Commercial Papers/Medium-Term Notes Programme 7 13-Aug-08 250.00
Redeemable Unsecured Bonds 10 30-Aug-11 350.00
YTL Power Generation Sdn Bhd * 390 Gas Pasir Gudang, Johor Fixed-Rate Facility 15 14-Nov-08 1,500.00
780 Gas Paka, Terengganu Fixed-Rate Facility 11 14-Jul-14 1,300.00
Pahlawan Power Sdn Bhd * 334 Gas Tanjung Keling, Melaka
Al-Murabahah Commercial Papers/Medium-Term Notes 7 21-Jan-09 100.00
Al-Bai' Bithaman Ajil Islamic Debt Securities 10 31-Jan-12 450.00
GB3 Sdn Bhd * 640 Gas Lumut, Perak Al-Murabahah Commercial Papers/Medium-Term Notes Programme
8 21-Feb-09 350.00
Senior Secured Al-Bai Bithaman Ajil Bond Facility 13 19-Dec-14 850.00
ARL Power Sdn Bhd 86 Diesel Tawau, Sabah Al Bai’ Bithaman Ajil Secured Serial Bonds 10 1-Dec-09 177.00
Islamic Medium-Term Notes 7 1-Dec-09 50.00
Sejingkat Power Corporation Sdn Bhd * 100 Coal Kuching, Sarawak Al-Bai' Bithaman Ajil Islamic Debt Securities 9 15-Dec-09 195.00
Panglima Power Sdn Bhd * 720 Gas Teluk Gong, Melaka Commercial Papers/Medium-Term Notes Programme 7 20-Jan-10 306.00
Serudong Power Sdn Bhd * 36 Diesel Tawau, Sabah Fixed-Rate Serial Bonds 10 18-Aug-10 75.00
Musteq Hydro Sdn Bhd * 20 Hydro Sungai Kenerong, Kelantan
Al-Bai' Bithaman Ajil Fixed-Rate Serial Bonds 15 26-Jan-12 108.00
Tanjung Bin Power Sdn Bhd * 2,100 Coal Tanjung Bin, Johor Istisna Medium-Term Notes Programme 15 5-Sept-12 5,570.00
Mukah Power Generation Sdn Bhd * 270 Coal Mukah, Sarawak Junior Sukuk Programme 25 20-Sept-12 285.00
ASEAN-5 Power Sectors
14
IPPs Capacity
(MW)
Plant
Type Location Facility
Tenure (Years)
Maturity Date
Amount (million)
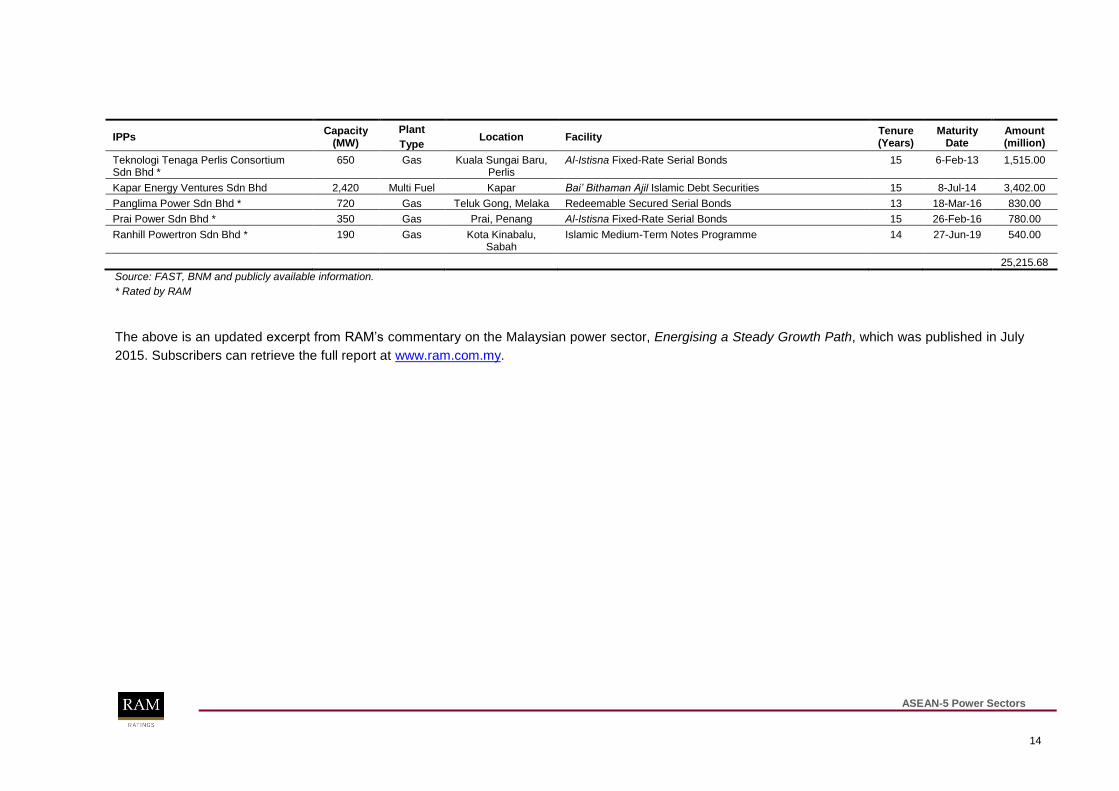
Teknologi Tenaga Perlis Consortium Sdn Bhd *
650 Gas Kuala Sungai Baru, Perlis
Al-Istisna Fixed-Rate Serial Bonds 15 6-Feb-13 1,515.00
Kapar Energy Ventures Sdn Bhd 2,420 Multi Fuel Kapar Bai’ Bithaman Ajil Islamic Debt Securities 15 8-Jul-14 3,402.00
Panglima Power Sdn Bhd * 720 Gas Teluk Gong, Melaka Redeemable Secured Serial Bonds 13 18-Mar-16 830.00
Prai Power Sdn Bhd * 350 Gas Prai, Penang Al-Istisna Fixed-Rate Serial Bonds 15 26-Feb-16 780.00
Ranhill Powertron Sdn Bhd * 190 Gas Kota Kinabalu, Sabah
Islamic Medium-Term Notes Programme 14 27-Jun-19 540.00
25,215.68
Source: FAST, BNM and publicly available information.
* Rated by RAM
The above is an updated excerpt from RAM‟s commentary on the Malaysian power sector, Energising a Steady Growth Path, which was published in July
2015. Subscribers can retrieve the full report at www.ram.com.my.

ASEAN-5 Power Sectors
15
Wang Wai Wah Analyst Infrastructure & Utilities Ratings
(603) 7628 1110
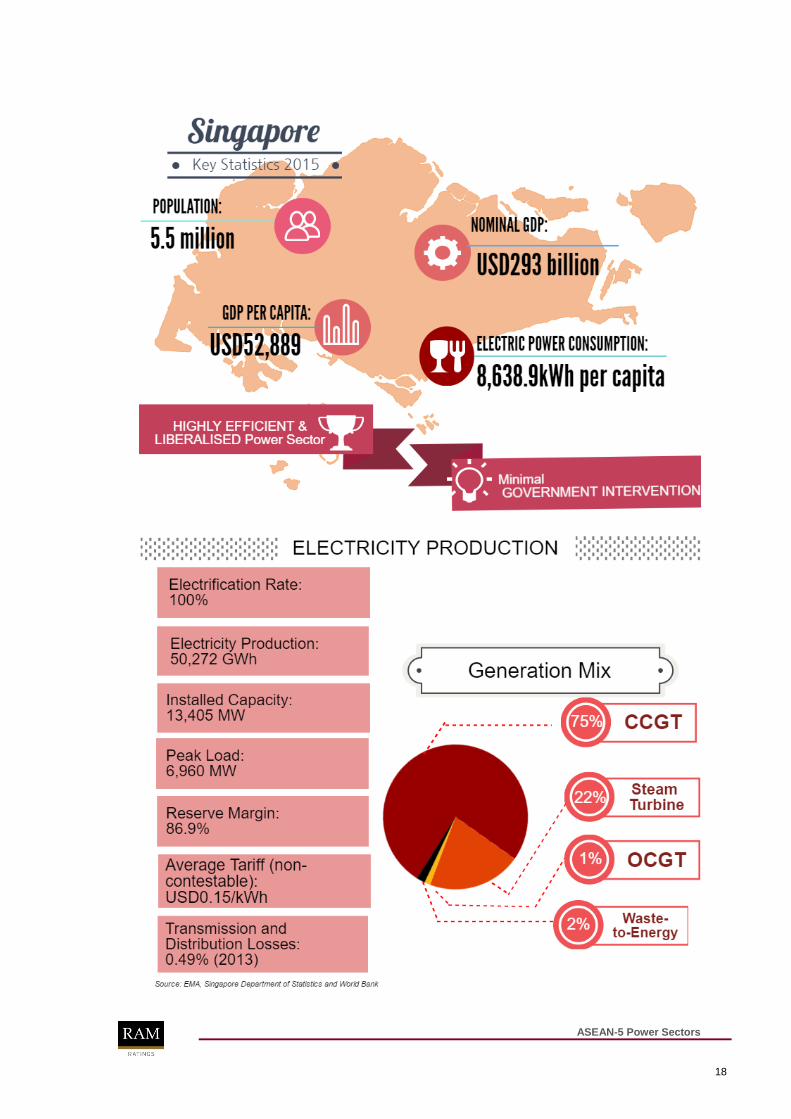
Minimal government support to encourage efficiency. Singapore‟s power sector is the most
developed among its ASEAN-5 peers. Its electrification rate stood at 100% as at end-2015,
against a population of 5.5 million. While the country‟s transmission and distribution (T&D)
network assets are entirely managed by the Government of Singapore (GoS) via Singapore
Power Group (SP), its power-generation segment experiences minimal government intervention
and support to promote its efficiency; energy prices are market-driven and no subsidy is
provided. In this regard, Singapore‟s wholesale electricity market - operated by the Energy
Market Company (EMC) - is Asia‟s first liberalised electricity market. The GoS‟s presence is only
felt in the non-contestable market segment, where electricity tariffs are regulated by the Energy
Market Authority (EMA) and revised every quarter, to reflect the latest generating costs.
Electricity sold through SPS and electricity retailers. Consumers in the retail market are
divided into 2 categories – contestable and non-contestable. Those with an average monthly
consumption of 2,000 kWh (monthly electricity bill of about SGD550 (USD407)17
and above are
categorised as contestable consumers. The contestability threshold was lowered from 4,000 kWh
(monthly electricity bill of about SGD1,100 (USD797) on 1 July 2015. Contestable consumers are
able to purchase electricity from selected electricity retailers, directly from the wholesale market
as market participants, or indirectly from the wholesale market through SP Services Ltd (SPS).
Meanwhile, non-contestable consumers – households and small businesses – purchase from
SPS at regulated rates. For July-September 2016, the average electricity tariff for non-
contestable consumers stood at SGD0.1927/kWh (July-September 2015: SGD0.2241/kWh).
Keener competition amid ongoing regulatory reforms. The GoS has been implementing a
series of measures since 1995, to gradually liberalise the Singaporean power sector and
encourage competition. The EMA plans to fully open up the electricity retail market to competition
by 2H 2018, when consumers who are still paying regulated tariffs - mainly households - will be
able to choose a power provider based on their preferred rates and electricity utilisation. This will
increase more pricing pressure on generating companies (gencos). Meanwhile, the vesting
contract level, which refers to a certain amount of electricity allowed to be sold at a fixed price,
has thus far offered partial revenue protection to the major players. Given the gradual decline in
the vesting contract level to 20% in 201618
(1H 2015: 30%; 2H 2015: 25%), further competition is
envisaged as more capacity will be sold in the wholesale market.
Limited resources heighten dependence on imported fuels. Given its limited resources,
Singapore is highly dependent on imported fuels to support its economy. Fuels accounted for
21.8%19
of its total imported goods as at end-2015 – the second highest in terms of value of
imports; Singapore imports crude oil from the United Arab Emirates, Saudi Arabia and Qatar.
Meanwhile, the island republic sources its natural gas from piped natural gas (PNG) and LNG
from countries such as Malaysia and Indonesia. LNG constituted 24.9% of Singapore‟s natural
gas imports as at end-2015.20
We expect LNG imports to rise in the medium to long term, given
17
SGD1.38 = USD1.00 as at 31 May 2016 (source: Monetary Authority of Singapore) 18 Source: EMA 19
Source: Singapore Department of Statistics 20
Source: EMA
Singapore Power Sector Empowered through liberalisation
ASEAN-5 Power Sectors
16
the GoS‟s import controls on PNG to build up demand for LNG and the commencement of the
nation‟s first LNG-receiving terminal in 2013.
LNG terminal catalyses development of CCGT plants. As the region's leading oil-trading hub
and pricing centre, Singapore aims to establish itself as Asia‟s LNG trading hub. This is
supported by the LNG-receiving terminal, which started operations in early 2013 to meet the
greater demand for natural gas, in line with increasing electricity demand. The operations of the
LNG terminal have led to a sudden surge in combined-cycle, gas-turbine (CCGT) plants in the
city state, as local gencos ride on the additional supply to tap these higher-yielding plants. This is
reflected in Singapore‟s proportion of generation capacity from CCGT plants, which augmented
from 47% in 2005 to 76% as at end-1Q 2016. We expect this trend to be maintained in line with
the country‟s plans to expand its LNG-receiving terminal.
Rising competition among gencos. The increased market capacity of CCGT plants should
reduce the need for more costly and less efficient oil-fired plants. As a conduit to gain access to
the global gas market, the LNG terminal will provide Singapore the opportunity to source for
competitively priced LNG. Competition is thus expected to intensify amid the further decline in
electricity tariffs, which in turn will further compress the gencos' margins. Moreover, the
commencement of the LNG terminal has been followed by the establishment of a Singapore-
based LNG spot price index, also known as the Singapore Exchange LNG Index Group (SLInG),
paving the way for gas pricing that is independent of oil indexation in the long term.
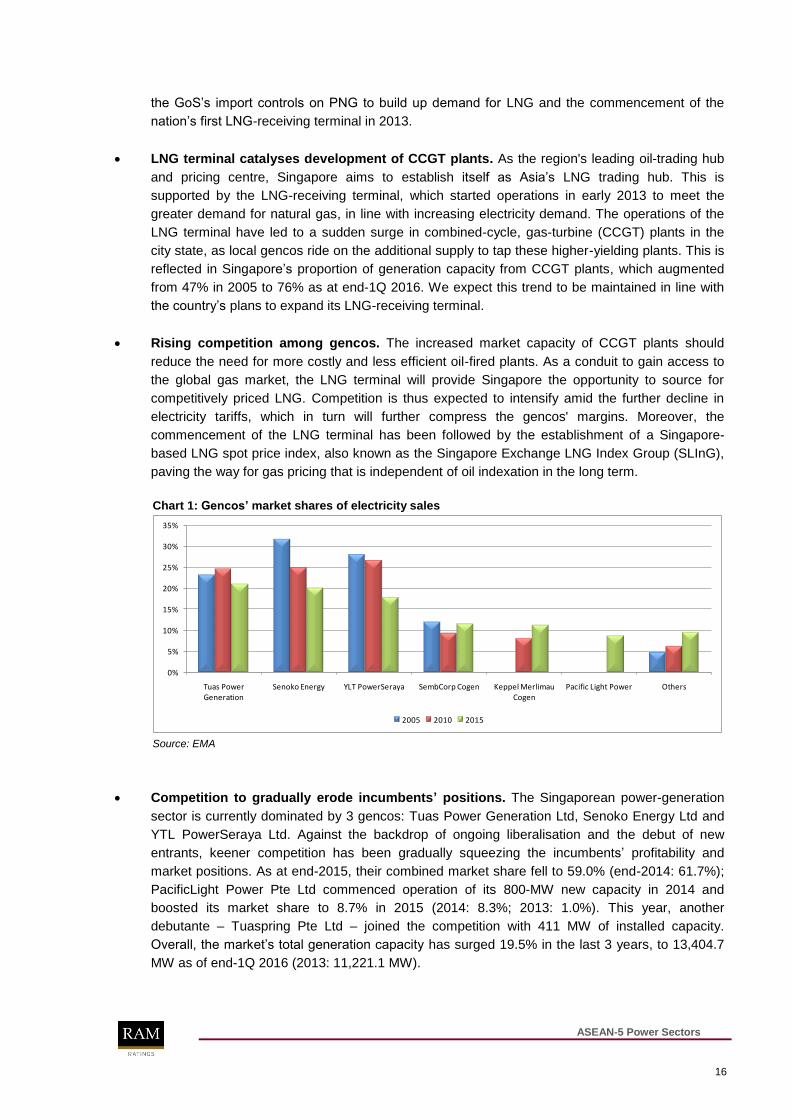
Chart 1: Gencos’ market shares of electricity sales
0%
5%
10%
15%
20%
25%
30%
35%
Tuas Power Generation
Senoko Energy YLT PowerSeraya SembCorp Cogen Keppel Merlimau Cogen
Pacific Light Power Others
2005 2010 2015
Source: EMA
Competition to gradually erode incumbents’ positions. The Singaporean power-generation
sector is currently dominated by 3 gencos: Tuas Power Generation Ltd, Senoko Energy Ltd and
YTL PowerSeraya Ltd. Against the backdrop of ongoing liberalisation and the debut of new
entrants, keener competition has been gradually squeezing the incumbents‟ profitability and
market positions. As at end-2015, their combined market share fell to 59.0% (end-2014: 61.7%);
PacificLight Power Pte Ltd commenced operation of its 800-MW new capacity in 2014 and
boosted its market share to 8.7% in 2015 (2014: 8.3%; 2013: 1.0%). This year, another
debutante – Tuaspring Pte Ltd – joined the competition with 411 MW of installed capacity.
Overall, the market‟s total generation capacity has surged 19.5% in the last 3 years, to 13,404.7
MW as of end-1Q 2016 (2013: 11,221.1 MW).
ASEAN-5 Power Sectors
17
Electricity futures market to manage price volatility. To enhance and spur competition in the
wholesale and retail electricity markets, the EMA has been working on the development of an
electricity futures market, to enable industry players to manage electricity price volatility.
Ultimately, this will benefit end-consumers as retailers will be able to better package their energy
plans. Competition is expected to heighten as the futures market will lower entry barriers by
providing new independent retailers a platform to secure fixed-price contracts for their
consumers, resulting in downward pressure on electricity rates. Contestable consumers can also
leverage on the electricity rates provided by the futures market to negotiate packages with
retailers, indirectly inducing competition as retailers compete for sales.
Power sector expected to maintain growth momentum. In 2015, Singapore‟s electricity
consumption increased 2.4% to 47,514 GWh (2014: 46,403 GWh), in line with its slower GDP
growth of 2.0% (2014: 2.9%) and mostly supported by energy-intensive industries such as the
manufacturing and transport-related sectors. In the long term, large projects to address
infrastructure bottlenecks are expected to boost power demand growth within the construction
and transport-related industries. These ongoing projects include the Land Transport Authority‟s
target of doubling Singapore‟s rail network to about 360 km by 2030, and the expansion of
Terminal 5 of Changi Airport (expected to be completed in 2028). Furthermore, the increase in
net foreign direct investment, which advanced an average of 13.1% from 2010 to 2014, is
anticipated to fuel the growth of electricity consumption, which bodes well for the sector.
Plans to import electricity. According to the EMA, electricity demand is expected to rise more
than 30% over the next decade. It is therefore looking at importing electricity from the ASEAN
Power Grid (APG) to meet increasing demand. There are currently 4 ongoing inter-connection
projects, with the remaining proposed networks expected to be completed by 2020. Nonetheless,
differences in standards among ASEAN members – disparities in electricity markets and tariff
structures – will impede the progress of the APG. We, however, do not believe that the delay will
have a significant impact on Singapore as its power sector currently has sufficient capacity to
meet demand, as indicated by the high reserve margin of 86.9% in 2015 (2014: 87.3%).21
Deep financial market supportive of development. Singapore hosts some of the world‟s best
financial institutions, which has earned it the status of a regional financial hub. Hefty capital
inflows provide long-term financing for infrastructure projects, extended by larger Singaporean
banks. In addition, the republic‟s deep capital markets serve as alternative funding sources for
infrastructure-related entities, accounting for SGD8.4 billion or 12.5% of the top 30 local-currency
(LC) corporate bond issues as at end-2015. For example, close to half of SP PowerAssets‟
borrowings are LC-denominated fixed-rate notes (47.4% of its total outstanding debts as at end-
March 2016), with the rest comprising various foreign currencies – Japanese yen, US dollars and
HK dollars. Meanwhile, Singapore‟s LC corporate bond market was valued at SGD133 billion or
33.0% of its GDP as at end-June 201622
. Notably, Singapore has embarked on several initiatives
to promote LC bonds as a financing option for infrastructure projects within the region, such as
the public-private partnership initiative jointly launched by International Enterprise Singapore and
Asian Development Bank (ADB) as well as the establishment of Clifford Capital by the GoS.
The above is an updated excerpt from RAM‟s report on the Singaporean power sector,
Empowered through Liberalisation, published in July 2015. Subscribers can retrieve the full report
at www.ram.com.my.
21
Source: EMA 22
Source: AsianBondsOnline.
ASEAN-5 Power Sectors
18
ASEAN-5 Power Sectors
19
Nurhayati Sulaiman Analyst Infrastructure & Utilities Ratings
(603) 7628 1040
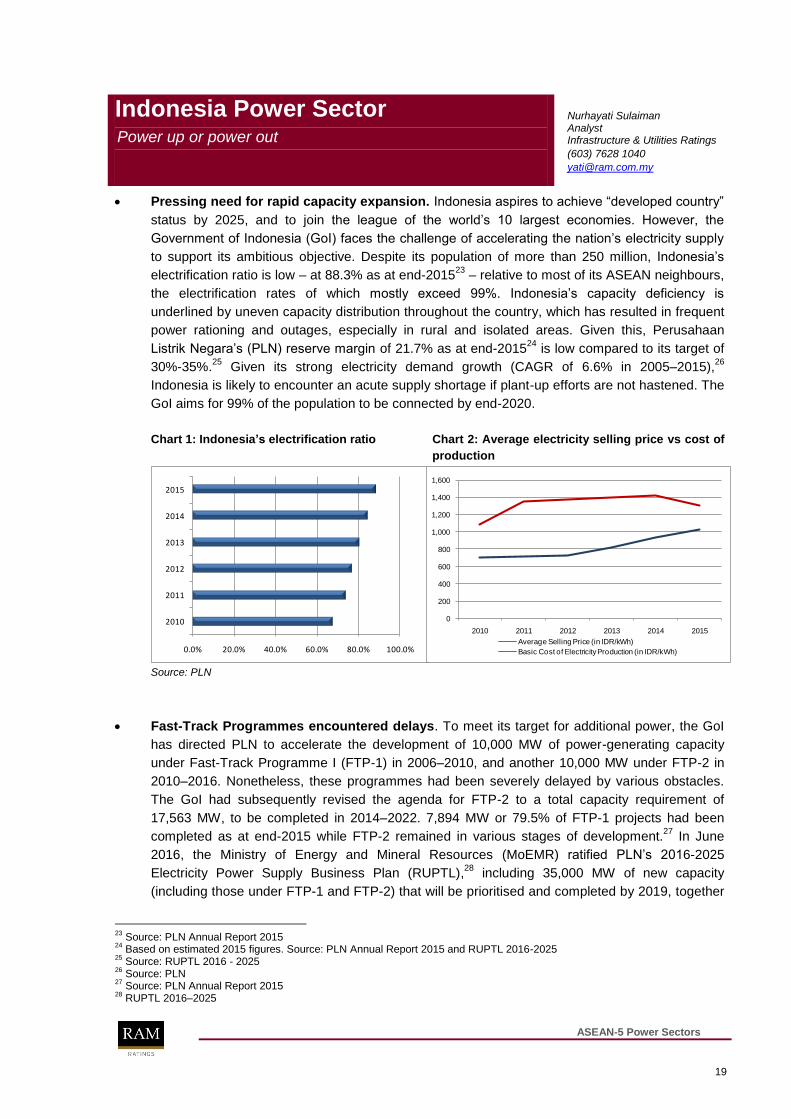
Pressing need for rapid capacity expansion. Indonesia aspires to achieve “developed country”
status by 2025, and to join the league of the world‟s 10 largest economies. However, the
Government of Indonesia (GoI) faces the challenge of accelerating the nation‟s electricity supply
to support its ambitious objective. Despite its population of more than 250 million, Indonesia‟s
electrification ratio is low – at 88.3% as at end-201523
– relative to most of its ASEAN neighbours,
the electrification rates of which mostly exceed 99%. Indonesia‟s capacity deficiency is
underlined by uneven capacity distribution throughout the country, which has resulted in frequent
power rationing and outages, especially in rural and isolated areas. Given this, Perusahaan
Listrik Negara‟s (PLN) reserve margin of 21.7% as at end-201524
is low compared to its target of
30%-35%.25
Given its strong electricity demand growth (CAGR of 6.6% in 2005–2015),26
Indonesia is likely to encounter an acute supply shortage if plant-up efforts are not hastened. The
GoI aims for 99% of the population to be connected by end-2020.
Chart 1: Indonesia’s electrification ratio Chart 2: Average electricity selling price vs cost of
production
0.0% 20.0% 40.0% 60.0% 80.0% 100.0%
2010
2011
2012
2013
2014
2015
0
200
400
600
800
1,000
1,200
1,400
1,600
2010 2011 2012 2013 2014 2015
Average Selling Price (in IDR/kWh)
Basic Cost of Electricity Production (in IDR/kWh)
Source: PLN
Fast-Track Programmes encountered delays. To meet its target for additional power, the GoI
has directed PLN to accelerate the development of 10,000 MW of power-generating capacity
under Fast-Track Programme I (FTP-1) in 2006–2010, and another 10,000 MW under FTP-2 in
2010–2016. Nonetheless, these programmes had been severely delayed by various obstacles.
The GoI had subsequently revised the agenda for FTP-2 to a total capacity requirement of
17,563 MW, to be completed in 2014–2022. 7,894 MW or 79.5% of FTP-1 projects had been
completed as at end-2015 while FTP-2 remained in various stages of development.27
In June
2016, the Ministry of Energy and Mineral Resources (MoEMR) ratified PLN‟s 2016-2025
Electricity Power Supply Business Plan (RUPTL),28
including 35,000 MW of new capacity
(including those under FTP-1 and FTP-2) that will be prioritised and completed by 2019, together
23
Source: PLN Annual Report 2015 24
Based on estimated 2015 figures. Source: PLN Annual Report 2015 and RUPTL 2016-2025 25
Source: RUPTL 2016 - 2025 26
Source: PLN 27
Source: PLN Annual Report 2015 28
RUPTL 2016–2025
Indonesia Power Sector Power up or power out
ASEAN-5 Power Sectors
20
with 46,597 circuit-km of transmission network.29
Along with other projects in the pipeline, these
will contribute an additional 42,940 MW to the grid by 2019.30
Given the mammoth task, IPPs are
expected to play a prominent role; private investments are expected to fund and develop 25,000
MW. The 10-year plan calls for a total investment of USD153.7 billion, with 71.6% comprising
generation assets.31
PLN key facilitator of nation’s electricification goals. Wholly owned by the GoI, PLN is
Indonesia‟s national electricity company; it owns the country‟s 931,783 circuit-km of transmission
network and also controlled 76.2% of Indonesia‟s 52,889-MW generating capacity in 2015.32
Under Law No. 19/2003, the GoI is obligated to provide subsidies to PLN in the form of public
service obligation (PSO) payments to cover the shortfall between its electricity production cost
and regulated tariffs while ensuring it earns an allocated profit margin. In fiscal 2015, PSO
payments accounted for 20.6% of PLN‟s IDR273.89 trillion revenue (USD19.9 billion).33
Given its
pivotal role and strategic function, PLN benefits from a high level of government support and
involvement. PLN‟s credit profile is therefore viewed to mirror that of the GoI. Notably, the GoI,
under Presidential Regulation No. 82 of 2016, is allowed to provide guarantees for direct loans
acquired by PLN from international financial institutions.
Tariff increases in line with reducing energy subsidies. Meanwhile, in line with the GoI‟s
efforts to gradually remove electricity subsidies, the proportion of PSO payments to PLN‟s total
revenue has been gradually declining, from 45% in 2011 to 21% in 2015. PLN is expected to
cover the shortfall via increases in tariffs. In January 2015, the GoI introduced floating tariffs to
non-subsidised customers,34
which are updated monthly based on 3 main indicators: the
exchange rate of the IDR to the USD, oil prices, and the country‟s inflation rate. That said, the
GoI still retains full control over tariffs charged to end-users and allocates subsidies from the
government budget. Of late, tariffs have declined in line with the drop in fuel prices, albeit partly
moderated by the weakening of the IDR against the USD. Electricity tariffs have remained below
production costs and some consumers still enjoy lower tariffs. Nonetheless, PLN recently
signalled an increase in electricity tariffs as the GoI had rejected its application for a higher
subsidy allocation. Without a corresponding rise in tariffs, PLN may have to take on additional
borrowings to cover the shortfall. That said, the GoI has, to date, promptly paid PLN; continuous
government support is imperative given the GoI‟s reliance on PLN for policy implementation.
Land acquisition still an impediment against speedy plant-ups. Capacity plant-up has been
a lengthy process in Indonesia, primarily due to prolonged delays in land acquisition. This is
particularly evident in undeveloped areas, where the bulk of the land has no registered title, with
little evidence of ownership. Complicated licensing procedures, non-synchronous regulations and
overlapping project sites with forest-conservation areas have also contributed to the delays. As of
June 2016, only 170-MW out of the 35-GW programme had begun commercial operations.
However, recent developments at the 2,000-MW Batang coal-fired power plant in Central Java
may set a precedent for power projects facing land disputes. The project recently reached
financial close and has finally started construction following the enforcement of Law No. 2/2012
on land acquisition, which allows the GoI to seize the land for public interests. Despite this
progress, it is immensely challenging to complete this massive project on time, given that the
29
Source: PLN Sustainability Report 2015 30
Source: PLN Annual Report 2015 31
Source: RUPTL 2016 - 2025 32
Source: PLN Annual Report 2015 33
USD1.00 = IDR13,795.00 (as of December 2015); Source: Bank of Indonesia 34
The tariffs can be set at different levels for each region, business area and type of customers.
ASEAN-5 Power Sectors
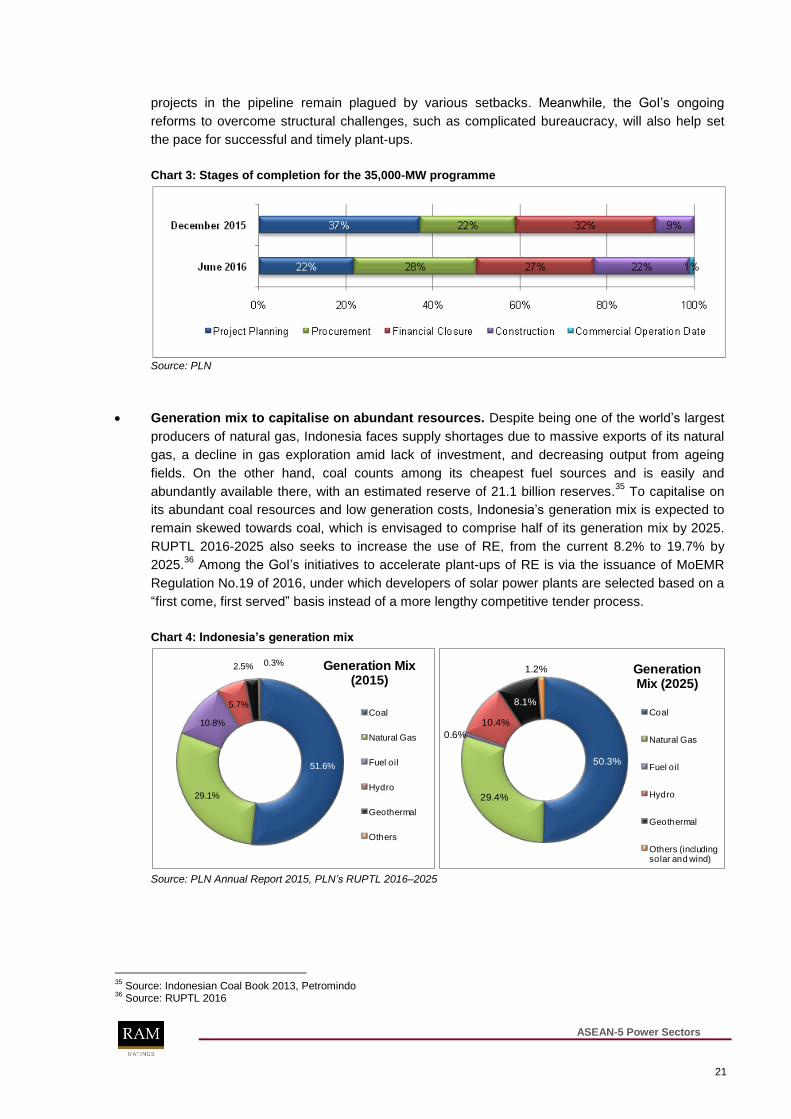
21
projects in the pipeline remain plagued by various setbacks. Meanwhile, the GoI‟s ongoing
reforms to overcome structural challenges, such as complicated bureaucracy, will also help set
the pace for successful and timely plant-ups.
Chart 3: Stages of completion for the 35,000-MW programme
Source: PLN
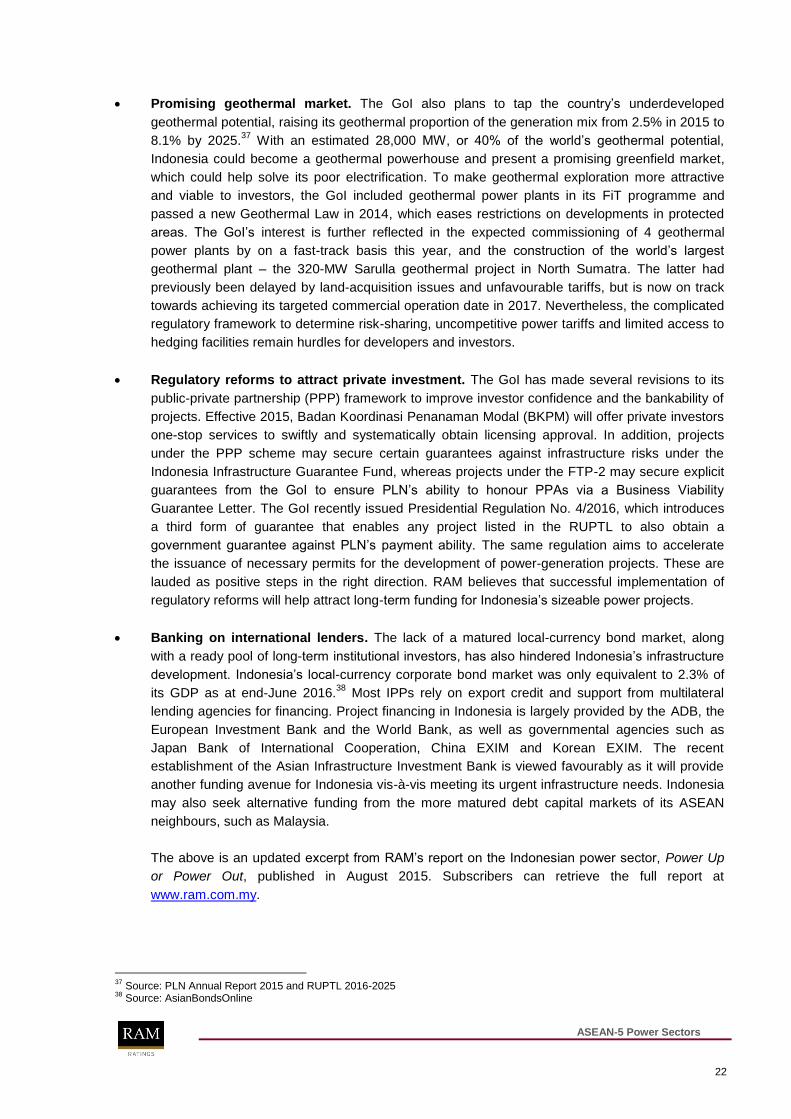
Generation mix to capitalise on abundant resources. Despite being one of the world‟s largest
producers of natural gas, Indonesia faces supply shortages due to massive exports of its natural
gas, a decline in gas exploration amid lack of investment, and decreasing output from ageing
fields. On the other hand, coal counts among its cheapest fuel sources and is easily and
abundantly available there, with an estimated reserve of 21.1 billion reserves.35
To capitalise on
its abundant coal resources and low generation costs, Indonesia‟s generation mix is expected to
remain skewed towards coal, which is envisaged to comprise half of its generation mix by 2025.
RUPTL 2016-2025 also seeks to increase the use of RE, from the current 8.2% to 19.7% by
2025.36
Among the GoI‟s initiatives to accelerate plant-ups of RE is via the issuance of MoEMR
Regulation No.19 of 2016, under which developers of solar power plants are selected based on a
“first come, first served” basis instead of a more lengthy competitive tender process.
Chart 4: Indonesia’s generation mix
51.6%
29.1%
10.8%
5.7%
2.5% 0.3%
Coal
Natural Gas
Fuel oil
Hydro
Geothermal
Others
Generation Mix (2015)
50.3%
29.4%
0.6%
10.4%
8.1%
1.2%
Coal
Natural Gas
Fuel oil
Hydro
Geothermal
Others (including solar and wind)
Generation Mix (2025)
Source: PLN Annual Report 2015, PLN’s RUPTL 2016–2025
35
Source: Indonesian Coal Book 2013, Petromindo 36
Source: RUPTL 2016
ASEAN-5 Power Sectors
22
Promising geothermal market. The GoI also plans to tap the country‟s underdeveloped
geothermal potential, raising its geothermal proportion of the generation mix from 2.5% in 2015 to
8.1% by 2025.37
With an estimated 28,000 MW, or 40% of the world‟s geothermal potential,
Indonesia could become a geothermal powerhouse and present a promising greenfield market,
which could help solve its poor electrification. To make geothermal exploration more attractive
and viable to investors, the GoI included geothermal power plants in its FiT programme and
passed a new Geothermal Law in 2014, which eases restrictions on developments in protected
areas. The GoI‟s interest is further reflected in the expected commissioning of 4 geothermal
power plants by on a fast-track basis this year, and the construction of the world‟s largest
geothermal plant – the 320-MW Sarulla geothermal project in North Sumatra. The latter had
previously been delayed by land-acquisition issues and unfavourable tariffs, but is now on track
towards achieving its targeted commercial operation date in 2017. Nevertheless, the complicated
regulatory framework to determine risk-sharing, uncompetitive power tariffs and limited access to
hedging facilities remain hurdles for developers and investors.
Regulatory reforms to attract private investment. The GoI has made several revisions to its
public-private partnership (PPP) framework to improve investor confidence and the bankability of
projects. Effective 2015, Badan Koordinasi Penanaman Modal (BKPM) will offer private investors
one-stop services to swiftly and systematically obtain licensing approval. In addition, projects
under the PPP scheme may secure certain guarantees against infrastructure risks under the
Indonesia Infrastructure Guarantee Fund, whereas projects under the FTP-2 may secure explicit
guarantees from the GoI to ensure PLN‟s ability to honour PPAs via a Business Viability
Guarantee Letter. The GoI recently issued Presidential Regulation No. 4/2016, which introduces
a third form of guarantee that enables any project listed in the RUPTL to also obtain a
government guarantee against PLN‟s payment ability. The same regulation aims to accelerate
the issuance of necessary permits for the development of power-generation projects. These are
lauded as positive steps in the right direction. RAM believes that successful implementation of
regulatory reforms will help attract long-term funding for Indonesia‟s sizeable power projects.
Banking on international lenders. The lack of a matured local-currency bond market, along
with a ready pool of long-term institutional investors, has also hindered Indonesia‟s infrastructure
development. Indonesia‟s local-currency corporate bond market was only equivalent to 2.3% of
its GDP as at end-June 2016.38
Most IPPs rely on export credit and support from multilateral
lending agencies for financing. Project financing in Indonesia is largely provided by the ADB, the
European Investment Bank and the World Bank, as well as governmental agencies such as
Japan Bank of International Cooperation, China EXIM and Korean EXIM. The recent
establishment of the Asian Infrastructure Investment Bank is viewed favourably as it will provide
another funding avenue for Indonesia vis-à-vis meeting its urgent infrastructure needs. Indonesia
may also seek alternative funding from the more matured debt capital markets of its ASEAN
neighbours, such as Malaysia.
The above is an updated excerpt from RAM‟s report on the Indonesian power sector, Power Up
or Power Out, published in August 2015. Subscribers can retrieve the full report at
www.ram.com.my.
37
Source: PLN Annual Report 2015 and RUPTL 2016-2025 38
Source: AsianBondsOnline
ASEAN-5 Power Sectors
23
ASEAN-5 Power Sectors
24
Nurhayati Sulaiman Analyst Infrastructure & Utilities Ratings
(603) 7628 1040
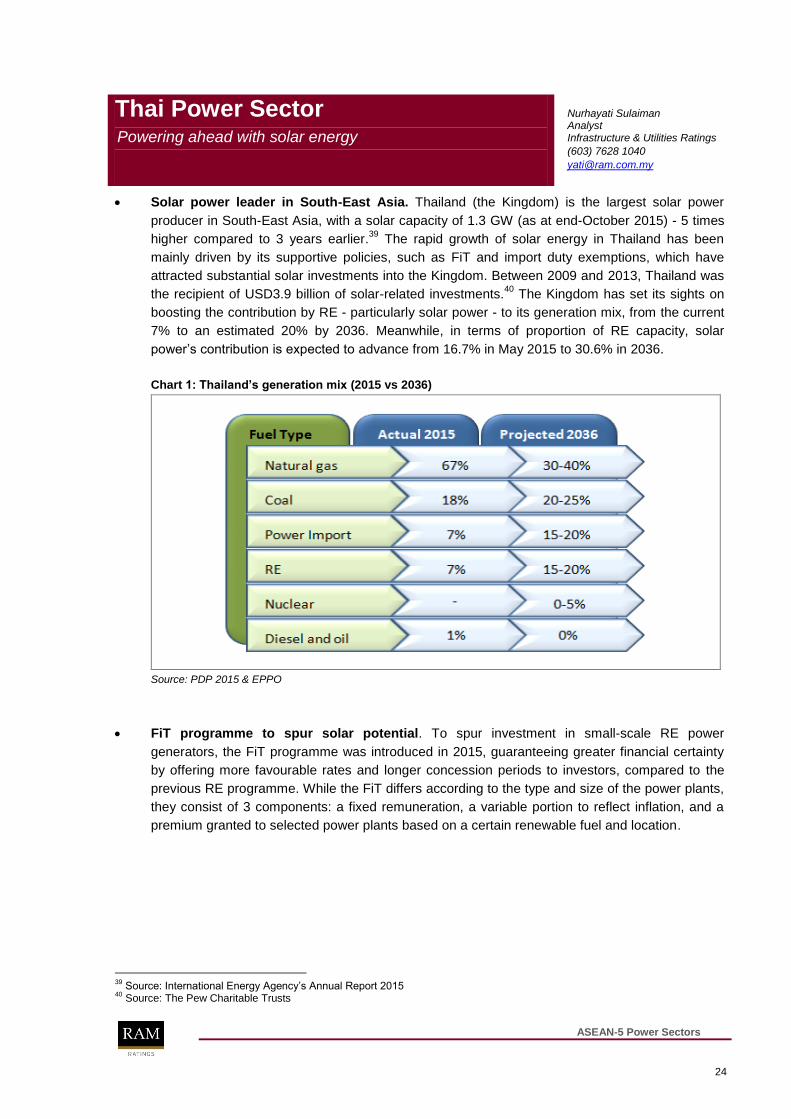
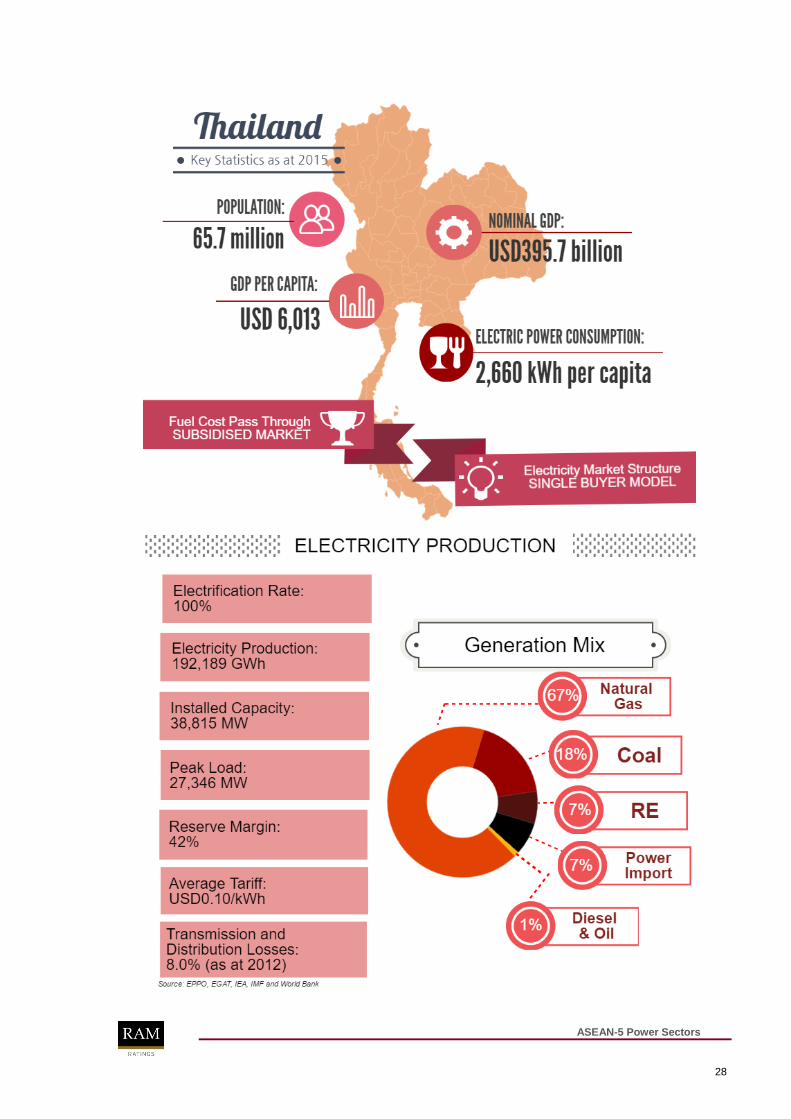
Solar power leader in South-East Asia. Thailand (the Kingdom) is the largest solar power
producer in South-East Asia, with a solar capacity of 1.3 GW (as at end-October 2015) - 5 times
higher compared to 3 years earlier.39
The rapid growth of solar energy in Thailand has been
mainly driven by its supportive policies, such as FiT and import duty exemptions, which have
attracted substantial solar investments into the Kingdom. Between 2009 and 2013, Thailand was
the recipient of USD3.9 billion of solar-related investments.40
The Kingdom has set its sights on
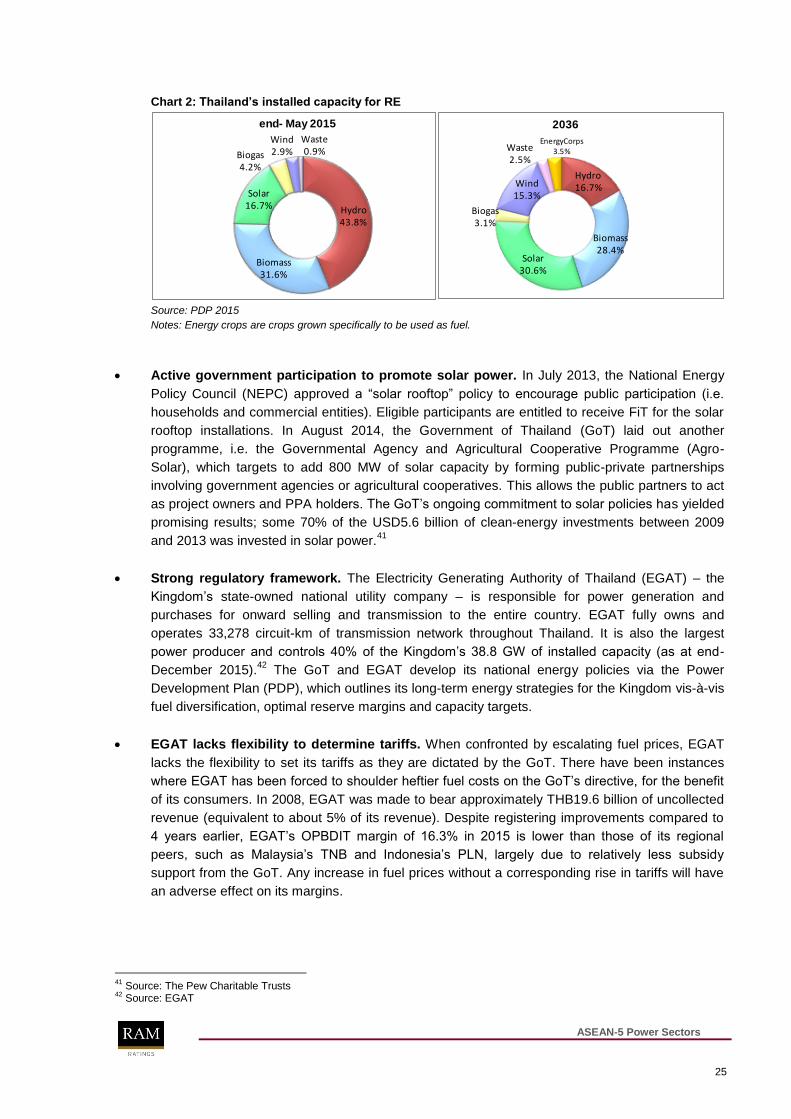
boosting the contribution by RE - particularly solar power - to its generation mix, from the current
7% to an estimated 20% by 2036. Meanwhile, in terms of proportion of RE capacity, solar
power‟s contribution is expected to advance from 16.7% in May 2015 to 30.6% in 2036.
Chart 1: Thailand’s generation mix (2015 vs 2036)
Source: PDP 2015 & EPPO
FiT programme to spur solar potential. To spur investment in small-scale RE power
generators, the FiT programme was introduced in 2015, guaranteeing greater financial certainty
by offering more favourable rates and longer concession periods to investors, compared to the
previous RE programme. While the FiT differs according to the type and size of the power plants,
they consist of 3 components: a fixed remuneration, a variable portion to reflect inflation, and a
premium granted to selected power plants based on a certain renewable fuel and location.
39
Source: International Energy Agency‟s Annual Report 2015 40
Source: The Pew Charitable Trusts
Thai Power Sector Powering ahead with solar energy
ASEAN-5 Power Sectors
25
Chart 2: Thailand’s installed capacity for RE
Hydro43.8%
Biomass31.6%
Solar16.7%
Biogas4.2%
Wind2.9%
Waste0.9%
end- May 2015
Hydro16.7%
Biomass28.4%
Solar30.6%
Biogas3.1%
Wind15.3%
Waste2.5%
EnergyCorps3.5%
2036
Source: PDP 2015
Notes: Energy crops are crops grown specifically to be used as fuel.
Active government participation to promote solar power. In July 2013, the National Energy
Policy Council (NEPC) approved a “solar rooftop” policy to encourage public participation (i.e.
households and commercial entities). Eligible participants are entitled to receive FiT for the solar
rooftop installations. In August 2014, the Government of Thailand (GoT) laid out another
programme, i.e. the Governmental Agency and Agricultural Cooperative Programme (Agro-
Solar), which targets to add 800 MW of solar capacity by forming public-private partnerships
involving government agencies or agricultural cooperatives. This allows the public partners to act
as project owners and PPA holders. The GoT‟s ongoing commitment to solar policies has yielded
promising results; some 70% of the USD5.6 billion of clean-energy investments between 2009
and 2013 was invested in solar power.41
Strong regulatory framework. The Electricity Generating Authority of Thailand (EGAT) – the
Kingdom‟s state-owned national utility company – is responsible for power generation and
purchases for onward selling and transmission to the entire country. EGAT fully owns and
operates 33,278 circuit-km of transmission network throughout Thailand. It is also the largest
power producer and controls 40% of the Kingdom‟s 38.8 GW of installed capacity (as at end-
December 2015).42
The GoT and EGAT develop its national energy policies via the Power
Development Plan (PDP), which outlines its long-term energy strategies for the Kingdom vis-à-vis
fuel diversification, optimal reserve margins and capacity targets.
EGAT lacks flexibility to determine tariffs. When confronted by escalating fuel prices, EGAT
lacks the flexibility to set its tariffs as they are dictated by the GoT. There have been instances
where EGAT has been forced to shoulder heftier fuel costs on the GoT‟s directive, for the benefit
of its consumers. In 2008, EGAT was made to bear approximately THB19.6 billion of uncollected
revenue (equivalent to about 5% of its revenue). Despite registering improvements compared to
4 years earlier, EGAT‟s OPBDIT margin of 16.3% in 2015 is lower than those of its regional
peers, such as Malaysia‟s TNB and Indonesia‟s PLN, largely due to relatively less subsidy
support from the GoT. Any increase in fuel prices without a corresponding rise in tariffs will have
an adverse effect on its margins.
41
Source: The Pew Charitable Trusts 42
Source: EGAT
ASEAN-5 Power Sectors
26
Depleting natural gas reserves and hefty gas expenditure. The Thai power sector relies
substantially on natural gas, which constituted approximately 67% of Thailand‟s generation mix in
2015. Some 80% of the gas requirement was sourced from the Kingdom‟s depleting natural gas
reserves, which is estimated to last another 13 years; the rest was imported from Myanmar at a
hefty price. In the last decade, the value of energy imports has consistently accounted for more
than half of its energy consumption expenditure, which came up to 10% of the Kingdom‟s GDP
on average for the same period. On top of imported natural gas from Myanmar, the Kingdom also
imports LNG, mainly from the Middle East. Thailand‟s increasing dependence on imported fuels
may pose a threat to its energy security, as any unforeseen events or unfavourable policy
changes by the originating countries may have an adverse impact on the Kingdom‟s fuel supply.
Increased coal generation as part of diversification strategy. Under PDP 2015, Thailand also
aims to increase the proportion of coal in its generation mix, from 18% in 2015 to up to 25% by
2036, by adding an estimated 7,390 MW of clean-technology power plants.43
Nonetheless, there
is a lack of indigenous coal supply; the Kingdom‟s domestic coal output of 17.9 million tonnes
(mostly lignite) is insufficient to meet its consumption of 18.4 million tonnes.44
Given that Thailand
would need to import more coal to meet rising demand, this would necessitate enlarged capital
expenditure to accommodate improvements in port and rail infrastructure.
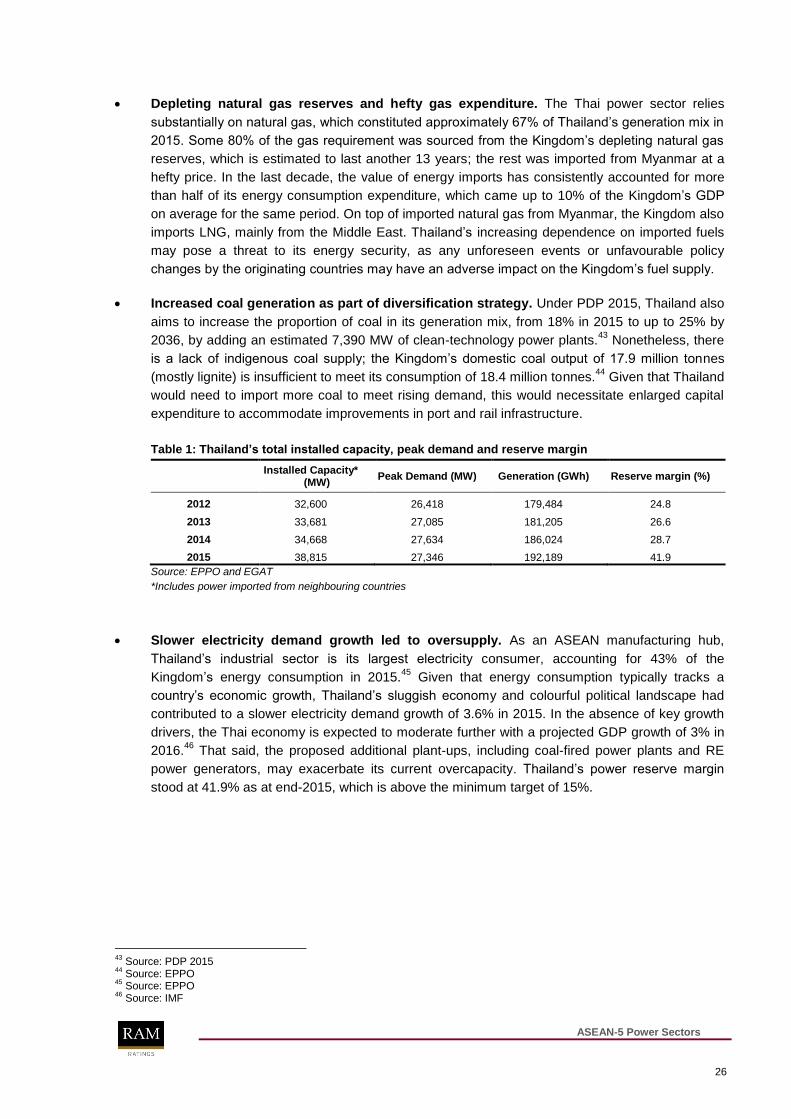
Table 1: Thailand’s total installed capacity, peak demand and reserve margin
Installed Capacity* (MW)
Peak Demand (MW) Generation (GWh) Reserve margin (%)
2012 32,600 26,418 179,484 24.8
2013 33,681 27,085 181,205 26.6
2014 34,668 27,634 186,024 28.7
2015 38,815 27,346 192,189 41.9
Source: EPPO and EGAT
*Includes power imported from neighbouring countries
Slower electricity demand growth led to oversupply. As an ASEAN manufacturing hub,
Thailand‟s industrial sector is its largest electricity consumer, accounting for 43% of the
Kingdom‟s energy consumption in 2015.45
Given that energy consumption typically tracks a
country‟s economic growth, Thailand‟s sluggish economy and colourful political landscape had
contributed to a slower electricity demand growth of 3.6% in 2015. In the absence of key growth
drivers, the Thai economy is expected to moderate further with a projected GDP growth of 3% in
2016.46
That said, the proposed additional plant-ups, including coal-fired power plants and RE
power generators, may exacerbate its current overcapacity. Thailand‟s power reserve margin
stood at 41.9% as at end-2015, which is above the minimum target of 15%.
43
Source: PDP 2015 44
Source: EPPO 45
Source: EPPO 46
Source: IMF
ASEAN-5 Power Sectors
27
Supportive policies aid bank funding. Thailand‟s growing local-currency bond market was
valued at a sizeable THB10.37 trillion or USD295 billion as at end-June 2016, equivalent to 75%
of the Kingdom‟s GDP.47
Nevertheless, power bonds remain scarce as their appeal is muted by
the availability and easy accessibility of bank financing to fund power projects. The GoT has set
up the Energy Conservation Promotion Fund to promote energy-efficient and RE projects, by
offering assistance in securing project financing and technical advisory. Moreover, the Energy
Efficiency Revolving Fund, a collaboration with the finance sector to provide low-interest loans to
large-scale, energy-efficient and RE project developers, has been introduced to manage initial
capital costs through tax holidays or exemptions under the Investment Promotion Act. Although
power-related bonds are limited, we believe that the bond market could become an attractive
alternative platform for long-term financing in Thailand‟s journey towards becoming South-East
Asia‟s solar power leader.
The above is an updated excerpt from RAM‟s report on the Thai power sector, Powering Ahead with
Solar Energy, published in March 2016. Subscribers can retrieve the full report at www.ram.com.my.
47
Source: Energy for Environment Foundation. The exchange rate on this note and all subsequent references is USD1.00 = THB36.08 (as at 31 December 2015); Source: Bank of Thailand.
ASEAN-5 Power Sectors
28
ASEAN-5 Power Sectors
29
Chinthamani Thanneermalai Senior Analyst Infrastructure & Utilities Ratings
(603) 7628 1013
EPIRA created competitive power market. Prior to the 1990s, the National Power Corporation
(NPC), a government-owned and controlled company, had been the sole vertically integrated
electricity provider in the Philippines. Under the Electric Power Industry Reform Act (EPIRA) of
2001, the Philippines power industry has evolved into 3 distinct sectors – generation,
transmission, distribution – and become regulated by the Energy Regulatory Commission (ERC).
While the bulk of NPC‟s generation assets have been privatised under the EPIRA, it continues to
operate and maintain the remaining undisposed generation assets via an operation and
maintenance agreement with Power Sector Assets and Liabilities Management (PSALM).48
Following the liberalisation under EPIRA, the Philippines‟ power market has evolved into a
competitive landscape, similar to Singapore‟s, where energy prices are market-driven with no
government subsidies.
Fragmented generation and distribution sectors, monopoly in transmission. According to
the 27th EPIRA Status Report, the generation sector was dominated by San Miguel Energy
Corporation (24%), followed by First Gen Corporation (17%) and Aboitiz Power Corporation
(15%) as of 2014.49
The distribution sector is made up of numerous private distribution utilities,
electricity cooperatives and local government units. Manila Electric Company (Meralco) is the
nation‟s largest privately owned distribution utility, which accounted for 55% of the total electricity
sales in the Philippines in 2015.50
Meanwhile, the country‟s transmission assets are managed by
a single entity – the National Grid Corporation of the Philippines (NGCP)51
– via a 25-year
concession awarded in December 2007.
Merchant market in Luzon and Visayas akin to Singapore’s. The nation‟s power grid is
demarcated geographically by the 3 regions: Luzon, Visayas and Mindanao. Similar to
Singapore‟s power sector, the Philippines established a competitive wholesale electricity spot
market for the Luzon grid and Visayas grid in 2006 and 2010, respectively. The Wholesale
Electricity Spot Market (WESM) for Luzon and Visayas are operated by Philippines Electricity
Market Corporation (PEMC). Each generator must sell its physical output on an hourly basis to
the WESM. The generator with the lowest marginal cost will have an edge as it will rank higher in
the merit order, thus securing a higher priority on dispatch. In Mindanao, the wholesale electricity
spot market was established (under Interim Mindanao Electricity Market) in 2013 but suspended
in 2014.
Consumers comprise Contestable Customers and Captive Market. End-users with a monthly
average peak demand of at least 1 MW are categorised as Contestable Customers. Contestable
Customers have the option to purchase electricity from either generator with a Retail Electricity
Supplier licence issued by the ERC, or from the WESM. Meanwhile, the Captive Market –
households and small businesses – will have to purchase electricity at retail rates charged by
48
PSALM had been established under the EPIRA to take over the assets and liabilities of the NPC, privatise generation asssets and utilise the proceeds to pay down the outstanding debts of NPC.
49 The other power generators in the Philippines include GN Power Limited, AES Corporation, SPC Power Corporation, FDC Utilities Incorporation and Alsons Power Group.
50 Source: Meralco‟s Annual Report 2015
51 NGCP is owned by Monte Oro Grid Resources Corporation, Calaca High Power Corporation, and State Grid Corporation of China.
Philippines Power Sector Bridging the supply-demand gap
ASEAN-5 Power Sectors
30
their respective area‟s private distribution utility, electricity cooperative or local government
(collectively known as distribution utilities). The tariffs set by the respective area‟s distribution
utility are reviewed each quarter, and are regulated by the Government of the Philippines (GoP)
through ERC to reflect the actual cost of electricity.
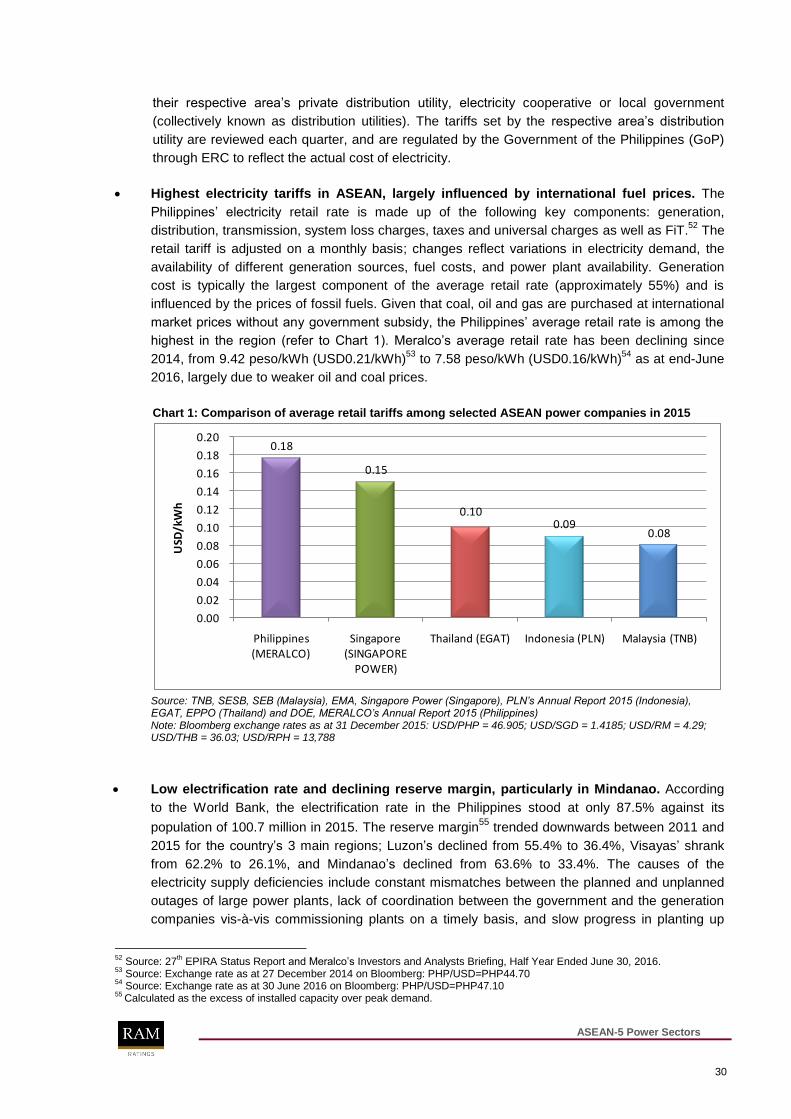
Highest electricity tariffs in ASEAN, largely influenced by international fuel prices. The
Philippines‟ electricity retail rate is made up of the following key components: generation,
distribution, transmission, system loss charges, taxes and universal charges as well as FiT.52
The
retail tariff is adjusted on a monthly basis; changes reflect variations in electricity demand, the
availability of different generation sources, fuel costs, and power plant availability. Generation
cost is typically the largest component of the average retail rate (approximately 55%) and is
influenced by the prices of fossil fuels. Given that coal, oil and gas are purchased at international
market prices without any government subsidy, the Philippines‟ average retail rate is among the
highest in the region (refer to Chart 1). Meralco‟s average retail rate has been declining since
2014, from 9.42 peso/kWh (USD0.21/kWh)53
to 7.58 peso/kWh (USD0.16/kWh)54
as at end-June
2016, largely due to weaker oil and coal prices.
Chart 1: Comparison of average retail tariffs among selected ASEAN power companies in 2015
0.18
0.15
0.10 0.09
0.08
0.00
0.02
0.04
0.06
0.08
0.10
0.12
0.14
0.16
0.18
0.20
Philippines (MERALCO)
Singapore (SINGAPORE
POWER)
Thailand (EGAT) Indonesia (PLN) Malaysia (TNB)
USD
/kW
h
Source: TNB, SESB, SEB (Malaysia), EMA, Singapore Power (Singapore), PLN’s Annual Report 2015 (Indonesia), EGAT, EPPO (Thailand) and DOE, MERALCO’s Annual Report 2015 (Philippines) Note: Bloomberg exchange rates as at 31 December 2015: USD/PHP = 46.905; USD/SGD = 1.4185; USD/RM = 4.29; USD/THB = 36.03; USD/RPH = 13,788
Low electrification rate and declining reserve margin, particularly in Mindanao. According
to the World Bank, the electrification rate in the Philippines stood at only 87.5% against its
population of 100.7 million in 2015. The reserve margin55
trended downwards between 2011 and
2015 for the country‟s 3 main regions; Luzon‟s declined from 55.4% to 36.4%, Visayas‟ shrank
from 62.2% to 26.1%, and Mindanao‟s declined from 63.6% to 33.4%. The causes of the
electricity supply deficiencies include constant mismatches between the planned and unplanned
outages of large power plants, lack of coordination between the government and the generation
companies vis-à-vis commissioning plants on a timely basis, and slow progress in planting up
52
Source: 27th EPIRA Status Report and Meralco‟s Investors and Analysts Briefing, Half Year Ended June 30, 2016.
53 Source: Exchange rate as at 27 December 2014 on Bloomberg: PHP/USD=PHP44.70
54 Source: Exchange rate as at 30 June 2016 on Bloomberg: PHP/USD=PHP47.10
55 Calculated as the excess of installed capacity over peak demand.
ASEAN-5 Power Sectors
31
due to land–acquisition issues and lengthy permit processes.56
Recognising this, the GoP
created the Philippines Energy Plan 2012-2030 (PEP), to expand the power sector and
encourage the participation of the private sector. However, the progress of the PEP has been
sluggish. Given the rampant power shortages, the GoP established the Interruptible Load
Programme (ILP) in 2014 as a near-term measure.
ILP to address power-supply shortfall in short term. Under the ILP, participants with stand-by
generation capacities and an average monthly consumption of about 1 MW will be compensated
if they use their own generating facilities during instances of power-supply deficit, instead of
obtaining their electricity supply from the main grid. Upon the commencement of the ILP, only
captive customers or those that are directly served by distribution utilities, such as Meralco, had
been allowed to participate in the programme. In April 2015, the ERC extended the ILP to include
contestable customers or those who have their own retail electricity suppliers. While this has
helped reduce the frequent power outages in the Philippines, the planting up and smooth
integration of new power plants into grids will address the long-term lack of electricity supply.
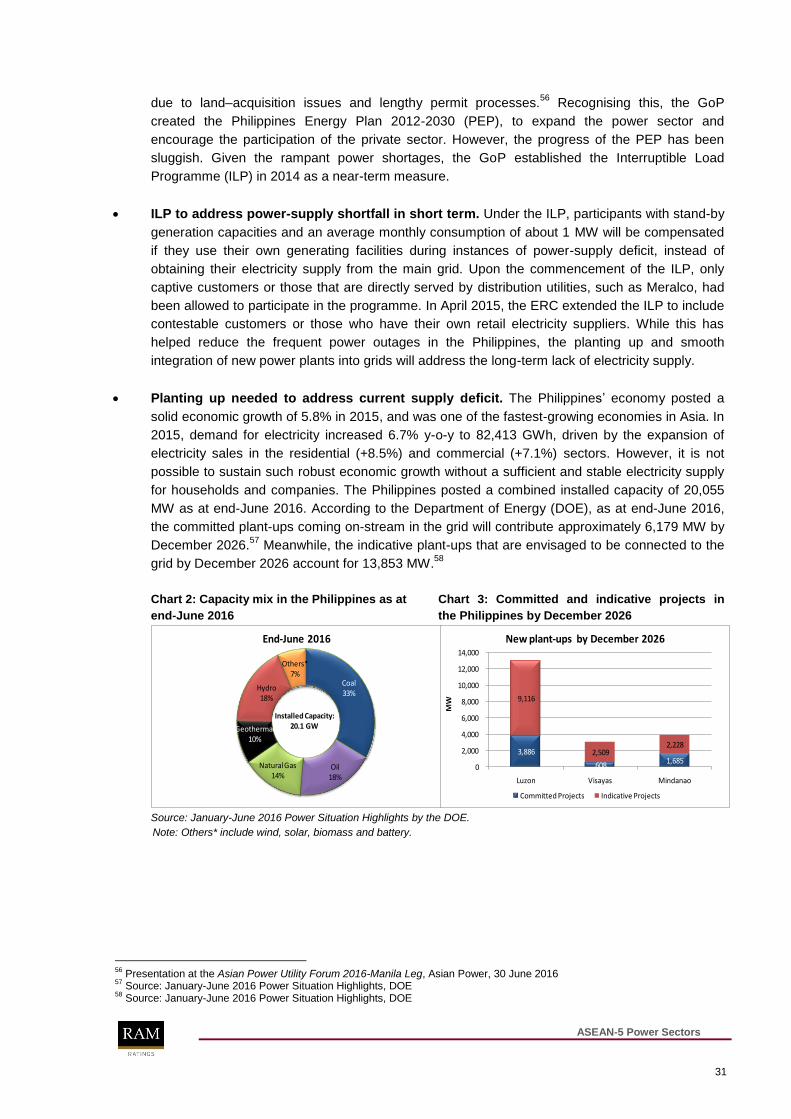
Planting up needed to address current supply deficit. The Philippines‟ economy posted a
solid economic growth of 5.8% in 2015, and was one of the fastest-growing economies in Asia. In
2015, demand for electricity increased 6.7% y-o-y to 82,413 GWh, driven by the expansion of
electricity sales in the residential (+8.5%) and commercial (+7.1%) sectors. However, it is not
possible to sustain such robust economic growth without a sufficient and stable electricity supply
for households and companies. The Philippines posted a combined installed capacity of 20,055
MW as at end-June 2016. According to the Department of Energy (DOE), as at end-June 2016,
the committed plant-ups coming on-stream in the grid will contribute approximately 6,179 MW by
December 2026.57
Meanwhile, the indicative plant-ups that are envisaged to be connected to the
grid by December 2026 account for 13,853 MW.58
Chart 2: Capacity mix in the Philippines as at Chart 3: Committed and indicative projects in
end-June 2016 the Philippines by December 2026
Coal33%
Oil18%
Natural Gas14%
Geothermal10%
Hydro18%
Others*7%
End-June 2016
Installed Capacity: 20.1 GW
3,886
608 1,685
9,116
2,509 2,228
0
2,000
4,000
6,000
8,000
10,000
12,000
14,000
Luzon Visayas Mindanao
MW
New plant-ups by December 2026
Committed Projects Indicative Projects
Source: January-June 2016 Power Situation Highlights by the DOE.
Note: Others* include wind, solar, biomass and battery.
56
Presentation at the Asian Power Utility Forum 2016-Manila Leg, Asian Power, 30 June 2016 57
Source: January-June 2016 Power Situation Highlights, DOE 58
Source: January-June 2016 Power Situation Highlights, DOE
ASEAN-5 Power Sectors
32
New plant-ups to be mainly powered by coal. Each of the country‟s 3 main island regions has
distinct generation profiles. Luzon‟s capacity is mainly powered by coal-fired power plants,
Visayas relies on geothermal energy and coal, and Mindanao depends heavily on its hydropower
resources. As of end-June 2016, coal accounted for 33% of the Philippines‟ total combined
capacity mix, followed by oil-based (18%), hydropower (18%), natural gas (14%), and geothermal
sources (10%).59
Given the economic advantage of coal over gas, capacities which will be
coming in the pipeline by December 2026 are largely composed of power plants which utilise
coal, attributable to its favourable prices, which have declined in the last few years – from
USD127.63/metric tonne in May 2011 to USD56.97/metric tonne in June 201660
. According to the
Philippine Energy Plan 2012-2030, coal consumption is anticipated to continue growing at an
annual average rate of 7.8%, as more coal-fired power plants come on-stream over the next few
years.
Reliant on coal, natural gas and oil imports. The Philippines‟ fuel mix is fairly diversified,
mainly relying on coal, oil61
and natural gas imports. According to the Energy Information
Administration, almost 30% of the coal consumed is produced locally while the rest is mainly
imported from Indonesia.62
While the Indonesian government currently imposes a moratorium on
coal-delivery ships to the Philippines,63
the Energy Secretary notes that the country still has
sufficient inventory in the near term, along with the option of procuring coal from other countries
such as Australia, Russia or Vietnam. While coal-fired power plants rely on coal imports, the 3
major gas-fired power plants in Luzon64
face a high level of concentration risk as they source
their gas supply from the Malampaya field. When the Malampaya gas platform is under
maintenance shutdown, these gas-fired power plants have to resort to more expensive (including
transportation cost) imports of natural gas. Prolonged maintenance of the Malampaya gas
platform had also caused blackouts in Luzon in the past. This further highlights the deficiency in
the country‟s electricity supply.
Table 1: RE installed capacity (actual vs planned)
RE Installed capacity as at
end-June 2016 (MW) %
Target installed
capacity by 2030 (MW) %
Geothermal 1,917.0 28 3,461.0 23
Hydro 3,609.0 53 8,724.1 57
Biomass 233.0 3 315.7 2
Wind 427.0 6 2,378.0 16
Solar 684.0 10 285.0 2
Ocean 0.0 0 70.5 0
Total 6,870.0 100 15,304.3 100
Source: DOE and Investment Opportunities in the Philippine Energy Sector, presented at the 5th Asia-Singapore Infrastructure
Roundtable in October 2015 by the DOE; Philippine Power Situation (January–December 2015), DOE.
59
Source: January-June 2016 Power Situation Highlights, DOE 60
Source: Newcastle Coal Index, Australian Thermal Coal 61
The diesel-fired power plants rely on oil imports from the Middle East. 62
Source: US Energy Information Administration and Philippines Energy Plan 2012-2030 63
The moratorium was imposed by the Indonesian government following the kidnapping of Indonesian sailors by the Abu Sayyaf in June 2016. Source: Philippine Power Supply Jeopardised by Indonesian Ban, Philstar Global, 27 June 2016.
64 The 3 plants are the 560-MW San Lorenzo, the 1,000-MW Santa Rita and the 1,200-MW Illjian facilities.
ASEAN-5 Power Sectors
33
Diversifying into RE to reduce exposure to price fluctuation of fossil fuels. The Renewable
Energy (RE) Act was passed into law on 28 July 2008, to reduce the Philippines‟ dependence on
fossil fuels and minimise its exposure to price fluctuations in the international markets. According
to the Philippines Energy Plan 2012-2030, the country intends to achieve a targeted RE installed
capacity of 15,304 MW by 2030 (approximately 37%65
of the capacity mix in 2030). Since early
2015, RE plants (including geothermal, hydroelectric, solar and wind) have been fully integrated
into the WESM66
and are entitled to “must dispatch” status, whereby they get priority in dispatch
into the grid over non-intermittent and fossil-fuelled plants. The FiT was implemented at the same
time, whereby the RE plants are entitled to a guaranteed payment of a fixed rate for each
kilowatt-hour of energy it supplies to the grid.67
However, progress on this front has been slow
despite the various incentives68
offered by the GoP; total RE installed energy rose from 5,439
MW in 2010 to 6,870 MW as at end-June 2016 (refer to Table 1).
Energy mix under review following change of government in May 2016. In July 2016,69
President Rodrigo Duterte - who assumed power following his election in May 2016 - stated that
he would consider honouring the Paris Agreement, under which the Philippines has committed
itself to a 70% reduction in carbon emissions by 2030, provided that it took into consideration the
economic needs of the country.70
Meanwhile, the DOE is reviewing the energy mix for the
country. Newly appointed Energy Secretary Alfonso Cusi has stated that the Philippines will
endeavour to strike a balance between coal and RE.71
During the recent International Atomic
Energy Agency Conference on Prospects for Nuclear Power in the Asia Pacific Region in August
2016, the Energy Secretary mentioned in his speech that the Philippines is open to tapping
nuclear power as it is “high on productivity and reliability, low on cost and emissions”.72
However,
this could take a while as it will require necessary assessments and there will be a need to hold
discussions with various stakeholders.
Dependent on domestic banks and foreign lenders to fund power sector development. The
lack of a matured local-currency bond market, along with a ready pool of long-term institutional
investors, has also hindered the development of the Philippines‟ power sector. The Philippines‟
local-currency corporate bond market was valued at only 6% of its GDP as at end-June 2016.73
The nation‟s power projects are largely funded by loans from domestic and foreign banks. Apart
from bank loans, power projects have also been receiving financial support from multilateral
agencies such as the World Bank (via its private arm, International Finance Corporation (IFC))
and the ADB. Financial support in the past includes ADB‟s USD300 million Power Restructuring
Programme Loan in 199874
and the IFC‟s provision of a 15-year loan worth USD75 million to the
65
Source: Philippine Energy Plan 2012-2030 66
http://www.philstar.com/business/2015/02/15/1423757/power-spot-market-ready-integrate-renewable-energy 67
Under the FiT system, RE companies are entitled to the following FIT rates: P8.53 per kWh for solar power, P6.63 per kWh for biomass power, P8.53 per kWh for wind and P5.90 per kWh for run-of-river hydroelectric power.
68 Other incentives provided by the GoP include exemption from income taxes for the first 7 years of commercial operations, 10-year duty-free importation of RE machinery, equipment and materials, and no value-added tax on the sale of fuel or power from RE sources.
69 In April 2015, more than 150 countries signed the Paris climate deal that seeks to limit global warming “well below” 2 degrees Celsius above pre-industrial levels. The Philippines, under then-President Benigno Aquino III, had committed to a 70% reduction in its carbon emissions 70% by 2030, even if it is not a major source of greenhouse gases.
70 Source: http://www.manilatimes.net/duterte-reverses-stance-on-paris-climate-pact/280776/
71 Source: http://www.gmanetwork.com/news/story/572323/money/companies/coal-fired-power-plants-are-acceptable-to-doe; We will follow what„s good for us, DOE, 19 July 2016
72 Source: https://www.doe.gov.ph/secretarys-corner/keynote-speech-iaea-international-conference-prospects-nuclear-power-asia-pacific , 30 August 2016
73 Source: AsianBondsOnline
74 Source: With ADB Support, Reliable and Cheaper Power is Within Reach in the Philippines, May 2008, Asian Development Bank
ASEAN-5 Power Sectors
34
Energy Development Corporation75
in 2008. In February 2016, the ADB offered supportive
funding to AP Renewables Incorporated‟s PHP12.5 billion bond for the development of the Tiwi-
MakBan geothermal energy facilities. 76
The above was published in RAM‟s report on the Philippines power sector, Bridging the Supply-
demand Gap, published in September 2016. Subscribers can retrieve the full report at
www.ram.com.my
75
Source: Philippines Energy Development gets USD75 million loan from IFC, May 2011, Reuters 76
Source: ADB Backs First Climate Bond in Asia in Landmark USD225 million Philippines Deal, February 2016, Asian Development Bank
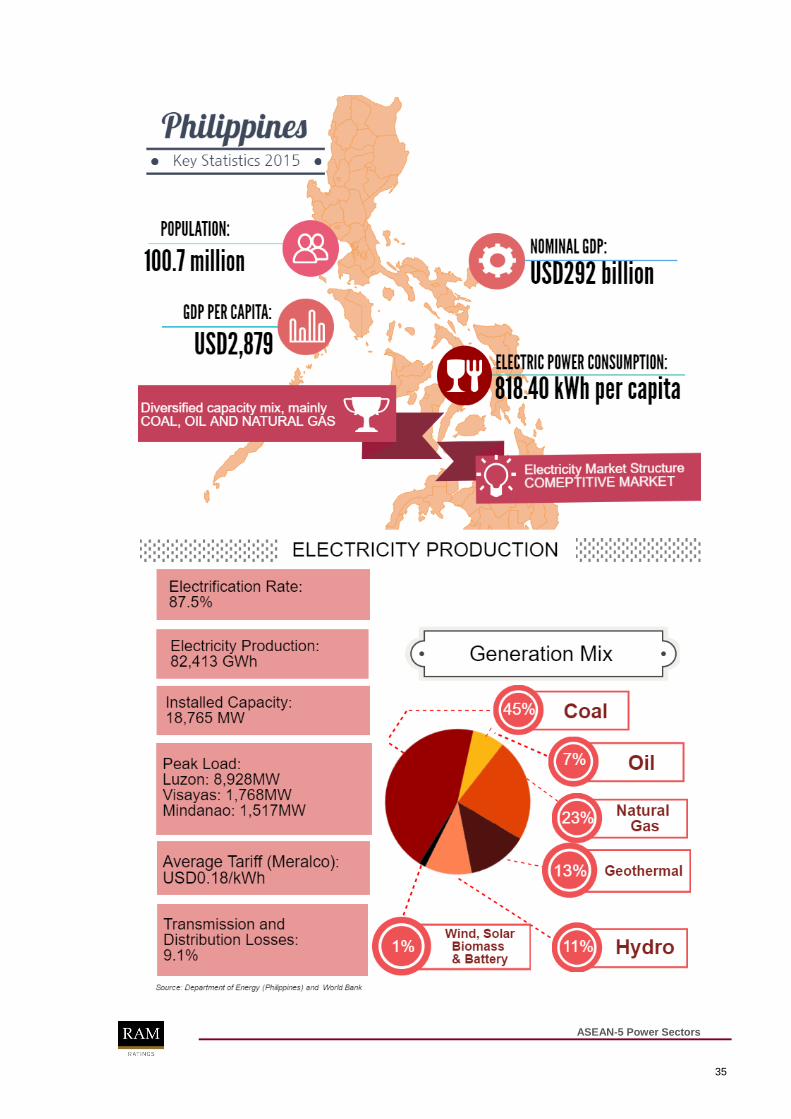
ASEAN-5 Power Sectors
35
ASEAN-5 Power Sectors
36
About RAM
RAM Rating Services Berhad was established in 1990 by the Malaysian central bank, as part of the institutional
infrastructure to support the development of Malaysia‟s debt capital market – now the third-largest bond market in
Asia and the biggest in ASEAN. With more than 25 years‟ experience, RAM is now the leading credit rating agency
in ASEAN and was recognised as the Most Influential Rating Agency in the Region in 2011. Operating out of the
world‟s largest Islamic finance hub, our experience and expertise in sukuk ratings are widely recognised through
numerous awards such as Best Islamic Rating Agency in 2012, Most Outstanding Islamic Rating Agency between
2011 and 2013, and 1st runner-up as Best Islamic Rating Agency in 2015.
Our rated portfolio is defined by our strong presence in Malaysia as well as the coverage of foreign ringgit issuers
across the globe. In our continuous quest for excellence and innovation, RAM launched its ASEAN and global
rating scales in January 2013. Since then, our franchise has been steadily gaining traction on the international
front. In June 2013, the Tokyo Stock Exchange for the PRO-Bond Market recognised RAM as one of 6 globally
accredited rating agencies for its bond listings. In May 2016, RAM joined the ranks of the first 6 global credit rating
agencies to participate as a signatory to the United Nations-supported Principles for Responsible Investment‟s
Statement on Environment, Social and Governance in Credit Ratings.
The power sector has been a vital part of RAM‟s journey. We pioneered the rating of the first project-finance sukuk
in Malaysia in 1993. With over 2 decades of experience in rating power bonds featuring various technologies, RAM
is the leading voice in Malaysia‟s power-sector financing. RAM has rated over RM95 billion of bonds in the power
sector since its inception.
For more information, please visit www.ram.com.my or contact Mr Firhan Yasser at +603 7628 1077, or Ms
Padthma Subbiah at +603 7628 1162.
ASEAN-5 Power Sectors
37
Published by RAM Rating Services Berhad
Reproduction or transmission in any form is prohibited except by
permission from RAM Rating Services Berhad.
Copyright 2016 by RAM Rating Services Berhad
No statement in this paper is to be construed as a
recommendation to buy, sell or hold securities, or as investment
advice, as it does not comment on the security's market price or
suitability for any particular investor.
RAM Rating Services Berhad
Suite 20.01, Level 20
The Garden South Tower
Mid Valley City, Lingkaran Syed Putra
59200 Kuala Lumpur
T: (603) 7628 1000 / (603) 2299 1000
F: (603) 7620 8251
W: www.ram.com.my

RAM Ratings | CreditPulse
38