ase- 3857 final report fabrication of a focusing soft … · fabrication of a focusing soft x-ray...
TRANSCRIPT

ASE- 3857
FINAL REPORT
Contract NASW-2292 Phases II, III and IV
FABRICATION OF A FOCUSING SOFT
X-RAY COLLECTOR PAYLOAD
30 June 1976
Prepared by:
J. M. Davis, A.R. DeCaprio, H. Manko , J.W.S. Ting
American Science and Engineering, Inc.955 Massachusetts AvenueCambridge, Massachusetts 02139
Prepared for:
Goddard Space Flight CenterNational Aeronautics and Space AdministrationGreenbelt, Maryland 20771
Period of Performance:
22 November 1972 to 30 June 1976
Approved by:
••>''V *.
John M. DavisProgram Manager
https://ntrs.nasa.gov/search.jsp?R=19760023439 2018-06-30T18:09:04+00:00Z

FOREWORD
This document is the Final Report for Phases II, III and IV for
NASA Contract NASW-2292. The period of performance for the
three phases was 22 November, 1972 to 31 January 1976. The
contract provided for the fabrication of a soft x-ray collector payload
and for its launch on Aerobee 350 sounding rockets 17. 015UG and
17.016UH.
Note; Following the flight of 17. 016UH the contract was extended,
at no increase in cost, until June 30, 1976 in order to allow AS&E
to support the refurbishment and flight of 17. 017UH. The launch
took place on the night of June 16, 1976. The instrument functioned
normally during the flight and was recovered intact.
ii

CONTENTS
Page
FOREWORD ii
CONTENTS ill
LIST OF ILLUSTRATIONS iv
LIST OF TABLES vi
1.0 INTRODUCTION 1-1
1. 1 Background 1-1
1.2 X-Ray Imaging 1-2
1.3 Electronic Image Detection 1-4
2. 0 THE TWO-DIMENSIONAL FOCUSING PAYLOAD 2-1
2. 1 General 2-1
2.2 The X-Ray Mirror 2-1
2 . 2 . 1 Material 2-3
2 . 2 . 2 Assembly and Alignment 2-3
2 . 2 . 3 The Fiducial System 2-9
2 . 2 . 4 Mechanical Drawings 2-9
2.3 The Position Sensitive Detector 2-13
2 .3 .1 Design, Test and Operation 2-14
2 . 3 . 2 Electronic Processing Circuits 2-16
2 .3 .3 Circuit Diagrams 2-23
3. 0 FLIGHT OPERATIONS FOR 17. 015UG and 17. 016UH 3-1
3.1 17.015UG 3-1
3.2 17.016UH 3-2
4.0 CONCLUSIONS 4-1
5.0 PERSONNEL AND ACKNOWLEDGEMENTS 5-1
REFERENCES
iii

LIST OF ILLUSTRATIONS
FigureNo. Page
1-1 (a) A Simple Kirkpatrick-Baez Device 1-3
(b) A Nested Set of Orthogonal Mirrors 1-3
1-2 Simplified Diagram of the Electrode Arrange-ment Within an Imaging Proportional Counter 1-6
2-1 Schematic Diagram of the Aerobee 350 Payload 2-2
2-2 (a) The X-Ray Mirror Assembly Showingthe Sheet Metal Mounting Box, Longerons,and End Plates 2-6
(b) The Fully Assembled Mirror 2-6
2-3 (a) Schematic of a Mirror Plate Showing theDistortion Produced along the Free Edgeswhen the Clamped Edges are Bent into aParabola. " 2-8
(b) Diagram of a Line Image from a SingleReflection showing the End Spreading Dueto the Synclastic Bending 2-8
2-4 A Pinhole Array Photographed with the TwoDimensional Focussing Collector Prior toThe First Flight. The Pinholes have an AngularDiameter of 30 arc seconds and a Center toCenter Separation of 3. 3 arc minutes. 2-10
2-5 Photographs of the Pinhole Array After theRealignment Performed Before the SecondFlight. 2-11
2-6 The Fiducial System 2-12
2-7 Photograph of the Focal Plane Assembly 2-15
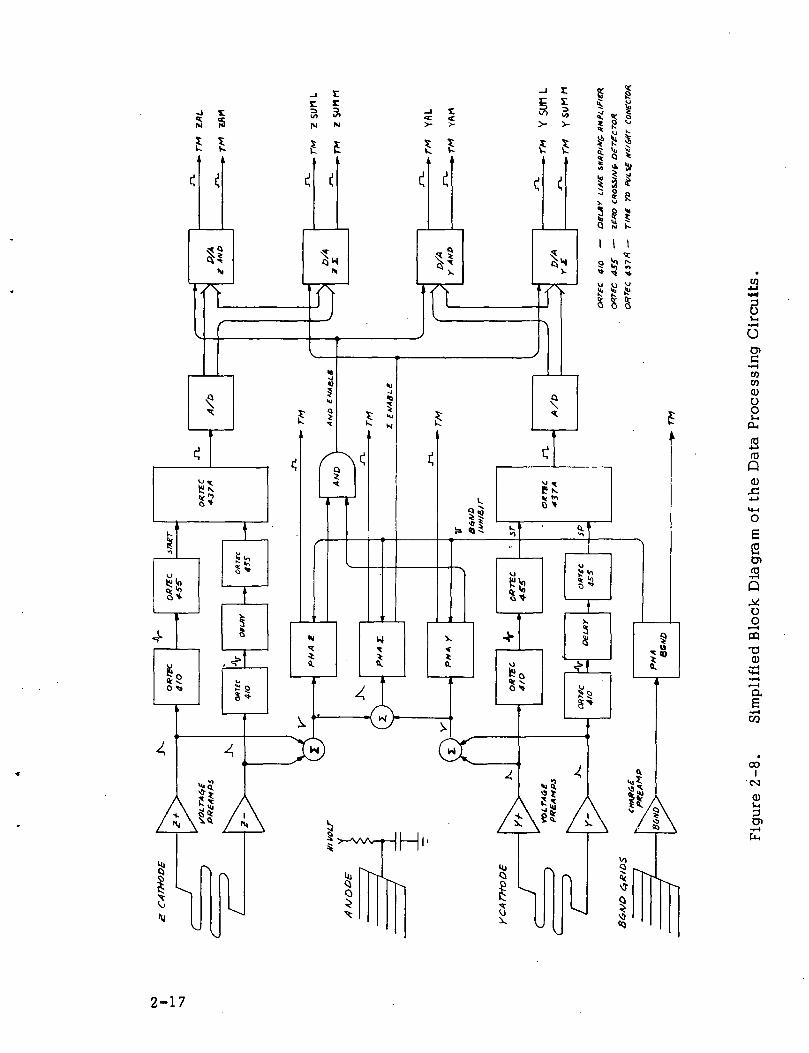
2-8 Simplified Block Diagram of the DataProcessing Circuits 2-17
iv

LIST OF ILLUSTRATIONS (Continued)
2-9 Pulse Shapes and Times for a SingleCathode
(a) The preamplifier output showing theposition of the inflection point, t , whichdefines the pulse rise time.
(b) The preamplifier pulse is delayed by atime At, inverted and amplified by factor 2.
(c) The preamplifier pulse is delayed by atime 2At, without amplification.
(d) Pulses (a), (b), and (c) are added toform a bipolar pulse whose zero-crossingoccurs at t + At.
r(e) The output of the zero-crossing detectorwhich provides the start pulse for the 437A. 2-18
2-10 Block Diagram of the Modified TelemetryInterface for the PCM System. 2-24

List of Tables
Table Page
I Characteristics of Large Area Focusing 2-4Collector for Aerobee 350
II 17. 015UG Telemetry Channel Allocation 2-21
HI Commutator Assignments for 17.015UG 2-22
IV 17. 016UH Telemetry Channel Allocation 2-25
vi

1.0 INTRODUCTION
1. 1 Background
Following the discovery of stellar x-ray sources, the science of
x-ray astronomy has developed rapidly as increasingly sophisti-
cated measurement techniques have provided new information on
source positions, the time variations of the radiation and its
spectral and spatial distribution. For the class of x-ray objects
which possess a finite size, when viewed from the earth, two-
dimensional images would provide significant information on the
precise source position and the spatial distribution of the emitting
material. To achieve these goals a program of focusing stellar
x-ray astronomy was initiated, with NASA support, at AS&E. One
phase of the program was aimed at the development of large area
imaging system capable of operation from sounding rockets. It
was initiated in 1969, under the direction of Dr. Paul Gorenstein,
with the issuing of NASA contract NASW-1889 and has continued
through the present under NASA contract NASW-2292. During the
performance of the first contract, a one-dimensional focusing
instrument was developed and flown. Contract NASW-2292 was
granted to re-fly (Phase I), improve the instrument (Phase II) and
obtain new flight data (Phases III and IV). Halfway through the
performance of Phase II, the scientists, including the Principal
Investigator, associated with the program, transferred their affilia-
tion from AS&E to the Smithsonian Astrophysical Observatory,
Cambridge, Massachusetts (SAO). At this time, June 1973, the
responsibility for the tasks described in the statement of work of
Contract NASW-2292 were divided between the two institutions.
SAO was responsible for the analysis of the data from the flight
undertaken during Phase I and for the overall scientific direction
of the Program. AS&E was responsible for the design and fabrica-
tion of the new payload and for integration and launch support.
1-1

This report covers the work performed by AS&E under Phases II,
III and IV of NASA contract NASW-2292 and covering the period
of performance from 31 September, 1972 to 31 January, 1976.
1. 2 X-Ray Imaging
The application of focusing x-ray optics to stellar astronomy was
first discussed by Giacconi and Rossi (1960). They described an
optical system which would focus x-rays using the principle of
total external reflection for glancing incidence rays. Wolter (1952
a,b) had shown that reflections from two successive conic sections
are required to minimize the optical aberrations of the system. This
principle, when used with paraboloid-hyperboloid combinations has
been highly successful in obtaining high resolution (1-2 arc second)
images of the solar x-ray corona (Vaiana, 1972). However the app-
lication of this type of system to stellar astronomy is limited
because the reflecting surfaces tend to have small collecting areas
and the stellar sources have low flux levels. Consequently the
amount of observing time provided by a sounding rocket flight is
insufficient to accumulate enough data for reasonable images.
It was soon realized that x-ray mirrors with much greater collect-
ing areas can be constructed using a design concept first suggested by
Kirkpatrick and Baez (1948) of crossed spherical reflectors. A
simplified Kirkpatrick-Baez device is shown in Figure 1-1 (a).
The incident ray strikes successively two paraboloids oriented
perpendicularly to one another. In practical designs, the surface
area is increased by using many approximately parallel paraboloids.
Figure 1-1 (b).
The first test of this design took place in June 1970, when a one-
dimensional array was flown aboard an Aerobee 170 rocket to ob-
serve portions of the constellations Virgo and Cygnus (Gorenstein
et. al., 1971). The flight was successful and the instrument was
1-2

A
FOCUS
BMIRRORS
Figure 1-1. (A) A Simple Kirkpatrick-Baez Device(B) A Nested Set of Orthogonal Mirrors,
1-3

improved and reflown in April, 1972,under Phase I of this contract,
to study the Vela-Puppis region (Gorenstein et. al.. 1973).
Following the flight it was felt that sufficient practical experience
had been gained with the one-dimensional system to start develop-
ment of a true two-dimensional imaging system. In the following
sections the design, fabrication and testing of the two-dimensional
mirror and payload will be described.
1. 3 Electronic Image Detection
Stellar x-ray sources have relatively low flux levels, consequently
the traditional image recording methods (e.g. photographic film)
are too insensitive and it is necessary to turn to electronic imaging
techniques, with which the individual'x-ray photons are detected and
recorded. Two different approaches to electronic imaging appeared
technologically feasible at the start of the program. Both rely on
the conversion of the incident photon into an electron and its
subsequent amplification. In the first technique, the micro-
channel plate, the spatial location of the incident photon is
retained by allowing the electron amplification to occur within one
of an array of small tubelets across which an electric potential has
been applied. The resulting electron beam can be detected by a
variety of techniques e.g. proximity focusing onto a phosphor screen,
coupled to a TV camera. This method is useful for high resolution
(arc second), small field of view (1 square degree) applications.
However the objectives of the present experiment called for a
large field of view instrument with only moderate resolution (arc
minutes) and a large field of view (10 square degrees) and the
Imaging Proportional Counter (IPC) approach was chosen. With this
detector the location of the electron avalanche occurring at the
anode wire is measured. Since the IPC still retains the properties
of a traditional proportional counter it possesses the additional
1-4

advantage of being able to measure the energy of the incident
photon, thus permitting spectral measurements to be made at
each spatial location.
IPC's are multiwire proportional counters in which the anode
plane is situated between two cathode planes. The latter are
each formed from a continuous wire which is wound in such a way
as to map the plane in one-dimension (Figure 1-2). The avalanches
arising from x-ray events occur in the proximity of an anode wire
and the motion of the positive ions in the large electric fields at
the vicinity of the wires induces fast-rising positive pulses on
the surrounding cathodes. Different methods have been developed
to determine the position of the centre of the avalanches. The
most common are the delay-line method of the Perez-Mendez Group
(Perez-Mendez, 1974), the rise-time method of Borkowski and Kopp
(1972) and a center of gravity analysis of groups of cathode wires
(Charpak, 1974).
Following a review of the possible techniques it was decided to
adopt the approach of Borkowski and Kopp and to attempt to extend
their results to lower photon energies.
1-5

UPPER CATHODEZ POSITION
INCIDENT AVALANCHE
ANODE
\
LOWER CATHODEY POSITION
VOLTAGEPREAMPS
+HV
X
Figure 1-2 . Simplified Diagram of the Electrode ArrangementWithin an Imaging Proportional Counter
1-6
2. 0 THE TWO-DIMENSIONAL FOCUSING PAYLOAD
2. 1 General
Figure 2-1 shows a schematic representation of the payload. It
consists of
(a) The two-dimensional crossed paraboloid mirrorassembly.
(b) An aspect camera and star tracker
(c) A focal plane assembly containing an imagingproportional counter and its preamplifiers, highvoltage power supplies and gas system.
(d) A fiducial system
(e) Housekeeping, data handling, instrumentation andtelemetry electronics.
The primary design criterion was to build a mirror with sufficient
collecting area to ensure adequate counting statistics. For this
reason an Aerobee 350 was chosen for the launch vehicle which
provided a payload cylinder of diameter 55. 9cm and length 254 cm.
To conserve cost the fabrication of the basic structure was under-
taken by GSFC to the design developed by AS &E . The fabrication
was subcontracted by GSFC to the Middlestadt Machine Company
of Baltimore, Maryland.
2. 2 The X-Ray Mirror
The general geometric relations governing nested arrays of orthogonal
parabolas have been derived by Van Speybroeck et. al.. (1971) and
their equations were used to develop the design parameters of the
mirror. In general the parameters can be restricted to the effective
diameter of the mirror, the length of the reflecting surfaces, the
focal lengths of the mirrors and the orientation of the individual
plates to the central axis. As these parameters are varied the
resolution and collecting area are determined using ray tracing
techniques for each configuration. For radiation on-axis the resolu-
2-1

•a10
(0a,oLOCO
X!
2
oS!_,&(0-ftQoi-l4->(0S0)
oco
0)
3Cn
2-2

tion is theoretically perfect in one-dimension and about a second
of arc in the orthogonal direction. Off-axis the resolution degrades
as the first power of the angle. In practice, alignment errors and
imperfections in the reflecting surfaces have limited the resolution
to a few arc minutes everywhere within the field of view.
Table I summarizes the characteristics of the telescope. The
effective collecting area has been determined by ray tracing using
the values of the x-ray reflectivity as a function of angle of
incidence measured during Phase I of this contract.
2 .2 .1 Material
The reflecting surfaces consist of commercially available float
glass coated with 500 A of gold upon a 500A chromium base. This
is the same material used for the one-dimensional collectors
and it was chosen because of the following factors.
(a) Adequate reflectivity and scattering properties overthe range of wavelengths and incident angles required.
(b) Good physical stability for maintaining the desiredcurvature under stress.
(c) Relatively low cost and good availability comparedto polished surface materials.
2 . 2 . 2 Assembly and Alignment
The mechanical design of the mirror must satisfy certain criteria.
Briefly they are
(a) It must provide a method of achieving the desiredcurve on each of the mirror surfaces.
(b) It must allow the images from the separate surfacesto be superimposed.
(c) It must maintain the geometrical relations betweenthe surfaces and ensure their survival through thefull range of environments associated with a soundingrocket flight.
2-3

TABLE 1
CHARACTERISTICS OF LARGE AREA FOCUSING COLLECTORFOR AEROBEE 350
Focal Length
Number of Plates
Total Geometric Area
Effective Area of Assembly
Detector Efficiency
Net Effective Area
Field of View
Angular Resolution
180 cm
26 Front (25. 4cm x 50. 8cm x . 25cm)
18 Rear (36. 8cm x 50. 8cm x . 25cm)
40.6 x 25 .4 ~ 1000cm2
185cm2 (0 = 0, X= 10 S)n ^
264cm (0 = 0, X= 44 A)
.65 (X = 10
.55 (X= 44
120cm2 (0 = 0, A = 10
145cm2 (0 = 0, A =44
40 arc minutes, radius, FWHM
3 arc min x 3 arc min Design
1 arc min x 1 arc min Achieved
2-4

Our approach has been to mount the plates within a rectangular
aluminum sheet metal box which is supported at each end by
relatively massive magnesium plates. The plates are held
together by longerons which provide torsional stiffness to the
assembly and also allow for mounting points to the payload structure
(Figure 2-2a).The longerons are also useful in adjusting the separa-
tion of the two mirror assemblies for the best focus. A photograph
of the assembled mirror is shown in Figure 2-2 b .It is 101. 6cm long
and weighs approximately 528 kg. and is positioned in the payload
structure through a system of 24 Barry isolation mounts. The
system has proved effective against misalignments arising during
the powered phase of the rocket flight. Tests performed after
recovery have shown no evidence of degradation of the mirror
images.
The isolation system has also proved to be effective in stabilizing
the payload when subjected to the Aerobee vibration and acceleration
test levels. After a typical series of vibration tests the change
in relative alignment between the optic axis of the mirror assembly
and a fixed point in the focal plane was less than 10 minutes of
arc. The change in internal alignment of the mirror assembly i.e.
the change in relative position of the images from different surfaces,
was less than 20 arc seconds.
The individual glass plates are bonded to aluminum channels which
in turn are mounted within the rectangular box container. The
aluminum channels run the full length of the plates and care was
taken during the bonding process to ensure a uniform separation
between the channels, along their entire length. Mylar adhesive
tape (. 005 cm thick) was attached to the back of the plates to
retain the glass in the event of fracturing. To complete the mirror
aperture plates of 0. 018cm aluminum foil were formed and bonded
2-5

(a)
(b)EW-045
Figure 2-2. (a) The X-ray Mirror Assembly Showing the SheetMetal Mounting Box, Longerons, and End Plates
(b) The Fully Assembled Mirror
2-6

to the rear of each plate to eliminate straight through radiation
i.e. incident x-rays which had passed through the mirror without
suffering reflection .
The mirror surfaces are held in position by attaching the aluminum
channels to the rectangular box at 5 points along the nominal
parabolic curve with eccentric bushings having screws in an axis
hole for clamping purposes. Each bushing can be displaced
independently about 0. 2 5mm and is clamped by the screw prior to
being expoxied in its desired location.
To align the plates, the individual mirror assemblies are set on an
optical bench and illuminated with collimated light from a point
source. In the focal plane the image from a single surface will be
spread out into a line. The first stage in the procedure is to
superimpose the images from the different plates by manually
'tuning1 the curve of each reflecting surface. The effect of the
tuning is observed by placing slits in the focal plane near to both
extremities of the image. Photoelectric detectors are mounted
behind the slits and the curve of the plate adjusted until the out-
put of the detector is maximized.
The above procedure is complicated by synclastic bending. This
effect introduces a curvature in an orthogonal direction when the
glass is bent to conform to the desired arc. (See Figure 2-3 for
a schematic representation). The result of the synclastic bending
on the image is a bending and spreading of the line image primarily
at its ends (Figure 2-3b). If the synclastic effect is tuned out the
resulting image shows marked improvement.
After both sets of mirrors have been aligned they are mounted
together and the combined image can be observed. For test
purposes we have used a star pattern, which has 30 arc second
2-7

REFLECTINGSURFACE
FREE EDGE
CLAMPEDEDGES
PARABOLICCURVE
UNDISTORTED EDGE
Figure 2-3. (a) Schematic of a Mirror Plate Showing the DistortionProduced Along the Free"Edges When the ClampedEdges are Bent Into a Parabola.
Figure 2-3. (b) Diagram of a Line Image From a Single ReflectionShowing the End Spreading Due to the SynclasticBending.
2-8

pinholes on 3.3 arc minute centers. Two sets of images are shown
in Figures 2-4 and 2-5. The test plates were taken before the
first and second flights respectively and the improvement in the
second set of images is due almost entirely to the removal of the
synclastic effect. For these images the resolution approaches
one minute of arc. To reach this level it was necessary to repeat
the tuning procedure several times, at each stage making slight
improvements to the one-dimensional image.
2 .2 .3 The Fiducial System
The mirror assembly is attached to the structure through the vibra-
tion isolation system. This does permit slight motion of the
assembly with respect to the structure and in order to correct for
possible changes in alignment, during flight, a fiducial light system
is used to mark the position of fixed points in the focal plane rela-
tive to the mirror system. The information is transmitted to the
aspect camera by means of relay lenses, prisms and a fiber optics
light guide (Figure 2-6). In operation a pinhole array is attached
to the counter body and is imaged through two lenses onto a coherent
fiber bundle attached directly to the mirror assembly. The exit
of the fiber bundle is viewed by a collimating lens which relays
the light beam to the star camera.
Changes in alignment between the counter and mirror will alter
the position of the pinhole array in the aspect camera field. The
range of the fiducial system and the focal plane coverage of the
detector is far greater than any expected or experienced changes
in the alignment.
2 .2 .4 Mechanical Drawings
A complete set of engineering drawings for the payload structure and
internal components was made during the design and fabrication
phases of the contract. Although not included in this report they
are available upon request.
2-9

Exposure TimeSeconds
1/4
1/15
1/30
NON-1
Figure 2-4. A Pinhole Array Photographed with the Two DimensionalFocusing Collector Prior to the First Flight. The Pin-holes Have an Angular Diameter of 30 Arc Seconds anda Center to Center Separation of 3.3 Arc Minutes
2-10

Distance FromFocus - mm.
Exposure TimeSeconds
1/6
1/15
•
.05 1/10
NON-2
Figure 2-5 . Photographs of the Pinhole Array After the RealignmentPerformed Before the Second Fligh
2-11

•o
0£OQ_OCXI.Q_
CD 0£
LOCD
£0)-t-jw>,
CO
^-H03•iHo
0)
H
toI
CM
COC_)
1r—Q_O
BLUC£
U.
<^"~
S
Lno.—i
IIu.
<C
~^>—
^^>—
nV•sss,*sN,Xv.^VVss,s.XXSs^
• J
c_>— >Qi1 —CO
en<t0— 1
Q_
CD
2-12

2. 3 The Position Sensitive Detector
As described in Section 1. 3 an Imaging Proportional counter was
chosen for the detection device and the position sensing approach
adopted was that of Borkowski and Kopp (1972). It consists of
utilizing the cathode plane as an internal transmission line for
signals that are induced by event signals in the anode plane.
Charge produced by an x-ray interacting anywhere in the gas drifts
along the parallel electric field toward the plane of the anode wires.
Drift field electrodes, held several hundred volts above ground
potential shape the field around the periphery of the active volume
insuring that the electrons, liberated in the interaction, do not
move laterally. Charge multiplication takes place at one of the
wires in the anode plane as in a conventional proportional counter.
Thus the anode signal contains information on the energy, absolute
time of the original event and the pulse shape of the signal which
can be used for discrimination against x-ray or particle events.
For the present experiment the important fact is that the location
of the event in the anode plane is preserved during the multiplica-
tion process and a localized signal is induced in each of the two
orthogonally wound cathode planes. The cathode plane wire acts
as a transmission line for the propagation of the signal from the
point of maximum induced voltage to the ends of the wire. The
transmission line is of the type where its characteristic time
constant per unit length is large and the self-inductance and loss
factor are small. Thus the rise time of the voltage signal arriving
at the end of the wire depends on the length of transmission line
the signal has traversed. By carefully choosing the composition of
the wire and its diameter, a total resistance of several thousand ohms
can be obtained and the resulting difference in rise time of the signal
between the two ends of the wire determines the location of the induced
signal to a precision of a few percent.
2-13

2.3.1 Design. Test and Operation
At the time of the transfer of affiliation of the Principal Investigator
to the Smithsonian Astrophysical Observatory (SAO), it was
mutually agreed that the development of the IPC should be under-
taken by SAO. Consequently the development program will not be
described in this report. For the flight counter, the external
housing was designed by AS&E, while SAO was responsible for the
design and internal arrangement of the electrodes. The focal plane
assembly is shown in Figure 2-7 which shows the IPC surrounded b"
the pre-amplifier electronics and high voltage supplies and the gas
supply system. Not shown is the vacuum door which protects the
1 micron polypropylene counter window during ground operations. It
is needed because the counter , when using propane, is operated at
half an atmosphere of pressure and the window is designed to with-
stand only outward directed pressures.
The prototype and flight counters were tested at AS&E using our
soft X-ray vacuum facilities. Measurements of the position and
energy resolution were made using pure propane and a mixture of
90% argon and 10% carbon dioxide as the proportional counter gases.
In both respects propane proved to be superior and it was capable
of providing one millimeter spatial resolution (corresponding to
approximately 2 arc minute angular resolution with the rocket
mirror) and adequate energy resolution at 0.28 keV. The position
resolution improves with gain at the anode so the ultimate resolution
is largely a function of the potential difference which can be sustained
before breakdown occurs. This condition is determined by the sur-
face condition of the anode wires. When breakdown does occur it
was found that the anode plane was more susceptible to irreversible
damage when propane was used. Consequently most of the test program
was conducted with Argon-CO , although during the two flights£t
propane was used.
2-14

XISo>ww
<CQ)
(0
(0O
a(0uen
(X
Ioo
§
2-15

The counter development program took considerably longer than
had been Initially anticipated and by the time a working prototype
existed the technical specification of the counter-sampling electro-
nics interface had undergone radical changes. So radical were
the changes that the prototype electronics were quite unsuitable
for operation with the counter. Consequently, as the test program
had been run with standard rack mounted ORTEC modules it was
decided to use similar units in the rocket payload. This required
repackaging the ORTEC modules into the volume set aside for
the processing electronics and providing the correct voltages and
synchronizing signals.
2.3.2 Electronic Processing Circuits
Figure 2-8 is a schematic of the electronic processing system
using the ORTEC modules. The circuits have 3 major functions.
They are
(a) determine the position co-ordinates of each event
(b) measure the incident energy of the photons producingthe events recorded in (a) above.
(c) discriminate against 7- ray and particle induced events.
Of these only the first presents any serious design problems and
in the present application circuits from the earlier one dimensional
focusing payload were modified to perform the pulse height analysis
and anti-coincidence functions. The position sensing circuits
operate as follows. Signals induced by an electron avalanche at
the anode are detected and amplified by non-inverting pre-amplifiers
connected to both ends of the cathode. The signals have rise
times between a few tens and a few hundred nanoseconds depending
upon the location of their origin along the cathode (See Figure 2-9
for a pictorial representation of the pulse shapes). The rise time,
t , of the pulse is measured from a selected threshold to the
point of inflection occurring on the leading edge of the voltage
2-16
co4-1«4
o!_.-rHo
COCDOo
(0Q0).c
O
E
E
ooH
CO
TD(U
Q.
•»HCO
oo
'CM
0)ll
2-17

_
O UJ
§5
Figure 2-9 Pulse Shapes and Times for a Single Cathode
(a) The preamplifier output showing the positionof the inflection point, t , which definesthe pulse rise time .
(b) The preamplifier pulse is delayed by a time At,inverted and amplified by factor 2.
(c) The preamplifier pulse is delayed by a time 2At,without amplification.
(d) Pulses (a), (b), and (c) are added to form abipolar pulse whose zero-crossing occurs att + At.
(e) The output of the zero-crossing detector whichprovides the start pulse for the 437A.
2-18

pulse. This is the point where the slope of the leading edge Is
steepest. Consequently, If we consider the signal to be the
composition of the true signal, v, plus a constant noise component
± 6v, the effect of the noise on the voltage signal, resolved Into
an uncertainty in time, will be a minimum when the slope is a
maximum. To define this time electronically the pulse is shaped
using delay line clipping and amplification In the ORTEC 410 unit
(Figure 2-9). The output from the 410 is a bipolar pulse and the
point of inflection of the original pulse Is now defined by the time
of zero-crossing. It occurs at time t + At where At Is a delay time
introduced in the shaping process. The zero crossing is detected
by the ORTEC 455 operated in the bipolar mode. It generates a
narrow pulse at the zero-crossing which is used to trigger the 437A,
a time to height converter. Prior to the 455,pulses from both ends
of the cathode are treated identically. However since either pulse
can suffer the greater rise time delay in order to measure the
difference an additional delay (set equal to the total cathode delay)
is introduced in one channel. The undelayed pulse is used to
trigger the 437A and start the timing pulse and the delayed pulse to
end It. Thus the measured delay can vary from zero to twice the
total cathode delay and the position of the event along the cathode
is proportional to the difference in rise times between the pulses
detected at the opposite ends of the cathode. If no stop signal is
received within a fixed time the 437A Is reset. The output from
the 437A is digitized in an 8 bit analog to digital converter. The
eight bits are separated into the 4 least and the 4 most significant
before entry into digital to analog converters. The separation is
necessary as 16 is a practical maximum for the number of levels
which can be unambiguously defined within a single telemetry
2-19

channel. In the final digital to analog converters, the data pulses
are stretched, and if the real event criteria are satisfied displayed
to the telemetry interface for approximately 1 .5 msec or slightly
longer than twice the sampling frequency.
Two criteria for classifying real events have been developed which
are identified as SUM and AND. In the SUM mode the pulse
amplitude resulting from the linear summation of all four preamplifier
outputs must exceed a certain threshold. This acceptance criterion
is based on the total charge of the event. When it is satisfied
cathode position and the summed preamplifier outputs are displayed
to telemetry.
The second or AND mode requires that the linear sum of both the
Y and Z preamplifiers, considered separately, must exceed specific
thresholds. For this case the cathode position and the separate
preamplifier summed outputs are transmitted.
Signals from the background wires are used to detect 'Y-rays and
particles traversing the counter and the presence of a background
signal in coincidence with either the SUM or AND signals over-
rides the acceptance criteria.
In the first flight (17.015UG) two pulse position modulation (PPM)
transmitters were used to provide redundancy and the channel assign-
ments are shown in Table II. In addition to the scientific data,
aspect camera information and housekeeping functions are also
transmitted.
For the second flight (17.016UH) the telemetry interface and pro-
cessing system was redesigned to take advantage of the pulse
coded modulation (PCM) telemetry which was now available. At
the same time it was possible to eliminate quantizing problems
2-20

CHANNEL
2345678910111213141516
TABLE II
17. 015UG TELEMETRY CHANNEL ALLOCATION
PPM #1. 232.9 MHz PPM #2. 244.3 MHz
Y sum LY sum MZ sum LZ sum MPYPZCommutator Pole 2Coding LightY sum LY sum MZ sum LZ sum MPYPZClutch
YALYAMZALZAMP sumPBCommutator Pole 1ShutterYALYAMZALZAMP sumPBClock
Note: Channels 2&10, 3&11, 4&12, 5&13, 6&14, 7&15, tiedtogether in experiment
Legend
1. Y refers to the proportional counter Y cathode2. Z refers to the proportional counter Z cathode3. Sum refers to the SUM logic coincidence condition4. A refers to the AND logic coincidence condition5. L and M refer to the least and most significant bits6. P refers to pulse height data7. B refers to data from the counter background wires8. The commutator assignments are shown in Table III.
2-21

TABLE III
COMMUTATOR ASSIGNMENTS
FOR 17.015UG
SEGMENT FUNCTION - POLE 1
1 +5V2 +5V3 +5V4 Low Pressure - Course5 Low Pressure - Fine6 4.0V7 3.0V8 2.0V9 1.0V
10 GND11 + 28. 5V Power IN12 + 28.5V Power OUT13 Camera Timed Power14 HVPS Timed Power15 Time Delay Relay Power16 HVPS Input Power #117 HVPS Input Power #218 Squib Battery 1&2-Armed19 Squib Mon #120 Squib Mon #221 Not Used22 HVPS-Anode23 HVPS-Z Cathode24 HVPS-Y Cathode25 HVPS-Background26 ± 16. 5V Logic Pwr OUT27 ± 1 6 . 5V.Logic Pwr OUT28 + 16. 5V Preamp Pwr OUT29 ± 16. 5V Preamp Pwr OUT30 +5V
FUNCTION - POLE 2
+ 5V+ 5V+ 5V
Low Pressure - CourseLow Pressure - Fine
4.0V3.0V2.0V1.0VGND
+ 30V, - 28.5V Y OUTEXT-INT PositionVacuum Chamber DoorFiducial Light #1Fiducial Light #2+ 16.5V Power IN+ 9V Power IN+30V, - 28. 5V Power INClutch PulseClutch Pulse+30V, - 28. 5V Z OUT+9V #1 Power OUT+9V #2 Power OUT+ 12V Regulator+ 16. 5V Preamp Power OUT±16. 5V Logic Pwr OUT±16. 5V Logic Pwr OUTHigh PressureTemperatureClutch Pulse
2-22
that had resulted from the digitizing of the data for display to the
telemetry. The basic concept is shown in Figure 2-10. The
selection criteria of the SUM and AND modes are the same as in
the earlier design and are tested in the amplifier/discriminator.
In the SUM mode, the discriminator output drives the SUM timing
control logic where control signals are generated for three sample
and hold display elements. These sample the 437A outputs and
the amplitude of the summed preamplifier outputs. After stretching
the samples are displayed to the telemetry interface for 1. 5 msec.
In the AND mode, a coincidence is required between Y and Z
discriminator outputs to initiate sampling and display. In this
case no pulse height information is recorded. The channel assign-
ments are shown in Table IV.
2.3.3 Circuit Diagrams
A complete set of circuit diagrams, including printed circuit board
layouts of
(i) the electronic data processing system and telemetryinterface,
(ii) the control system, harnesses and housekeeping,
and (iii) the ground support equipment,
were prepared during the design, fabrication and test phases of
the contract. Although not included in this report they are avail-
able upon request.
2-23

W
5>
$ <" ?£ irI 8!? N
|
$
<•
isit^
,*
5?u?•?
>iji
3
j
!"ICt
5. Js**51
il\
, i
2
[1
1fl
1 'F N^I
,
PjioW
N
f
IN
oa*•
itoN
go
"!SI
< a
nt r* > V M «"
f
A
§
, ?* 2
M
Ii
|
,
I1> ]
1 _
| j§«o o2 -i
fP
£
P
i
|
K|
K
i
!i
|
ft i
n '
1
i
I*
i (»S
b '
)/
fj
i
ij
4
2
E
aa
« ^j
i iUcu(U
4-J
0 <+-<
K 0)O
j s • "84iv l ,5
2i
Ifi
1
1
s3
1
Mif
}0
b4-10
0)
H
T30)t-iM-l
0
0>4HO
ES&(0
Q
UO
CQ
O
1
OJ
0)
(J-.
4
2-24

CHANNEL
23456789101112131415
TABLE IV
17. 016 UH TELEMETRY CHANNEL ALLOCATION
PCM fl. 232.9 MHz PCM #2. 244.3 MHz
Y SumZ SumYAZAP SumPBClockCoding LightY SumZ SumYAZAP SumClutch
YSumZ SumYAZAP SumPBClockShutterY S u mZ SumYAZAP SumClutch
Note: Channels 2 & 10,together in experiment.
3 & 11, 4 & 12, 5 & 13, 6 & 14 tied
Legend1. Y refers to the proportional counter Y cathode2. Z refers to the proportional counter Z cathode3. Sum refers to the SUM logic coincidence condition4. A refers to the AND logic coincidence condition6. P refers to pulse height data7. B refers to data from the counter background wires8. Housekeeping Data Transmitted on a separate FM/FM
Transmitter.
2-25

3.0 FLIGHT OPERATIONS FOR 17.015UGand 17.016UH
3.1 17.015UG
Following fabrication of the payload an extensive testing program
was undertaken to demonstrate the integrity of the instrument. The
program included separate vibration tests of the electronics panel
to show that the repackaged ORTEC units would survive the launch
environment. The test program was completed in early December,
1974 and following a successful systems test the payload was ship-
ped to GSFC for integration which ran between 9 and 20 December,
1974.
The major events included the integration of the star tracker and its
co-alignment to the payload optical axis. Following the vibration
of the complete payload at proto-flight levels, the alignment was
rechecked and was found to have remained aligned to within 10 arc
minutes. In order to balance the payload it was necessary to add
4.1kg of ballast divided between the nose and parachute container.
No serious problems were experienced with the electrical operation
of the payload prior to or following T and E and it was returned to
AS&E for a final calibration before shipping to White Sands.
During the calibration period, the IPC and signal electronics were
adjusted for best operation using the soft x-ray vacuum facility at
AS&E. When the Principal Investigator was satisfied with its
performance the payload was shipped to White Sands.
Field operations for 17. 015UG, which commenced on 26 February,
1975, were not uneventful as serious problems were experienced
with the IPC window, which developed leaks and had to be replaced,
necessitating a second set of final calibrations and with a failure
of the aspect camera. The problems were all solved and the payload
was placed in the tower and the vertical test held on 7 March. The
3-1

launch was scheduled for 10 March, but owing to high winds
the launch was cancelled and rescheduled for 14 March. The
winds were slightly lower on this night and the launch occurred
at the end of the evening's window. The rocket described a
perfect trajectory and all the instrument systems operated correctly.
Unfortunately it was discovered that the star tracker had failed
to acquire the targets correctly. That is they had been acquired
but with large offsets that placed them at the edge of the field
of view. However the final target, the Crab nebula, which was
to be used as an inflight calibration source was seen and clearly
demonstrated that the detector was position sensitive.
The payload was recovered successfully with only slight damage
to the x-ray mirror.
3.2 17.016UH
Following the flight of 17. 015UG which had demonstrated that the
instrument was operational but had failed to return any significant
data a reflight was authorized. The refurbishment included cleaning
the mirror and modifying the telemetry interface as described in
Section 2 .3 .2 .
When the mirror was washed to remove the dirt which had adhered to
the plates on impact, it was found that the gold coating was poorly
bonded to the glass and in the majority of plates the metal coatings
were stripped away. Consequently it was necessary to have the
plates recoated and to completely realign the x-ray mirror. However
after recoating and realignment the optical performance of the
mirror was considerably improved (Section 2 . 2 . 2 )
The redesign of the telemetry interface simplified the IPC testing
procedures and a considerable effort was expended in optimizing
the counter performance.
3-2

The payload underwent integration at GSFC between 6 and 14 November,
1975. No serious problems were experienced and the payload was
shipped directly to White Sands.
Field Operations started on 24 November, and apart from a problem
with the counter gas system the operations went according to schedule.
The payload was placed in the tower on 3 December and launched
on the night of 5 December, 1975. The flight was a complete success
and excellent scientific data were obtained on the Perseus cluster
and the Crab Nebula.
3-3
4.0 CONCLUSIONS
Contract NASW-2292 had been issued to support a program whose
objectives were to obtain two dimensional images of stellar
x-ray objects. It required the development of two new scientific
instruments. - a large area x-ray focusing collector with arc
minute resolution and a position sensitive detector capable of
operating in the soft x-ray region (0. 25 to 5 keV). The instru-
ments were developed and in both cases, the original design criteria
were either attained or exceeded. The instruments were combined
into a sounding rocket payload which functioned correctly on the
two flight opportunities that were available.
The second flight, 17.016UH, was completely successful and it
obtained the first true images of the Crab Nebula and the Perseus
Cluster thus demonstrating unequivocally the operation of the
instrumentation and the achievement of the scientific objectives
specified in the contract.
4-1

5.0 PERSONNEL AND ACKNOWLEDGEMENTS
The success of the Sounding Rocket program described in this
report has been the result of the efforts of many individuals. In
particular Al DeCaprio was in charge of the structural design
and manufacture of the payload and the x-ray mirror assembly.
Joseph Ting and Heinz Manko were responsible for the electrical
design of the housekeeping and data processing circuits
respectively. The development of the IPC was undertaken by
Dr. Rick Harnden, first at AS&E and later at the Center for Astro-
physics. Robert Rasche, of Measurement Laboratories, Inc.,
has acted as an electrical engineering consultant and participated
in both field trips. He was instrumental in optimizing the data
processing circuitry. At AS&E the program has been managed by
Dr. John Davis, working under the direction of the Principal
Investigator, Dr. Paul Gorenstein of the Smithsonian Astrophysical
Observatory.
We would like to thank all the personnel of the Sounding Rocket
Division of GSFC and the staff at the White Sands Missile Range
who assisted in the integration and launch of the payloads.
Finally we would like to acknowledge the help of Mr. John Guidotti
of the Sounding Rocket Division of GSFC who has provided consistent
help and support for the program.
5-1

REFERENCES
Borkowski C. J. and M. K. Kopp, A Proportional Counter PhotonCamera, I.E. E. Trans, on Nuc. Sci.. NS-19. No. 3,161, 1972.
Charpak, G. High Accuracy Position Measurements with DriftChambers and Proportional Counters, I. E. E. Trans,on Nuc. Sci.. NS-21. No. 1, 38, 1974.
Giacconi, R and B. Rossi, A Telescope for Soft X-ray Astronomy,T. Geophys. Res.. 65, 773, 1960.
Gorenstein, P., B. Harris, H. Gursky and R. Giacconi, A RocketPayload Using Focusing X-ray Optics for the Observationof Soft Cosmic X-rays, Nucl. Instr. and Methods. 91,451, 1971.
Gorenstein, P., DeCaprio, A., Chase, R., and Harris, B., LargeArea Focusing Collector for the Observation of CosmicX-Rays, Rev. Sci. Instr.. 4_4t 539, 1973.
Kirkpatrick, P. andA.V. Baez, Formation of Optical Images byX-ravs. T. Opt. Soc. Am., 38. 766, 1948.
Perez-Mendez, V. and S.I. Parker, Recent Developments in DelayWire Readout of Multiwire Proportional Chambers, I.E. E.Trans, on Nuc. Sci.. NS-21. No. 1, 45, 1974.
Vaiana, G.S., Methods of Imaging X-ray Astronomy, CNES SpaceOptics, Marseilles, Gordon & Breach, New York, 295,1970.
Van Speybroeck, L. P., R. C. Chase and T. F. Zehnpjennig, OrthogonalMirror Telescopes for X-ray Astronomy, Applied Optics,10, 945, 1971.
Wolter, H., Glancing Incidence Mirror Systems as Imaging Opticsfor X-ravs. Ann. Physik., 10, 94, 1952a.
Wolter, H., A Generalized Schwarzschild Mirror System for Useat Glancing Incidence for X-ray Imaging, Ann. Physik.JJX 286, 1952b.