ascendis health
TRANSCRIPT

Ascendis Health Investment Report
Healthcare: Pharmaceuticals
Report catalyst: private placement and listing on the Johannesburg Stock Exchange
Ascendis Health JSE short code: ASC
A wealth of possibilities
Ascendis Health represents a unique new medicinal and wellness products investment for small- to mid-cap
investors. The constituent businesses cover human, animal and plant wellbeing requirements and there is a
compatible theme spanning the portfolio. A combination of proven track records, established routes to market,
consumer brand recognition, use of premium raw materials in product composition and the need for
government chemical registration results in challenging moats for would-be competitors to surmount and a fair
degree of pricing advantage. There is a clear strategic purpose behind the targeted businesses methodically
acquired since Ascendis was incorporated in 2008. Private placements have recently been concluded. As a
precursor to a listing there is an institutional placement underway together with a secondary sell-down by
majority owners Coast2Coast and management is invested too. Ascendis has been courted by private equity
investors but a decision to seek a public listing satisfies the owners desire to raise the group profile, retain a
majority stake as an anchor shareholder with long term wealth creation objectives, achieve optimum valuation
over time, create acquisition currency and provide a transparent pricing environment for management incentive.
Whether all this is sufficient for Ascendis to be a successfully performing group in future or have the
differentiating characteristics to sustain a premium pharmaceutical rating remains to be seen. Ascendis is to be
listed effective 22 November 2013 with a 40% free float.
The year ended June 2014 will be the first full financial year for Ascendis Health as a listed entity with three reporting
segments - Consumer Brands, Pharma-Med and Phyto-Vet. Annualised turnover is projected to be R1.9 billion with
profits before interest, tax, depreciation and amortisation at R259 million. There is now sufficient size to take advantage
of economies of scale in procurement, shared services, treasury management, best practice know-how and leadership.
Each business within the group has developed a known value proposition with customers and has an entrepreneurial
business culture that should pair well with a small group-level management team. Organic and acquisitive growth in
South Africa, the African continent and export markets is being sought. Profitability is likely to run ahead of turnover
growth for the foreseeable future. Ascendis has already indicated that it is in advanced discussions with respect to the
purchase of a medical devices business that could conceivably be included in the Pharma-Med division.
The investment case:
Proven businesses with a wellness and medicinal focus underpin the group
A combination of FMCG and Pharma characteristics
Strategy to ratchet up organic growth and performance and add complementary businesses
Substantially cash generating but rate of re-investment in operations could do to be substantially increased
Ascendis is valued as a growth stock with no dividends factored in. Fair value is 1400 cents, target price is 1600 cents.
June
Sales
PBITDA
PBIT
Earnings EPS ex
Free
EV/ P/E
Year end Ex-amortisation EPS amortisation Cash flow PBITDA
Currency ZAR million million million million Cents Cents Cents (x) (x)
2014 1 913,7 259,0 233,2 165,2 67,0 71,9 9,8 15,3
2015 2 181,6 350,6 316,3 217,0 89,6 94,5 111,0 6,5 11,6
2016 2 469,5 415,8 376,2 265,1 110,5 115,4 98,2 5,0 9,5
2017 2 784,7 492,6 447,2 322,0 135,3 140,2 121,3 3,6 7,8
2018 3 116,9 577,1 525,7 385,0 162,7 167,6 147,8 2,5 6,6
Fair value of equity R3 216 million ROE 18% 2015, ROCE 18% Share price 1100c PEG ratio 0,79
Fair value per share 1400 cents F2014 shareholder equity R1 137 million Market cap R2 527 million Shares in issue 229 735 527
Target price 1600 cents Forecast book value 495 cents Company is retaining cash for reinvestment No dividends assumed
Mark N Ingham Director, Ingham Analytics Ltd Mobile office: +27 83 448-6037 Email: [email protected]
This report is confidential, issued for the information of clients of Ingham Analytics Ltd and may not be disseminated other than by prior
consent. Sources referenced are reliable and opinions are formulated in good faith based on professional judgement and thorough analysis.
Use hereof or action taken is done so at own risk. Pricing and estimates effective close of business 11 November 2013
A product of Ingham Analytics Ltd: PO Box 30507, Kyalami, 1684, South Africa
Registered office: Suite 31, Don House, 30-38 Main Street, Gibraltar Issue date 13 November 2013

Ascendis Health Investment Report
November 2013 a product of Ingham Analytics 2
Contents
Disclosure Page 3
Stock appraisal checklist on Ascendis Health Page 4
SWOT on Ascendis Health Page 4
Ascendis company roadmap and strategic forces Page 5
Financial and operational forecasts perspective Page 6
Forecasts for fiscal years ended June - graphical Page 7
Segment forecasts Page 9
Profit & Loss forecasts Page 10
Balance Sheet forecasts Page 11
Cash flow forecasts Page 11
Valuing Ascendis Page 12
Key Ascendis Health people Page 15
Background to listing Page 16
Segment companies Page 17
Competitive positioning overview Page 18
Strategic purpose to the acquisitions Page 19
Consumer orientation to portfolio Page 20
AVI as a consumer products case study Page 21
Adcock Ingram compares on an income split Page 21
Aspen leads the way Page 22
Ascendis serves differing categories Page 25
Segment analysis Page 28

Ascendis Health Investment Report
November 2013 a product of Ingham Analytics 3
Company information
The Ascendis Health company website http://www.ascendis.co.za/ provides financial
and operational information that will further assist investors in making an informed
judgement call.
A pre-listing statement issued in compliance with the Listings Requirements of the
JSE provides further useful commercial, financial, regulatory and other information.
Disclosure
Mark N Ingham (Ingham), director of Ingham Analytics Ltd, has partnered with
Coast2Coast (C2C), the founder and controlling shareholder of Ascendis Health, as
an independent equity research provider. The descriptions, opinions, financial
forecasts, valuations and conclusions reached are entirely those of Ingham. The
report conforms to best financial analysis practice and is fully compliant with relevant
professional codes of conduct and legislative imperatives. Both C2C and Ascendis
Health agreed to respect the independence of Ingham. In making an evaluation of the
company Ingham may take into account material confidential information without
necessarily making that information available in the investment report or to third
parties. He may use material and immaterial public information and non-public
immaterial information to arrive at a conclusion that has the equivalence of material
non-public information and apply deductive logic/reasoning in arriving at a conclusion.
At time of issue of this report Ingham held no beneficial interest, direct or indirect, in
the equity of C2C or Ascendis Health.
This report is confidential, issued for the information of clients of Ingham Analytics Ltd
and potential investors in Ascendis Health and may not be disseminated other than
by prior consent. Sources referenced are reliable and opinions are formulated in good
faith based on professional judgment and thorough analysis. Use hereof or action
taken is done so at own risk.

Ascendis Health Investment Report
November 2013 a product of Ingham Analytics 4
Stock appraisal checklist on Ascendis Health
Industry Positioning ** Established businesses at varying stages of their business life cycles
Management *** Experienced owner-managers, group executives, technical and operating staff
Transparency ** Appropriate disclosure, open-door to interested investors or business vendors
Balance sheet ** Well capitalised, adequate liquidity, able to fund growth and acquisitions
Sales Growth * Ahead of nominal GDP in South Africa, Pharma offers best upside, exports
Earnings Growth *** Ahead of sales, economies of scale with group structure, management incentivised
Rating ** EV/EBITDA and PE attractive; little value trap risk, growth stock rating
Upside *** The stock has strong potential upside if there is confidence in the strategy and execution
Downside * Economic recession or competition permanently depressing earnings – deemed a low probability given historic resilience and new growth vectors
Volatility ** Relatively defensive properties, affordable through to premium products
Stock liquidity * Constrained by majority stake of C2C and management interest in equity, 40% free float
Shareholder structure ** C2C 54% post listing, management 15%, institutional and private 31%
*** Very Good ** Good * Satisfactory - Unsatisfactory -- Poor --- Very Poor
SWOT on Ascendis Health
Strengths Weaknesses
Operating entities founded between 1960 and 2007
Proven business models and brand acceptance
Acquisitions strategically well-chosen
Skilled and motivated entrepreneurial management
Financial position robust on listing
Generic pharmaceutical market subject to stiff regulatory and market pressures
Exchange rate exposure is high
The strategic rationale is appealing but only time will tell if it will be sustainably value enhancing
Capex, investment in R&D and innovation seems light
Opportunities Threats
Optimising margin through integration and procurement
Scope for further complementary bolt-ons
Foreign markets, exports to offset exchange rate risk
Group treasury management systems to mitigate risks
Pharmaceuticals has barely tapped the market potential
Price taker in Pharma
Maintaining active ingredient integrity
Government health policy and implementation
Relative customer concentration – only in a few areas
Failure to reinvest would undermine investment case

Ascendis Health Investment Report
November 2013 a product of Ingham Analytics 5
Exhibit 1
Ascendis Health company roadmap and strategic forces
Company road map
Past Present Future
Strategic forces analysis
Substitutes Customers
Suppliers Competition – USP
New entrants
Some direct competitors to AscendisAspen, Adcock Ingram, Cipla Medpro etcPharmacy and chainstore housebrands Warren Chem, Dermalogica, RegimAUSN, Biogen, AMWAY, Herbalife, Vital Starke Ayers, Green Cross, AVI
Three divisions a platform for an ambitious growth agenda
Exploiting library of dossiers, substantially increased government drug tender business + private market
Medium term opportunities in select African countries and internationally
Capacity to fund acqusitions, cash flow appears predictable
Capital raising, pre-listing roadshow
Listing on JSE 22 November 2013 R1bn in equity, R500m debt consolidation
Establishment of corporate office with support services infrastructure
Integration of businesses into three-pillars of Consumer Brands, Pharma-Med, Phyto-Vet
Financial and IT systems commonality
March 2008: Nutrivest (Ascendis 2011)2009 thru 2010: strategy formulated, deal team created, companies identifiedJune 2011: Efekto acquiredJuly 2011: Sportron and Regal acquired February 2012: Avima acquired April 2012: Chempure acquired September 2012: Nimue Int. acquiredMay thru October 2013: SSN, Nimue SA, Solal, Pharmachem, Marltons, Bolus, Evox, Swissgarde acquired
Product substitutes
Wellness products are available at different price points
Pharma generics is commoditised on pricing and heavily regulated -government business is tendered
Healthcare equipment is available from distributors or direct Plant and animal care products are available, regulation, ingredient sourcing
Variety of regional and national customers, small export presence as yet Customer concentration is not particularly highDis-Chem is an important channel in Consumer Brands Government tender business accounts for lion's share of Pharma-Med for now but expected to decrease
Established routes to market, known value propositions, recurring business and brand recognition
Balance sheet capacity, anchor shareholder with long view, proven management, entrepreneurship
Good base for international expansionHarnessing of efficiency opportunities through group procurement and key support services
Specialist ingredients sourced from best in class worldwide
Food-grade and pharma specification
Lead times can be lengthy - working capital investment
Forex exposure
Regulated Pharma industry and hurdles to access limits players
State drug tender qualification
Market presence, shelf space and relationships with national stockists
Chain stores could compete in certain areas but scale makes it unattractive
Premium quality ingredients a prerequisite
10 12
90 88
020406080
100120
F2014 F2015
Customer mix
Local Exports
%
Choice ofsuppliers
Keycomponents
SubstitutesLead times
Forexexposure
Supplier matrix
A smaller area denotes less pressure from
ProductDifferentiation
CapitalRequirements
SwitchingCosts
Access toDistributionChannels
CostAdvantages
Economies ofScale
New entrant matrix
Larger area = higher barriers to entry
Ascendis Health Investment Report
November 2013 a product of Ingham Analytics 6
Financial and operational forecasts perspective
Apropos of Ingham Analytics group financial and operating segment forecasts for
Ascendis Health, the following salient factors influencing the outcomes merit mention.
Ascendis will report a maiden half year result for the period ended 31
December 2013 in the early part of calendar 2014 and the first full year result
will be for the year ended 30 June 2014.
Individual businesses have had differing year ends and not all companies will
have been included as part of Ascendis for a full twelve months – notably
Pharmachem, Marltons, Bolus, Evox and Swissgarde. Published reviewed or
audited results for the 2014 fiscal will thus not be a true reflection of operating
performance of the group in the future.
The forecast for the year ended 30 June 2014 is provided by management
and included in the road show presentation. The figures are done on a
consolidated basis and there is an annualised adjustment to give a
reasonably accurate measure of what all business would contribute as if they
were included for a full twelve months.
The annualised forecast for the year ended 30 June 2014 is the starting point
from which future Ingham estimates are derived through to F2020.
The Ascendis F2014 forecast is normalised to exclude one-off listing costs of
R16 million but includes usual corporate office expenses, largely payroll. In
the Ingham forecasts the group share services expense is off a base of R15
million in F2014 and then growing at 5% per annum.
The individual businesses have been privately owned and managed.
Historical accounts would not provide the best gauge of how Ascendis Health
as a new listed group could perform in future. But if the group had
hypothetically existed as an aggregation of the component pieces from 2008
as a base year then compound annual growth in revenue of 13% would have
been achieved over a five year period to June 2013.
In the modelling assumptions, cost of sales is assumed to gain a small but
worthwhile benefit from group-wide buying power. Cost of sales in F2014 is
estimated to be R1.1 billion and growing to exceed R1.5 billion within three
years. A modest 1% saving in current procurement costs adds 4 cents to
earnings per share after tax or 5%.
At the time of writing rand exchange rate is in one of its periodic very weak
phases. The dollar, euro and sterling are the three currencies that most affect
Ascendis and the rand is currently exchanging at approximately R10.00,
R13.50 and R16.00 respectively. Whilst strengthening cannot be ruled out,
with some benefits to cost of raw material inputs, the assumption is that the
rate of exchange will show a steady but modest deprecation in line with
inflation differentials between South Africa and advanced economies. An
average inflation rate of around 5% would correspond to the average of the
past fifteen years.
No dividends are assumed with cash retained for growth in the foreseeable
future. The directors have suggested a 3x to 5x cover ratio subject to
caveats.
Ascendis would appear to have a so-called lazy balance sheet going forward,
with substantial cash building up in the absence of dividend payments or if
there is no material reinvestment. For modelling purposes this may be so but
in reality I would expect cash to be put to work and at some point dividends
are likely to be commenced.

Ascendis Health Investment Report
November 2013 a product of Ingham Analytics 7
Forecasts for fiscal years ended June - graphical
Revenue growth and PBITDA margin
Earnings growth from F2014 base
EPS and EPS excluding amortisation
10%
12%
14%
16%
18%
20%
0%
2%
4%
6%
8%
10%
12%
14%
16%
2014 2015 2016 2017 2018 2019 2020
PBITDA margin (rhs)
Revenue growth (lhs)
0%
5%
10%
15%
20%
25%
30%
35%
40%
45%
50%
2015 2016 2017 2018 2019 2020
Earnings % growth
40
60
80
100
120
140
160
180
200
220
240
40
60
80
100
120
140
160
180
200
220
240
2014 2015 2016 2017 2018 2019 2020
EPS ex amortisation (lhs)
EPS (rhs)
Profit before interest, tax depreciation and amortisation margins have scope to improve within the divisions Ascendis will report a maiden half year result for the period ended 31 December 2013 in the early part of calendar 2014 and the first full year result will be for the year ended 30 June 2014 Compound growth rate of 21% indicated in possible future EPS excluding amortisation

Ascendis Health Investment Report
November 2013 a product of Ingham Analytics 8
Revenue and PBITDA in ZAR million
Capital employed and ROCE %
Free cash flow in ZAR million and cents per share
200
300
400
500
600
700
800
900
1 500
2 000
2 500
3 000
3 500
4 000
2014 2015 2016 2017 2018 2019
Revenue Rm (lhs) PBITDA Rm (rhs)
0
500
1 000
1 500
2 000
2 500
3 000
3 500
4 000
0%
5%
10%
15%
20%
25%
2014 2015 2016 2017 2018 2019 2020
Capital employed (rhs) ROCE (lhs)
20
40
60
80
100
120
140
160
180
200
220
100
150
200
250
300
350
400
450
500
2015 2016 2017 2018 2019 2020
Free cash flow in Rm (lhs)
Free cash flow per share incents (rhs)
Revenue of over R1.9 billion and PBITDA of R259 million in F2014 on an annualised, normalised basis A well capitalised balance sheet, ROCE is likely to be at a higher level in future than modelling indicates as cash gets put to work better Strong and reasonably predictable cash flows are possible

Ascendis Health Investment Report
November 2013 a product of Ingham Analytics 9
Segment forecasts
Exhibit 2 Segment estimates
Source: Ascendis, MN Ingham calculations
ZAR F2014 F2015 % ch. F2016 % ch. F2017 % ch. F2018 % ch. F2019 % ch. F2020 % ch. CAGR
Revenue
Pharma-Med 440 625 027 568 891 172 29,1 689 506 811 21,2 817 548 213 18,6 950 971 833 16,3 1 095 519 552 15,2 1 242 319 172 13,4 18,9%
Phyto-Vet 615 167 173 649 874 937 5,6 703 948 846 8,3 770 315 692 9,4 833 787 951 8,2 901 840 569 8,2 974 068 229 8,0 8,0%
Consumer 857 914 456 962 887 845 12,2 1 076 069 921 11,8 1 196 862 215 11,2 1 332 157 383 11,3 1 475 707 942 10,8 1 635 864 000 10,9 11,4%
Net total 1 913 706 656 2 181 653 954 14,0 2 469 525 578 13,2 2 784 726 120 12,8 3 116 917 167 11,9 3 473 068 063 11,4 3 852 251 401 10,9 12,4%
PBITDA
Pharma-Med 48 441 604 86 690 053 79,0 115 317 501 33,0 148 159 872 28,5 184 521 421 24,5 215 834 639 17,0 247 669 759 14,7 31,3%
Phyto-Vet 79 170 988 96 393 244 21,8 107 362 144 11,4 121 950 631 13,6 136 389 172 11,8 152 333 718 11,7 169 073 928 11,0 13,5%
Consumer 146 406 011 182 986 158 25,0 209 354 523 14,4 239 533 343 14,4 274 171 923 14,5 310 675 616 13,3 352 285 910 13,4 15,8%
Sub-total 274 018 603 366 069 455 33,6 432 034 169 18,0 509 643 846 18,0 595 082 516 16,8 678 843 973 14,1 769 029 597 13,3 18,8%
Shared services 15 041 056 15 500 000 3,1 16 275 000 5,0 17 088 750 5,0 17 943 188 5,0 18 840 347 5,0 19 782 364 5,0 4,7%
Net total 258 977 547 350 569 455 35,4 415 759 169 18,6 492 555 096 18,5 577 139 329 17,2 660 003 626 14,4 749 247 233 13,5 19,4%
Revenue share
Pharma-Med 23% 26% 28% 29% 31% 32% 32%
Phyto-Vet 32% 30% 29% 28% 27% 26% 25%
Consumer 45% 44% 44% 43% 43% 42% 42%
Net total 100% 100% 100% 100% 100% 100% 100%
PBITDA share
Pharma-Med 18% 24% 27% 29% 31% 32% 32%
Phyto-Vet 29% 26% 25% 24% 23% 22% 22%
Consumer 53% 50% 48% 47% 46% 46% 46%
Net total 100% 100% 100% 100% 100% 100% 100%
PBITDA margin
Pharma-Med 11,0% 15,2% 16,7% 18,1% 19,4% 19,7% 19,9%
Phyto-Vet 12,9% 14,8% 15,3% 15,8% 16,4% 16,9% 17,4%
Consumer 17,1% 19,0% 19,5% 20,0% 20,6% 21,1% 21,5%
Net total 13,5% 16,1% 16,8% 17,7% 18,5% 19,0% 19,4%
Ascendis Health Investment Report
November 2013 a product of Ingham Analytics 10
Profit & Loss forecasts
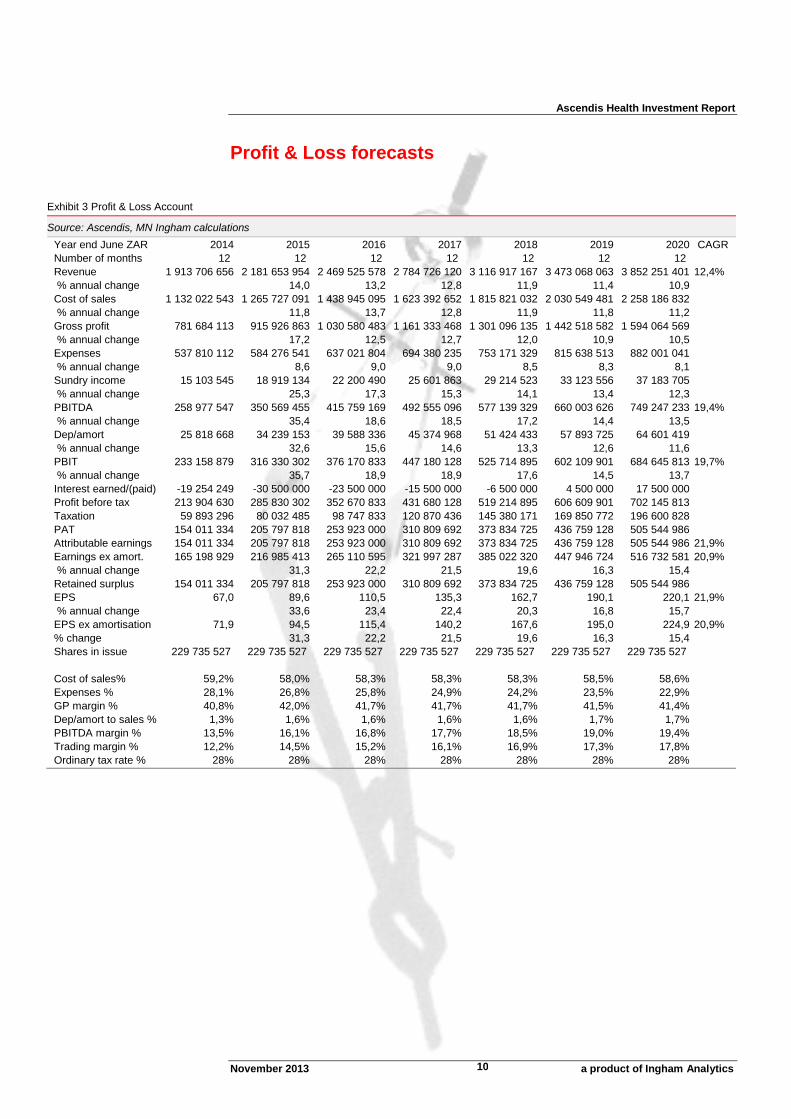
Exhibit 3 Profit & Loss Account
Source: Ascendis, MN Ingham calculations
Year end June ZAR 2014 2015 2016 2017 2018 2019 2020 CAGR
Number of months 12 12 12 12 12 12 12
Revenue 1 913 706 656 2 181 653 954 2 469 525 578 2 784 726 120 3 116 917 167 3 473 068 063 3 852 251 401 12,4%
% annual change 14,0 13,2 12,8 11,9 11,4 10,9
Cost of sales 1 132 022 543 1 265 727 091 1 438 945 095 1 623 392 652 1 815 821 032 2 030 549 481 2 258 186 832
% annual change 11,8 13,7 12,8 11,9 11,8 11,2
Gross profit 781 684 113 915 926 863 1 030 580 483 1 161 333 468 1 301 096 135 1 442 518 582 1 594 064 569
% annual change 17,2 12,5 12,7 12,0 10,9 10,5
Expenses 537 810 112 584 276 541 637 021 804 694 380 235 753 171 329 815 638 513 882 001 041
% annual change 8,6 9,0 9,0 8,5 8,3 8,1
Sundry income 15 103 545 18 919 134 22 200 490 25 601 863 29 214 523 33 123 556 37 183 705
% annual change 25,3 17,3 15,3 14,1 13,4 12,3
PBITDA 258 977 547 350 569 455 415 759 169 492 555 096 577 139 329 660 003 626 749 247 233 19,4%
% annual change 35,4 18,6 18,5 17,2 14,4 13,5
Dep/amort 25 818 668 34 239 153 39 588 336 45 374 968 51 424 433 57 893 725 64 601 419
% annual change 32,6 15,6 14,6 13,3 12,6 11,6
PBIT 233 158 879 316 330 302 376 170 833 447 180 128 525 714 895 602 109 901 684 645 813 19,7%
% annual change 35,7 18,9 18,9 17,6 14,5 13,7
Interest earned/(paid) -19 254 249 -30 500 000 -23 500 000 -15 500 000 -6 500 000 4 500 000 17 500 000
Profit before tax 213 904 630 285 830 302 352 670 833 431 680 128 519 214 895 606 609 901 702 145 813
Taxation 59 893 296 80 032 485 98 747 833 120 870 436 145 380 171 169 850 772 196 600 828
PAT 154 011 334 205 797 818 253 923 000 310 809 692 373 834 725 436 759 128 505 544 986
Attributable earnings 154 011 334 205 797 818 253 923 000 310 809 692 373 834 725 436 759 128 505 544 986 21,9%
Earnings ex amort. 165 198 929 216 985 413 265 110 595 321 997 287 385 022 320 447 946 724 516 732 581 20,9%
% annual change 31,3 22,2 21,5 19,6 16,3 15,4
Retained surplus 154 011 334 205 797 818 253 923 000 310 809 692 373 834 725 436 759 128 505 544 986
EPS 67,0 89,6 110,5 135,3 162,7 190,1 220,1 21,9%
% annual change 33,6 23,4 22,4 20,3 16,8 15,7
EPS ex amortisation 71,9 94,5 115,4 140,2 167,6 195,0 224,9 20,9%
% change 31,3 22,2 21,5 19,6 16,3 15,4
Shares in issue 229 735 527 229 735 527 229 735 527 229 735 527 229 735 527 229 735 527 229 735 527
Cost of sales% 59,2% 58,0% 58,3% 58,3% 58,3% 58,5% 58,6%
Expenses % 28,1% 26,8% 25,8% 24,9% 24,2% 23,5% 22,9%
GP margin % 40,8% 42,0% 41,7% 41,7% 41,7% 41,5% 41,4%
Dep/amort to sales % 1,3% 1,6% 1,6% 1,6% 1,6% 1,7% 1,7%
PBITDA margin % 13,5% 16,1% 16,8% 17,7% 18,5% 19,0% 19,4%
Trading margin % 12,2% 14,5% 15,2% 16,1% 16,9% 17,3% 17,8%
Ordinary tax rate % 28% 28% 28% 28% 28% 28% 28%

Ascendis Health Investment Report
November 2013 a product of Ingham Analytics 11
Balance Sheet forecasts
Exhibit 4 Balance Sheet
Source: Ascendis, MN Ingham calculations
Cash flow forecasts
Exhibit 5 Cash Flow
Source: Ascendis, MN Ingham calculations
Year end June ZAR 2005A 2014 2015 2016 2017 2018 2019 2020
Ordinary share capital 994 559 074 1 137 262 007 1 345 014 824 1 600 892 824 1 913 657 516 2 289 447 241 2 728 161 369
Revaluation 1 955 000 1 955 000 1 955 000 1 955 000 1 955 000 1 955 000 1 955 000
Retained income 140 747 933 205 797 818 253 923 000 310 809 692 373 834 725 436 759 128 505 544 986
Ordinary shareholders interest 1 137 262 007 1 345 014 824 1 600 892 824 1 913 657 516 2 289 447 241 2 728 161 369 3 235 661 355
Total shareholders funds 1 137 262 007 1 345 014 824 1 600 892 824 1 913 657 516 2 289 447 241 2 728 161 369 3 235 661 355
Long-term Borrowings 561 931 080 561 931 080 561 931 080 561 931 080 561 931 080 561 931 080 561 931 080
Total non-current liabilities 561 931 080 561 931 080 561 931 080 561 931 080 561 931 080 561 931 080 561 931 080
Fixed assets 88 392 862 107 093 687 131 143 696 160 980 337 196 866 443 239 221 842 288 284 934
Accumulated Depreciation 0 18 700 826 42 750 835 72 587 476 108 473 582 150 828 980 199 892 072
Total Fixed Assets 88 392 862 88 392 862 88 392 862 88 392 862 88 392 862 88 392 862 88 392 862
Goodwill 521 454 400 521 454 400 521 454 400 521 454 400 521 454 400 521 454 400 521 454 400
Intangibles 174 113 422 158 575 095 143 036 768 127 498 441 111 960 114 96 421 787 80 883 460
Deferred tax asset 8 016 044 8 016 044 8 016 044 8 016 044 8 016 044 8 016 044 8 016 044
Total other long term assets 703 583 866 688 045 539 672 507 212 656 968 885 641 430 558 625 892 231 610 353 904
Total non-current assets 791 976 727 776 438 400 760 900 073 745 361 746 729 823 419 714 285 092 698 746 765
Net Current Assets 907 216 359 1 130 507 504 1 401 923 831 1 730 226 850 2 121 554 901 2 575 807 357 3 098 845 670
Stock 319 267 082 370 881 172 419 819 348 473 403 440 529 875 918 590 421 571 654 882 738
Trade debtors 314 393 054 370 881 172 419 819 348 473 403 440 529 875 918 590 421 571 654 882 738
Cash 543 753 807 800 683 897 1 028 215 192 1 308 907 221 1 650 380 423 2 050 694 289 2 516 493 949
Total Current Assets 1 177 413 943 1 542 446 241 1 867 853 889 2 255 714 102 2 710 132 260 3 231 537 430 3 826 259 425
Creditors 235 777 259 370 881 172 419 819 348 473 403 440 529 875 918 590 421 571 654 882 738
Short term borrowings 0 0 0 0 0 0 0
Tax 14 971 531 21 608 771 26 661 915 32 635 018 39 252 646 45 859 708 53 082 223
Provisions 18 444 536 18 444 536 18 444 536 18 444 536 18 444 536 18 444 536 18 444 536
Finance lease 1 004 258 1 004 258 1 004 258 1 004 258 1 004 258 1 004 258 1 004 258
Total Current Liabilities 270 197 584 411 938 737 465 930 057 525 487 252 588 577 358 655 730 073 727 413 756
Total assets 1 969 390 670 2 318 884 641 2 628 753 962 3 001 075 848 3 439 955 679 3 945 822 523 4 525 006 190
Total equity & liabilities 1 969 390 670 2 318 884 641 2 628 753 961 3 001 075 848 3 439 955 679 3 945 822 522 4 525 006 190
Balance check 0 0 0 0 0 0 0
Employment of capital 1 699 193 086 1 906 945 904 2 162 823 904 2 475 588 596 2 851 378 320 3 290 092 449 3 797 592 435
NAV 1 137 262 007 1 345 014 824 1 600 892 824 1 913 657 516 2 289 447 241 2 728 161 369 3 235 661 355
Number of shares 229 735 527,09 229 735 527,09 229 735 527,09 229 735 527,09 229 735 527,09 229 735 527,09 229 735 527,09
NAV per share cents 495 585 697 833 997 1 188 1 408
Net cash/(Net debt) -18 177 273 238 752 817 466 284 112 746 976 141 1 088 449 343 1 488 763 209 1 954 562 869
ROE 14% 18% 19% 19% 20% 19% 19%
ROCE 15% 18% 19% 20% 20% 20% 20%
Stock 0,37 0,33 0,33 0,33 0,33 0,33 0,33
Debtors 0,36 0,33 0,33 0,33 0,33 0,33 0,33
Creditors 0,27 0,33 0,33 0,33 0,33 0,33 0,33
1,00 1,00 1,00 1,00 1,00 1,00 1,00
Year end June ZAR 2015 2016 2017 2018 2019 2020
PBITDA 350 569 455 415 759 169 492 555 096 577 139 329 660 003 626 749 247 233
Working capital (Increase)/Decrease 27 001 705 -48 938 176 -53 584 092 -56 472 478 -60 545 652 -64 461 167
Cash generated from operations 377 571 160 366 820 993 438 971 003 520 666 851 599 457 973 684 786 065
Net Interest -30 500 000 -23 500 000 -15 500 000 -6 500 000 4 500 000 17 500 000
Taxation paid -73 395 245 -93 694 689 -114 897 333 -138 762 542 -163 243 710 -189 378 313
Cash available from operations 273 675 915 249 626 304 308 573 670 375 404 308 440 714 264 512 907 752
Purchase of property, plant, equipment -18 700 826 -24 050 009 -29 836 641 -35 886 106 -42 355 398 -49 063 092
Net cash inflow/(outflow) 254 975 089 225 576 295 278 737 030 339 518 202 398 358 865 463 844 660
Cash at beginning 543 753 807 800 683 897 1 028 215 192 1 308 907 221 1 650 380 423 2 050 694 289
Cash at year end 800 683 897 1 028 215 192 1 308 907 221 1 650 380 423 2 050 694 289 2 516 493 949
Opening net (borrowings/cash -18 177 273 238 752 817 466 284 112 746 976 141 1 088 449 343 1 488 763 209
Closing net borrowings 238 752 817 466 284 112 746 976 141 1 088 449 343 1 488 763 209 1 954 562 869
Reduction/(increase) in net borrowings 256 930 090 227 531 295 280 692 029 341 473 202 400 313 866 465 799 660
Free cash flow 254 975 089 225 576 295 278 737 030 339 518 202 398 358 865 463 844 660
Cash flow per share 111,0 98,2 121,3 147,8 173,4 201,9

Ascendis Health Investment Report
November 2013 a product of Ingham Analytics 12
Valuing Ascendis
Ascendis Health is raising fresh equity and listing at a price of 1100 cents. The
question, therefore, is what does this translate to on conventional valuation metrics?
The table below includes relevant forecast data for 2014, 2015 and 2016. The year
ended June 2014 is normalised to reflect Ascendis as if it had traded in its new form
for a full twelve months with all acquisitions contributing.
Exhibit 6 Listing valuation at 1100 cents per share
Source: Ascendis, MN Ingham calculations
Ascendis is thus listing at a 15.3x multiple and an EV/PBITDA ratio of 9.8x. In view of
the anticipated acceleration in earnings and significantly cash-rich balance sheet at
the outset, the respective multiples fall to 11.6x and 6.5x.
Possible acquisitions of privately owned businesses in the near term, such as a
medical devices business, would be executed at a rather lower multiple than public
listed companies are rated at and compared to Ascendis on listing.
Private equity transactions on quality small companies are typically achieving
earnings multiples of approximately 7.5x and EV/PBITDA multiples of 5x, sometimes
up to 7x. On becoming part of a listed entity an acquired business would achieve a
value uplift commensurate to that of the listed acquirer.
To test the reasonableness of the listing price of 1100 cents, I have also taken a
share buy-back model and assumed a 10% share buy-back at a cost of borrowing of
8% pre-tax. Should Ascendis purchase its own shares with surplus cash or borrowed
money the effect would be as follows.
Exhibit 7 Share buy-back at listing valuation of 1100 cents per share
Source: Ascendis, MN Ingham calculations
Year ended June - normalised result
2014 2015 2016
Rm Rm Rm
Forecast PBITDA 259,0 350,6 415,8
Forecast adjusted earnings 165,2 217,0 265,1
EPS - cents 71,9 94,5 115,4
Net (debt)/cash -18 239 466
Shares in issue (m) 229,74 229,74 229,74
Equity value 2 527 2 527 2 527
Enterprise value 2 545 2 288 2 061
EV/PBITDA 9,8 6,5 5,0
Price earnings ratio 15,3 11,6 9,5
Fair value and target price per Ingham - cents 1100 1100 1100
Current Buy back New
shares m shares (10%) shares m
229,74 23,0 206,8
Forecast 2014 Buy back Cost of Interest Tax relief After tax cost of
earnings Rm price cents buy back Rm cost Rm on interest Rm interest Rm
165,20 1100 252,7 20,2 5,7 14,6
Earnings less interest EPS before EPS after % difference P/E before P/E after
cost Rm cents cents
150,6 71,9 72,9 1,3 15,3 15,1
Equity Equity Gearing before Gearing after
before Rm after Rm ROE before % ROE after % Rm Rm
1 137,3 884,6 14,5 17,0 -18,2 -270,9 PBITDA
Gearing % Gearing % Interest cover
1,6% 30,6% 12,0
Ascendis Health is raising fresh equity and listing at a price of 1100 cents Ascendis is thus listing at a 15.3x earnings multiple and an EV/PBITDA ratio of 9.8x. In view of the anticipated acceleration in earnings and significantly cash-rich balance sheet at the outset, the respective multiples fall to 11.6x and 6.5x Possible acquisitions of privately owned businesses in the near term would be executed at a rather lower multiple than public listed companies are rated at and compared to Ascendis on listing.
Ascendis Health Investment Report
November 2013 a product of Ingham Analytics 13
Buying back its own shares would be marginally EPS accretive for Ascendis, gearing
would rise from a negligible amount to 30% and ROE would improve. The listing price
of 1100 cents, based current fiscal year performance, thus satisfies the
reasonableness test.
On a Du Pont ROE model, the flowing outcomes are evident.
The assumption is a 20% ROE, real profits growth of 12% in the higher growth years,
possibly over a decade before descending to be in line with GDP and a 14% cost of
capital.
The implied exit PE is 13.3x giving a future price on F2015 EPS of 1260 cents and
which discounted to the present day at 14% derives a present value of 1018 cents.
This is thus in line with the listing price.
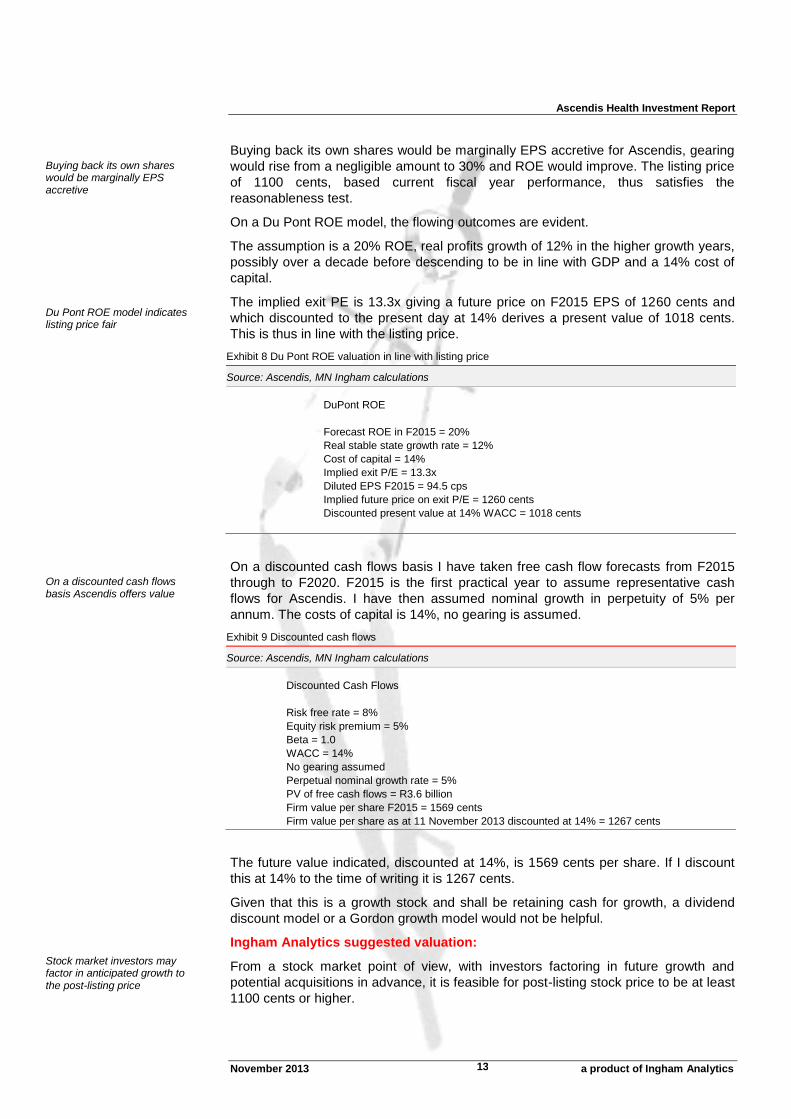
Exhibit 8 Du Pont ROE valuation in line with listing price
Source: Ascendis, MN Ingham calculations
On a discounted cash flows basis I have taken free cash flow forecasts from F2015
through to F2020. F2015 is the first practical year to assume representative cash
flows for Ascendis. I have then assumed nominal growth in perpetuity of 5% per
annum. The costs of capital is 14%, no gearing is assumed.
Exhibit 9 Discounted cash flows
Source: Ascendis, MN Ingham calculations
The future value indicated, discounted at 14%, is 1569 cents per share. If I discount
this at 14% to the time of writing it is 1267 cents.
Given that this is a growth stock and shall be retaining cash for growth, a dividend
discount model or a Gordon growth model would not be helpful.
Ingham Analytics suggested valuation:
From a stock market point of view, with investors factoring in future growth and
potential acquisitions in advance, it is feasible for post-listing stock price to be at least
1100 cents or higher.
DuPont ROE
Forecast ROE in F2015 = 20%
Real stable state growth rate = 12%
Cost of capital = 14%
Implied exit P/E = 13.3x
Diluted EPS F2015 = 94.5 cps
Implied future price on exit P/E = 1260 cents
Discounted present value at 14% WACC = 1018 cents
Discounted Cash Flows
Risk free rate = 8%
Equity risk premium = 5%
Beta = 1.0
WACC = 14%
No gearing assumed
Perpetual nominal growth rate = 5%
PV of free cash flows = R3.6 billion
Firm value per share F2015 = 1569 cents
Firm value per share as at 11 November 2013 discounted at 14% = 1267 cents
Buying back its own shares would be marginally EPS accretive Du Pont ROE model indicates listing price fair On a discounted cash flows basis Ascendis offers value Stock market investors may factor in anticipated growth to the post-listing price

Ascendis Health Investment Report
November 2013 a product of Ingham Analytics 14
There is no exact science to valuation, it is as much intuition, knowledge of the
people and processes involved and the external forces at play as it is about the
mathematics. Ultimately, an asset is worth what people are prepared to pay for it.
The demand for scrip ahead of listing was oversubscribed. Enough investors have
voted with their wallets to pay 1100 cents for that to be a decent indicator of what
investors think the assets are worth, even before a public listing and the future
newsflow on performance and corporate activity.
I ascribe a fair value of 1400 cents with an intermediate target price on a twelve
month view of 1600 cents. Simply plugging in these figures gives the following
outcomes in Exhibit 11 for illustrative purposes.
With book value in F2014 estimated at 495 cents per share, price to book on the
listing price of 1100 cents is 2.2x and on a 1400 cents fair value it is 2.8x.
Exhibit 11 Ingham fair value and target price indicators
Source: Ascendis, MN Ingham calculations
Comparative earnings metrics of FMCG stocks are indicated below.
It should be noted that Aspen pays a minimal dividend and is a fully fledged growth
stock, retaining for growth. AVI on the other hand is a generous dividend payer,
reducing dividend cover this past year to 1.25x. Tiger Brands has a 2x cover. Adcock
Ingram is priced for corporate action at present because of the CFR cash and share
offer. Pepkor is part-owned by Brait and my sum of the parts value derives an implied
EV/PBITDA multiple of 12x.
Exhibit 12 Comparative companies
Source: MN Ingham calculations
Year ended June - normalised result
2014 2015
Rm Rm
Forecast PBITDA 259,0 350,6
Forecast adjusted earnings 165,2 217,0
EPS - cents 71,9 94,5
Net (debt)/cash -18 239
Shares in issue (m) 229,74 229,74
Equity value 3 216 3 676
Enterprise value 3 234 3 437
EV/PBITDA 12,5 9,8
Price earnings ratio 19,5 16,9
Fair value and target price per Ingham - cents 1400 1600
Share price
cents EV/PBITDA Rolling exit PE Forward PE
Aspen 27 500 19,0 30,0 26,7
Adcock Ingram 6 800 8,8 16,3 16,5
AVI 5 700 10,0 17,0 15,8
Tiger Brands 30 000 12,4 18,2 16,9
Implied multiples Part of Brait
Pepkor 12,0
Demand for scrip ahead of listing, investors voting with their wallets at 1100 cents Ingham fair value of 1400 cents with an intermediate target price on a twelve month view of 1600 cents Book value at listing of 495 cents per share, price to book on listing price is 2.2x Comparative metrics indicate
Ascendis is pitched fairly

Ascendis Health Investment Report
November 2013 a product of Ingham Analytics 15
Key Ascendis Health people
The following individuals, inter alia, will play important operational roles in the
business in future.
CEO: Karsten Wellner joined Ascendis in 2011 as CEO following a two decade career
with Fresenius AG internationally and independently in the healthcare and nutrition
field. Wellner has a key role in guiding the strategic evolution of the business and has
become increasingly recognised as the public face of Ascendis Health.
CFO: Robbie Taylor brings experience in agribusiness to Ascendis, more recently as
the CFO of a JSE listed poultry and stock feed group. Taylor is well equipped to
handle the disciplines associated with Ascendis assuming a main board listing and
has been instrumental in facilitating the process.
COO: Richard Crouse spent a number of years in the mobile telephony industry
before joining the family business of Chempure as MD. With the acquisition of
Chempure by Ascendis in 2012, Crouse was the natural choice to take on the new
position of COO of the rapidly evolving group and he is well versed in all aspects of
the businesses.
MD Consumer Brands: Marion Burgess brings substantial international managerial
experience with multinational healthcare groups to her role as MD of the largest
division at Ascendis.
MD Pharma-Med: Immy Mohamed is co-founder of Pharmachem and an established
entrepreneur. Having vended in his business to Ascendis he has a crucial role to play
in the future growth of this fast-developing pharmaceutical and devices division.
MD Phyto-Vet: Jayen Pather brings a logistics and FMCG background to Ascendis,
more recently in the branded health, beauty and wellness sector, and is tasked with
leading the growth of this plant and animal part of Ascendis.
Ascendis Health has a strong board of non-executives with requisite industry
experience and international perspectives
Gary Shane is the quiet but significant influence behind Coast2Coast and has played
a pivotal role in the conception and realisation of Ascendis Health, in which he is the
largest shareholder. A successful entrepreneur in his own right he will be an important
sounding board and strategic thinker, bringing a long term view on what is best for the
business.
Cris Dillon is a co-founder of Coast2Coast and also a shareholder in Ascendis Health.
He has had prior experience in investment banking. Dillon has played an energetic,
hands on role in the creation of Ascendis and like Shayne is a firm believer in long
term investment thinking.
John Bester is non-executive Chairman, bringing experience in the accounting
profession and in business, including finance directorships and other non-executive
directorships, to the role of steering the Board.
Philip Cunningham is an established entrepreneur. He is currently MD of his own
motion picture business specialising in animation technology and has had particular
success with various media initiatives.
Bharti Harie is a practicing attorney and holds board directorships. She previously
served in various roles over fourteen years at the Industrial Development Corporation.
Capable and experienced leadership team Original C2C founders have been pivotal in bringing Ascendis about but will have a non-executive role

Ascendis Health Investment Report
November 2013 a product of Ingham Analytics 16
Background to listing
Three component pieces
The Ascendis Health group businesses cover human, animal and plant wellbeing
requirements. There are three reporting segments - Consumer Brands, Pharma-Med
and Phyto-Vet.
The group’s origins date to 2008 with financial and strategic backing from the original
Coast2Coast founders. Since then the group has taken shape through a series of
methodically planned corporate actions.
The constituent businesses have proven track records in their respective fields.
Substantial equity and debt capital secured
To introduce additional shareholders, a private placement was carried out in October
2012 and R30 million was secured.
Subsequently, senior executives subscribed for shares.
Additional equity in the amount of R350 million was secured in June 2013, with R250
million invested by Coast2Coast Investments and the balance by a number of
individuals.
A debt package worth R500 million was also secured which reduced the effective
annual interest rate to 9%.
A pre-listing capital raise of R50 million was done in September 2013.
Assuming a R400 million pre-listing private placement is secured from institutional
investors then some R1 billion in equity will have been injected in to Ascendis Health,
resulting in a well-capitalised financial position.
On listing date, 17.6 million shares worth R193.5 million will be issued to vendors of
various group companies. Post-listing, company management will hold 15% of the
equity.
At listing, 229 735 527 shares will be in issue.
A pre-listing statement will be issued but this is for public information purposes only
and is not an invitation to the public to subscribe for shares or an offer to the public to
purchase shares in Ascendis.
In the private placement to institutions, there is a minimum of 18,181,818 new
subscription shares and a maximum of 36,363,636 new subscription shares together
with a maximum of 4,545,455 existing sale shares.
Ascendis is listing at 1100 cents per share.
Listing is scheduled for 09H00 on Friday the 22nd of November 2013.
There are three reporting segments - Consumer Brands, Pharma-Med and Phyto-Vet Approximately R1 billion in equity will have been injected to Ascendis Health At listing, 229 735 527 shares will be in issue Ascendis is listing at 1100 cents per share on Friday the 22nd of November 2013
Ascendis Health Investment Report
November 2013 a product of Ingham Analytics 17
Segment companies
The following companies and brands are included in the portfolio with year of
founding indicated in parenthesis.
Within Consumer Brands division, the following companies and brands are included:
Chempure (1994) – importer and distributor of speciality chemicals of food-
grade and pharma specification predominantly from DSM and Hilmar
Ingredients
Solal (2000)– a nutritional supplements and enriched foods business that are
sold via retail pharmacy accompanied by professional diagnostics and
treatments and medicine formulation
Nimue (1994) – premium skincare products sold via salons
Evox (1996) – nutritional supplements for body building, toning or endurance
sport
Scientific Sports Nutrition (SSN) (2008) – body building supplements
Bolus Distribution (1997) – importation of US sourced branded body building
and fitness supplements such as Muscletech
Sportron (1992) – network marketed nutritional and allied ranges
Regal (2005) – exclusive licence holder for Foodstate products in South
Africa
Swissgarde (1991) – network marketed herbal health and beauty
predominantly in Southern Africa, Nigeria and selected other African markets
Reviva (2007) – exclusive distributor to retailers of the British ultra-comfort
footwear range called Fitflop
Within Pharma-Med division, the following companies and brands are included:
Pharmachem Pharmaceuticals (2006) is the umbrella brand
Pharmachem – a Medicines Control Council licensed wholesaler for
marketing and distribution of branded generic drugs and over the counter
medications
Dezzo Trading - a Medicines Control Council licensed generic
pharmaceutical manufacturer predominantly in the government tender market
Pharmadyne - a Medicines Control Council licensed manufacturer
predominantly in the multivitamin government tender market
MDI – applicant for registration of all Pharmachem group dossiers
Within Phyto-Vet division, the following companies and brands are included:
Efekto (1973) – plant fertiliser, nutrition and pest control, seeds and allied
accessories sold via retailers
Avima (1961) – manufacturer of crop pesticides, malaria and tsetse
protection, stored grains pesticides and allied phytosanitary formulations
Marltons (1989) – domestic animal wellbeing products sold via retailers, pet
and vet shops

Ascendis Health Investment Report
November 2013 a product of Ingham Analytics 18
Competitive positioning overview
The target markets are not as clear cut as may appear at a casual glance.
As a general rule, and the nature of the businesses tells its own story, there is an
indulgence or pampering or preventative factor to the Consumer Brands and much of
the Phyto-Vet portfolios that hardly makes them cheap to buy.
Consumer Brands are discretionary, often nice-to-have products targeted largely at
the mass affluent or the wealthy or the wannabes.
Low-income or no-income people on welfare, and that applies to most South Africans,
don’t buy Solal ‘Naturally High’ at R285 a pack together with ‘Burnout’ at R128 a
bottle because they feel stressed.
Those same folks assuredly won’t be laying out R700 at Pick n Pay for a 12kg bag of
Fish4Dogs pet food, distributed in South Africa by Marltons.
But the poorer customer would be consumer of a generic drug either via a
government hospital or through their dispensing medical doctor or they would be a
purchaser of an affordable over the counter cough syrup such as a Bencough from
Pharmachem.
And so the reality of Ascendis is that it actually spans the full spectrum of society. As
this group develops, grows and bolts-on so in turn will the consumer demographic
evolve.
And not just in South Africa. Foreign markets in Africa and internationally are a
strategic imperative for the group in its new guise and this in turn will add investment
appeal.
At around R100 million, most of which is through Avima into Africa and the balance
through Nimue International, export business is small and would be an important
factor in de-risking a high foreign exchange exposure in cost of sales through the
group.
And if, as seems possible, the Pharma-Med segment demonstrates continued
accelerating growth in the next few years then the socio-demographic customer
profile will probably shift further to low income customers both indirectly through
tender business or directly through own private market sales.
An important point to note is the lack of reliable disaggregated market detail in South
Africa for many of the industry areas in which Ascendis companies compete. The old
adage about lies, damned lies and statistics applies such is the inconsistency or
outright paucity of data.
Competitors are many and varied. There is no one area where Ascendis does not
face competition and this is a positive factor as these brands historically have made it
in the face of competition.
The Ascendis Consumer Brands companies do not have so-called pricing power,
which would presuppose uniqueness, few, if any, rivals and an ability to charge pretty
much what you like with little or no elasticity in demand.
Adcock Ingram, a company that Ascendis will be keeping company with in its JSE
listing sector, has a solid category presence in curative, wellbeing and personal care
yet has seen consistent margin erosion and flat nominal profits.
Ascendis has perhaps what is best described as pricing advantages, due maybe to
the incumbency benefits that evolve from sticking around. As a listed group, Ascendis
will come under increased scrutiny – from shareholders, customers, suppliers and
particularly competitors.
Consumer Brands are discretionary, often nice-to-have products The Pharma offering is largely directed to a less affluent consumer Foreign markets a strategic imperative Lack of reliable disaggregated market detail Brands historically have made it in the face of competition
Pricing advantages

Ascendis Health Investment Report
November 2013 a product of Ingham Analytics 19
Price leadership can derive from perceived value and not the price level. In this
regard, the experience of the fast food industry in South Africa is a noteworthy
phenomenon.
Fast food has literally catered well to a seemingly contradictory combination of
convenience, quality, affordability and choice.
By achieving these four elements on an industrial scale the fast food companies have
in turn become the price leader in eating out. But in achieving this there has to be a
sacrifice – and that is arguably nutritional value.
Which is partly why South Africa is increasingly a country populated by the vertically
unwell. The efforts of medical insurers to incentivise healthier eating has minimal
impact for the simple reason that few can afford comprehensive healthcare cover.
In difficult economic times consumers will migrate to the conveniently affordable even
if it is at the cost of their wellbeing. Fast food companies are a primary beneficiary.
Ascendis plays to the wellness theme. It’ll have a job persuading a Steers customer
to kick the habit but it is well positioned at a time of increasing consciousness about
weight and healthiness and the costs benefits of prevention being better than cure.
Keeping up with competition let alone ahead of it will be a challenge.
At the moment, re-investment within Ascendis group companies is fairly modest.
Depreciation is estimated an annual basis to be running at just over R10 million or
0.5% of revenue. Capex is also estimated to be in line with depreciation for now.
Amortisation is R15.4 million.
In F2015, I have depreciation and capex increasing R18.7 million, R24 million in
F2016 and then R30 million in F2017. Either way this is still less than 1% of turnover
spent on reinvestment.
In comparison, Adcock Ingram in F2012 spent R510 million or 11.5% of its South
African revenue on replacement and expansion capex. In F2013 it will spend R260
million. The annual depreciation charge for F2013 I estimate at R150 million – 3% of
revenue. Adcock Ingram is admittedly a rather more fixed asset intensive business
with property, plant and equipment 50% of non-current assets versus 10% for
Ascendis.
Ascendis is a grouping of previously owner-managed businesses that have probably
been run for cash and less for return. The demands of being a public listed company
are rather different and many of these acquired brands may need a rejuvenation for
the next leg of growth and development. Some upping of the capex in both tangible
and intangible assets would not be a bad idea and there is ample funding capacity to
do so.
Strategic purpose to the acquisitions
The constituent part of the group are important to understand as Ascendis as a group
has been assembled methodically and with strategic purpose and not by
happenstance acquisition.
Individually, these business would not merit a stock exchange listing but as
constituted within three divisions in one group there is method in how the parts fit to
form a whole.
Acquisition of a number of well-established businesses has created the opportunity to
begin rolling out a strategy of appropriate vertical and horizontal integration to capture
the full benefit of a complementary value chain - raw materials, manufacture,
intellectual property and brand equity, and distribution and selling through retail,
wholesale, export and direct selling routes to market.
Fast food industry success but the hidden price is nutritional Ascendis plays to the wellness theme Re-investment within Ascendis group companies is fairly modest at present Upping of capex necessary in future Group has been assembled methodically and with strategic purpose Opportunity to begin rolling out a strategy of appropriate vertical and horizontal integration to capture the full benefit of a complementary value chain

Ascendis Health Investment Report
November 2013 a product of Ingham Analytics 20
The people factor is key. This is potentially the closest thing to a Bidvest that the
market has seen in a long while if the majority owners and executives charged with
day-to-day oversight can leave well alone where necessary and engage as needed,
not least in steering strategic direction, encouraging sharing of best practice and
harnessing collective financial muscle for growth and development.
Without exception, there is keen entrepreneurial trait in the managers running these
businesses. But crucially, this entrepreneurialism has been amply demonstrated by
the creators of Ascendis who bring to the group a formidable wealth creation track
record prior to setting up the Coast2Coast investment vehicle and thereafter.
Unlike a conglomerate or a major corporate buying up bolt-ons, Ascendis has been
conceived with a clean sheet of paper and a fresh outlook for possible opportunity
from the start.
A combination of economic and legislative changes in the past twenty years has been
beneficial for an opening up of South Africa to new opportunities but also competitive
challenges. There has been corporatisation of pharmacy and development and
growth of domestic pharma players, albeit not in the same breath as ethical majors,
taking advantage of a plethora of patent expirations and a new pricing regime.
And the one advantage of doing business in South Africa is we don’t usually need to
reinvent wheels – there is always someone from the northern hemisphere who has
been there, done that, made the mistakes and created something. What passes for
innovation down here is more often than not imitation.
There is a possibly a case for arguing that the whole is worth rather more than the
sum of the parts. But Ascendis will need to demonstrate it can take co-shareholders
along with it and build confidence.
Consumer orientation to portfolio
Per the F2014 annualised forecast, Consumer Brands is the largest contributor by
revenue and profit at 45% and 53% respectively. This is followed by Phyto-Vet at
32% of revenue and 29% of profit and then Pharma-Med at 23% and 18%
respectively. These percentages are clean contributions excluding shared services
costs.
Given the recent history of acquisition to create the Ascendis platform it is feasible
that the respective contributions indicated for F2014 could change in the future.
Ascendis has already indicated that it is in advanced discussions with respect to the
purchase of a medical devices business that could conceivably be included in the
Pharma-Med division.
Medical devices is predominantly a finished products import market in South Africa,
typically on an agency basis. It is likely that Ascendis would be looking to target
general surgical, gynaecology, urology, ear, nose and throat, cardiology and
radiology among other specialities.
Although largely an import and distribution market in South Africa, worldwide medical
devices is a manufacturing segment that commands premium profit margins -
Johnson & Johnson, for example, returned 26% on sales in the 2012 fiscal,
substantially higher than the normalised 14% it achieves on consumer products.
At this stage, one could argue that given the consumer orientation of Phyto-Vet, with
the exception of Avima, that Consumer Brands in a broader sense is actually closer
to 70% of both group revenue and profits.
In that broader context, Ascendis should also be viewed and valued more as a fast
moving consumer goods play rather than a pure pharma group.
Ascendis may be listing in the Pharmaceutical sector of the JSE but that does not
make it a predominantly pharmaceutical group – as yet.
Human capital key Keen entrepreneurial trait in the managers Conceived with a clean sheet of paper and a fresh outlook Innovation or imitation in South Africa? On listing, Consumer Brands is the largest contributor by revenue and profit, followed by Phyto-Vet and then Pharma-Med Advanced discussions with respect to the purchase of a medical devices business Consumer Brands in a broader sense is actually closer to 70% of both group revenue and profits

Ascendis Health Investment Report
November 2013 a product of Ingham Analytics 21
Whilst over-the-counter and complementary alternative medicines feature in the
Ascendis line up, the liberal use of phraseology such as ‘nutraceutical’ or ‘functional
foods’ does not make these registered drugs, for all the squeaky clean image
portrayed. In the United States, for example, such categories as dietary supplements
are regulated by the Food & Drug Administration under authority of the Federal Food,
Drug and Cosmetic Act but are not defined by law.
In a thematic sense, some comparison with AVI is perhaps more relevant than say a
Aspen or Adcock Ingram.
AVI as a consumer products case study
AVI, a branded consumer products group selling crisps, cosmetics and coffee
together with processed fish and fancy footwear had a subtle but nonetheless
significant shift in strategic orientation back in 2005.
Always a branded consumer products company with disparate interests, AVI had
ditched glass making (Consol) and goods transport (Vector) to regroup around the
supply and manufacture of branded, added-value consumer products within the
categories of food, beverage, personal care & well-being, out-of-home, and branded
semi-durables.
Similarly, much of the Ascendis portfolio has an aspirational aspect to it. Poorer, more
unequal countries such as South Africa have consumers that tend to be more brand
conscious and brand loyal than consumers in rich countries. It is no accident that
house brands command a far smaller share of grocery than in advanced economies.
Aspiration and emulation plays a strong role in developing economies, which is
combined with the fact that such purchases are a significant household budget item
and quality and longevity matter.
Moreover, in countries such as South Africa brand premium in pricing is still
achievable relative to cheap and cheerful mass-market merchandise. An emergent
middle class adds fuel to this trend. A product such as Nimue is locally assembled
with imported ingredients for the aspirational young female or male consumer.
For a company such as AVI, its consumers span breadth of LSM categories but it is
innovation and brand extension that have been key aspects in AVI’s positioning in the
market, with an orientation towards the mid and upper income segments. In the case
of Spitz, the retail aspect in my view is incidental – the branding and market-
positioning aspect is key.
Adcock Ingram compares on an income split
The closet comparison to Ascendis in revenue and profit segmental split is Adcock
Ingram which has a branded OTC business with household names such as Panado,
Corenza and Bioplus. This segment I estimate will generate R1.85 billion in sales for
the year ended September 2013 or some 39% of Southern Africa revenue. The OTC
consumer contribution before Southern Africa operating expenses and R&D is 55%.
Adcock Ingram has a long established prescription medicine business that I estimate
will generate R1.7 billion in F2013, just over 35% of the total Southern Africa revenue.
The profit proportion I estimate at 29%, down from 35% two years ago and with the
contribution margin at 20% some ten percentage points less.
Adcock Ingram has been particularly vulnerable to both single exit pricing controls
and exchange rate weakness. Prices in F2012 actually decreased and there was a
modest 2.1% single exit price adjustment following no adjustment the prior year. With
raw materials and operating cost increasing margins are under downward pressure,
falling in F2012 alone by five percentage points.
AVI has a thematic resemblance to Ascendis The closet comparison to Ascendis in revenue and profit segmental split is Adcock Ingram

Ascendis Health Investment Report
November 2013 a product of Ingham Analytics 22
Aspen leads the way
Investors taking a stake in Ascendis will probably be keeping an eye on a deceptively
similar comparison between Adcock Ingram and Aspen Pharmacare. Both in the
same sector but taking wildly differing paths and coming up with astonishingly
divergent outcomes.
In the back of the mind is the thought – am I taking a punt on an AIP or a APN? Is this
the next fire cracker that turned out to be a damp squib or an elevator to the
stratosphere?
Exhibit 13 Adcock Ingram and Aspen in ZA cents from date of AIP listing 25 August 2008
Source: JSE, MN Ingham
2 500
7 500
12 500
17 500
22 500
27 500
32 500
2008-08-25 2009-08-25 2010-08-25 2011-08-25 2012-08-25 2013-08-25
APN AIP
Exhibit 13 Adcock Ingram, Aspen and All Share Index based to 100 from date of AIP listing 25 August 2008
Source: JSE, MN Ingham
50
150
250
350
450
550
650
750
2008-08-25 2009-08-25 2010-08-25 2011-08-25 2012-08-25 2013-08-25
APN AIP All Share
As recently as F2008, South Africa accounted for 77% of Aspen revenue and 85% of
its profit.
Aspen has grown international profit to 65% from 15% in 2008
Investors will probably be wondering if Ascendis is a future Adcock Ingram or Aspen Pharmacare armacare

Ascendis Health Investment Report
November 2013 a product of Ingham Analytics 23
For the year ended June 2013, South Africa contributed 35% to both revenue and
profit. If my estimates hold any water, South Africa will contribute less than 30%
within two years.
In the same five year period, annual group revenue and underlying profit has grown
from R4.9 billion and R1.3 billion respectively to R19.3 billion and R5.3 billion. In five
years, profits have grown to exceed starting revenue. The ten year EPS CAGR to
2013 is 27%. Aspen is now in the top ten globally in generic pharmaceutical sales.
The increase in non-South Africa profits last year accounted for three quarters of the
total rise and it is probably fair to estimate recent acquisitions as having accounted for
about half of the earnings rise.
The integration of the Sigma business, completed 31 January 2011, accelerated this
internationalisation trend at an investment value of R6.1 billion at the time. The
acquisition of brands from GSK and cooperation with the drug giant has also played
an important part.
Internationalisation is also reflected in shareholding. Glaxo, with which Aspen has
developed a strategically and commercially important relationship since 2008, holds
18.6%. About half of institutional shareholders are from abroad.
But a key competitive advantage of Aspen is its South African manufacturing base.
The surge of internationalisation in group earnings does not imply the South African
home base is less significant, quite the contrary.
It is a strong home base that has provided the launch pad for growth abroad and the
South African operations are benefiting from the globalisation. Global ethical giants
like GSK and MSD are comfortable partnering with Aspen because they implicitly
know that Aspen in turn respects and protects their reputation.
I think it is also important to recognise that the lines between existing and acquisition
are blurred. Aspen is a good integrator that operates in a joined up manner and as a
result the whole then becomes greater than the sum of the parts.
Bidvest has similar characteristics, a good acquirer and a brilliant integrator. Not
because it expects portfolio companies to go along with group-think, quite the
opposite.
Ascendis could learn a lesson from this.
For Aspen, it is this improving scale in capacity, reach, product and people that is
reinforcing the growth and commercial success of the group when, ordinarily, a
maturing phase would have seemed likely.
This is also important insofar as keeping a premium stock rating goes.
Acquisitions are well and good but acquisitions in multiple industries rarely eke out
the benefits that Aspen has manifestly achieved and which rival Adcock Ingram has
certainly failed to achieve.
But even as acquisitions may not be as readily doable in future there remains plenty
of opportunity to exploit international markets in both developed and emerging
countries.
Aspen has not been skint on capex, much of it in South Africa. Capex on tangibles
was R470 million in F2012 and R670 million was spent in F2013 with expansion
R505 million alone. Intangible capex was R3.7 billion in F2013, up from R2.2 billion.
Efficiency and procurement savings are bolstering margins in a price sensitive and
regulated market. Rand weakness influences raw materials and with raw materials
accounting for about 65% of cost of production manufacturing scale is essential to
mitigate the price-down effects in this industry.
Possible Aspen lessons for Ascendis Clear internationalisation theme with Aspen – but off a strong SA base Aspen is a good integrator, whole greater than the sum of the parts Bidvest has similar characteristics Investment high at Aspen Forex risk mitigation

Ascendis Health Investment Report
November 2013 a product of Ingham Analytics 24
With foreign currency accounting for about two-thirds of cost of materials and the
South African rand the balance, greater foreign sales have a very important benefit in
managing foreign exchange exposure. There is ample capacity to fill, notably in Port
Elizabeth, as international accounts for one sixth of volumes and growing. With
foreign currency accounting for about two-thirds of cost of materials and the South
African rand the balance greater foreign sales assist with managing forex exposure.
With local pricing, predictability is desirable and a revised SEP adjustment formula
that takes into account local inflation and exchange rate movements may provide that
even if it could mean prices move up and down.
Aspen is in phase two of its life cycle, deepening its international exposure. It has an
unambiguous growth agenda backed by tangible delivery and continues to bolster its
competitive position.
Six or seven years back there was little difference between the earnings of Aspen
and Adcock Ingram. This year Aspen trading profits are more than 5x that of Adcock
Ingram and its enterprise value more than 10x that of Adcock Ingram, even with the
CFR bid premium.
Adcock Ingram has a number of attributes, not least a good infrastructure and a
world-class manufacturing operation at Wadeville.
But Adcock Ingram remains overwhelmingly reliant on the domestic South African
market and in that it is not entirely in command of its own destiny given the regulatory
situation and influence of state tenders.
I also struggle to get a clear sense of purpose for Adcock Ingram. And the rebuttal to
the Bidvest approach was a case of protesting rather too much and appears to have
been drafted by a cohort of barristers.
In valuing Aspen account must be taken of the significant intangible component of the
balance sheet and thus confidence in the cash generating capacity of the intellectual
property in particular. Many brands will be indefinite useful life intangible assets. The
book value understates the extra value that derives from continuing investment in
promotion of the brands.
Over 80% of Aspen’s long term assets are good will and intangibles. The cash
generating potential of dossiers, product pipeline, brand recognition and positioning is
very much tied up in the market cap of R125 billion at a share price of R277 which is
5.5x the NAV per share of R50.
It is quite feasible for Aspen to double, possibly treble, earnings over five years.
Management is getting into their stride abroad and learning quickly and executing
well. The decentralisation of teams within an Aspen business philosophy is working
well too.
Aspen has no acquisition strategy per se. The group vision is to deliver value, be a
responsible company and provide quality, affordable medicines and products globally.
If Aspen was simply a land-grab outfit the chances are it would not have been half as
successful and more than likely encountered financial and operational problems at
some point.
Growth does not come at any price. Aspen’s growth is judiciously acquired –which
means it mixes wisdom, common sense, discretion and a bit of luck with the intention
of building on what has been proven and avoiding unnecessary trouble or
wastefulness. The surge of internationalisation in group earnings is not a product of
acquisitive intent but a by-product of preparation meeting opportunity.
Large-scale volume manufacturing in South Africa has been deepened through group
rationalisation and consolidation internationally. There is a symbiosis to the growth
and expansion process that the MBA buzz word synergy can’t even begin to
describe. It is also important to recognise that the lines between existing and
Lack of predictability in SEP drug pricing Six or seven years back there was little difference between the earnings of Aspen and Adcock Ingram Significant intangible component of the Aspen balance sheet, cash generating capacity of the intellectual property Vision to deliver value, not growth for the sale of growth Aspen’s growth is judiciously acquired
Symbiosis to process

Ascendis Health Investment Report
November 2013 a product of Ingham Analytics 25
acquisition are blurred. And virtually all recent deals have been sealed by the
excellence that Aspen brings to the table in quality pharma manufacturing.
The dual leadership structure of Stephen Saad and Gus Attridge is effective, with
each playing to their strengths. This is partly by design and allows for seamless
succession in the event of death of one. Both are clued up financially and
demonstrate a clear sense of purpose and an eye for opportunity. Aspen has no
greater key person risk than some other companies but in some respects is already
better provided for and should give investor’s confidence.
Aspen is by no means comparable to the ethical majors in the pharmaceutical world.
GSK, its key partner, is a mature, R&D intensive ethical producer. At some point
Aspen will mature – when I do not know. But at that point it is still likely to be able to
command a PE in the mid to late teens because of the moats its will have built around
it across a diversified geography - the stuff of premium ratings.
Aspen is a great foreign investment – that just happens to be listed on the JSE.
Ascendis serves differing categories
Ascendis companies fall within differing fast moving consumer, specialist, and
regulated healthcare categories and also within the public sector and private sector
pharmaceutical markets.
Determining a market share is no simple task and can be misleading. Statistics in
South Africa tend not to be as disaggregated, detailed and comprehensive as in
certain advanced economies and moreover the quality of data collection and the
scope thereof, particularly government statistics, leaves much to be desired.
The over-the-counter market is a case in point. If one defines it strictly as private
pharma OTC, then industry turnover on a moving annual total basis is worth
approximately R8.3 billion according to IMS. But that would be unlikely to include a
number of the products that Ascendis sells – such as a Muscletech workout protein
shake or a Nimue aftershave cream. The OTC market too is divided into pharmacy
and FMCG. IMS estimates pharma FMCG at R3 billion in sales.
Simply taking an annualised F2014 segment turnover for Consumer Brands of
R857.9 million over, say, R8 billion to get a market share of around 10% would be
inaccurate.
Grocery too is a case in point. A few years back, when by its own admission today it
was losing market share, Pick ‘N Pay claimed (citing Nielsen) that it had a 33.4%
market share versus Shoprite on 28.4%, Spar on 26.3% and Woolies on 11.9%. In
turn, Shoprite claimed in its statistics that it had 29.8%, Spar reckoned 27.6%, whilst
Woolies claimed 8.8% in its Food category.
In fact all of the grocery majors, who cover a huge proportion of FMCG, routinely
claim either to be holding or increasing market share to the extent that market share
percentages can be in excess of the total market.
Insofar as Ascendis is concerned, its sales are largely in a wholesale category and
on-sold into retail.
What we do know from the official statistical services, caveats notwithstanding, is that
total retail sales in pharmaceuticals and medical goods, cosmetics and toiletries will
amount to R50 billion in calendar 2013. If that is a broadly defined benchmark within
which group companies compete then even taking total group revenue Ascendis has
very small share.
Data compiled by IMS further confirm that the total pharmaceutical market is currently
worth approximately R32.5 billion. Of this, private is the lion’s share at R28 billion with
public sector at R4.5 billion.
Effective dual leadership structure at Aspen Moats across a diversified geography Span of markets Determining a market share is no simple task OTC Pharmacy and OTC FMCG Lion’s share of pharmaceuticals market is private by value but less so by volume

Ascendis Health Investment Report
November 2013 a product of Ingham Analytics 26
Pharmachem is forecast to generate an annualised R440 million in revenue and so in
the broad sense has a 1.3% share of the total market by value. For a business that
started in 2006 that is not bad going.
However, approximately half of Pharmachem revenue is from government tender and
within the generic off-patent category and that is likely to remain the focus for the
foreseeable future.
Of the R28 billion private market, R19.7 billion is prescription medicines (abbreviated
to Rx in shorthand) and R8.3 billion over-the-counter.
Within the prescription category of drugs worth R19.7 billion, original R&D ethical
products are worth R12.2 billion by value which is 62% of the market by value.
Generics which are off patent are worth R7.6 billion and thus 38% by value. On
counting units, ethical drugs account for 32% and generics and 68%.
In other words, of the total private sector 70% is prescription and 30% OTC by value.
Of the total market for drugs, the public sector is a mere 13% by value with the
private market 87%. Similarly, when the generics market is broken down, the private
sector is valued at R6.6 billion or 87%.
By counting units, the difference between private and public narrows to the extent
that the private sector has a 67% share of counting units and the public sector 33%.
In private sector generics, IMS data indicate that Aspen commands 33.3% market
share, followed by Cipla Medpro on 16.5%, Adcock Ingram on 8.7%, Novartis on
7.9%, Sanofi on 5.3%, Daiichi on 3.5% and Pharmaplan on 3% with a long tail of far
smaller players. The top three thus have 58.5% market share between them.
In OTC Pharmacy, Adcock Ingram remains the leading player with a market share of
20% by value and 35% by volume. Aspen has 13% by value in this market and
Johnson & Johnson 6.5%, with Cipla Medpro on 4.5%, Reckitt on 3.8% and then 50%
of the market is fought over by many smaller players.
Pharma-Med is a relatively large portion of Ascendis Health revenue and a growth
focus for the future. It will therefore be influenced by external macro industry factors
together with own internal initiatives to win share.
Demand drivers of profitability for South African pharma manufactures include the
number of consumers and how much money they have to spend, the number of
people who have access to private medical care, and the generic product pipeline as
ethical patents expire.
These are not exhaustive factors but neither are they mutually exclusive.
Globally, growth in the emerging middle class will be a driver of generics. The market
for generic drugs is already estimated at $140 billion with emerging markets
accounting for over half of demand by volume. Ethical patent expiries could expand
the range with estimates varying from $50 billion to $100 billion in value worldwide.
According to IMS, the total global market for all pharmaceuticals will be worth $1.2
trillion in 2016 and showing growth of between 1% and 4% in developed countries
and 12% to 15% in emerging markets. South Africa demand is estimated to grow at
6% to 9% between 2012 and 2016.
IMS further estimate that ethical market share will have fallen from 60% in 2007 to
52% in 2016 with generics growing from 11% to 17%.
But growth will be driven by volumes, new product and range extension - not price.
This price/volume equation is seen in the value of scripts. The average price in the
private market in 2013 is R70 per unit. This compares with R60 back in 2008, a total
rise of 16.7%. In that five year period, scripts at schedule 3 or above have moved
from R109 to R125, up 14.7%. OTC at schedules 0 to 2 have moved from R27.60 to
Approximately half of Pharmachem revenue is from government tender Generics a growing share Public sector has a small share by value Aspen largest share of private sector generics In OTC Pharmacy, Adcock Ingram leading player Drivers for profits Ethical patent expiries Volume growth projected in South Africa Price/volume equation

Ascendis Health Investment Report
November 2013 a product of Ingham Analytics 27
R35, up 27%. The share of OTC by volume has crept up to 61%. But the absolute
price difference between scripted market and OTC is still wide, roughly 3.5x.
In the public sector, figures from IMS further show that generic medicines have a 75%
share versus 60% in 2001. The average price of a generic medicine unit at R45
compared with R113 for an ethical alternative.
In retail pharmacy, 34% of volumes at independent pharmacies was prescription with
66% OTC and the figures are similar for national chains such as Dis-Chem and
Clicks. In supermarket pharmacies 74% of volume is OTC.
The 2013 single exit price increase of 5.8% compares with only 2.1% in 2012 and
should in fact have been 8% given the weakness of the currency and other rising
costs. This poses further challenges for manufacturers and makes volume even more
important in cost recovery.
The introduction of a national health insurance and international price benchmarking
add further to potential price-down pressures. There are also rumblings about a state-
owned pharmaceutical parastatal. Detail on implementation of NHI through 2025
remains somewhat hazy and given the manifest failure of public health policy and
execution in the past two decades there is little to get encouraged about. Embracing
private sector management expertise would go a long way to restoring efficiencies in
public health without creating unnecessary uncertainty and expense for no
quantifiable benefit.
Medicines in South Africa have got cheaper, in part due to mandatory generic
substitution and the growing availability of generics. As a result, spending in this
category has no correlation with overall household spending in the economy. Whilst
this may suggest defensiveness and inelasticity there is substitution happening, not
least between prescription and OTC. Substitution is also helping offset effects of
single exit pricing for South African manufacturers. But further regulatory burdens are
possible. The pharmacy sector has already had to cope with dispensing fee
regulation and on the horizon there is logistics fee capping.
Private medical insurance looks set to stabilise after a strong growth in numbers in
recent years, in part due to the government employees medical scheme. Private
medical insurance covers 8.5 million lives or 15% of the population. GEMS alone has
added 1.8 million lives.
All schemes, including the GEMS, have differing degrees of coverage though and it
would be incorrect to assume that 8.5 million lives have fully comprehensive cover. In
GEMS, with five benefit categories, less than 10% of the membership has access to
comprehensive care with defined specialist access.
Hospital inflation in South Africa has been well contained in recent years and that
trend is likely to continue as private sector efficiencies offset cost pressures. At
Netcare and Life Healthcare, for example, revenue per patient day is running at 5%.
Tariffs charged by private hospitals are negotiated with medical scheme
administrators every year and scale economies in treatment are passed through to
members. Prescribed minimum benefits in terms of the Medical Schemes Act creates
a further symbiosis between funder and service provider.
The question one has to ask is, what differentiating factors does Ascendis have
versus other investment alternatives to warrant above average growth versus peers
and possibly a premium rating?
An analysis of the individual businesses within the segments will provide further
colour on this question.
Retail pharmacy trends SEP challenge NHI and international benchmarking Mandatory generic substitution and growing availability of generics
Private medical insurance looks set to stabilise Hospital inflation contained We need to ask the question - what differentiating factors does Ascendis have?

Ascendis Health Investment Report
November 2013 a product of Ingham Analytics 28
Segment analysis
Consumer Brands
Consumer Brands preventative products are sold typically via retail outlets and fall
into over the counters medicines and complimentary alternative medicines.
Chempure
Chempure supplies speciality ingredients and was acquired effective 30 June 2012.
The business dates back to 1994 and has enjoyed long-standing supplier
relationships.
The business will make up less than 10% of group revenue going forward but it is a
potentially critical building block for the group as it has the potential to be the principal
procurement channel for many group companies. Whilst sports nutrition orientated
currently, active pharmaceutical ingredients could be a natural extension.
Chempure operates out of a bespoke facility near Pretoria.
Target markets are food, health-food, pharmaceutical and cosmetics. Technical
expertise is provided to customers and there is backup support from foreign
principals.
Chempure has a wide spread of customers, many of which are external to Ascendis
and include multinational and domestic firms in FMCG and speciality nutrition. No
single customer accounts for more than 10% of sales.
Being part of the Ascendis group though will provide Chempure with a framework
within which to consolidate its position in chosen target markets and seek additional
sourcing channels and customers.
International suppliers include DSM and Hilmar Ingredients, collectively 70% of
revenue on competitive terms and with good growth achieved in the sports nutrition
market. Solae, a soy ingredient manufacturer owned by Du Pont, Purac, a natural
food preservation producer, Berg & Schmid in lipids, Virginia Dare in flavour and
extracts, Draco in botanicals, and American Casein Company are also well-known
suppliers to Chempure. Capsules and miscellaneous items complete the line-up.
DSM, originally a Dutch state-owned coal mining business, has evolved into a leading
life sciences and materials science company. Insofar as Chempure is concerned,
nutrition and pharma is most relevant.
Life Sciences is not some abstract biological field of study but a multi-billion dollar
global industry encompassing food and beverage, animal feed, personal care, dietary
supplements and pharmaceutical and biopharmaceutical industries.
Hilmar Ingredients is actually part of the Hilmar Cheese Company in California and as
one would expect supplies whey protein concentrate, hydrolysate and isolate, and
lactose. Whey is the largest single costs item, over 60%, in body building nutrition
products.
This plays pretty much to the Ascendis virtuous cycle thematic. Urbanization drives
consumption of processed foods which creates a need for a more efficient food chain.
In turn, increasing incomes mean increased demand for proteins and thus the supply
of protein. This creates a political imperative to improve food security. Ageing means
higher healthcare spending but limited financial resources together with an
understanding of prevention stimulates demand for healthy and active aging.
Chempure sales tend to coincide with the seasonality of FMCG with sales volumes
tending higher from the middle of the calendar year through November. Management
buys counter cyclically, taking advantage of the northern and southern hemisphere
differences.
Chempure potentially a critical building block for the group High quality global suppliers Life Sciences an important industry Virtuous cycle thematic in
Ascendis

Ascendis Health Investment Report
November 2013 a product of Ingham Analytics 29
This is a working capital business, particularly stock and debtors. Long lead times on
shipping are the norm, typically four months. Suppliers are settled promptly. Being in-
stock is crucial for reliability and customer satisfaction. The differences in working
capital between peak and low season months is around 30%. This pattern is unlikely
to change and as the business grows further investment in working capital will be
necessary.
Currency is an important factor in gross profit, notably dollar and euro. Foreign
exchange contracts are entered in to and matched to orders.
The weakness in the rand across a basket of leading currencies this past year could
have margin erosion consequences if customers push back on pricing, which is a not
uncommon feature in the South African market today, and mark-ups have to be
reduced.
It is important to move pricing in tandem with currency movements in such a working
capital business otherwise your ability to replenish in a depreciating currency cycle is
impaired. Historically, Chempure has handled periods of extreme volatility fairly well
and has taken a conservative forward view on pricing. The business is historically
self-funding.
An important differentiating factor for Chempure is the safety-critical food-grade
aspect of what their customers require and which Chempure has always supplied.
Solal
Solal was purchased effective 1 July 2013. Half of the business was owned by private
equity investor CAVI Brands. Restraints are in place with key vendors. A number of
senior management are reinvesting.
The business was formed in 2000 with a focus on preventative and healthy aging
complementary medicines and supplements.
The product range includes nutraceuticals, dermaceuticals, functional and functional
super foods, hormone creams and there is an in-house published periodical called
Health Intelligence widely distributed. There are over 150 nutraceutical supplements
alone.
An integrative medical centre provides consulting services by healthcare
professionals of differing disciplines. The Compounding Pharmacy of South Africa is
for customised preparations.
The company is registered with the South African Pharmacy Council. Solal
complementary medicines are made in MCC approved facilities with manufacture
outsourced. It is possible that compulsory registration in this category could be
introduced.
Chempure is a key supplier of quality active ingredients to Solal. Warren Chem
Specialities is another supplier.
Products are stocked and prescribed by physicians and doctors and the branding is
prominent in a number of selected stockists. UTI is the distributor nationally.
Dis-Chem is an important customer and as such it partly competes with the Dis-Chem
own-brand Biogen. Dis-Chem has a powerful reach as a Walgreen’s type drug store
in South Africa and the business philosophy dovetails well with Solal. Independent
pharmacies, Clicks, Woolworths and the integrative medical centre are also important
outlets.
Various other growth and innovation opportunities will be pursued. A number of new
products are due for launch in Q1 of calendar 2014. There is complementary
positioning with other Ascendis group companies.
Working capital business, particularly stock and debtors Currency exposure Safety-critical food-grade aspect to what customers require Solal focus on preventative and healthy aging complementary medicines and supplements Health professionals, differing disciplines MCC approved facilities Chempure a key supplier Available through physicians and from selected outlets Opportunities to be explored

Ascendis Health Investment Report
November 2013 a product of Ingham Analytics 30
A differentiator in what is often seen as a crowded market is the customer and
prescriber perception of high quality and the investment in key skills to underscore
the efficacy of the product and the use of it.
Solal has a medical advisory board and there is a strong educative theme running
through the marketing.
Solal has resisted increasing its penetration into grocery stores because of a desire to
protect brand integrity, keep supply chain reliable and retain a drug store, chemist
and prescription dispensing route to market.
The size of the market for vitamins and supplements is debatable, not least because
there is no definable classification of what complementary alternative medicines are.
Based on a study undertaken by The Health Products Association of Southern Africa
a few years back a wholesale market of roughly R3 billion today would be a
reasonable number. Other surveys suggest a number half that. Whatever the number
is, Solal is a relatively small player overall but in the top three at the premium end of
the market.
Nimue
Nimue comprises both Nimue International and Nimue South Africa and came into
the Ascendis group via two separate owners although initially it was one company.
Nimue South Africa owns the distribution rights for products in South Africa,
distributing through salons, and is supplied via Nimue International.
Originated with a strong medical and scientific basis in South Africa back in 1994 the
focus was initially on pre and post-operative application and skin rejuvenation. The
product range has since expanded within four clear treatment categories.
Nimue has become well established as a brand internationally. International sales
account for 60% of the sale of Nimue International with South Africa 40%.
Products number 150 and include cleansing gels, creams and lotions, conditioners,
exfoliating enzymes, moisturisers, sun screen, eye serum, purifiers, phytogel washes
and male after shave cream. Refills are available to customers, a popular cost
effective option.
The target market is a middle to upper income female, and to a much lesser extent
male, catering to all racial skin types. Distribution is largely through skin care salons
as use needs guidance from a trained therapist. The company estimates a market
share of 15% in its category but this is difficult to verify.
Typical local substitutes would include Dermalogica, Environ, RegimA and Lamelle
and the major FMCG houses such as L’Oreal’s Garnier brand.
Nimue has usually appointed distributors within a country and has an exclusive
agreement determining growth and development of the brand in that country for a
renewable three year period. In some countries with good market size and
opportunity a wholly owned subsidiary would be considered.
There would appear to be scope for the business to be increasingly professionalised
within the Ascendis umbrella and for the international component to be exploited and
managed far more proactively.
Beautician feedback suggests this is a brand that has rested on past laurels rather
too long with scant reinvestment and seemingly minimal R&D. Consumer choices
have increased and the bar raised.
Sports Nutrition – Evox, SSN and Bolus
The three brands of Evox, Scientific Sport Nutrition and Bolus (Muscletech, USP
Labs, Gaspari, BPI, etc.) make up the sports nutrition component of Ascendis and are
recent acquisitions. The brands are well known in their market and rank among the
most recognised and trusted for the performance characteristics they impart.
Customer and prescriber perception of high quality No definable classification of what complementary alternative medicines are Four clear treatment categories in skincare Numerous products Target market largely middle to upper income female Scope to be increasingly professionalised and grown internationally Recognised and trusted sports nutrition brands

Ascendis Health Investment Report
November 2013 a product of Ingham Analytics 31
Collective turnover is running at approximately R200 million in F2014. The size of the
market is uncertain. Recent data out of Euromonitor indicates a total market value of
R415 million. This alone would infer that the three Ascendis brands account for
around 50% of the total market, which they certainly don’t. Other data claims a
wholesale market of in excess of R500 million.
Evox alone is ascribed a 1.2% market share by Euromonitor – even if we assume the
collective turnover of R200 million is divided equally among the three, simple maths
suggests an implied total market on that reckoning of R5.5 billion, which is rather
more than R415 million. The Euromonitor numbers are thus highly questionable.
What we do know is that USN and Biogen, through Dis-Chem, are the two clear
market leaders and at a rough estimate they probably have 30% and 25% each.
Collectively, Ascendis would probably have the largest market share going forward
although what that means for future growth and development potential remains to be
seen.
Suffice to say that in my forecasts I have assumed top line running in line with
nominal GDP growth of around 8%. There is substantial scope to improve efficiencies
through the Ascendis corporate structure.
Evox was founded in 1996. Products are marketed through Dis-Chem, Clicks, Game,
Sportsmans Warehouse, Pick n Pay and independent pharmacies and health shops.
SSN is a more recent company, founded in 2008, with its products having a strong
body building theme. It operates from a facility in Pinetown, Kwa-Zulu Natal.
Chempure is an important supplier.
Stores such as Mr Price Sport and Dis-Chem stock the products and SSN has an
online site for purchases. There is international distribution to India and Europe.
Bolus Distribution has exclusive representation in South Africa of known US brands
and was set up originally in 1997 as a direct selling organisation. Distribution is
through chains such as Dis-Chem, Clicks and Pick n Pay. In 2011, Bolus became the
South African publisher of Inside Fitness magazine.
The sports nutrition market in South Africa is predominantly locally produced, possibly
as much as 85%, and so Bolus represents a greater exchange rate sensitivity as a
direct importer.
Network marketed products - Sportron and Regal (Foodstate), Swissgarde
Sportron is a direct selling business established in 1992 and was brought into
Ascendis in August 2011. Sales exceed R100 million. The business uses Foodstate
nutrients and herbs in formulations. Typical competitors would include AMWAY and
Herbalife.
Foodstate products are retailed through Dis-Chem, Clicks, Pick n Pay, Shoprite and
independent pharmacies and health stores. Competitors include Solal, Vital,
Natrodale and the various house brands.
Swissgarde is similar to Sportron but it has an African and emerging markets focus
with a notably strong following in Nigeria.
Reviva - Fitflop South Africa
Fitflop toning footwear is distributed by Reviva Technology based in Cape Town and
it was the first company to be brought into the Ascendis fold. Fitflop is a British brand
with a bit of a cult following. There is scope to add other premium niche footwear
brands.
Green Cross, part of AVI, would be a typical alternative in this bracket.
Market data is suspect USN and Biogen market leaders although this could be matched by Ascendis Direct selling of wellness products locally and through Africa
Fitflop has a niche offering

Ascendis Health Investment Report
November 2013 a product of Ingham Analytics 32
Pharma-Med
Pharmachem
This will be the Ascendis platform for becoming a future player in generic and over-
the-counter medicines in South Africa and regionally. The business has been
acquired effective October 2013 and the vendors are partly reinvesting in the
Ascendis group.
For the most recent period pre-acquisition, the combined businesses generated a
turnover of approximately R400 million, of which about half related to government
tender revenue. Antibiotics are the largest single tender item at present.
The founders of the Pharmachem business had no need to sell and so the Ascendis
proposition had to be particularly appealing. There is the possibility now to realise a
much bigger business over time together with the complementary nature of the other
companies in the Ascendis stable.
This is a lower operating profit percentage margin business that with scale and
increased reach could become a low to mid double digit operating margin business.
Tender business is typically an early teens gross profit percentage with private sales
at least twice that. Mix therefore is important in the final consolidated margin.
A risk to the model is expiring government tenders not being renewed.
New dossiers are also an important feature in sustaining revenue and contribute to
diminishing concentration risk.
Imports are key and thus foreign exchange. Whether it is tender or private market
Pharmachem is subject to pricing constraints and potential GP squeeze.
As with much of the Ascendis group, intangibles are the largest single balance sheet
asset. A dossier can be valued at anything from R1 million upwards and much more
for newer generation molecules.
This is a working capital intensive business too and will rise commensurate with the
growth objectives. Government tender terms are 120 days.
Is this a Aspen? Perhaps not, at least not for a while and certainly not comparable
27% profit margins. But as Aspen grows ever larger locally and internationally so in
turn will there be parts of the domestic market that it may wish to leave to smaller
players, indeed that is what makes the GSK relationship so symbiotic. In fact
Pharmachem is already experimenting with newer molecules for generic production.
The state of healthcare in South Africa, and in particular the national disgrace that is
public health mismanagement, goes beyond the scope of this note but suffice to say
South Africa is an example of how generic drugs have reshaped the pharmaceutical
landscape in both private and public sectors. In this regard, Ascendis has as good a
chance as any to stake a claim.
Pharma-Med as a division, however, is likely to be bulked up and complementary
acquisitions will go hand in hand with anticipated strong organic growth in revenue.
Medical devices is seen as a business area with good potential.
Pharmachem develops, manufactures and sells prescription and selected over-the-
counter preparations which are sold through dispensing doctors, wholesalers,
pharmaceutical retailers and government and private hospitals.
Pharmachem has over 100 dossiers with a number in development and registration.
As many as 50 new dossiers are targeted to be registered within the next three years.
If that does materialise one could be looking at R75 million to R100 million in
additional revenues.
Platform for becoming a future player in generic and over-the-counter medicines in South Africa and regionally Appealing proposition to be part of Ascendis Scope to ratchet up margins Certain risks Not an Aspen as yet but there is a lot to play for Generics have reshaped pharma landscape Bulked up with acquisitions Over 100 dossiers with a good number in the pipeline

Ascendis Health Investment Report
November 2013 a product of Ingham Analytics 33
Drugs are categorised as patented by an originator, such as a Glaxo, with a certain
period of protection and me-too generic drugs typically manufactured from older
generation molecules. Prescription drugs are scheduled by the Medicines Control
Council as three or higher with over-the-counter drugs at schedule two or lower.
The delayed South African Health Products Regulatory Agency is designed, if that is
the word, to supplant the inefficient MCC and possibly include registration of
complementary alternative medicines. The proposed amendments to the Medicines
and Related Substances Act have recently been published. Nobody remotely familiar
with this expects any meaningful improvements anytime soon. Registration can be a
three year process. Electronic submission of dossiers has recently been approved in
an attempt to accelerate the review process.
Nevertheless, public health failings creates its own opportunity and the entrepreneurs
behind Pharmachem have grasped this. Pharmachem was started as recently as
2006 by two business partners to compete in the underserviced lower income or no-
income market.
It is worthwhile recalling that of the 52 million people officially living in South Africa,
and who knows how many illegally, 43.5 million have no medical aid cover and are
reliant on either public facilities in their various forms or as first line of treatment a
private GP, possibly in a rural area.
Pharmachem Pharmaceuticals markets and distributes its own branded generic
pharmaceuticals and over-the-counter products to dispensing doctors and urban and
rural independent pharmacies.
A related business, Dezzo, competes for government tender business on the same
basis as Aspen or Cipla Medpro. It is a licenced importer and exporter of for
pharmaceutical products and employs a well-qualified team.
Following the normal tender expiry, Dezzo has recently been awarded in excess of
R400 million in the latest tender running over two years. There is potential upside well
beyond that over the next few years.
Much development is undertaken in India with active pharmaceutical ingredients
sourced mainly from India.
Manufacture is outsourced. A license is issued in terms of Section 22c of the
Medicines and Related Substances Control Act, specifying to a manufacturer,
wholesaler or distributor of a medicine or medical device acceptable quality
assurance principals and manufacturing and distribution practices.
Another sister company, Pharmadyne, focuses on vitamins and minerals with
government tender the largest customer.
Estimates are predicated on this division potentially delivering faster earnings growth
than Consumer Brands and Phyto-Vet.
Phyto-Vet
Efekto, Avima and Marltons
Ascendis Phyto-Vet is the plant and animal part of the portfolio with Efekto the homes
and gardens based business, Avima providing pesticides and related formulations for
growing crops and Marltons the manufacturer and distributor of a comprehensive
domestic pet care range. The largest of the three by revenue is Efekto which
generates around half segment turnover.
Efekto
Efekto has built a leading presence in plant, home and garden protection (Efekto) and
nutrition (Wonder) since 1973. Mayford Seeds are distributed through Efekto and
there are numerous accessories available.
Drugs are categorised as patented or generic Inefficiencies in registration process Public health failings has created its own opportunity Routes to market Government tender qualification API’s sourced mainly from India Potential to outperform Important plant and animal component to Ascendis
portfolio

Ascendis Health Investment Report
November 2013 a product of Ingham Analytics 34
Similar to human health, there is a Department of Agriculture registration
requirement. Much of the portfolio will have an active chemical ingredient such as
propiconazole, which would be composed of chemicals such as dichlorophenyl, or
dimethoate, which would contain dimethyl, or the methylphenoxyacetic acid in a
herbicide. Some of these things can kill you if ingested and a material safety data
sheet is provided for use, toxicology and first aid.
These molecular ingredients are typically licensed for use in South Africa by chemical
company principals such as BASF, Dow or Beyer. Efekto buys the active ingredient
and sub contracts formulation. The relationships are key for keeping up with latest
developments.
There are around 800 products with a sales split dominated toward garden and with
herbicides and insecticides the most profitable. There is a predictable seasonality to
demand.
Distribution is through outlets such as Builders Warehouse and garden stores and
there are sales agents on commission in the field. Marketing is typically in-store and
in print. Builders Warehouse is today the largest stockist but there is little customer
concentration risk and the category is very much a destination one with relative
inelasticity. A house brand is produced for Massmart.
There is little accurate data on market size in South Africa but given that Efekto has
the leading market position by some distance, with Starke Ayres the number two, a
figure of R400 million for both chemicals and fertilisers seems reasonable.
Exports have been insignificant but offer promise regionally, including indirectly
through chain stores such as Shoprite and Pick n Pay.
Avima
Avima was formed in 1961 and today manufactures crop protection, public health and
stored grain protection pesticides among other products. Half of revenue is exports,
principally within Africa.
This is a scientific business and staffed appropriately. There are over 70 registrations
in a number of countries and there is a pipeline of product improvement and range
extension.
Relationships have been established over many years with customers, formulators
and toll manufacturers. Avima is a key supplier to Efekto and the two share R&D and
warehousing and production.
Sales into Africa are often via agencies such as the African Development Bank or
large agribusiness concerns or governments. Tsetse and malaria control feature
prominently. Select distributors are also important.
Avima is a key component of the Ascendis Phyto-Vet division and brings a scientific,
technical and customer relationship track record built over a half century.
Marltons
A household name in South Africa, Marltons takes the name of the founder and is a
complementary recent addition to Phyto-Vet. In a quarter century it has come to
almost own the category in chain stores with some 4000 stock keeping units.
Dogs, birds, aquatic, cats and small animals are the largest contributor to sales in
descending order. Tetra is an exclusive agency.
Six key categories are catered for, from gold fish through to reptiles, with everything
from feed, to toys, to treats and remedies. Distribution is through most chain stores
such as Spar and Pick n Pay and through veterinary clinics and pet stores.
Local production is supplemented by imports. Registration is required in certain
instances with the Department of Agriculture. Strong relationships have been
Department of Agriculture registration Molecular ingredients are typically licensed for use in South Africa by chemical company principals Distribution outlets Leading market position Avima is a scientific business with substantial sales outside of South Africa Strong relationships since 1961 Owning the category in pet care, household name National distribution

Ascendis Health Investment Report
November 2013 a product of Ingham Analytics 35
established internationally enabling the company to keep ranges fresh. The upmarket
Fish4Dogs range was recently introduced and further range extension is quite
feasible under new ownership
Whilst the possibility of greater chain store direct sales that bypass Marltons has
always been a threat the business has continued to prosper and satisfy both stockist
and customer requirements.
Ends
Extending reach and range Satisfying stockists and customers for a quarter
century
