as-salaa mua laikum. sabah al khair. your excellencies
TRANSCRIPT

As-salaa mua laikum. Sabah Al Khair.
Your Excellencies, Distinguished Guests, Ladies and Gentlemen, I bid you greetings and a warm welcome to this 6th annual GPCA event. Ms. Nadine Hani, thank-you for that nice introduction. I am delighted to be here in Dubai.
Today, it is my pleasure to talk about the shale gas phenomenon in North America and how shale gas could significantly change global energy markets and our industry in the coming decades.
1

Let me start by telling you a little about my company.y g y y p y
Chevron Phillips Chemical is a 50/50 joint venture between Chevron and Conoco Phillips. We are one of the world’s top producers of olefins and polyolefins and a leading supplier of aromatics, alpha olefins, styrenics, and specialty chemicals. We are the 2nd largest producer of HDPE, 2nd largest producer of alpha olefins and 9th largest producer of ethylene in the worldproducer of alpha olefins, and 9 largest producer of ethylene in the world.
We own over $8 billion in assets generating more than $14 billion of revenue over the last 12 months. We market over 10 million tons of chemicals and polymers to more than 3,000 customers in more than 100 countries around the world. To serve these customers, we employ approximately 4,700 people
t 40 f t i h l d di t ib ti f iliti l t d i 23at 40 manufacturing, research, sales, and distribution facilities located in 23 countries around the world.
2
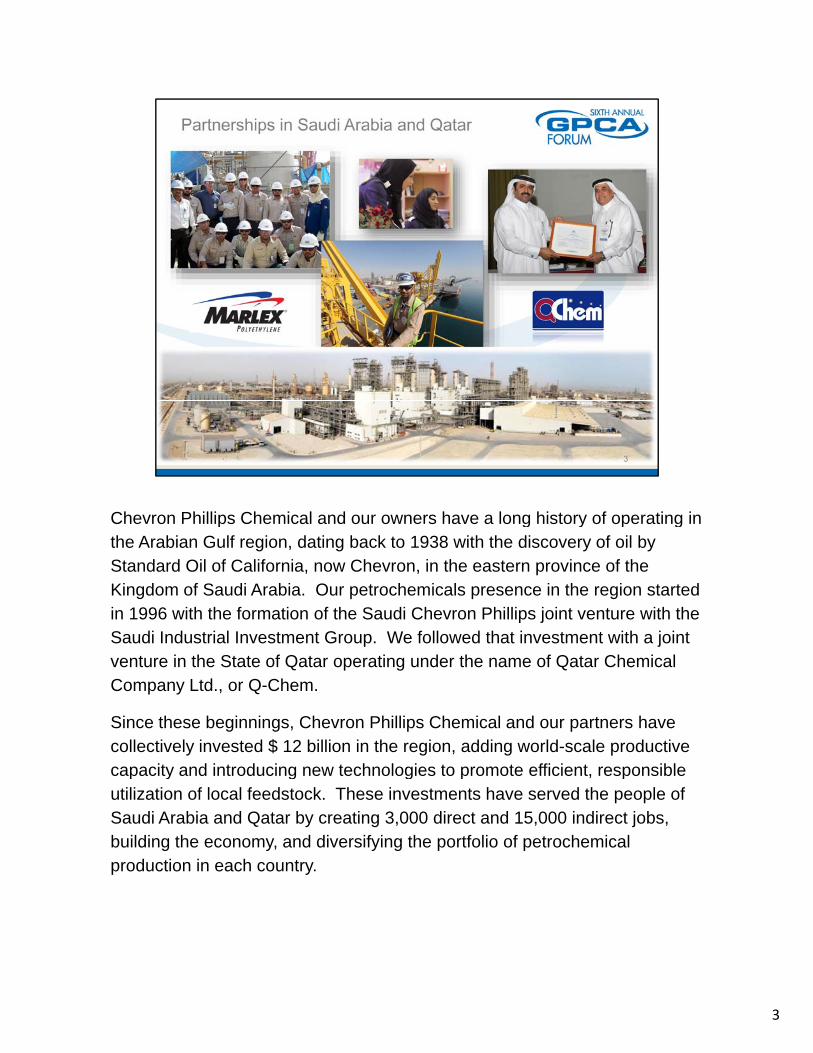
Chevron Phillips Chemical and our owners have a long history of operating in p g y p gthe Arabian Gulf region, dating back to 1938 with the discovery of oil by Standard Oil of California, now Chevron, in the eastern province of the Kingdom of Saudi Arabia. Our petrochemicals presence in the region started in 1996 with the formation of the Saudi Chevron Phillips joint venture with the Saudi Industrial Investment Group. We followed that investment with a joint venture in the State of Qatar operating under the name of Qatar Chemical Company Ltd., or Q-Chem.
Since these beginnings, Chevron Phillips Chemical and our partners have collectively invested $ 12 billion in the region, adding world-scale productive capacity and introducing new technologies to promote efficient, responsible p y g g p , putilization of local feedstock. These investments have served the people of Saudi Arabia and Qatar by creating 3,000 direct and 15,000 indirect jobs, building the economy, and diversifying the portfolio of petrochemical production in each country.
3

We are proud of the technical and commercial successes of our joint p jventures in Saudi Arabia and Qatar, and we deeply value the relationships with our partners and host governments. We are especially proud of the demonstrated and sustained environmental, health, and safety performance of these facilities. Each operation continually ranks among the best in its respective country and within the Chevron Phillips Chemical portfolio. I believe it is equally important to note that these units are largely operated and maintained by Saudi and Qatari national employees. They are the foundation of this demonstrated world class performance.
4

As you all know, Chevron Phillips Chemical was not the only company in our y , p y p yindustry pursuing projects in the Arabian Gulf region over the past decade. In fact, about one-half of the ethylene capacity added in the world between 2005 and 2010 was in this region. The investment pattern for this basic building block of chemistry has been driven by either the competitive feedstock opportunities offered here or the primary locus of demand growth in China and the rest of Asia.
With feedstock typically comprising more than 80% of the cash cost to produce ethylene, we certainly expect access to competitive feedstocks to remain a key driver behind investment selection. Likewise, proximity to demand growth offers advantages to producers and will continue to affect g g psiting decisions.
The question we ask is, “Where will the cracker complexes required to meet global demand in 2020 and beyond be built and what feedstocks will they crack?”
The answer could look different from this picture and include options that weren’t even part of the conversation as recently as two years ago.
5

North America is emerging as part of the answer, and the driver is the subject g g p , jof my talk today – Shale Gas: A New Feedstock Reality. Actually, the shale gas deposits shown on this map are not a “new reality”. The existence of extensive hydrocarbons held in shale formations has been well known for decades. Shale formations rich in hydrocarbons literally blanket much of North America. The challenge to the Upstream industry has always been how to economically recover these resources.
Well, recent developments in drilling and completion techniques and a surge in drilling activity have combined to turn names like Marcellus, Barnett, and Utica from obscure shale formation names to household words in the United States.
6

Now, I don’t know if shale gas will be the ‘game changer’ that some say, but I , g g g y,do know that the game of extracting hydrocarbons from shale was changed by the combination of two very well-established drilling and completion technologies horizontal drilling and hydraulic fracturing or “fracking”. Down-hole fracking was first attempted in the 1800’s using gunpowder, and hydraulic fracturing was first pioneered in the late 1940’s. Hydraulic fracking has been used on over 1 million producing wells.
The game change started a little over a decade ago, when Mitchell Energy, which is now part of Devon Energy, began combining the advances in horizontal drilling with fracking in the Barnett shale formation around Dallas, Texas, with great success., g
7

Even though each well is a bit different, the diagram on the right highlights g , g g g gthe basic process pioneered by Mitchell Energy. It starts with state-of-the-art horizontal drilling techniques that protect the groundwater and provide access to the maximum amount of the shale formation. After the well is drilled, charges are used to selectively perforate the well casing in the horizontal section. Then, a combination of about 99% water-and-sand and 1% chemical additives is pumped into the well at high pressure to fracture the shale formation and provide miniature pathways for the hydrocarbons trapped in the shale to flow to the well and be recovered.
The wells are typically 1.5 - 3 kilometers deep and the lateral projections can approach 4 kilometers. Eight or more wells can be drilled in different pp gdirections from the same drilling pad, as shown in the diagram on the left, enabling entire fields to be fully developed with minimum surface disturbance.
8

This chart demonstrates the shale gas horizontal drilling revolution seen in g gNorth America. Ten years ago, only a handful of active drilling rigs were attempting horizontal wells. As the upstream industry climbed the learning curve and captured new leases to explore for hydrocarbon in these shale formations, the horizontal rig count steadily climbed to represent more than 50% of active rigs in North America. Note that the active rig count in North America bottomed out at about 900 in May 2009 during the deep 2008-2009 recession and climbed by over 1,100 rigs to about 2,000 today. I will come back to this point later. And, as I will explain next, the number of active drilling rigs is only part of the story.
9

Learning curve improvements in horizontal drilling and fracking have led to a g p g gsignificant expansion of the supply of natural gas in North America. Shown here is one example of rapid productivity improvements from Southwestern Energy, a major player in the Fayetteville shale region of Arkansas. In about four years, Southwestern Energy has reduced the time it takes to drill a producing well in this shale formation from 17 to 8 days, which means Southwestern now drills more than 100%, or two times, as many wells each year with every active rig as it did in 2007. In addition, improvements in fracking techniques and extension of the length of each well’s horizontal producing section from the vertical well-bore have increased the initial daily production of the average well by 138 percent. The net result is that each active rig now adds over 400 percent more gas supply per year than it did inactive rig now adds over 400 percent more gas supply per year than it did in 2007.
How many of us in this room could claim a productivity increase of five times over the last four years from any asset that we own?
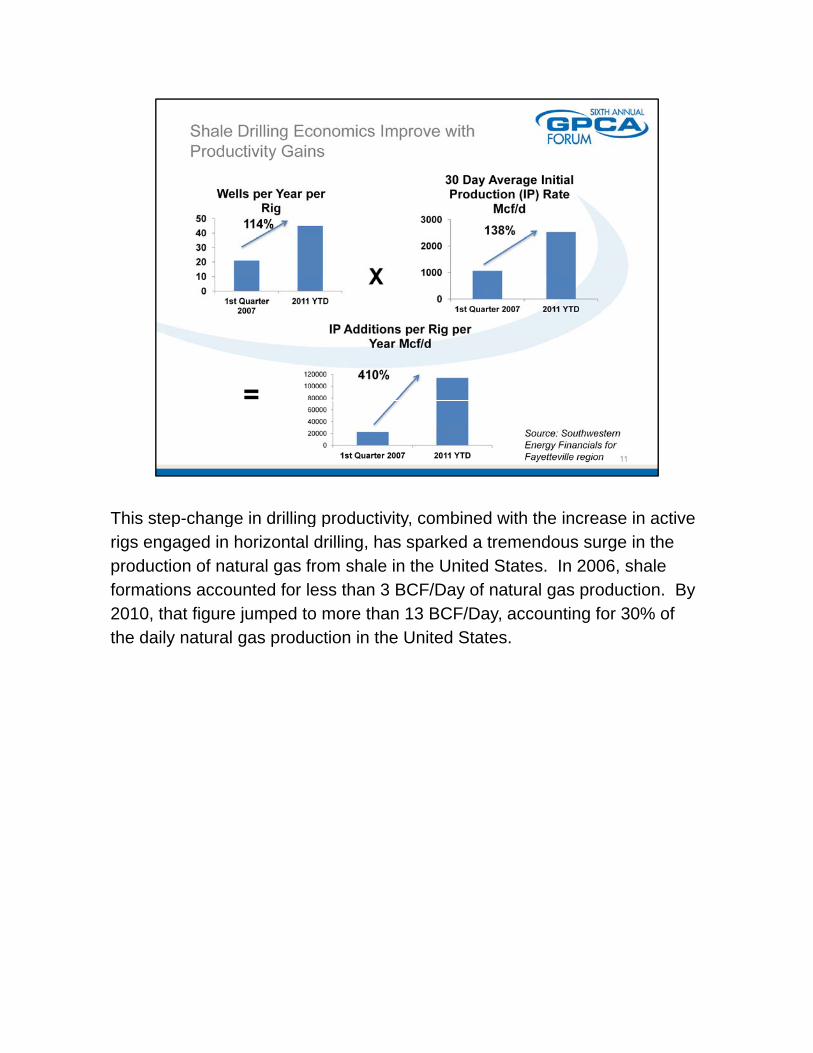
This step-change in drilling productivity, combined with the increase in active p g g p y,rigs engaged in horizontal drilling, has sparked a tremendous surge in the production of natural gas from shale in the United States. In 2006, shale formations accounted for less than 3 BCF/Day of natural gas production. By 2010, that figure jumped to more than 13 BCF/Day, accounting for 30% of the daily natural gas production in the United States.
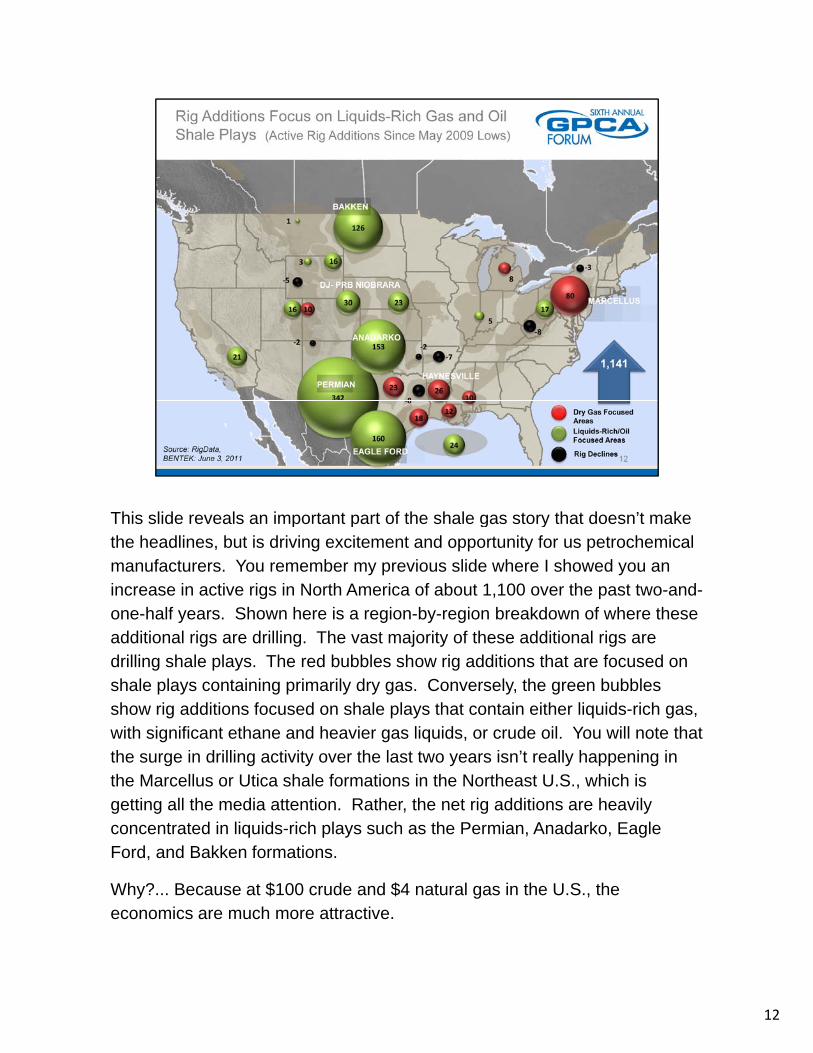
This slide reveals an important part of the shale gas story that doesn’t make p p g ythe headlines, but is driving excitement and opportunity for us petrochemical manufacturers. You remember my previous slide where I showed you an increase in active rigs in North America of about 1,100 over the past two-and-one-half years. Shown here is a region-by-region breakdown of where these additional rigs are drilling. The vast majority of these additional rigs are drilling shale plays. The red bubbles show rig additions that are focused on shale plays containing primarily dry gas. Conversely, the green bubbles show rig additions focused on shale plays that contain either liquids-rich gas, with significant ethane and heavier gas liquids, or crude oil. You will note that the surge in drilling activity over the last two years isn’t really happening in the Marcellus or Utica shale formations in the Northeast U S which isthe Marcellus or Utica shale formations in the Northeast U.S., which is getting all the media attention. Rather, the net rig additions are heavily concentrated in liquids-rich plays such as the Permian, Anadarko, Eagle Ford, and Bakken formations.
Why?... Because at $100 crude and $4 natural gas in the U.S., the economics are much more attractive.
12

As the climb in shale gas production outpaces demand growth, it has driven g p p g ,down the price of natural gas in the United States. Any economist would tell you that this lower price should either stimulate demand or reduce supply or both, at least in the long-term. By shifting their attention to wet gas and crude plays, drillers are fulfilling the economist’s prediction. However, as explained on the next slide, there are few perfect solutions in life and even liquids-rich plays produce large amounts of natural gas.
13

This chart helps show why drillers are concentrating in the formations I just p y g jmentioned, and requires some explanation. As in the previous slide, the green bubbles represent wet gas and oil shale plays and red bubbles indicate dry gas plays. The figures in each bubble represent the price needed for each MMBTU of natural gas produced from an average well in the area to return cost of capital to the driller. For our purposes here, we assume a 10% cost of capital. As you can see, the gas price needed to generate a 10% rate of return on the cost to drill a well in a dry gas play ranges from $2 to $5 per MMBTU, with most in the range of $3-4 per MMBTU. Conversely, in the wet gas and oil-focused plays, the 10% return price needed for the natural gas production is actually zero because the driller earns its entire return on the liquids production which tends to bedriller earns its entire return on the liquids production, which tends to be priced off crude oil. The U.S. is expected to produce over 3 MMBbls/Day of light crude oil from these shale formations by 2016. These oil formations also produce gas that tends to be rich in ethane.
14

The net result of all this upstream activity and the associated investment p yneeded in gas processing and pipeline infrastructure is that US ethane supplies are forecast to double by 2016 from the supply levels prevailing prior to the shale boom. The US ethylene industry has already reacted to these supply signals and price expectations by restarting idled units, converting heavy cracking capacity to ethane, and announcing significant expansions by either debottlenecks or new world-scale crackers.
15

Most of you in the audience will recognize this chart showing the y g gcapacity/cost curve for ethylene globally. The red line shows the picture of various regions and feeds around the world in 2005, prior to the shale gas phenomenon in the United States. You will find U.S. ethane on the far right edge of the red cost curve. That’s right, in 2005, if you were cracking ethane in the United States, you were producing the highest cost ethylene on the planet. The blue line shows that same capacity/cost curve in 2011, year-to-date through September. You will find U.S. ethane at basically the same cost point as six years earlier, while much of the rest of the world and their heavier feeds, became significantly higher cost. The large spread between crude oil and U. S. gas prices has resulted in a new competitiveness for U.S. production in global markets And as the United States ethane supplyproduction in global markets. And, as the United States ethane supply continues to grow, ethane cracking in the U.S. has the potential to maintain or even grow this relative advantage.
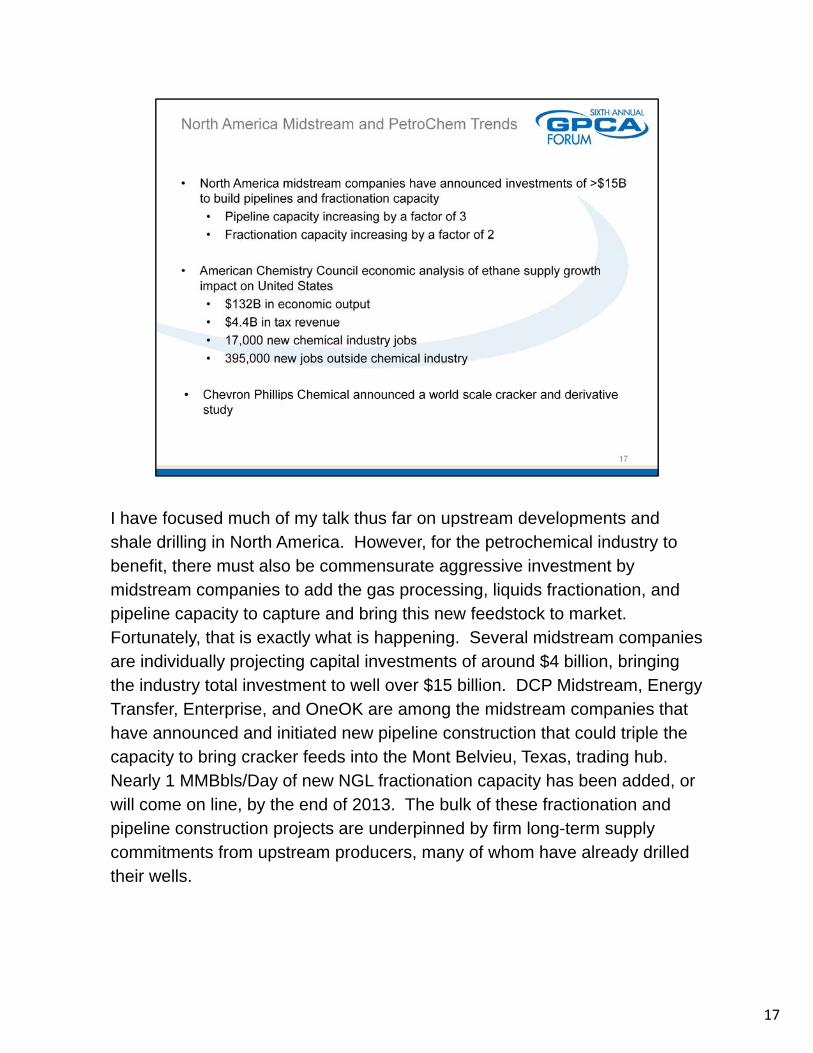
I have focused much of my talk thus far on upstream developments and y p pshale drilling in North America. However, for the petrochemical industry to benefit, there must also be commensurate aggressive investment by midstream companies to add the gas processing, liquids fractionation, and pipeline capacity to capture and bring this new feedstock to market. Fortunately, that is exactly what is happening. Several midstream companies are individually projecting capital investments of around $4 billion, bringing the industry total investment to well over $15 billion. DCP Midstream, Energy Transfer, Enterprise, and OneOK are among the midstream companies that have announced and initiated new pipeline construction that could triple the capacity to bring cracker feeds into the Mont Belvieu, Texas, trading hub. Nearly 1 MMBbls/Day of new NGL fractionation capacity has been added orNearly 1 MMBbls/Day of new NGL fractionation capacity has been added, or will come on line, by the end of 2013. The bulk of these fractionation and pipeline construction projects are underpinned by firm long-term supply commitments from upstream producers, many of whom have already drilled their wells.
17

To give you a sense of the significant potential of shale gas resources in the g y g p g
United States, the American Chemistry Council, a national association of
chemical industry participants, recently completed a study of the impact that
a 25% increase in ethane supply could have on the U.S. economy.
According to the ACC, a 25% increase in ethane supply could generate over
$130 billion in additional economic activity contribute an incremental $4$130 billion in additional economic activity, contribute an incremental $4
billion in revenue to government coffers, add as many as 17,000 new
chemical industry jobs, and add an additional 395,000 jobs outside of the
industry.
18
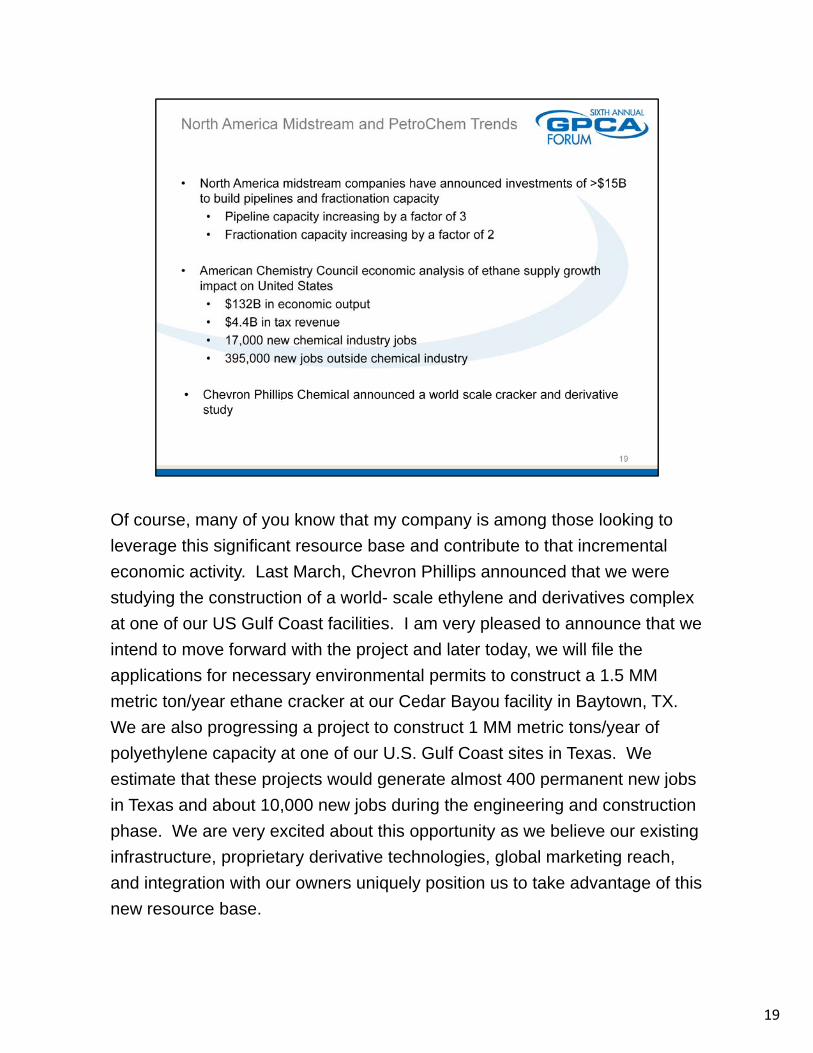
Of course, many of you know that my company is among those looking to , y y y p y g g
leverage this significant resource base and contribute to that incremental
economic activity. Last March, Chevron Phillips announced that we were
studying the construction of a world- scale ethylene and derivatives complex
at one of our US Gulf Coast facilities. I am very pleased to announce that we
intend to move forward with the project and later today we will file theintend to move forward with the project and later today, we will file the
applications for necessary environmental permits to construct a 1.5 MM
metric ton/year ethane cracker at our Cedar Bayou facility in Baytown, TX.
We are also progressing a project to construct 1 MM metric tons/year of
polyethylene capacity at one of our U.S. Gulf Coast sites in Texas. We
estimate that these projects would generate almost 400 permanent new jobsestimate that these projects would generate almost 400 permanent new jobs
in Texas and about 10,000 new jobs during the engineering and construction
phase. We are very excited about this opportunity as we believe our existing
infrastructure, proprietary derivative technologies, global marketing reach,
and integration with our owners uniquely position us to take advantage of this
bnew resource base.
19

I have focused this morning on North America shale gas, but North America g g ,
alone cannot come close to meeting the longer term world-wide demand for
ethylene and ethylene derivatives. The good news is that it doesn’t have to.
There are well-documented shale plays in numerous locations across the
globe. I understand drilling has already begun in countries such as Poland
and China As big as the shale gas phenomenon is in the United States theand China. As big as the shale gas phenomenon is in the United States, the
U.S. is estimated to hold only about 10% of the global reserve potential.
While the United States has a considerable head start, we should expect that
these global shale plays will be part of the answer to where future ethylene
complexes will be built and what feedstocks they will be designed to crack.
20
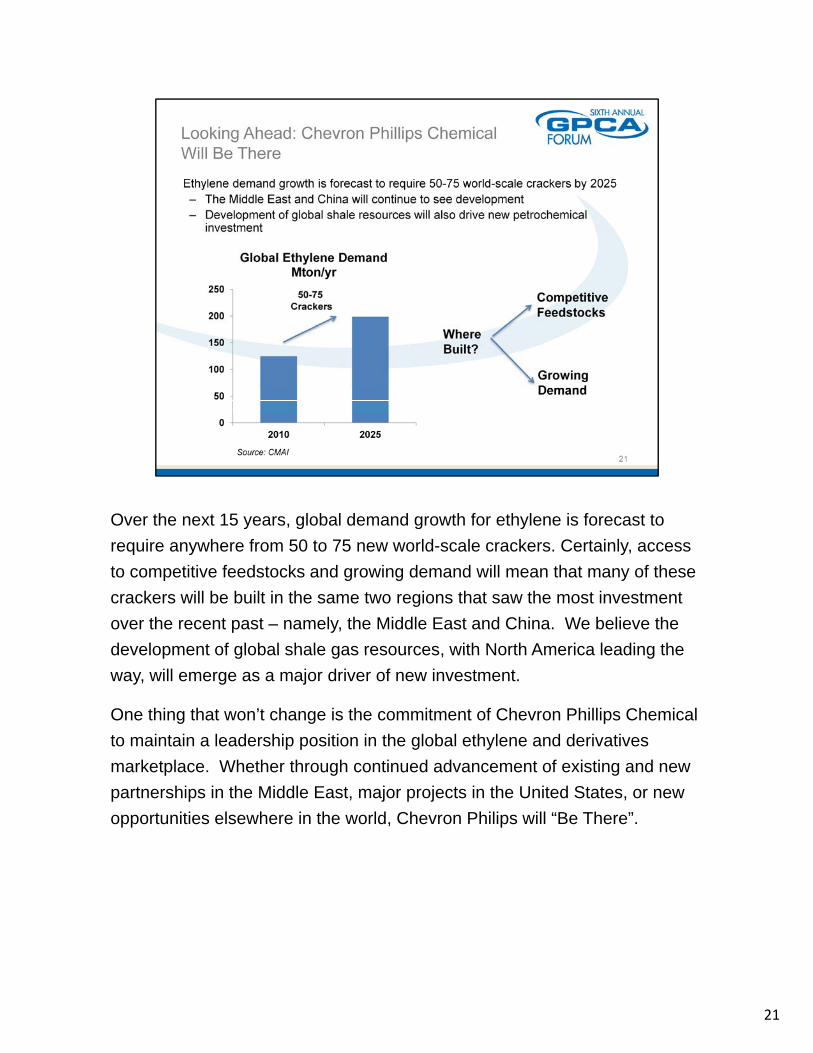
Over the next 15 years, global demand growth for ethylene is forecast to y , g g y
require anywhere from 50 to 75 new world-scale crackers. Certainly, access
to competitive feedstocks and growing demand will mean that many of these
crackers will be built in the same two regions that saw the most investment
over the recent past – namely, the Middle East and China. We believe the
development of global shale gas resources with North America leading thedevelopment of global shale gas resources, with North America leading the
way, will emerge as a major driver of new investment.
One thing that won’t change is the commitment of Chevron Phillips Chemical
to maintain a leadership position in the global ethylene and derivatives
marketplace. Whether through continued advancement of existing and new
partnerships in the Middle East, major projects in the United States, or new
opportunities elsewhere in the world, Chevron Philips will “Be There”.
21

Shukran.
Thank you for your attention and interest.
22