aruba networks, inc. 2013 annual report
TRANSCRIPT

Aruba Networks, Inc. 2013 Annual Report


Dear Stockholders, Fiscal year 2013 was another year of growth for Aruba Networks. We achieved $600 million in revenue, representing 16 percent growth over the prior year. We delivered non-GAAP gross margin of 72.8 percent, non-GAAP operating margin of 18.6 percent and non-GAAP net income of $79 million. In addition, we generated $153 million in cash from operations and used $86 million of these proceeds to repurchase our common stock in the open market. Like many other technology companies, we faced a mixed macroeconomic spending environment, but our innovative Mobile Virtual Enterprise, or MOVE, architecture continues to differentiate us in the market allowing us to drive continued top-line growth. In fiscal 2013, we continued investing in our industry leading mobility architecture by launching our 802.11ac Wireless LAN platform, the first in the industry to deliver gigabit Wi-Fi combined with the device density and layer 4-7 application intelligence required by today’s Wi-Fi networks. We enhanced our position in the public-facing enterprise (PFE) market, which includes industries such as retail, hospitality and large public venues, with our acquisition of Meridian Apps. This move allows us to fuse the layer 4-7 intelligence of our MOVE architecture with new mobile applications that allow businesses to engage their customers in new and compelling ways. Altogether, fiscal 2013 was about strategically expanding our portfolio to address key markets for enterprise mobility. As we exit the fiscal year, we believe we are well positioned to continue to capture market share, solve our customers’ pain points and reaccelerate our growth. IT organizations around the globe are suffering from multiple headaches brought about by the increasingly wireless world and the proliferation of devices needing access to their networks. We have diagnosed those headaches and created a series of solutions that we believe will relieve IT’s pain points and drive our continued growth in fiscal 2014 and beyond. Some of these pain points include the difficulty faced by IT departments in securely on-boarding and managing the vast array of devices that employees, contractors, students and guests bring to their networks. Compounding these challenges is the rapid proliferation of applications and video in the work environment, which is increasing the need for scale and density in wireless networking. IT departments cannot simply block these devices or deliver only restricted network access. The good news for these IT organizations is that Aruba’s MOVE architecture provides relief for their most pressing needs allowing more flexible network infrastructure, secure access management and mobility applications by delivering innovation, differentiation and a go-to-market and customer service experience defined by best-in-class wireless and mobility technical expertise. In fiscal 2013, we launched the Aruba 220 Series Access Points (APs), which when combined with Aruba’s new ClientMatch technology address the critical needs of enterprises creating next-generation network environments. While it is still early, we are already seeing excellent traction with 802.11ac across numerous industries, with particular strength in higher education, K-12 schools and high technology enterprises. For the first time in history, wireless access networks can be faster than wired networks, and true to our legacy, Aruba is delivering the industry-leading technology. Mobile devices running unified communication applications, such as Microsoft Lync, also create an excellent opportunity to right size networks. We are seeing increasing market demand to eliminate wired VoIP phones and switch ports, but only when there is true confidence that voice and video over Wi-Fi will be dependable.
Our WLANs, featuring AppRF technology, automatically classify individual Lync media like videoconferencing, voice, desktop sharing and IM.
Chairm
an’sL
etter

With thisLync sesis a depe
We contiClearPasmanage ndistributeworks inadoptionsatisfacti
We are alarge pubenvironmrather cuenhancedbehaviorlocation-believe thincrease Every yesolve theus confidgrow ourthe massemerging In summnever feloffer myoutstandi2014.
SincerelyDominicPresiden
s intelligencessions. No comendable user e
inue to be pless Access Mannetwork police and manage
n multi-vendorn across indusion and securi
also seeing anblic venues arments are uniqustomers. Thed in-store user to enhance v-aware Wi-Fi his interest cacustomer eng
ear we continueir current anddence in contir sales force aive proliferatg demands fo
mary, strong dylt better about
y sincere appreing support d
y, c P. Orr nt and Chief E
, our customemplex networexperience spa
eased with thenagement Sycies, securely e mobile workr network envtries, as businity challenges
n exciting newre all looking que as the vase wireless netr experience
visitor engagenetworks. W
an only grow gagement.
ue to out-innod future pain pinuing to inveand partner bation of devicer PFE solutio
ynamics are ct the team weeciation to ou
during the past
Executive Offi
ers can then prk engineeringanning campu
e market demstem. From oonboard and
k applicationsvironments, unesses and orgs presented by
w use case forfor innovativ
st majority of twork can becand additiona
ement. Our MWe have seen v
as business lo
ovate the compoints. Our pest and expanase so that wes and applica
ons.
changing our have here at
ur stockholdert year. We loo
icer
prioritize or deg or virtual Lus headquarte
and and compone integratedmanage devi
s. A critical cunlike competganizations oy the BYOD
r wireless netwve ways to intf users that necome a criticaally can help t
Meridian platfovery encouragook for ways
mpetition and product portfo
nd our go to me can capture ations, BYOD
markets and oAruba to exe
rs, directors, aok forward to
e-prioritize trLAN configuraers, branch of
petitive leaded platform, Cices, admit gucompetitive atitive solution
of all sizes gratrend.
works. Verticteract with theeed to be connal tool that buto capture andorm helps entging early demto monetize t
deliver the prolio has never
market strategythe growing m
D, the transitio
opening new ecute our stratadvisors, parto updating yo
raffic flows, eations are reqffices and offs
ership we enjolearPass enabuest users, andadvantage of Cns. We are seapple with the
cals like retaieir customer bnected are notusinesses can d analyze vitaterprises delivmand for our the access ne
roducts our cur been strongy. In fiscal 2market opporon to 802.11a
opportunitiestegy and visiotners and cust
ou on our prog
even for encryquired. The refsite teleworke
oy with our bles customerd even secureClearPass is theeing strong e customer
il, hospitality,base. These Pt employees, buse for an al customer ver indoor GPPFE solutiontwork and
ustomers needer and this giv014, we plan rtunity drivenac and the
s for Aruba. Ion. I’d also liktomers for thegress in fiscal
ypted esult ers.
rs to e, hat it
, and PFE but
PS on ns and
d to ves to
n by
I have ke to eir l

2013 2012
GAAP net loss (31,608)$ (8,851)$
Plus: a) Stock-based compensation expenses 96,226 83,912 b) Payroll taxes on stock-based compensation expenses 2,596 2,653 c) Amortization expense of acquired intangible assets and other acquisition-related expenses 10,843 9,955 d) Legal settlement 14,000 - e) Change in valuation of contingent rights liability (1,665) (2,319) f) Non-GAAP income tax effects (11,172) (7,816)
Non-GAAP net income 79,220$ 77,534$
GAAP net loss per common share (0.28)$ (0.08)$
Plus: a) Stock-based compensation expenses 0.79 0.70 b) Payroll taxes on stock-based compensation expenses 0.02 0.02 c) Amortization expense of acquired intangible assets and other acquisition-related expenses 0.10 0.08 d) Legal settlement 0.11 - e) Change in valuation of contingent rights liability (0.01) (0.02) f) Non-GAAP income tax effects (0.09) (0.06)
Non-GAAP net income per common share 0.64$ 0.64$
Shares used in computing diluted GAAP net loss per common share 113,284 108,774
Shares used in computing diluted non-GAAP net income per common share 124,102 120,762
July 31
Aruba Networks, Inc.Condensed Consolidated Statements of Operations
(GAAP to Non-GAAP Reconciliation)(In thousands, except per share amounts)
(Unaudited)
Years ended
Chairm
an’sL
etter

[THIS PAGE INTENTIONALLY LEFT BLANK]

Aruba Networks, Inc.2013 Proxy Statement
Proxy
Statement

[THIS PAGE INTENTIONALLY LEFT BLANK]

ARUBA NETWORKS, INC.
NOTICE OF ANNUAL MEETING OF STOCKHOLDERSTo Be Held December 5, 2013
Dear Stockholder:
You are cordially invited to attend the Annual Meeting of Stockholders of Aruba Networks, Inc. (the “Company”) that will be held on Thursday, December 5, 2013 at 12:30 p.m., Pacific Time, at the Company’s principal executive offices, located at 1344 Crossman Avenue, Sunnyvale, California 94089, for the following purposes:
1. To elect eight directors listed in the accompanying proxy statement and recommended by the Company’s Board of Directors to hold office until the next annual meeting of stockholders or until their respective successors have been duly elected and qualified.
2. To ratify the appointment of PricewaterhouseCoopers LLP as the Company’s independent registered public accounting firm for the fiscal year ending July 31, 2014.
3. To conduct a non-binding, advisory vote to approve the compensation of our named executive officers.
4. To transact such other business as may properly come before the annual meeting or any adjournment or postponement of the annual meeting.
These items of business are more fully described in the Proxy Statement accompanying this Notice of Annual Meeting of Stockholders. Only stockholders of record at the close of business on October 15, 2013 may vote at the annual meeting and any postponements or adjournments of the annual meeting.
This year we have again elected to provide access to our proxy materials over the Internet. Accordingly, unless you have previously requested to receive our proxy materials in paper form or by email, you will receive a Notice of Internet Availability of Proxy Materials, which we expect to send to stockholders on or about October 25, 2013.
All stockholders are cordially invited to attend the annual meeting in person. Your vote is very important. Even if you plan to attend the annual meeting, please vote, as instructed in the Notice of Internet Availability of Proxy Materials, via the Internet or by telephone as promptly as possible to ensure that your vote is recorded. Alternatively, you may follow the procedures outlined in the Notice of Internet Availability of Proxy Materials to request a paper proxy card to submit your vote by mail. Any stockholder attending the annual meeting may vote in person even if he or she previously voted by another method. If you wish to attend the meeting to vote in person and need directions, please contact Aruba Networks at 408-227-4500.
Thank you for your ongoing support of Aruba Networks.
By Order of the Board of Directors,
Dominic P. OrrPresident, Chief Executive Officer andChairman of the Board of Directors
Sunnyvale, CaliforniaOctober 25, 2013
Proxy
Statement

[THIS PAGE INTENTIONALLY LEFT BLANK]

i
TABLE OF CONTENTSPage:
QUESTIONS AND ANSWERS ABOUT THE PROXY MATERIALS. . . . . . . . . . . . . . . . . . . . . . . . . . 1QUESTIONS AND ANSWERS ABOUT THE ANNUAL MEETING . . . . . . . . . . . . . . . . . . . . . . . . . . 3QUESTIONS AND ANSWERS ABOUT VOTING AND PROXY SOLICITATIONS. . . . . . . . . . . . . . 4QUESTIONS AND ANSWERS ABOUT STOCKHOLDER PROPOSALS, DIRECTOR
NOMINATIONS BY STOCKHOLDERS AND RELATED BYLAW PROVISIONS. . . . . . . . . . . 9IMPORTANT NOTICE REGARDING THE AVAILABILITY OF PROXY MATERIALS FOR THE
STOCKHOLDER MEETING TO BE HELD ON DECEMBER 5, 2013 . . . . . . . . . . . . . . . . . . . . . 11PROPOSAL ONE – ELECTION OF DIRECTORS. . . . . . . . . . . . . . . . . . . . . . . . . . . . . . . . . . . . . . . . . 12
Background . . . . . . . . . . . . . . . . . . . . . . . . . . . . . . . . . . . . . . . . . . . . . . . . . . . . . . . . . . . . . . . . . . . 12Information Regarding the Nominees for Election at the 2013 Annual Meeting. . . . . . . . . . . . . . 12Vote Required and Recommendation . . . . . . . . . . . . . . . . . . . . . . . . . . . . . . . . . . . . . . . . . . . . . . . 17
PROPOSAL TWO – RATIFICATION OF THE APPOINTMENT OF INDEPENDENTREGISTERED PUBLIC ACCOUNTING FIRM . . . . . . . . . . . . . . . . . . . . . . . . . . . . . . . . . . . . . . . . 18
Audit Committee Recommendation . . . . . . . . . . . . . . . . . . . . . . . . . . . . . . . . . . . . . . . . . . . . . . . . 18Attendance at the Annual Meeting . . . . . . . . . . . . . . . . . . . . . . . . . . . . . . . . . . . . . . . . . . . . . . . . . 18Fees . . . . . . . . . . . . . . . . . . . . . . . . . . . . . . . . . . . . . . . . . . . . . . . . . . . . . . . . . . . . . . . . . . . . . . . . . 18Independence Assessment by Audit Committee. . . . . . . . . . . . . . . . . . . . . . . . . . . . . . . . . . . . . . . 18Pre-Approval of Audit and Non-Audit Services. . . . . . . . . . . . . . . . . . . . . . . . . . . . . . . . . . . . . . . 19Vote Required and Recommendation . . . . . . . . . . . . . . . . . . . . . . . . . . . . . . . . . . . . . . . . . . . . . . . 19
PROPOSAL THREE – NON-BINDING, ADVISORY VOTE TO APPROVE EXECUTIVECOMPENSATION . . . . . . . . . . . . . . . . . . . . . . . . . . . . . . . . . . . . . . . . . . . . . . . . . . . . . . . . . . . . . . . 20
Background . . . . . . . . . . . . . . . . . . . . . . . . . . . . . . . . . . . . . . . . . . . . . . . . . . . . . . . . . . . . . . . . . . . 20Nature of Vote. . . . . . . . . . . . . . . . . . . . . . . . . . . . . . . . . . . . . . . . . . . . . . . . . . . . . . . . . . . . . . . . . 20Vote Required and Recommendation . . . . . . . . . . . . . . . . . . . . . . . . . . . . . . . . . . . . . . . . . . . . . . . 21
OUR CORPORATE GOVERNANCE PRACTICES . . . . . . . . . . . . . . . . . . . . . . . . . . . . . . . . . . . . . . . . 22Corporate Governance Principles . . . . . . . . . . . . . . . . . . . . . . . . . . . . . . . . . . . . . . . . . . . . . . . . . . 22Code of Business Conduct . . . . . . . . . . . . . . . . . . . . . . . . . . . . . . . . . . . . . . . . . . . . . . . . . . . . . . . 23
OUR BOARD OF DIRECTORS AND COMMITTEES . . . . . . . . . . . . . . . . . . . . . . . . . . . . . . . . . . . . . 23Our Board of Directors . . . . . . . . . . . . . . . . . . . . . . . . . . . . . . . . . . . . . . . . . . . . . . . . . . . . . . . . . . 23Attendance at Annual Stockholder Meetings by the Board of Directors . . . . . . . . . . . . . . . . . . . . 24Independence of the Board of Directors . . . . . . . . . . . . . . . . . . . . . . . . . . . . . . . . . . . . . . . . . . . . . 24Board Leadership Structure . . . . . . . . . . . . . . . . . . . . . . . . . . . . . . . . . . . . . . . . . . . . . . . . . . . . . . 24Our Board of Directors' Role in Oversight of Risk. . . . . . . . . . . . . . . . . . . . . . . . . . . . . . . . . . . . . 24Committees of Our Board of Directors. . . . . . . . . . . . . . . . . . . . . . . . . . . . . . . . . . . . . . . . . . . . . . 25Compensation Committee Interlocks and Insider Participation . . . . . . . . . . . . . . . . . . . . . . . . . . . 29Process for Recommending Candidates for Election to the Board of Directors. . . . . . . . . . . . . . . 29Contacting the Board of Directors . . . . . . . . . . . . . . . . . . . . . . . . . . . . . . . . . . . . . . . . . . . . . . . . . 30
EXECUTIVE OFFICERS . . . . . . . . . . . . . . . . . . . . . . . . . . . . . . . . . . . . . . . . . . . . . . . . . . . . . . . . . . . . . 30EXECUTIVE COMPENSATION. . . . . . . . . . . . . . . . . . . . . . . . . . . . . . . . . . . . . . . . . . . . . . . . . . . . . . . 31
Compensation Discussion and Analysis . . . . . . . . . . . . . . . . . . . . . . . . . . . . . . . . . . . . . . . . . . . . . 31Aruba's Executive Compensation Program at a Glance . . . . . . . . . . . . . . . . . . . . . . . . . . . 31Compensation Philosophy and Objectives. . . . . . . . . . . . . . . . . . . . . . . . . . . . . . . . . . . . . . 33Changes in Compensation Structure . . . . . . . . . . . . . . . . . . . . . . . . . . . . . . . . . . . . . . . . . . 39Executive Compensation Structure . . . . . . . . . . . . . . . . . . . . . . . . . . . . . . . . . . . . . . . . . . . 40
Compensation and Risk Assessment. . . . . . . . . . . . . . . . . . . . . . . . . . . . . . . . . . . . . . . . . . . . . . . . 48Compensation Committee Report. . . . . . . . . . . . . . . . . . . . . . . . . . . . . . . . . . . . . . . . . . . . . . . . . . 48
Proxy
Statement

ii
Fiscal 2013 Summary Compensation Table . . . . . . . . . . . . . . . . . . . . . . . . . . . . . . . . . . . . . . . . . . 49Grants of Plan-Based Awards in Fiscal 2013 Table . . . . . . . . . . . . . . . . . . . . . . . . . . . . . . . . . . . . 50Outstanding Equity Awards at Fiscal 2013 Year-End Table. . . . . . . . . . . . . . . . . . . . . . . . . . . . . . 51Fiscal 2013 Option Exercises and Stock Vested Table. . . . . . . . . . . . . . . . . . . . . . . . . . . . . . . . . . 52Potential Payments upon Termination or Change of Control . . . . . . . . . . . . . . . . . . . . . . . . . . . . . 52Compensation of Directors . . . . . . . . . . . . . . . . . . . . . . . . . . . . . . . . . . . . . . . . . . . . . . . . . . . . . . . 55Equity Compensation Plan Information . . . . . . . . . . . . . . . . . . . . . . . . . . . . . . . . . . . . . . . . . . . . . 57
SECURITY OWNERSHIP OF CERTAIN BENEFICIAL OWNERS AND MANAGEMENT. . . . . . . . 58CERTAIN RELATIONSHIPS AND RELATED PERSON TRANSACTIONS. . . . . . . . . . . . . . . . . . . . 60SECTION 16(a) BENEFICIAL OWNERSHIP REPORTING COMPLIANCE. . . . . . . . . . . . . . . . . . . . 60AUDIT COMMITTEE REPORT . . . . . . . . . . . . . . . . . . . . . . . . . . . . . . . . . . . . . . . . . . . . . . . . . . . . . . . 61OTHER MATTERS. . . . . . . . . . . . . . . . . . . . . . . . . . . . . . . . . . . . . . . . . . . . . . . . . . . . . . . . . . . . . . . . . . 62

1
ARUBA NETWORKS, INC.1344 Crossman Ave.
Sunnyvale, California 94089
PROXY STATEMENTFOR ANNUAL MEETING OF STOCKHOLDERS
TO BE HELD DECEMBER 5, 2013
These proxy materials are provided in connection with the solicitation of proxies by the Board of Directors of Aruba Networks, Inc., a Delaware corporation (the “Company” or “Aruba”), for the Annual Meeting of Stockholders (the “Annual Meeting”) to be held on Thursday, December 5, 2013 at 12:30 p.m., Pacific Time, at the Company’s principal executive offices, located at 1344 Crossman Avenue, Sunnyvale, California 94089, and at any adjournments or postponements of the Annual Meeting. As used herein, “we,” “us” or “our” refers to the Company. These proxy materials were first sent on or about October 25, 2013 to stockholders entitled to vote at the Annual Meeting.
QUESTIONS AND ANSWERS ABOUT THE PROXY MATERIALS
Q: Why am I receiving these proxy materials?
A: The Board of Directors of the Company (the “Board of Directors”) is providing these proxy materials to you in connection with the solicitation of proxies for use at the Annual Meeting to be held on Thursday, December 5, 2013 at 12:30 p.m., Pacific Time, and at any adjournment or postponement thereof, for the purpose of considering and acting upon the matters described in this proxy statement. As a stockholder, you are invited to attend the Annual Meeting and are requested to vote on the proposals described in this proxy statement.
These proxy solicitation materials, together with our Annual Report for fiscal 2013, were first made available on or about October 25, 2013 to all stockholders entitled to vote at the Annual Meeting. Aruba’s principal executive offices are located at 1344 Crossman Avenue, Sunnyvale, California 94089, and our telephone number is (408) 227-4500.
Q: Why did I receive a notice in the mail regarding the Internet availability of the proxy materials instead of a paper copy of the proxy materials?
A: This year, relying on the SEC rule that allows companies to furnish their proxy materials over the Internet, we are again mailing to our stockholders a notice regarding the Internet availability of the proxy materials (the “Notice of Internet Availability”) instead of a paper copy of the proxy materials.
If you received a Notice of Internet Availability by mail, you will not receive a printed copy of the proxy materials. Instead, the Notice of Internet Availability will instruct you as to how you may access and review the proxy materials and submit your vote via the Internet. If you received a Notice of Internet Availability by mail and would like to receive a printed copy of the proxy materials, please follow the instructions for requesting such materials included in the Notice of Internet Availability.
Unless you have previously requested to receive our proxy materials in paper form or by email, you will receive a Notice of Internet Availability, which we expect to mail on or about October 25, 2013, to all stockholders entitled to vote at the Annual Meeting. On the date of mailing of the Notice of Internet Availability, all stockholders and beneficial owners will have the ability to access all of the Company’s proxy materials on a website referred to in the Notice of Internet Availability. These
Proxy
Statement

2
proxy materials will be available free of charge.
Q: How can I access the proxy materials over the Internet?
A: The Notice of Internet Availability, proxy card or voting instruction card will contain instructions on how to:• access and view our proxy materials for the Annual Meeting on the Internet; and• instruct us to send our future proxy materials to you in paper form or electronically by email.
Our proxy materials are also available on the Investor Relations section of our website at http://ir.arubanetworks.com.
Choosing to access your future proxy materials electronically will help us conserve natural resources and reduce the costs of printing and distributing our proxy materials. If you choose to access future proxy materials electronically, you will receive an email with instructions containing a link to the website where those materials are available and a link to the proxy voting website. Your election to access proxy materials by email will remain in effect until you terminate it.
Q: How may I obtain a paper copy of the proxy materials?
A: Stockholders receiving the Notice of Internet Availability will find instructions in that notice about how to obtain a paper copy of the proxy materials free of charge. Stockholders receiving notice of the availability of the proxy materials by email will find instructions in that email about how to obtain a paper copy of the proxy materials free of charge. Stockholders who have previously submitted a standing request to receive paper copies of our proxy materials will receive a paper copy of the proxy materials by mail.
Q: What should I do if I receive more than one Notice of Internet Availability, voting instruction card or set of proxy materials?
A: If you received more than one Notice of Internet Availability, voting instruction card or set of proxy materials, your shares are registered in more than one name or brokerage account. Please follow the instructions on each Notice of Internet Availability, voting instruction card or proxy card that you receive to ensure that all of your shares are voted.
You may request delivery of a single copy of our future proxy statements and annual reports by writing to the address provided below or calling our Investor Relations department at the telephone number below. Stockholders may also request electronic delivery of future proxy statements by calling our Investor Relations department at (408) 598-4924 or by writing to the Company at 1344 Crossman Avenue, Sunnyvale, California 94089, Attention: Investor Relations.
Q: How may I obtain a separate copy of the Notice of Internet Availability?
A: If you share an address with another stockholder, each stockholder may not receive a separate copy of the Notice of Internet Availability because some brokers and other nominees may be participating in the practice of “householding,” which reduces duplicate mailings and saves printing and postage costs. If your Notice of Internet Availability is being “householded” and you would like to receive separate copies, or if you are receiving multiple copies and would like to receive a single copy, please call our Investor Relations department at (408) 598-4924 or write to the Company at 1344 Crossman Avenue, Sunnyvale, California 94089, Attention: Investor Relations.

3
Q: How may I obtain a copy of Aruba’s Annual Report on Form 10-K?
A: A copy of our Annual Report on Form 10-K for fiscal 2013 is available free of charge on the Internet from the website of the Securities and Exchange Commission (the “SEC”) at http://www.sec.gov, as well as on our website at http://ir.arubanetworks.com. The 2013 Annual Report on Form 10-K is not incorporated into this proxy statement and is not considered proxy soliciting material.
Q: Who will bear the cost of this proxy solicitation and the distribution of the materials?
A: Aruba is making this proxy solicitation, and we will pay the entire cost of preparing, assembling, printing, mailing and distributing these proxy materials and soliciting votes. We may reimburse brokerage firms, custodians, nominees, fiduciaries and other persons representing beneficial owners of Common Stock for their reasonable expenses in forwarding solicitation material to such beneficial owners. Directors, officers and employees of the Company may also solicit proxies in person or by other means of communication. Our directors, officers and employees will not be additionally compensated but may be reimbursed for reasonable out-of-pocket expenses in connection with those solicitations. In addition, we may engage the services of a professional proxy solicitation firm to aid in the solicitation of proxies from certain brokers, bank nominees and other institutional owners. The Company’s costs for such services, if retained, will not be significant.
If you choose to access the proxy materials and/or vote over the Internet, you are responsible for Internet access charges you may incur. If you choose to vote by telephone, you are responsible for telephone charges you may incur.
Q: What is the mailing address for the Company’s principal executive offices?
A: The Company’s principal executive offices are located at 1344 Crossman Avenue, Sunnyvale, California 94089.
Any written requests for additional information, copies of the proxy materials and 2013 Annual Report on Form 10-K, notices of stockholder proposals, recommendations for candidates to the Board of Directors, communications to the Board of Directors or any other communications should be sent to this address.
QUESTIONS AND ANSWERS ABOUT THE ANNUAL MEETING
Q: Where is the Annual Meeting?
A: The Annual Meeting will be held at the Company’s principal executive offices, located at 1344 Crossman Avenue, Sunnyvale, California 94089. Stockholders may request directions to our principal executive offices in order to attend the Annual Meeting by calling (408) 227-4500.
Q: When is the Annual Meeting?
A: The Annual Meeting is scheduled for Thursday, December 5, 2013 at 12:30 p.m., Pacific Time.
Q: Can I attend the Annual Meeting?
A: You are invited to attend the Annual Meeting if you were a stockholder of record or a beneficial owner as of October 15, 2013. If you are a stockholder of record, meaning that you hold shares
Proxy
Statement

4
directly in your name with Computershare Limited, please bring government-issued photo identification for entrance to the Annual Meeting. Stockholders holding stock in brokerage accounts will need to bring a copy of a brokerage statement reflecting their stock ownership as of the Record Date (as defined below). The meeting will begin promptly at 12:30 p.m., Pacific Time, and you should leave ample time for the check-in procedures. No cameras, recording equipment, large bags, briefcases or packages will be permitted in the Annual Meeting.
Q: What proposals will be voted on at the Annual Meeting?
A: In addition to such other business as may properly come before the Annual Meeting or any adjournment thereof, the following three proposals will be presented at the Annual Meeting:
1. The election of eight directors listed in this proxy statement and recommended by our Board of Directors to hold office until the next annual meeting of stockholders or until their respective successors have been duly elected and qualified;
2. The ratification of the appointment of PricewaterhouseCoopers LLP as the Company’s independent registered public accounting firm for the fiscal year ending July 31, 2014; and
3. A non-binding, advisory vote to approve the compensation of our executive officers.
QUESTIONS AND ANSWERS ABOUT VOTING AND PROXY SOLICITATIONS
Q: Who is entitled to vote at the Annual Meeting?
A: Holders of record of the Company’s Common Stock, par value $0.0001 per share (the “Common Stock”), at the close of business on October 15, 2013 (the “Record Date”) are entitled to receive notice of and to vote their shares at the Annual Meeting. Stockholders as of the Record Date are entitled to cast one vote for each share of Common Stock held as of the Record Date on all matters presented.
As of the close of business on the Record Date, there were 110,092,031 shares of Common Stock outstanding and entitled to vote at the Annual Meeting.
Q: How many shares must be present or represented to conduct business at the Annual Meeting?
A: The Annual Meeting will be held only if holders of a majority of our outstanding Common Stock entitled to vote are represented at the Annual Meeting. This is referred to as a “quorum.” If you have either (1) returned valid proxy instructions or (2) attend the Annual Meeting in person, your Common Stock will be counted for the purpose of determining whether there is a quorum, even if you wish to abstain from voting on some or all matters at the Annual Meeting.
Q: What is the voting requirement to approve each of the proposals?
A: On all matters, each holder of Common Stock is entitled to one vote for each share held as of the Record Date.
Proposal One — For the election of directors, a plurality of the votes duly cast is required. This means that each of the eight persons receiving the highest number of affirmative “FOR” votes at the Annual Meeting will be elected as a director of the Company to serve until the next annual meeting or

5
until that individual’s successor has been duly elected and qualified.
Proposal Two — To ratify the appointment of PricewaterhouseCoopers LLP as the Company’s independent registered public accounting firm for the fiscal year ending July 31, 2014, the affirmative “FOR” vote of a majority of the shares present or represented by proxy at the Annual Meeting and entitled to vote is required.
Proposal Three — To approve, on a non-binding, advisory basis the compensation of the Company’s named executive officers, the affirmative “FOR” vote of a majority of the shares present or represented by proxy at the Annual Meeting and entitled to vote is required.
Q: How can I vote my shares in person at the Annual Meeting?
A: Stockholders of record — Shares held in your name as the stockholder of record may be voted in person at the Annual Meeting, even if previously voted by another method.
Beneficial owners — Shares held beneficially in “street name” (as described below) may be voted in person at the Annual Meeting only if you obtain a legal proxy from the broker, trustee or other nominee that holds your shares giving you the right to vote the shares.
Even if you plan to attend the Annual Meeting, we recommend that you submit your vote as described in the Notice of Internet Availability and below so that your vote will be counted if you later decide not to attend the Annual Meeting.
Q: What is the difference between holding shares as a stockholder of record and holding shares beneficially in “street name”?
A: Stockholders of record — If your shares are registered directly in your name with the Company’s transfer agent, Computershare Limited, you are considered, with respect to those shares, the stockholder of record, and the Notice of Internet Availability has been sent directly to you by the Company. As a stockholder of record, you have the right to grant your voting proxy directly to Aruba or to a third party, or to vote in person at the Annual Meeting.
Beneficial owners — Many stockholders hold their shares through a broker, trustee or other nominee, rather than directly in their own name. If your shares are held in a brokerage account or by a bank or another nominee, you are considered the “beneficial owner” of shares held in “street name.” If this is the case, then the Notice of Internet Availability has been forwarded to you by your broker, trustee or nominee who is considered, with respect to those shares, the stockholder of record.
Q: If I do not want to attend the Annual Meeting, how can I vote my shares?
A: Whether you hold shares directly as the stockholder of record or beneficially in street name, you may direct how your shares are voted without attending the Annual Meeting. • If you are a stockholder of record, you may vote by submitting a proxy. Please refer to the
voting instructions in the Notice of Internet Availability or the information provided below. • If you hold shares beneficially in street name, you may vote by submitting voting instructions
to your broker, trustee or nominee. Please refer to the voting instructions provided to you by your broker, trustee or nominee.
Stockholders of record — If your shares are registered directly in your name with the Company’s
Proxy
Statement

6
transfer agent, you are considered, with respect to those shares, the stockholder of record, and you may vote in the following ways:
1. By Internet: Votes may be cast through the Internet voting site prior to 11:59 p.m., Eastern Time, on December 4, 2013. To vote through the Internet, please follow the “Vote by Internet” instructions in the Notice of Internet Availability (whether you received that notice by mail or email, your proxy card or voting instruction card.
2. By Telephone: Votes may be cast by telephone prior to 11:59 p.m., Eastern Time, on December 4, 2013. To vote by telephone, you will need the control number that appears on the Notice of Internet Availability (whether you received that notice by mail or email) or your proxy card or voting instruction card.
3. By Mail: Stockholders who have received a paper copy of a proxy card or voting instruction card by mail may also vote by mail, as long as the proxy card or voting instruction card is timely delivered to the Company. To vote by mail, you must complete, sign and date your proxy card or voting instruction card and mail it in the accompanying pre-addressed envelope and it must be delivered to the Company prior to 11:59 p.m., Eastern Time, on December 4, 2013.
Whichever of these methods you select to transmit your instructions, the proxy holders will vote your shares in accordance with those instructions.
Please note that if you vote by telephone, Internet or mail without giving specific voting instructions, your shares will be voted FOR Proposal One (the election of the eight nominees listed herein for the Board), FOR Proposal Two (the ratification of the appointment of our independent registered public accounting firm), FOR Proposal Three (the advisory approval of our executive compensation), and as the proxy holders may determine in their discretion with respect to any other matters that properly come before the Annual Meeting.
Q: I hold my shares in a stock brokerage account, through a bank or another nominee. How may I vote my shares?
A: You – like most stockholders – do not own shares registered directly in your own name. Rather, you are considered the “beneficial holder” of shares when those shares are held in a stock brokerage account or by a bank or other nominee. Your shares are often referred to as being held “in street name,” and your broker or nominee is considered the stockholder of record for your shares. Nevertheless, as discussed in the preceding Q&A, you still may direct how your shares are voted and you are also invited to attend the Annual Meeting, although you are not required to do so in order to vote your shares.
If you do decide to attend the Annual Meeting, you may not vote your shares in person at the Annual Meeting unless you obtain a “legal proxy” from the broker, trustee or nominee that holds your shares, giving you the right to vote the shares at the Annual Meeting.
If you do not elect to attend the Annual Meeting and wish to direct how your shares are voted at the Annual Meeting, you may vote by submitting voting instructions to your broker, trustee or nominee. Your broker or nominee should be forwarding these proxy materials to you. If a broker, bank or other nominee holds your shares, you will receive instructions from them that you must follow in order to have your shares voted. Most of the Company’s stockholders who hold shares beneficially in street name may vote by accessing the website specified in the voting instructions provided by their brokers, trustees or nominees. A large number of banks and brokerage firms are participating in

7
Broadridge Financial Solutions, Inc.’s online program. This program provides eligible stockholders the opportunity to vote over the Internet or by telephone. Voting forms will provide instructions for stockholders whose bank or brokerage firm is participating in Broadridge’s program.
Q: Can my broker vote my shares if I do not instruct him or her how I would like my shares voted?
A: Generally, no, but with one exception. As the beneficial owner, you have the right to direct your record holder how to vote your shares, and your record holder is required to vote your shares in accordance with your instructions. Record holders do not have discretion to vote your shares on Proposal One (the election of directors) or Proposal Three (the advisory vote to approve the compensation of our executive officers). However, on Proposal Two (the ratification of the appointment of our independent registered public accounting firm), if you do not give instructions to your record holder, the record holder will be entitled to vote your shares in its discretion on that proposal.
Q: Can I change or revoke my vote?
A: Subject to any rules your broker, trustee or nominee may have, you may change your proxy instructions at any time before your proxy is voted at the Annual Meeting.
Stockholders of record — If you are a stockholder of record, you may change your vote by (1) filing with the Company’s Secretary, prior to your shares being voted at the Annual Meeting, a written notice of revocation or a duly executed proxy card, in either case dated later than the prior proxy relating to the same shares, or (2) attending the Annual Meeting and voting in person (although attendance at the Annual Meeting will not, by itself, revoke a proxy). Any written notice of revocation or subsequent proxy card must be received by the Company’s Secretary prior to the taking of the vote at the Annual Meeting. Such written notice of revocation or subsequent proxy card should be hand delivered to our Corporate Secretary or should be sent so as to be delivered to the Company’s principal executive offices, Attention: Corporate Secretary.
A stockholder of record who has voted via the Internet or by telephone may subsequently change his or her vote by making a timely and valid Internet or telephone vote no later than 11:59 p.m., Eastern Time, on December 4, 2013.
Beneficial owners — If you are a beneficial owner of shares held in street name, you may change your vote (1) by submitting new voting instructions to your broker, trustee or other nominee, or (2) if you have obtained a legal proxy from the broker, trustee or other nominee that holds your shares giving you the right to vote the shares, by attending the Annual Meeting and voting in person.
Q: What happens if I decide to attend the Annual Meeting but I have already voted or submitted a proxy card covering my shares?
A: Subject to any rules your broker, trustee or nominee may have, you may attend the Annual Meeting and vote in person even if you have already voted or submitted a proxy card. Any previous votes that were submitted by you will be superseded by the vote you cast at the Annual Meeting. Please be aware that attendance at the Annual Meeting will not, by itself, revoke a proxy.
If a broker, trustee or nominee beneficially holds your shares in street name and you wish to attend the Annual Meeting and vote in person, you must obtain a legal proxy from the broker, trustee or nominee that holds your shares giving you the right to vote the shares.
Proxy
Statement

8
Q: What is a broker “non-vote”?
A: A broker non-vote occurs when a nominee holding shares for a beneficial owner does not vote on a particular proposal because the nominee does not have discretionary voting power with respect to that item and has not received instructions from the beneficial owner. Under the General Corporation Law of the State of Delaware, abstentions and broker non-votes are counted as present and are, therefore, included for purposes of determining whether a quorum is present at the Annual Meeting. Although broker non-votes will be counted towards the presence of a quorum, they will not be counted for purposes of determining the number of votes present in person or represented by proxy and entitled to vote with respect to a particular proposal.
Q: How are votes counted (including abstentions and broker non-votes) on each of the three Proposals at the Annual Meeting?
A: Shares that are subject to a broker non-vote are counted for purposes of determining whether a quorum exists at the Annual Meeting, but not for purposes of determining whether a particular proposal has passed.
Shares that are voted “FOR,” “AGAINST,” “WITHHELD” or “ABSTAIN” are treated as being present for purposes of determining the presence of a quorum and are also treated as shares entitled to vote at the Annual Meeting (“Votes Cast”). Shares that are voted without giving specific voting instructions will be voted in accordance with the recommendations of our Board and as the proxy holders may determine in their discretion with respect to any other matters that properly come before the meeting.
For Proposal One (the election of directors), you are only able to vote your shares as either “FOR” or “WITHHELD.” You may vote “FOR” all or some of the nominees or you may “WITHHOLD” your vote with respect to one or more of the nominees. Provided there is a quorum for the meeting, abstentions and broker non-votes will not affect the outcome of the election of directors.
For Proposal Two (the ratification of the appointment of PricewaterhouseCoopers LLP as the Company’s independent registered public accounting firm for the fiscal year ending July 31, 2014) and Proposal Three (the advisory vote to approve the compensation of our executive officers), you are able to vote your shares as “FOR,” “AGAINST” or “ABSTAIN.” Because abstentions will be counted for Proposals Two and Three for purposes of determining both (i) the presence or absence of a quorum for the transaction of business at the Annual Meeting and (ii) the total number of Votes Cast with respect to the proposal, an abstention on either Proposal Two or Three will have the same effect as a vote against that proposal. However, broker non-votes are not deemed to be Votes Cast and, therefore, will not be included in the tabulation of the voting results on these proposals.
Proposals Two and Three are non-binding, advisory votes, for which our Board of Directors and its committees will give careful consideration to the voting results.
Q: What is the effect of not casting a vote at the Annual Meeting?
A: If you are the stockholder of record of your shares and you do not vote by proxy card, by telephone, via the Internet or in person at the Annual Meeting, your shares will not be voted at the Annual Meeting.
If you are a beneficial owner of shares held in street name, it is critical that you provide voting instructions if you want it to count in the election of directors (Proposal One) and the non-

9
binding, advisory vote to approve the compensation of our executive officers (Proposal Three). If you hold your shares in street name and you do not instruct your bank or broker how to vote in these matters, no votes will be cast on your behalf. Your bank or broker will, however, continue to have discretion to vote any uninstructed shares on the ratification of the appointment of the Company’s independent registered public accounting firm for the fiscal year ending July 31, 2014 (Proposal Two).
Q: How does the Board of Directors recommend that I vote?
A: The Board of Directors recommends that you vote your shares:
Proposal One — “FOR” each of the eight nominees listed in this proxy statement and recommended by the Company’s Board of Directors for election as directors.
Proposal Two — “FOR” the ratification of the appointment of PricewaterhouseCoopers LLP as the Company’s independent registered public accounting firm for the fiscal year ending July 31, 2014.
Proposal Three — “FOR” the approval, on a non-binding, advisory basis, of the compensation of the Company’s named executive officers as disclosed in this proxy statement.
Q: What happens if additional matters are presented at the Annual Meeting?
A: If any other matters are properly presented for consideration at the Annual Meeting, including, among other things, consideration of a motion to adjourn the Annual Meeting to another time or place (including, without limitation, for the purpose of soliciting additional proxies), the proxy holders will have discretion to vote on those matters in accordance with their best judgment. The Company does not currently anticipate that any other matters will be presented at the Annual Meeting.
Q: What happens if the Annual Meeting is adjourned or postponed?
A: If the Annual Meeting is adjourned or postponed, the proxy holders can vote your shares on the new meeting date as well, unless you have properly revoked your proxy instructions.
Q: Where can I find the voting results of the Annual Meeting after it ends?
A: We intend to announce preliminary voting results at the Annual Meeting and will publish final results in a current report on Form 8-K within four business days after the Annual Meeting.
QUESTIONS AND ANSWERS ABOUT STOCKHOLDER PROPOSALS, DIRECTOR NOMINATIONS BY STOCKHOLDERS AND RELATED BYLAW PROVISIONS
Q: May I present other business to be transacted from the floor at the Annual Meeting this year?
A. No. A stockholder may only present a matter from the floor of a meeting of stockholders for consideration at that meeting if certain procedures set forth in our bylaws are followed, including delivery of advance notice by such stockholder to us. We have not received any timely notices with respect to the Annual Meeting regarding the presentation by any stockholders of business from the floor of the meeting. Accordingly, we do not expect to acknowledge any business presented from the floor at the Annual Meeting.
Proxy
Statement

10
Q: What is the deadline to propose actions for consideration at next year’s annual meeting of stockholders or to nominate individuals to serve as directors?
A. You may submit proposals, including director nominations, for consideration at future stockholder meetings. The deadlines depend upon, in part, whether you intend to include the proposals in the Company’s proxy materials or not.
Stockholder Proposals for Inclusion in the Company’s Proxy Materials.
For a stockholder proposal to be considered for inclusion in our proxy statement for next year’s annual meeting of stockholders (which is expected to be held in either late November or early December 2014), our Corporate Secretary must receive the written proposal at our principal executive offices no later than June 27, 2014. These types of proposals also must comply with SEC regulations under Rule 14a-8 of the Securities Exchange Act of 1934, as amended (the "Exchange Act"), regarding the inclusion of stockholder proposals in company-sponsored proxy materials and should be addressed to:
Corporate SecretaryAruba Networks, Inc.
1344 Crossman AvenueSunnyvale, CA 94089Fax: (408) 541-1361
Stockholder Proposals Not Intended for Inclusion in the Company’s Proxy Materials.
For a stockholder proposal that is not intended to be included in our proxy statement for next year’s annual meeting of stockholders, the stockholder must provide the information required by our bylaws, which establish an advance notice procedure for stockholders who wish to present certain matters before an annual meeting of stockholders (whether or not the matter relates to nominations to the Company’s Board of Directors).
Nominations for the election of directors at an annual meeting may be made only (1) by or at the direction of the Board of Directors, or (2) by a stockholder who has delivered timely written notice to our Corporate Secretary and who was a stockholder at the time of that notice and as of the record date for that meeting. The notice must contain specified information about the nominees and about the stockholder proposing such nominations. To be timely for the next annual meeting, a stockholder’s notice must be delivered to or mailed and received by the Company’s Secretary at the principal executive offices of the Company between August 11, 2014 and September 10, 2014. For more information, please see “Corporate Governance – Process for Recommending Candidates for Election to the Board of Directors” below.
The Company’s bylaws also provide that the only business that may be conducted at an annual meeting is business that is (1) specified in the notice of meeting given by or at the direction of the Board of Directors, (2) properly brought before the meeting by or at the direction of the Board of Directors, or (3) properly brought before the meeting by a stockholder entitled to vote at the annual meeting who has delivered timely written notice to our Corporate Secretary, which notice must contain specified information about the matters to be brought before such meeting and about the stockholder proposing such matters. To be timely for the next annual meeting, a stockholder’s notice must be delivered to or mailed and received by the Company’s Secretary at the principal executive

11
offices of the Company between August 11, 2014 and September 10, 2014.
Deadlines if the Date of the Next Stockholders’ Meeting is Moved.
If the date of our next stockholders’ meeting is moved more than 30 days before or 60 days after December 5, 2014, then notice of a stockholder proposal that is not intended for inclusion in our proxy statement under Rule 14a-8 must be received by us no earlier than the close of business 120 days prior to the meeting and no later than the close of business on the later of the following two dates: (1) 90 days prior to the meeting, and (2) 10 days after public announcement of the meeting date.
If a stockholder who has notified the Company of his or her intention to present a proposal at an annual meeting does not appear to present his or her proposal at such meeting, the Company is not required to present the proposal for vote at such meeting.
Q: How may I obtain a copy of the Company’s bylaws?
A. A copy of the full text of the Company’s bylaws, including the provisions discussed above, may be obtained by writing to our Corporate Secretary at our principal executive offices. A copy of our bylaws is also available free of charge on the Internet on our website at http://www.arubanetworks.com and on the SEC’s website at http://www.sec.gov.
IMPORTANT NOTICE REGARDING THE AVAILABILITY OF PROXY MATERIALS FOR THE STOCKHOLDER MEETING TO BE HELD ON DECEMBER 5, 2013
This proxy statement and the Company’s 2013 Annual Report on Form 10-K are available by going to the Investor Relations section of the Company’s website at http://ir.arubanetworks.com.
Proxy
Statement

12
PROPOSAL ONE
ELECTION OF DIRECTORS
Background
Our bylaws provide that the authorized number of directors that shall constitute our Board of Directors shall be determined by resolution of the Board of Directors. Currently, there are eight authorized directors. Our Board of Directors has selected eight nominees for election to the Board of Directors at the Annual Meeting, all of whom have been recommended for nomination by the Corporate Governance and Nominating Committee of our Board of Directors (the “Corporate Governance and Nominating Committee”), and all of whom are presently directors of Aruba. Unless otherwise instructed, the proxy holders will vote the proxies received by them for the eight nominees named below. Your proxy cannot be voted for a greater number of persons than the number of nominees named in this proxy statement.
In the event that any nominee is unable or declines to serve as a director at the time of the Annual Meeting, the proxies will be voted for any nominee who may be proposed by the Corporate Governance and Nominating Committee and designated by the Board of Directors to fill the vacancy. The term of office of each person elected as a director will continue until the next annual meeting of stockholders or until a successor has been duly elected and qualified.
Information Regarding the Nominees for Election at the 2013 Annual Meeting
Our Board of Directors and Corporate Governance and Nominating Committee believe that all of the nominees listed below are highly qualified and have the skills and experience required for service on our Board of Directors. The names of the nominees for director, their ages, their positions with Aruba and other biographical information as of October 15, 2013 are set forth below. There are no family relationships among any of our directors or executive officers. Beneath the biographical details of each nominee listed below, we have also detailed the specific experience, qualifications, attributes or skills of each nominee that led our Board of Directors to conclude that each nominee should serve on our Board of Directors.
Name Age PositionDominic P. Orr 62 President, Chief Executive Officer and Chairman of the Board of DirectorsKeerti Melkote 43 Co-Founder, Chief Technology Officer and DirectorBernard Guidon 66 DirectorEmmanuel Hernandez 58 DirectorMichael R. Kourey 54 DirectorWillem P. Roelandts 68 DirectorJuergen Rottler 47 DirectorDaniel Warmenhoven 62 Lead Independent Director
Dominic P. Orr Director since 2002.
Standing Board Committees: None.
Other Public Company Boards: None.
Mr. Orr has served as a director since 2002 and as our President and Chief Executive

13
Officer since April 2006. From November 2001 through April 2006, Mr. Orr was a private investor. Mr. Orr was President, Content Networking Business Unit at Nortel Networks, a global supplier of communication equipment, from October 2000 to October 2001, and continued as a consultant to Nortel Networks until October 2002. Prior to joining Nortel Networks, Mr. Orr served as the President and Chief Executive Officer of Alteon WebSystems from August 1996 until its acquisition by Nortel Networks in October 2000. Mr. Orr is a member of the Advisory Board at CalTech -- Division of Physics, Mathematics and Astronomy and a member of the Advisory Board of the Information Science and Technology Program at the California Institute of Technology in Pasadena, California. Mr. Orr also serves on the board of directors of Inveneo, a private, non-profit company. Mr. Orr received his B.S. in physics from the City College of the City University of New York and his M.S. and Ph.D. from California Institute of Technology.
Among other skills and qualifications, Mr. Orr brings to the Board:
• Leadership and Global Expertise – current CEO; former CEO of publicly-traded technology company
• Industry, Technology and Corporate Development Expertise – over 20 years of senior management experience in the computer systems and communication networking industries
Keerti Melkote Director since 2002.
Standing Board Committees: None.
Other Public Company Boards: None.
Mr. Melkote is one of our co-founders, has served as a director since 2002 and as our Chief Technology Officer since August 2008. Mr. Melkote started Aruba in February 2002 and has held numerous operating roles at Aruba, including in product management, marketing and business development. In 2001, Mr. Melkote was the senior director of product management and marketing at Tahoe Networks, a cellular mobile data networking company. Prior to joining Tahoe Networks, Mr. Melkote was director of product management at the Shasta IP Services division of Nortel Networks from 1999 to 2001. Mr. Melkote has also held various product management, technical marketing and engineering positions at Cisco Systems and Intel Corporation. Mr. Melkote has extensive experience in leading entrepreneurial teams that have created new businesses and billion dollar product categories in the networking industry. Mr. Melkote’s major accomplishments include the creation and delivery of Aruba's market leading secure mobile access solution, the industry's first broadband IP service delivery platform at Shasta Networks and Cisco's first gigabit switching products. Mr. Melkote received his MSEE from Purdue University and B.Tech in ECE from JNTU, Hyderabad. Mr. Melkote has been granted multiple patents for innovations in the field of networking and communications.
Among other skills and qualifications, Mr. Melkote brings to the Board:
• Leadership Expertise – current CTO
Proxy
Statement

14
• Industry Expertise – co-founder and over 20 years of experience in the communications networking industry
• In-Depth Technology Expertise – patent holder for multiple innovations in the field of networking and communications
Bernard Guidon Director since 2006.
Standing Board Committees: Compensation Committee; Corporate Development Committee; and Corporate Governance & Nominating Committee.
Other Public Company Boards: None.
Mr. Guidon has served as a director since 2006. Mr. Guidon has been an executive management consultant since February 2002, providing consulting services to multiple companies. Prior to starting his consulting activities, Mr. Guidon spent 25 years working with Hewlett-Packard Company, most recently serving as Vice President and General Manager of the Hewlett-Packard Professional Services Organization from 1999 until 2002. Mr. Guidon received his M.S. in Electrical Engineering from the Ecole Nationale Superieure d’Electrotechnique, d’Electronique, d’Informatique, d’Hydraulique et des Telecommunications in France.
Among other skills and qualifications, Mr. Guidon brings to the Board:
• Leadership and Global Expertise – former senior manager of publicly-traded technology company; held directorships with both domestic and foreign technology companies
• Industry, Technology and Corporate Development Expertise – executive management consultant
Emmanuel Hernandez Director since 2006.
Standing Board Committees: Audit Committee (Chair).
Other Public Company Boards: ON Semiconductor and SunEdison, Inc. (chairman of the board).
Mr. Hernandez has served as a director since 2006. Mr. Hernandez was an Operating Partner at Khosla Ventures, a venture capital firm, from May 2010 until January 2013. Prior to joining Khosla Ventures, Mr. Hernandez served as the Chief Financial Officer of SunPower Corporation from April 2005 to November 2008. He retired as Chief Financial Officer of SunPower Corporation in November 2008, but continued in a transition role at SunPower Corporation until January 2009. Prior to April 2005, Mr. Hernandez served for more than 11 years as the Executive Vice President of Finance and Administration and Chief Financial Officer for Cypress Semiconductor, having joined that company in 1993 as its Corporate Controller. Prior to that, Mr. Hernandez held various financial positions with National Semiconductor Corporation from 1976 through 1993. Mr. Hernandez currently serves on the board of directors of ON Semiconductor, SunEdison, Inc. (as chairman of the board of directors),

15
EnStorage Inc., a private company that develops flow battery/storage technology for the renewable energy industry, and Soraa, Inc., a private company that is developing LED and laser technology.
Among other skills and qualifications, Mr. Hernandez brings to the Board:
• Leadership and Global Expertise – director of publicly-traded technology companies; over 35 years of finance and operations experience in high tech businesses
• Financial, Corporate Development and Legal Compliance Expertise – 15 years as CFO of publicly-traded companies
Michael R. Kourey Director since 2007.
Standing Board Committees: Audit Committee.
Other Public Company Boards: Riverbed Technology, Inc.
Mr. Kourey has served as a director since 2007. Mr. Kourey has been a Partner at Khosla Ventures, a venture capital firm, since May 2013, and was an operating partner at Khosla Ventures from April 2012 to May 2013. Prior to joining Khosla Ventures, Mr. Kourey served as the Chief Financial Officer of Polycom, Inc., a publicly-held unified collaborative communications solutions company, from January 1995 to February 2012. Mr. Kourey also served as a director of Polycom from January 1999 to May 2011, as Senior Vice President, Finance and Administration from January 1999 to May 2010, as Vice President, Finance and Administration from January 1995 to January 1999 and as Vice President, Finance and Operations from July 1991 to January 1995. Mr. Kourey currently serves on the board of directors of Riverbed Technology, Inc. and various private companies, and serves on the Advisory Board of the Graduate School of Management at the University of California, Davis. Mr. Kourey holds a B.S. in managerial economics from the University of California, Davis and an M.B.A. from Santa Clara University.
Among other skills and qualifications, Mr. Kourey brings to the Board:
• Leadership and Global Expertise – director of publicly-traded technology companies
• Financial, Corporate Development and Legal Compliance Expertise – CFO of publicly-traded technology company
Willem P. Roelandts Director since 2008.
Standing Board Committees: Compensation Committee (Chair) and Corporate Development Committee.
Other Public Company Boards: Applied Materials, Inc.
Mr. Roelandts has served as a director since 2008. Mr. Roelandts is an independent
Proxy
Statement

16
consultant. Mr. Roelandts was Chairman of the Board of Directors of Xilinx, Inc. from July 2003 until August 2009 and a member of the board of directors of Xilinx from 1996 until August 2009. Mr. Roelandts served as President and Chief Executive Officer of Xilinx from January 1996 to January 2008. Prior to joining Xilinx, Mr. Roelandts held various executive positions during a 29-year career at Hewlett-Packard Company, where he last served as Senior Vice President and General Manager of Computer Systems Organizations. Mr. Roelandts serves on the Board of Directors of Applied Materials, Inc., IMEC, a non-profit research company in Belgium, eSilicon Corporation, a privately held company, and the El Camino Hospital Foundation, a non-profit foundation, and on the Board of Trustees of the Lincoln Law School. Mr. Roelandts received his B.S. in Electrical Engineering from Rijks Hogere Technische School in Belgium.
Among other skills and qualifications, Mr. Roelandts brings to the Board:
• Leadership and Global Expertise – former CEO of publicly-traded technology company
• Industry, Technology and Corporate Development Expertise – over 40 years of experience in the high tech industry
Juergen Rottler Director since 2011.
Standing Board Committees: Audit Committee and Corporate Development Committee.
Other Public Company Boards: None.
Mr. Rottler has served as a director since 2011. Mr. Rottler currently serves as the founder and chief executive officer of Global Impakt, a privately-held company that provides leadership and strategic advisory services to businesses, where he has been employed since Octobe 2010. Prior to starting Global Impakt, from September 2006 to October 2010, Mr. Rottler served as the Executive Vice President of Customer Services for Oracle Corporation, a provider of integrated business software and hardware systems. Mr. Rottler was Executive Vice President, Oracle Support and Oracle On Demand, from January 2005 to September 2006 and was Executive Vice President, Oracle On Demand, from September 2004 to January 2005. During his six-year tenure, Oracle became the first technology company to receive the global J.D. Power & Associates award for Outstanding Customer Service. Prior to joining Oracle, Mr. Rottler held several global leadership positions at Hewlett-Packard Company, where he worked in their hardware, software, and services businesses between 1986 and 2004. Mr. Rottler also serves on the board of directors of Canine Companions for Independence, a private, non-profit company and the German International School of Silicon Valley, a private school providing bilingual education in German and English. Mr. Rottler holds a bachelor’s degree in computer science and business from Hochschule Furtwangen University (Germany), and an M.B.A. from Bentley University in Waltham, Massachusetts.
Among other skills and qualifications, Mr. Rottler brings to the Board:

17
• Leadership Expertise – held executive and global leadership positions at publicly-traded technology companies
• Industry and Customer Services Expertise – over 25 years of experience in the high tech industry, with comprehensive business/P&L management experience, as well as extensive involvement in selling and servicing IT organizations
Daniel Warmenhoven Director since 2006.
Standing Board Committees: Corporate Development Committee (Chair) and Corporate Governance & Nominating Committee (Chair).
Other Public Company Boards: NetApp, Inc. and Palo Alto Networks, Inc.
Mr. Warmenhoven has served as a director since 2006 and as Lead Independent Director since October 2009. Mr. Warmenhoven has served as a member of the board of directors of NetApp, Inc. since October 1994 and was elected chairman of the NetApp board of directors in January 2008. He served as Chief Executive Officer of NetApp from October 1994 to August 2009 when he took on the role of Executive Chairman. Prior to joining NetApp, Mr. Warmenhoven served in various capacities, including President, Chief Executive Officer, and chairman of the board of directors of Network Equipment Technologies, Inc., a telecommunications company, from November 1989 to January 1994. Prior to Network Equipment Technologies, Mr. Warmenhoven held executive and managerial positions at Hewlett-Packard Company from 1985 to 1989 and IBM Corporation from 1972 to 1985. Mr. Warmenhoven is lead independent director of Palo Alto Networks, Inc., and also serves on the boards of directors of Stoke, Inc. and Bechtel Corp., both privately held companies. Mr. Warmenhoven received his B.S. in Electrical Engineering from Princeton University.
Among other skills and qualifications, Mr. Warmenhoven brings to the Board:
• Leadership and Global Expertise – former CEO of publicly-traded technology companies
• Industry, Technology and Corporate Development Expertise – over 30 years in senior management of technology companies, including network equipment companies
Vote Required and Recommendation
If a quorum is present at the Annual Meeting, the eight director nominees receiving the highest number of affirmative votes will be elected as directors. Votes withheld from any director and broker non-votes are counted for purposes of determining the presence or absence of a quorum but have no other legal effect on the selection of nominees for directors.
OUR BOARD OF DIRECTORS UNANIMOUSLY RECOMMENDS A VOTE “FOR” EACH OF THE DIRECTOR NOMINEES, WITH THE DIRECTORS WHO ARE NOMINEES ABSTAINING FROM
THEIR RESPECTIVE NOMINATION.
Proxy
Statement

18
PROPOSAL TWO
RATIFICATION OF THE APPOINTMENT OF INDEPENDENT REGISTERED PUBLIC ACCOUNTING FIRM
Audit Committee Recommendation
The Audit Committee of the Board of Directors (the “Audit Committee”) has selected PricewaterhouseCoopers LLP as Aruba’s independent registered public accounting firm to audit the Company’s financial statements for the fiscal year ending July 31, 2014, and recommends that the stockholders vote for ratification of such appointment. PricewaterhouseCoopers LLP has served as our independent registered public accounting firm since our inception. Although ratification by our stockholders is not required by law, our Audit Committee has determined that it is desirable, as a matter of good corporate practice, to request ratification of this selection by our stockholders. Notwithstanding its selection, the Audit Committee, in its discretion, may appoint new independent auditors at any time if the Audit Committee believes that such a change would be in the best interests of the Company and its stockholders. If the stockholders do not ratify the appointment of PricewaterhouseCoopers LLP, the Audit Committee may reconsider its selection.
Attendance at the Annual Meeting
A representative of PricewaterhouseCoopers LLP is expected to be present at the Annual Meeting, may make a statement if the representative desires to do so, and is expected to be available to respond to appropriate questions.
Fees
The following table presents fees for professional audit services and other services rendered to the Company by PricewaterhouseCoopers LLP for the fiscal years ended July 31, 2012 and July 31, 2013.
Fiscal 2012 Fiscal 2013Audit Fees(1) $ 1,643,000 $ 1,681,000Tax Fees(2) $ 30,000 $ 133,000All Other Fees(3) — — Total $ 1,673,000 $ 1,814,000
(1) Consists of fees for professional services rendered for the audit of the Company’s consolidated financial statements, audit of the
Company’s internal control over financial reporting and review of the Company’s quarterly interim consolidated financial statements, as well as services that are normally provided by PricewaterhouseCoopers LLP in connection with statutory and regulatory filings or engagements. Also includes fees for services associated with periodic reports and other documents filed with the SEC or other documents issued in connection with securities offerings (e.g., consents) and assistance in responding to SEC comment letters.
(2) Consists of fees billed for tax compliance, consultation and planning services. (3) Consists of fees billed for products provided by PricewaterhouseCoopers LLP.
Independence Assessment by Audit Committee
In making its recommendation to ratify the appointment of PricewaterhouseCoopers LLP as the Company’s independent registered public accounting firm for the fiscal year ending July 31, 2014, the Audit Committee has considered whether services other than audit and audit-related services provided by

19
PricewaterhouseCoopers LLP are compatible with maintaining the independence of PricewaterhouseCoopers LLP.
Pre-Approval of Audit and Non-Audit Services
The Audit Committee has adopted a policy for pre-approving the services and associated fees provided by Aruba’s independent registered public accounting firm. Under this policy, the Audit Committee must pre-approve all audit and permissible non-audit services provided by the independent registered public accounting firm. These services may include audit services, audit-related services, tax services and other services.
All PricewaterhouseCoopers LLP audit and non-audit services and fees in fiscal 2012 and fiscal 2013 were pre-approved by the Audit Committee.
Vote Required and Recommendation
If a quorum is present at the Annual Meeting, the affirmative vote of the majority of the shares present or represented by proxy at the meeting and entitled to vote is required to ratify the appointment of PricewaterhouseCoopers LLP as our independent registered public accounting firm to audit our consolidated financial statements for our fiscal year ending July 31, 2014.
OUR BOARD OF DIRECTORS RECOMMENDS A VOTE “FOR” RATIFICATION OF THE APPOINTMENT OF PRICEWATERHOUSECOOPERS LLP AS THE COMPANY’S INDEPENDENT REGISTERED PUBLIC ACCOUNTING FIRM FOR THE FISCAL YEAR ENDING JULY 31, 2014.
Proxy
Statement

20
PROPOSAL THREE
NON-BINDING, ADVISORY VOTE TO APPROVE EXECUTIVE COMPENSATION
Background
The Dodd-Frank Wall Street Reform and Consumer Protection Act of 2010 enables Aruba’s stockholders to vote to approve, on a non-binding, advisory basis, the compensation of Aruba’s named executive officers as disclosed in accordance with the SEC’s rules in the “Executive Compensation” section of this proxy statement beginning on page 31 below. This vote is required pursuant to Section 14A of the Exchange Act. This proposal, commonly known as a “say-on-pay” proposal, gives Aruba’s stockholders the opportunity to express their views on Aruba’s named executive officers’ compensation as a whole. This vote is not intended to address any specific item of compensation or any specific named executive officer, but rather the overall compensation of all of Aruba’s named executive officers and the philosophy, policies and practices described in this proxy statement. Our Board of Directors has determined that we will hold this vote every year, until our Board of Directors decides to hold the next advisory vote regarding the frequency of advisory votes on executive compensation.
As described in greater detail under the heading “Compensation Discussion and Analysis,” we seek to closely align the interests of our named executive officers with the interests of our stockholders by providing a mix of significant equity-based incentives and performance-based compensation. Our compensation programs are designed to support our business goals and to promote both short-term and long-term financial and strategic achievement.
We urge stockholders to read the “Compensation Discussion and Analysis” section of this proxy statement, which describes in more detail how our executive compensation policies and procedures operate and are designed to achieve our compensation objectives, as well as the Summary Compensation Table and other related compensation tables and disclosures in this proxy statement, which provide detailed information on the compensation of our named executive officers. The Compensation Committee and the Board believe that the policies and procedures articulated in the “Compensation Discussion and Analysis” section are effective in achieving our goals and that the compensation of our named executive officers as reported in this proxy statement has supported and contributed to our recent and long-term success.
Nature of Vote
The say-on-pay vote is advisory, and therefore not binding on the Company, the Board of Directors or the Compensation Committee of the Board of Directors (the “Compensation Committee”). The say-on-pay vote will, however, inform our Board of Directors and the Compensation Committee regarding investor sentiment about Aruba’s executive compensation philosophy, policies and practices, which the Compensation Committee will be able to consider when determining executive compensation for the remainder of the current fiscal year and beyond. Please review the results of our last advisory say-on-pay vote at page 36, in the "Compensation Discussion and Analysis" section of this proxy statement, as well as the steps we took in response to that input from our stockholders. Our Board of Directors and the Compensation Committee value the opinions of our stockholders and to the extent there is any significant vote against the named executive officer compensation as disclosed in this proxy statement, the Board of Directors and the Compensation Committee will consider the stockholders’ concerns, and the Compensation Committee will evaluate whether any actions are necessary to address those concerns.

21
We believe that the information provided within the “Executive Compensation” section of this proxy statement demonstrates that our executive compensation program was designed appropriately and is working to ensure management’s interests are aligned with our stockholders’ interests to support long-term value creation. We also believe the compensation paid to our named executive officers during fiscal 2013 was commensurate with Aruba’s financial performance as described further in the “Executive Compensation” section of this proxy statement.
Accordingly, you are being asked to vote on the following resolution at the Annual Meeting:
“RESOLVED, that the Company’s stockholders approve, on a non-binding, advisory basis, the compensation of the Company’s named executive officers, as disclosed in the Company’s Proxy Statement for the 2013 Annual Meeting of Stockholders pursuant to the compensation disclosure rules of the Securities and Exchange Commission, including the Compensation Discussion and Analysis, the compensation tables and the other related disclosure.”
Vote Required and Recommendation
If a quorum is present at the Annual Meeting, the affirmative vote of the majority of the shares present or represented by proxy at the meeting and entitled to vote is required for advisory approval of this proposal.
OUR BOARD OF DIRECTORS RECOMMENDS A VOTE “FOR” THE APPROVAL,ON A NON-BINDING, ADVISORY BASIS, OF THE COMPENSATION OF ARUBA’SNAMED EXECUTIVE OFFICERS AS DISCLOSED IN THIS PROXY STATEMENT.
Proxy
Statement

22
OUR CORPORATE GOVERNANCE PRACTICES
At Aruba, we believe that strong and effective corporate governance procedures and practices are an extremely important part of our corporate culture. In that spirit, we have summarized several of our corporate governance policies and practices below.
Corporate Governance Principles
The Board of Directors sets high standards for the Company’s employees, officers and directors. Implicit in this philosophy is the importance of sound corporate governance. It is the duty of the Board of Directors to serve as a prudent fiduciary for stockholders and to oversee the management of the Company’s business. The Board of Directors has adopted Corporate Governance Principles that set forth our principal corporate governance policies, including the oversight role of our Board of Directors. The Corporate Governance Principles, in conjunction with our Certificate of Incorporation, bylaws and Board of Director committee charters, form the framework for the governance of the Company. The Corporate Governance Principles are available on the Company’s website at www.arubanetworks.com in the Corporate Governance section of the Investor Relations page and cover a variety of corporate governance matters, including the following:
Annual Review of Governance Principles
The Board of Directors regularly reviews and updates the Corporate Governance Principles, no less frequently than annually.
Monitoring Board Effectiveness
Aruba believes that our continued success depends upon the effective functioning of our Board of Directors and its committees. Accordingly, in addition to its primary role of overseeing management, our Board of Directors is responsible for annually assessing its effectiveness and the effectiveness of each of its committees in fulfilling their respective obligations, and each committee is responsible for reviewing the Board’s assessment of that committee’s effectiveness. In addition, our Corporate Governance and Nominating Committee is charged with overseeing an annual review of the Board of Directors and its membership, taking into account issues of character, judgment, diversity, age, expertise, corporate experience, length of service, independence, other commitments and the like. Likewise, composition of our committees is reviewed each year to make certain that these committees are operating effectively and have appropriate representation. It is the Board’s belief that continuity of experience in the specific functions of these committees provides a significant benefit to the stockholders and to management.
Conducting Formal Independent Director Sessions
It is the policy of our Board of Directors to hold separate meeting times for independent directors without management. These meetings are held as a part of the regularly scheduled Board meetings and at other times as requested by any independent director.

23
Hiring Outside Advisors
We have empowered our Board and each of its committees to retain outside advisors and consultants of their own choosing and at the expense of the Company. The Audit Committee also meets with our outside auditors without management present at those times it deems appropriate, but not less than quarterly.
Communications with the Board of Directors
We believe that members of our Board of Directors should have full access to members of management, either as a group or individually, and to Company information that they believe is necessary to fulfill their obligations. In addition, our stockholders are free to communicate with our Board by writing to us at Board of Directors, Aruba Networks, Inc., Attention: Corporate Secretary, 1344 Crossman Avenue, Sunnyvale, CA, 94089.
Code of Business Conduct
Our Board of Directors has adopted a Code of Business Conduct, which is applicable to all of the Company’s directors and employees, including the Company’s principal executive officer, principal financial officer, principal accounting officer or controller and any persons performing similar functions. The Code of Business Conduct is available on the Company’s website at www.arubanetworks.com in the Corporate Governance section of the Investor Relations page. The Company will disclose on its website any amendment to the Code of Business Conduct, as well as any waivers of the Code of Business Conduct that are required to be disclosed by the rules of the SEC or The NASDAQ Stock Market LLC (“Nasdaq”).
OUR BOARD OF DIRECTORS AND COMMITTEES
Our Board of Directors
During fiscal 2013, our Board of Directors held a total of nine meetings (including regularly scheduled and special meetings). Each of the directors attended or participated in 100% of the total number of meetings of the Board of Directors and all committees of the Board of Directors on which he served during the past fiscal year (during the periods when such director served).
The Board of Directors has four standing committees: an Audit Committee, a Compensation Committee, a Corporate Governance and Nominating Committee and a Corporate Development Committee. Each standing Committee is comprised entirely of independent directors, meets regularly and has a written charter approved by the Board of Directors, all of which are available in the Investor Relations section of our website at www.arubanetworks.com. Our Board of Directors and each Committee regularly reviews the Committee charters. In addition, at each quarterly meeting of our Board of Directors, a member of each Committee reports on any significant matters addressed by that Committee. During fiscal 2013, our Board of Directors also created a temporary Capital Structure Committee to review, evaluate and make recommendations to our Board of Directors regarding our capital structure. The Capital Structure Committee consists entirely of independent directors, but does not have a written charter.
It is the policy of the Board of the Directors to have separate meeting times for independent directors without management, as stated in the Company’s Corporate Governance Principles. The independent directors met three times during fiscal 2013, with no members of management present.
Proxy
Statement

24
Attendance at Annual Stockholder Meetings by the Board of Directors
Although we do not have a formal policy mandating attendance by members of our Board of Directors at our annual meetings of stockholders, we do have a formal policy encouraging their attendance at our annual stockholder meetings. All eight of the directors then serving on our Board of Directors attended our 2012 annual meeting of stockholders.
Independence of the Board of Directors
Our Board of Directors has undertaken a review of the independence of the directors and considered whether any director has a material relationship with the Company that could compromise his ability to exercise independent judgment in carrying out his responsibilities. As a result of this review, our Board of Directors has determined that the following six directors are “independent directors” as that term is defined in the Nasdaq Listing Rules: Messrs. Guidon, Hernandez, Kourey, Roelandts, Rottler and Warmenhoven. Our Board of Directors has made a subjective determination as to each independent director that no relationships exist which, in the opinion of the Board of Directors, would interfere with the exercise of independent judgment in carrying out the responsibilities of a director.
Board Leadership Structure
Dominic P. Orr has served as the Company’s Chief Executive Officer and Chairman of the Board of Directors since April 2006. The Board of Directors believes that Mr. Orr is uniquely qualified to direct the focus and attention of the Board of Directors to the areas most relevant for Aruba and its stockholders due to his intimate knowledge of the Company’s strategic priorities and day-to-day operations. Notwithstanding the current combination of the roles of Chief Executive Officer and Chairman, the Board may, in the future, deem it appropriate to separate the roles in light of the Company’s leadership needs.
The Board of Directors believes that the Company’s leadership structure is further strengthened by the presence of a Lead Independent Director. Mr. Warmenhoven has served as Lead Independent Director since October 2009. Mr. Warmenhoven’s principal responsibilities as the Lead Independent Director are to consult with the CEO/Chairman regarding the agenda for meetings of the Board of Directors, schedule and prepare agendas for meetings of independent directors, communicate with the CEO/Chairman, act as principal liaison between the independent directors and the CEO/Chairman on sensitive issues, and raise issues with management on behalf of the independent directors when appropriate.
In addition, each committee of the Board of Directors has a designated chairperson and is comprised solely of independent directors.
The Board of Directors feels that combining the positions of Chairman and CEO, selecting a Lead Independent Director to provide independent leadership and maintaining independent committees with individual chairs is the appropriate leadership structure to encourage the effective, efficient and engaged governance of Aruba by the Board of Directors and management.
Our Board of Directors’ Role in Oversight of Risk
Our Board of Directors oversees the Company’s enterprise-wide risk management. On a regular basis, our Board of Directors reviews the strategic, financial and operational risks inherent in the Company’s business through its consideration of the various matters presented to it or one or more of its committees by management for review or approval. With respect to risks that arise in the course of the Company’s operations on a day-to-day basis, our Board of Directors has delegated to management responsibility for

25
identifying, assessing, managing and mitigating such risks, although the Board of Directors maintains ultimate responsibility for ensuring that management is effectively executing its responsibilities.
To assist our Board of Directors with its oversight function, each committee of the Board of Directors, other than the Corporate Development Committee, regularly reviews and evaluates various aspects of enterprise risk as part of the specific functions and responsibilities delegated to it by the Board of Directors. For example, the Compensation Committee is responsible for designing and implementing compensation policies that encourage the appropriate amount of risk-taking by Aruba’s employees, the Corporate Governance and Nominating Committee assesses potential risks in reviewing and managing the Company’s corporate governance policies and processes, and the Audit Committee identifies and reviews potential legal, financial and audit-related risks that are presented in connection with the committee’s oversight of the Company’s financial review and reporting processes and regulatory and corporate compliance matters.
Committees of Our Board of Directors
Audit Committee
Members During Fiscal 2013: Emmanuel Hernandez (Chair), Michael R. Kourey and Juergen Rottler.
Meetings Held During Fiscal 2013: 26.
Primary Responsibilities: The Audit Committee, which has been established in accordance with Section 3(a)(58)(A) of the Exchange Act, is responsible for, among other things:
• overseeing the accounting and financial reporting processes and audits of the Company’s financial statements;
• assisting the Board of Directors in monitoring (1) the integrity of the Company’s financial statements, (2) the Company’s compliance with legal and regulatory requirements relating to the Company’s accounting and financial reporting process, (3) the qualifications, independence and performance of the Company’s independent registered public accounting firm, (4) the performance of the Company’s internal audit function, and (5) the Company’s internal accounting and financial controls;
• providing to the Board of Directors information and materials to make the Board of Directors aware of significant financial and audit-related matters that require the attention of the Board of Directors;
• overseeing the Company’s risk assessment and risk management pertaining to financial reporting, accounting and tax matters;
• selecting and hiring the Company’s independent registered public accounting firm and approving the audit and non-audit services to be performed by the independent registered public accounting firm; and
• preparing the Audit Committee Report that the SEC requires in the Company’s annual proxy statement.
Independence: Our Board of Directors has determined that each of the members of the Audit
Proxy
Statement

26
Committee meets the independence requirements of the SEC and Nasdaq Listing Rules and has no material relationship with Aruba (including any relationship that, in the opinion of the Board of Directors, would interfere with the exercise of independent judgment as a director). The Board of Directors also has determined that each of Messrs. Hernandez and Kourey are “audit committee financial experts” as defined under the rules of the SEC.
Charter: The Audit Committee has adopted a written charter approved by the Board of Directors, which is available on the Company’s website at www.arubanetworks.com in the Corporate Governance section of the Investor Relations page. The Audit Committee reviews its charter annually, and its charter was most recently updated on September 5, 2013.
Audit Committee Report: The Audit Committee Report is included in this proxy statement on page 61.
Compensation Committee
Members During Fiscal 2013: Bernard Guidon and Willem P. Roelandts (Chair).
Meetings Held During Fiscal 2013: 8.
Primary Responsibilities: The Compensation Committee is responsible for, among other things:
• overseeing the Company’s compensation policies, plans and benefit programs and making recommendations to the Board of Directors with respect to improvements or changes to the plans and adoption of other plans;
• assisting the Board of Directors in overseeing the compensation of our Chief Executive Officer (considering the results of the most recent stockholder advisory “say-on-pay” vote) and other executive officers, and approving and evaluating the executive officer compensation plans, policies and programs, including annually reviewing and approving for the CEO and other executive officers: (1) annual base salaries, (2) annual incentive bonuses (including specific goals and amounts), (3) equity compensation, (4) employment, severance and change of control agreements/provisions, (5) signing bonuses or payments of relocation costs, and (6) any other benefits, compensation or arrangements not available to employees generally;
• administering the Company’s equity compensation plans;
• reviewing and approving the corporate goals and objectives relevant to the compensation of the our CEO and other executive officers;
• evaluating director compensation, consulting with outside consultants and/or with the Company’s human resources department and making recommendations to the Board of Directors regarding director compensation;
• reviewing the Company’s Compensation Discussion and Analysis included in the Company’s annual proxy statement; and
• preparing the Compensation Committee Report that the SEC requires in the Company’s annual proxy statement.

27
Independence: Our Board of Directors has determined that each of the members of the Compensation Committee meets the independence requirements of the SEC and Nasdaq Listing Rules and has no material relationship with Aruba (including any relationship that, in the opinion of the Board of Directors, would interfere with the exercise of independent judgment as a director).
Charter: The Compensation Committee has adopted a written charter approved by the Board of Directors, which is available on the Company’s website at www.arubanetworks.com in the Corporate Governance section of the Investor Relations page, which was recently updated on June 12, 2013 to reflect the requirements of Rule 10C-1 of the Securities Exchange Act of 1934, as amended, and the corresponding amendments to the Nasdaq listing standards in Rules 5605(d) and 5615.
Compensation Committee Report: The Compensation Committee Report is included in this proxy statement on page 48.
Corporate Governance and Nominating Committee
Members During Fiscal 2013: Bernard Guidon and Daniel Warmenhoven (Chair).
Meetings Held During Fiscal 2013: 4.
Primary Responsibilities: The Corporate Governance and Nominating Committee is responsible for, among other things:
• developing and annually reviewing principles of corporate governance and recommending them to the Board of Directors;
• reviewing proposed changes to the Company’s certificate of incorporation and bylaws and recommending changes to the Board of Directors;
• determining the manner in which our stockholders may send communications to the Board of Directors;
• reviewing stockholder proposals and recommending, if appropriate, those recommendations to the Board of Directors;
• overseeing compliance by the Board of Directors and its committees with applicable laws and regulations, including those promulgated by the SEC and the Nasdaq Stock Market;
• assisting the Board of Directors in identifying prospective director nominees and recommending nominees to the Board of Directors for each annual meeting of stockholders;
• reviewing the composition and size of the Board of Directors and determining the criteria for membership, including issues of character, judgment, diversity, age, independence, expertise, corporate experience, length of service, understanding of the Company’s business, and other commitments;
• reviewing the disclosure in our proxy statement regarding the Company’s director nomination process;
Proxy
Statement

28
• periodically reviewing the charter and composition of each committee of the Board of Directors;
• reviewing, approving and monitoring the Company’s Code of Business Conduct; and
• reviewing actual and potential conflicts of interest of Board members and executive officers, other than related party transactions reviewed by the Audit Committee, and approving or prohibiting any involvement of such persons in matters that may involve a conflict of interest or taking of a corporate opportunity.
Independence: Our Board of Directors has determined that each of the members of the Corporate Governance and Nominating Committee meets the independence requirements of the SEC and Nasdaq Listing Rules and has no material relationship with Aruba (including any relationship that, in the opinion of the Board of Directors, would interfere with the exercise of independent judgment as a director).
Evaluation of Director Candidates: The Corporate Governance and Nominating Committee will consider recommendations of candidates for the Board of Directors properly submitted to it, including those provided by the Company’s stockholders. For more information, see “Process for Recommending Candidates for Election to the Board of Directors” below.
Charter: The Corporate Governance and Nominating Committee has adopted a written charter approved by the Board of Directors, which is available on the Company’s website at www.arubanetworks.com in the Corporate Governance section of the Investor Relations page. The Corporate Governance and Nominating Committee reviews its charter annually, and its charter was most recently updated on June 12, 2013.
Corporate Development Committee
Members During Fiscal 2013: Bernard Guidon, Willem P. Roelandts, and Daniel Warmenhoven (Chair). As of September 5, 2013, independent director Juergen Rottler was added to the Corporate Development Committee.
Meetings Held During Fiscal 2013: 3.
Primary Responsibilities: The Corporate Development Committee is responsible for, among other things:
• reviewing all proposed acquisition and investment strategies with the Company’s management;
• evaluating and conducting due diligence with respect to potential acquisition and investment candidates on behalf of the Company; and
• reviewing, evaluating and recommending acquisition and investment strategies when the value of those acquisitions or investments exceeds the Corporate Development Committee’s authority thresholds of $20 million in cash per acquisition or $5 million in cash per strategic investment, respectively, in each case where the filing of a Current Report on Form 8-K would not otherwise be required.
Independence: Our Board of Directors has determined that each of the members of the Corporate

29
Development Committee meets the independence requirements of the SEC and Nasdaq Listing Rules and has no material relationship with Aruba (including any relationship that, in the opinion of the Board of Directors, would interfere with the exercise of independent judgment as a director).
Charter: The Corporate Development Committee has adopted a written charter approved by the Board of Directors, which is available on the Company’s website at www.arubanetworks.com in the Corporate Governance section of the Investor Relations page.
Compensation Committee Interlocks and Insider Participation
During fiscal 2013, Bernard Guidon and Willem P. Roelandts served as members of the Compensation Committee. In fiscal 2013, no interlocking relationship existed between any member of the Company’s Board of Directors or Compensation Committee and any member of the board of directors or compensation committee of any other company. No member of the Compensation Committee is or was formerly an officer or an employee of the Company or had any relationship requiring disclosure under Item 404 of Regulation S-K.
Process for Recommending Candidates for Election to the Board of Directors
The Corporate Governance and Nominating Committee is responsible for, among other things, determining the criteria for membership on the Board of Directors and recommending candidates for election to the Board of Directors. The Corporate Governance and Nominating Committee will consider and make recommendations to the Board of Directors regarding any stockholder recommendations for candidates to serve on the Board of Directors.
Stockholder Recommendations and Nominees
Stockholder recommendations for candidates to our Board of Directors must be directed in writing to our Corporate Secretary at the Company’s principal executive offices and must include, among other things, the candidate’s name, detailed biographical data and qualifications, home and business contact information, a document indicating the candidate’s willingness to serve if elected, and evidence of the nominating stockholder’s ownership of the Company’s stock. There are no differences in the manner by which the Corporate Governance and Nominating Committee evaluates nominees for director based on whether the nominee is recommended by a stockholder or by our Board of Directors.
Director Qualifications
The Corporate Governance and Nominating Committee will evaluate and recommend candidates for membership on the Board of Directors consistent with criteria established by the committee. The consideration of any candidate for director will be based on the Corporate Governance and Nominating Committee’s assessment of the individual’s background, experience, skills and abilities, and if such characteristics qualify the individual to fulfill the needs of the Board of Directors at that time. While the Corporate Governance and Nominating Committee has not established specific minimum qualifications for director candidates, the Corporate Governance and Nominating Committee believes that candidates and nominees should reflect a Board of Directors that is predominately independent and that is comprised of directors who (1) are of high integrity, (2) have broad, business-related knowledge and experience, (3) have qualifications that will increase the overall effectiveness of the Board of Directors, and (4) meet other requirements as may be required by applicable rules, such as financial literacy or financial expertise with respect to Audit Committee members. In evaluating director candidates, the Corporate Governance and Nominating Committee values candidates who will contribute to the broad diversity of experience,
Proxy
Statement

30
professions, skills, viewpoints and backgrounds represented on the Board of Directors, but the committee does not have a formal policy with respect to diversity nor does it assign specific weights to particular criteria. As noted above, the Corporate Governance and Nominating Committee considers diversity to be a relevant consideration, among others, in the process of evaluating and identifying director candidates, and views diversity broadly to consider those attributes that it believes will constitute the Board of Directors best able to guide the Company and its strategic direction through a variety of backgrounds, viewpoints, professional experiences, skills, educational experiences and other such attributes.
Identification and Evaluation of Nominees for Directors
The Corporate Governance and Nominating Committee uses a variety of methods for identifying and evaluating nominees for director. The Corporate Governance and Nominating Committee regularly assesses the appropriate size and composition of the Board of Directors, the needs of the Board of Directors and the respective committees of the Board of Directors, and the qualifications of candidates in light of these needs. Candidates may come to the attention of the Corporate Governance and Nominating Committee through stockholders, management, current members of the Board of Directors or search firms. The evaluation of these candidates may be based solely upon information provided to the committee or may also include discussions with persons familiar with the candidate, an interview of the candidate or other actions the committee deems appropriate, including but not limited to the use of third parties to review candidates.
Contacting the Board of Directors
Our Board of Directors welcomes the submission of any comments or concerns from Aruba's stockholders. Communications received will be reviewed by our Corporate Secretary and distributed to the Chairman of the Board of Directors or the other members of the Board of Directors as appropriate, depending on the facts and circumstances outlined in the communication received. If you wish to submit any comments or express any concerns to the Board of Directors, please send them to Board of Directors, Aruba Networks, Inc., Attention: Corporate Secretary, 1344 Crossman Avenue, Sunnyvale, California 94089.
EXECUTIVE OFFICERS
The following table provides information regarding our executive officers as of October 15, 2013:
Name Age Position(s)Dominic P. Orr 62 President, Chief Executive Officer and Chairman of the Board of DirectorsMichael M. Galvin 48 Chief Financial OfficerKeerti Melkote 43 Co-Founder, Chief Technology Officer and DirectorMichael Kirby 59 Executive Vice President, Worldwide Sales
Dominic P. Orr. See biographical information set forth above under “Proposal One - Election of Directors.”
Michael M. Galvin has served as Aruba’s Chief Financial Officer since June 2011. Mr. Galvin had been serving since April 2011 as Aruba’s interim principal financial officer and interim principal accounting officer. Mr. Galvin previously served as Aruba’s Vice President, Finance from December 2008 to April 2011. From July 2005 to November 2008, Mr. Galvin served as Aruba’s Senior Director of Finance. Prior to joining Aruba, Mr. Galvin was Chief Financial Officer of StubHub, Inc., a privately held e-commerce company, from December 2004 to April 2005. From September 1996 to November 2004, Mr. Galvin held various finance positions at BEA Systems, Inc., a publicly traded enterprise software company, including Vice President of

31
Finance/Corporate Controller and Vice President of Finance for the Worldwide Services Organization. From June 1991 to July 1996, Mr. Galvin was an investment banker at Merrill Lynch & Co., Inc., a publicly traded financial services company, most recently as a Vice President. Mr. Galvin earned a B.A. from the University of Notre Dame and an M.B.A. from the University of California, Los Angeles.
Keerti Melkote. See biographical information set forth above under “Proposal One - Election of Directors.”
Michael Kirby has served as Aruba’s Executive Vice President, Worldwide Sales since June 2011. Mr. Kirby previously served as Aruba’s Vice President, Americas from August 2004 to June 2011. Prior to joining Aruba, Mr. Kirby held multiple sales management positions at Cisco Systems and Wang Laboratories. Mr. Kirby earned a B.A. from Temple University.
Our executive officers are appointed by, and serve at the discretion of, the Board of Directors. Each executive officer is a full-time employee.
EXECUTIVE COMPENSATION
Compensation Discussion and Analysis
Aruba's Executive Compensation Program at a GlanceIntroduction Named Executive Officers
This Compensation Discussion and Analysis section of ourproxy statement describes our fiscal 2013 executivecompensation program, including the decisions made byour Board of Directors and the Compensation Committeeduring the year, the processes and tools that they used toreach those decisions, and a discussion of thecompensation earned by our “named executiveofficers” (that is, our CEO, our CFO and the two othermost highly compensated executive officers in fiscal2013), as presented in the section entitled “ExecutiveCompensation Tables” below.
Our “Named Executive Officers” for fiscal year 2013 were:
• Dominic P. Orr, President and Chief Executive Officer
• Michael Galvin, Chief Financial Officer• Keerti Melkote, Chief Technology Officer• Michael Kirby, Executive Vice President,
Worldwide Sales
Compensation Philosophy and Design PrinciplesCompensation Philosophy Design Principles
Executive compensation should be designed to:• Attract, motivate and retain executives who
contribute to the overall success of the Company by offering compensation packages that are competitive with those offered by other employers with which we compete for talent.
• Align the financial interests of our executives with those of our stockholders by providing a mix of significant equity-based incentives and performance-based compensation.
This philosophy is reflected in the following design principles:
• In addition to a competitive base salary, a substantial portion of our executives’ potential compensation is tied to a short-term incentive bonus plan that rewards corporate and individual achievement of challenging performance goals.
• We attempt to balance the allocation of long-term and short-term incentive compensation, as well as cash and non-cash compensation, to reward our executives for short-term Company success as well as motivating these executives to achieve longer-term Company goals, such as sustained profitability. This compensation has historically taken the form of long-term equity awards to incentivize the creation of stockholder value.
Proxy
Statement

32
Last Year’s “Say-on-Pay” Vote and Changes Made in Fiscal 2013
At our Annual Meeting of Stockholders for fiscal 2012, approximately 67% of the Votes Cast in the “say-on-pay” advisory vote were voted “FOR” approval of the compensation of our named executive officers. We are mindful of our stockholders’ opinions, as expressed through the “say-on-pay” advisory vote and otherwise. Accordingly, we carefully reviewed various aspects of our executive compensation structure and eliminated certain items to better align our executive compensation program with those of our compensation peer group.
By way of example, we made the following changes to our executive compensation program in fiscal 2013: • Elimination of advance payments for executive expenses, such as aircraft usage. (See page 40 for
additional information).• Elimination of non-employee director consulting agreements. (See page 40 for additional
information).• Elimination of large, “multi-year,” refresh equity awards for executives. (See page 40 for additional
information).
Key Changes for Fiscal Year 2014
Looking ahead to fiscal 2014, we intend to make a number of additional changes to our executive compensation program. For example, during fiscal 2013 the Compensation Committee determined to modify our compensation peer group for fiscal 2014, whose compensation practices will be reviewed in developing and evaluating our executive compensation program. Previously, our compensation peer group consisted of the following companies:
Aviat Networks* IxiaBigBand Networks* Juniper Networks*Brocade Communications Systems Meru Networks*Calix* NetApp*Ciena NETGEARDigi International* Network Equipment Technologies*Echelon* Rackspace HostingExtreme Networks RadiSys*F5 Networks Riverbed TechnologyFortinet Silicon Graphics International*Infinera Sonus Networks*Internap Networks Services* Symmetricom*
* Will be omitted from 2014 compensation peer group.
Following the Compensation Committee’s review, analysis and determination to modify our compensationpeer group, the new peer group will consist of the following companies for fiscal 2014:
Brocade Communications Systems NETGEARCadence Design Systems† Nuance Communications†Ciena Palo Alto Networks†Extreme Networks Plantronics†F5 Networks Polycom†Fortinet Rackspace HostingInfinera Riverbed TechnologyInformatica† Ubiquiti Networks†Ixia ViaSat†JDS Uniphase†
† New for 2014 compensation peer group.
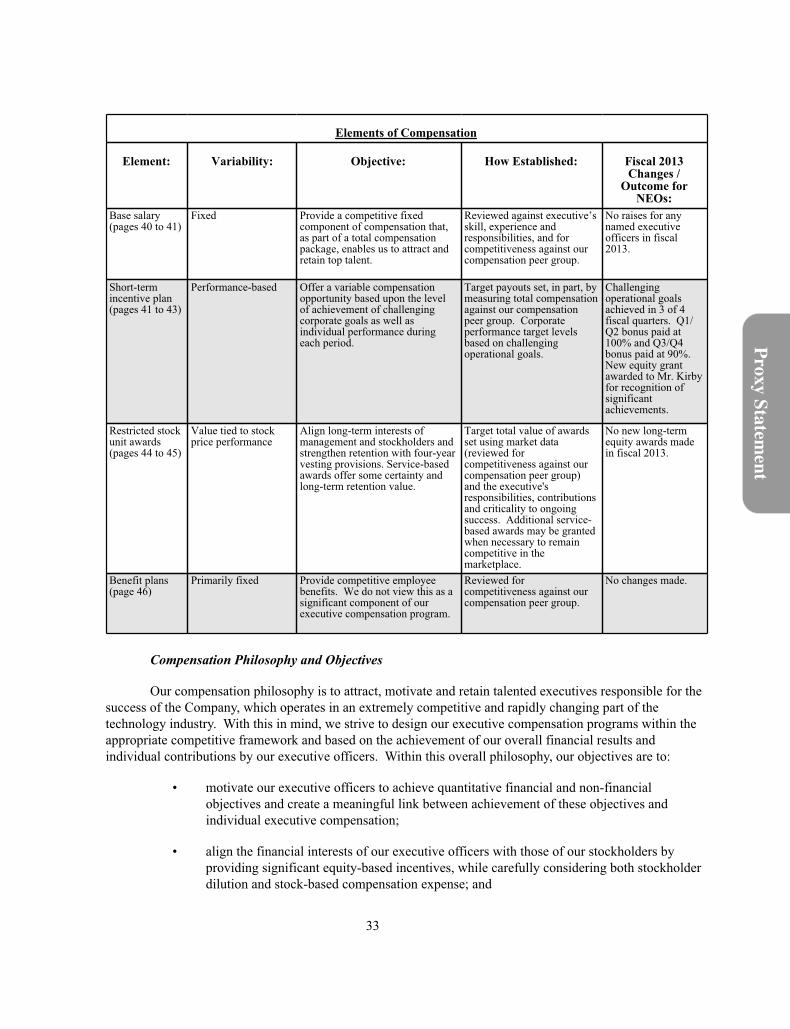
33
Elements of Compensation
Element: Variability: Objective: How Established: Fiscal 2013Changes /
Outcome forNEOs:
Base salary(pages 40 to 41)
Fixed Provide a competitive fixedcomponent of compensation that,as part of a total compensationpackage, enables us to attract andretain top talent.
Reviewed against executive’sskill, experience andresponsibilities, and forcompetitiveness against ourcompensation peer group.
No raises for anynamed executiveofficers in fiscal2013.
Short-termincentive plan(pages 41 to 43)
Performance-based Offer a variable compensationopportunity based upon the levelof achievement of challengingcorporate goals as well asindividual performance duringeach period.
Target payouts set, in part, bymeasuring total compensationagainst our compensationpeer group. Corporateperformance target levelsbased on challengingoperational goals.
Challengingoperational goalsachieved in 3 of 4fiscal quarters. Q1/Q2 bonus paid at100% and Q3/Q4bonus paid at 90%.New equity grantawarded to Mr. Kirbyfor recognition ofsignificantachievements.
Restricted stockunit awards(pages 44 to 45)
Value tied to stockprice performance
Align long-term interests ofmanagement and stockholders andstrengthen retention with four-yearvesting provisions. Service-basedawards offer some certainty andlong-term retention value.
Target total value of awardsset using market data(reviewed forcompetitiveness against ourcompensation peer group)and the executive'sresponsibilities, contributionsand criticality to ongoingsuccess. Additional service-based awards may be grantedwhen necessary to remaincompetitive in themarketplace.
No new long-termequity awards madein fiscal 2013.
Benefit plans(page 46)
Primarily fixed Provide competitive employeebenefits. We do not view this as asignificant component of ourexecutive compensation program.
Reviewed forcompetitiveness against ourcompensation peer group.
No changes made.
Compensation Philosophy and Objectives
Our compensation philosophy is to attract, motivate and retain talented executives responsible for the success of the Company, which operates in an extremely competitive and rapidly changing part of the technology industry. With this in mind, we strive to design our executive compensation programs within the appropriate competitive framework and based on the achievement of our overall financial results and individual contributions by our executive officers. Within this overall philosophy, our objectives are to:
• motivate our executive officers to achieve quantitative financial and non-financial objectives and create a meaningful link between achievement of these objectives and individual executive compensation;
• align the financial interests of our executive officers with those of our stockholders by providing significant equity-based incentives, while carefully considering both stockholder dilution and stock-based compensation expense; and
Proxy
Statement

34
• offer a total compensation package that is comparable to other similarly sized public technology companies to attract and retain top talent.
The Compensation Committee guides our compensation philosophy and objectives. During all of fiscal 2013 and continuing into the current fiscal year, the compensation for our executive officers consists of two primary components: base salary and equity awards (including those earned through the executive bonus plan discussed below). The Compensation Committee uses the above-mentioned objectives as a guide in establishing the compensation programs, practices and packages offered to our executive officers and in assessing the proper allocation between long-term and short-term incentive compensation and cash and non-cash compensation.
Allocation Amongst Types of Compensation
The Compensation Committee does not have a pre-established policy or target for the allocation between long-term and short-term incentive compensation or between cash and non-cash compensation. The Compensation Committee considers the proper allocation between long-term and short-term incentives by considering the balance that is required to retain our executive officers and reward them for the short-term success of our business while appropriately motivating them to strive to achieve the Company’s longer-term goals, such as sustained profitability. We also consider the need to offer compensation packages that are comparable to those offered by companies competing with us for executive talent.
In allocating between cash and non-cash compensation, we informally weigh similar concerns. For example, in allocating between types of compensation, the Compensation Committee believes that cash compensation and generally available benefits (such as Section 401(k) plan participation and health benefits) should be competitive with the external job market, to allow the Company to attract and retain talent. The Compensation Committee grants equity awards in a manner intended to both be competitive with the job market and provide appropriate incentives to our executive officers. For this reason, we have sought to continue to set the base salaries of our executive officers around the middle of the market pay levels relative to our compensation peer group as indicated in the survey data discussed below, but we did not engage in any benchmarking or targeting of any levels of pay.
Throughout this Compensation Discussion and Analysis, the individuals who served as Chief Executive Officer and Chief Financial Officer during fiscal 2013, as well as the other individuals included in the “Fiscal 2013 Summary Compensation Table” on page 49 of this proxy statement, are referred to as the “named executive officers.” They are:
• Dominic P. Orr, our President and Chief Executive Officer (our "CEO"),
• Michael M. Galvin, our Chief Financial Officer,
• Keerti Melkote, our Chief Technology Officer, and
• Michael Kirby, our Executive Vice President, Worldwide Sales.
Role and Authority of the Compensation Committee
The Compensation Committee has the final decision-making authority with respect to the compensation of our executive officers. In fiscal 2013, the members of the Compensation Committee were directors Bernard Guidon and Willem P. Roelandts. Each of these individuals qualifies as (i) an “independent director” as defined in the Marketplace Rules of the NASDAQ Stock Market, (ii) a “non-employee director”

35
under Exchange Act Rule 16b-3, and (iii) an “outside director” under Section 162(m) of the Internal Revenue Code. The Compensation Committee has adopted a written charter approved by our Board of Directors, a copy of which is available on the Company’s website at www.arubanetworks.com in the Corporate Governance section of the Investor Relations page. The Compensation Committee reviews its charter annually, and it was most recently updated on June 12, 2013 to reflect the changes required by Rule 10c-1(b)(1).
The Compensation Committee carries out the responsibilities assigned to it by our Board of Directors, including responsibilities to: (i) oversee our compensation policies, plans and benefits programs; (ii) review and approve the compensation of our CEO and other executive officers; and (iii) administer our equity compensation and incentive plans. In reviewing and approving the executive compensation packages offered to our executive officers, the Compensation Committee is responsible for ensuring that such packages are consistent with our compensation philosophy.
In carrying out its responsibilities, the Compensation Committee from time to time engages outside consultants and/or consults with our Human Resources department as it determines to be appropriate. When the Compensation Committee determines it would be well served by outside consultants and advisors, prior to engaging such consultants and advisors, the Compensation Committee considers the independence of such advisors, including but not limited to the following factors, (i) the provision of other services to the Company by the person that employs the compensation consultant, legal counsel or other adviser; (ii) the amount of fees received from the Company by the person that employs the compensation consultant, legal counsel or other adviser, as a percentage of the total revenue of the person that employs the compensation consultant, legal counsel or other adviser; (iii) the policies and procedures of the person that employs the compensation consultant, legal counsel or other adviser that are designed to prevent conflicts of interest; (iv) any business or personal relationship of the compensation consultant, legal counsel or other adviser with a member of the Compensation Committee; (v) any stock of the Company owned by the compensation consultant, legal counsel or other adviser; and (vi) any business or personal relationship of the compensation consultant, legal counsel, other adviser or the person employing the adviser with an executive officer of the Company. In addition to using outside consultants as appropriate, the Compensation Committee considers comparative market data provided by management, the Compensation Committee members’ own experience and knowledge regarding compensation matters, and our general compensation philosophy and goals. The Compensation Committee also may obtain advice and assistance from internal or external legal, accounting or other advisers that it selects. For example, at the invitation of the Compensation Committee, one or more of the following individuals attended each of the eight Compensation Committee meetings during fiscal 2013: Dominic P. Orr, our CEO, Mr. Galvin, our Company’s Chief Financial Officer, Ms. Hahn, our General Counsel, or Aaron Bean, our Vice President, Human Resources. The Compensation Committee expects that it will continue to meet at least quarterly in fiscal 2014 to grant any equity awards outside the scope of the Equity Award Committee’s (discussed below) authority, review the Company’s equity award granting plans as recommended by management and to discuss pertinent compensation-related issues as necessary and appropriate. In addition, the Compensation Committee annually reviews the base salaries of our executive officers.
In fiscal 2010, the Board of Directors established the Equity Award Committee, consisting of our Chief Financial Officer and General Counsel (the “Equity Award Committee”), to which the Board of Directors delegated certain equity award granting authority. The current members on the Equity Award Committee are Mr. Galvin and Ms. Hahn (our General Counsel). The Equity Award Committee has the authority to grant options to purchase shares of our common stock and restricted stock unit awards for shares of our common stock only with respect to new hires, discretionary bonuses and promotions for employees below the level of Vice President, and to consultants as compensation for services rendered, but only within
Proxy
Statement

36
certain pre-approved guidelines.
Role of Executive Officers in Compensation Decisions
The Compensation Committee on occasion meets with our CEO to obtain recommendations with respect to the compensation policies, practices and packages for our executive officers (other than himself). At least annually, the Compensation Committee considers, but is not bound by and does not always accept, his recommendations for the other executive officers. These meetings typically occur as part of the regularly scheduled Compensation Committee meeting.
During fiscal 2013, Ms. Hahn, the Company’s General Counsel, and/or Mr. Bean, the Company’s Vice President, Human Resources, regularly attended meetings of the Compensation Committee, but left the meetings as appropriate when matters of executive compensation were discussed. In addition, Mr. Orr and Mr. Galvin sometimes attended the Compensation Committee’s meetings, but left the meetings as appropriate when matters regarding their own compensation were discussed. The Compensation Committee discusses and makes decisions with respect to our CEO's compensation without him present.
Role of Stockholder Input in Setting Compensation
At our Annual Meeting of Stockholders in November 2012, we held a non-binding, advisory stockholder vote on the compensation of the named executive officers, commonly referred to as a “say-on-pay” vote. Our stockholders approved the compensation of our named executive officers, with approximately 67% of the votes cast voted in favor of our most recent “say-on-pay” proposal.
We are mindful of our stockholders’ opinions, as expressed through the “say-on-pay” advisory vote and otherwise. Accordingly, we carefully reviewed various aspects of our executive compensation program and eliminated certain items for fiscal 2013 to better align our executive compensation program with those of our compensation peer group. For example, for fiscal 2013 we eliminated (1) advance payments for executive expenses, such as aircraft usage, (2) non-employee director consulting agreements and (3) large, “multi-year,” refresh equity awards for our executive officers.
Role of Compensation Consultant
From time to time, the Compensation Committee has engaged outside consultants to assist it in reviewing and analyzing our executive compensation program. In fiscal 2013, the Compensation Committee retained Compensia, Inc. as its outside compensation consultant to perform these services. Compensia reports directly to the Chair of the Compensation Committee and performs no other work for the Company.
Compensia generally attends all meetings of the Compensation Committee in which evaluations of the effectiveness of overall compensation policies and practices are conducted or in which the compensation for our executive officers is analyzed or approved. During fiscal 2013, Compensia’s duties included providing the Compensation Committee with relevant market and industry data and analysis, as well as preparing and reviewing materials for the Compensation Committee’s meetings. In fulfilling these duties, Compensia met, as needed and at the direction of the Compensation Committee, with our CEO, Chief Financial Officer and Vice President of Human Resources.
Compensia provided the Compensation Committee with a report covering various factors regarding potential conflicts of interests arising out of its work with the Compensation Committee. Based on the information contained in this report and its discussions with Compensia, the Compensation Committee determined that the work of Compensia during fiscal 2013 did not raise any conflicts of interest.

37
Market Data
Under the direction of the Compensation Committee, Compensia provided competitive market data to review our executive compensation programs for fiscal 2013, indentified trends in executive compensation and made recommendations as to appropriate levels of compensation for fiscal 2013. The Compensation Committee used its discretion in setting actual compensation levels, taking into consideration the recommendations and market data provided by Compensia as well as the other factors listed above in “Role and Authority of the Compensation Committee.”
In fiscal 2013, our management continued to engage Radford to provide data regarding base salary, bonus and equity awards for the group of peer companies identified below. With the use of data from Radford as well as data from Compensia, management reviewed and made recommendations on compensation programs for employees at all levels, including our executive officers. Radford has provided similar services since fiscal 2007, and we expect to continue to use Radford’s services during fiscal 2014. Aruba’s management considered this data (as well as data from Compensia) in making recommendations at the end of calendar year 2012 for executive officer base salaries for fiscal 2013. Our management also uses the Radford and Compensia data as a tool in making recommendations to the Compensation Committee on compensation adjustments and new hire offers that are consistent with our compensation philosophy and goals. Radford does not provide any additional services to the Company. Although Radford does not provide services directly to the Compensation Committee, our management shares some of the comparative data it receives from Radford with the Compensation Committee for use in its decision-making. The Compensation Committee assessed the independence of Radford and concluded that its work has not raised any conflict of interest.
To compare our executive and general employee compensation program for fiscal 2013 to the market, Compensia surveyed technology companies and their published pay practices. The employers included in the survey are companies that have employees with similar experience and education levels to our employees. Also as part of the compensation review, Compensia, at the request of the Compensation Committee, analyzed compensation from the Radford Survey specific to the Network Products and Software Services categories for companies with between $500 million and $1 billion in annual revenue because those levels are similar to those of the Company. Specific attention was paid to those companies in the sample that are based in the San Francisco Bay Area/Silicon Valley where the Company’s headquarters are located. The companies in the compensation peer group reviewed by the Compensation Committee for fiscal 2013 did not change from fiscal 2012 and consisted of the following companies:
Proxy
Statement

38
Aruba Networks Fiscal 2013 Compensation Peer Group:
• Aviat Networks* • Ixia• BigBand Networks* • Juniper Networks*• Brocade Communications Systems • Meru Networks*• Calix* • NetApp*• Ciena • NETGEAR• Digi International* • Network Equipment Technologies*• Echelon* • Rackspace Hosting• Extreme Networks • RadiSys*• F5 Networks • Riverbed Technology• Fortinet • Silicon Graphics International*• Infinera • Sonus Networks*• Internap Networks Services* • Symmetricom*
* Will be omitted from 2014 compensation peer group.
To maintain competitiveness within the marketplace, the Compensation Committee considered data from this compensation peer group in determining the compensation for our executive officers, but in fiscal 2013 did not engage in any benchmarking or targeting of any levels of pay.
During fiscal 2013, the Compensation Committee further reviewed its peer group with Compensia and determined to modify the peer group for fiscal 2014 as follows:
Aruba Networks Fiscal 2014 Compensation Peer Group:
• Brocade Communications Systems • NETGEAR• Cadence Design Systems† • Nuance Communications†• Ciena • Palo Alto Networks†• Extreme Networks • Plantronics†• F5 Networks • Polycom†• Fortinet • Rackspace Hosting• Infinera • Riverbed Technology• Informatica† • Ubiquiti Networks†• Ixia • ViaSat†• JDS Uniphase†
† New for fiscal 2014 compensation peer group.
In modifying our peer group, the Compensation Committee removed companies from our 2013 compensation peer group that were acquired as well as others whose financial standing no longer met our peer selection criteria, such as revenue and market cap. To replace those companies and balance the remaining peer group companies, the Compensation Committee reviewed and evaluated a broad range of companies using an objective set of criteria, including industry, country and ownership status, and financial comparability, as well as additional refinement criteria such as revenue growth, profitability, valuation and headcount.

39
Components of Compensation
For fiscal 2013, the principal components of our executive compensation program were:
• base salary;• performance-based, short-term equity incentive awards under our Executive Officer Bonus
Plan (the “Bonus Plan”);• time-based equity awards, currently granted in the form of restricted stock unit awards;• severance and change in control protection;• retirement benefits provided under a Section 401(k) plan; and• generally available benefit programs.
The Compensation Committee selected these components because it believes each is necessary to help us attract and retain the executive talent on which our success depends. The full set of components also allows us to reward performance, retain executive talent, and provide continued incentives throughout the fiscal year, primarily through the vesting of equity awards.
During fiscal 2013, only one of our executive officers, Mr. Kirby, received an equity grant. Mr. Kirby does not participate in the Bonus Plan and in January 2013, a short-term equity grant of a restricted stock unit award was granted to Mr. Kirby in recognition of his sales achievements during fiscal 2012 prior to his promotion to Vice President, Worldwide Sales.
For fiscal 2014, the Compensation Committee intends to review its executive compensation practices. As part of this review, the Compensation Committee may determine to grant restricted stock unit awards, options to purchase shares of our common stock or a combination of options and restricted stock unit awards to our executive officers. The Compensation Committee believes that equity compensation will allow it to balance both long-term and short-term incentives to increase stockholder value and provides us with a strong retention tool. The base salary component provides recognition for the executive officer’s day-to-day efforts on behalf of the Company. Retirement benefits under our Section 401(k) plan and our generally available benefit programs allow us to offer benefits comparable to those offered in the marketplace.
The Compensation Committee generally reviews the entire executive compensation program (other than retirement benefits under the Section 401(k) plan and generally available benefit programs) on at least an annual basis. Any proposed severance or change in control protection is presented to the full Board of Directors for review and approval at least annually. However, the Compensation Committee at any time may review one or more components as necessary or appropriate to ensure such components remain competitive and appropriately designed to reward performance.
The Compensation Committee sets compensation packages for our executive officers and determines the use and relative weight of the various compensation components based on the industry knowledge of the members of the Compensation Committee and on management’s recommendations — which in turn were based on recommendations from the Compensation Committee's external compensation consultant (Compensia), survey data and management’s industry knowledge — as to compensation packages for our executive officers.
Changes in Compensation Structure
The Compensation Committee regularly reviews and evaluates our executive compensation program and assesses whether it is consistent with our overall compensation philosophy and objectives. In addition, we are mindful of our stockholders’ opinions, as expressed through the “say-on-pay” advisory vote and otherwise. Accordingly, after a careful review of various aspects of our executive compensation program, the Compensation Committee determined to make a series of changes for fiscal 2013 to better align our executive compensation structure with those of our compensation peer group.
Proxy
Statement

40
By way of example, we made the following changes to our executive compensation program in fiscal 2013:
• Elimination of advance payments for executive expenses, such as aircraft usage. In fiscal 2012, we provided our CEO with an RSU award intended to reimburse him for costs related to his anticipated use of corporate aircraft for the upcoming fiscal year. For fiscal 2013, we eliminated these types of “forward looking” reimbursements and none were granted in fiscal 2013.
• Elimination of non-employee director consulting agreements. In fiscal 2012, we paid Mr. Guidon a consulting fee in the form of 5,690 RSUs for certain consulting services he had provided to the Company historically. For fiscal 2013, we terminated this consulting agreement with Mr. Guidon and have reviewed more carefully all arrangements with our directors that might impact director independence under not only Nasdaq listing standards and SEC rules, but under ISS guidelines as well.
• Elimination of large, “multi-year,” refresh equity grants for executives. For example, in fiscal 2012, we granted our CEO 400,000 RSUs with a four-year vesting schedule in part because we had not granted him an award in fiscal 2011. The award refreshed the long-term equity incentive component of his compensation. Because the “Summary Compensation Table” requires that we include the grant date fair value of stock options and awards granted in a given year, rather than the value of the number of shares that vest within that year, this refresh equity grant had the effect of making Mr. Orr’s compensation appear larger in fiscal 2012 than it actually was. For fiscal 2013, we did not make any large, refresh grants to executives intended to cover multiple years of service, although we reserve the right to make future grants sufficient in size to satisfy our retention needs.
Looking ahead to fiscal 2014, we are proposing to make a number of additional changes to our compensation program. For example, the Compensation Committee determined to modify our peer group to better reflect the compensation levels, practices and programs offered by the broad range of companies with whom we compete for talent, and during fiscal 2014 we expect that the Compensation Committee will approve and recommend to our Board of Directors stock ownership guidelines for members of our Board of Directors and our CEO.
Executive Compensation Structure
Base Salary
Element: Variability: Objective: How Established: Fiscal 2013Changes /
Outcome forNEOs:
Base salary Fixed Provide a competitive fixedcomponent of compensation that,as part of a total compensationpackage, enables us to attract andretain top talent.
Reviewed against executive’sskill, experience andresponsibilities, and forcompetitiveness against ourcompensation peer group.
No raises for anynamed executiveofficers in fiscal2013.
We provide base salaries to our executive officers to compensate them for services rendered on a day-to-day basis during the fiscal year.
During fiscal 2013, the Compensation Committee conducted a performance review process and reviewed the base salaries of the named executive officers. As part of this process, our CEO reviewed the performance of our executive officers (other than his own performance) and reported those findings to the Compensation Committee. In conducting his review, our CEO may take into account any specific items of performance he deems to be relevant. An executive officer’s personal performance typically is judged in part on whether the Company’s business objectives have been met, and each executive officer’s experience, skills, knowledge and responsibilities also are considered. Our CEO shares his performance assessment of each

41
executive officer with the Compensation Committee prior to the Compensation Committee’s annual compensation review and determination and management, with input from the external consultant, makes recommendations to the Compensation Committee regarding base salaries.
The Compensation Committee does not apply specific formulas to determine base salary increases. There is no formal process in setting these budgets other than the annual business planning process. For newly hired executive officers, the Compensation Committee also considers the base salary of the individual at his or her prior employment and any unique personal circumstances that motivated the executive to leave that prior position and join Aruba.
During fiscal 2013, we did not make changes to the fiscal 2012 base salaries of our executive officers because the Compensation Committee continued to believe that the base salaries were appropriately set at a level that was consistent with the competitive market, although the Compensation Committee noted that during fiscal 2013 the middle range of peer group executive base pay that we target rose relative to the base salaries of our executive officers.
Name Fiscal 2012 Base Salary (1) Fiscal 2013 Base Salary Year-Over-YearPercentage Increase
Dominic P. Orr $400,000 $400,000 0%Michael M. Galvin $315,000 $315,000 0%Keerti Melkote $280,000 $280,000 0%Michael Kirby $315,000 $315,000 0%(1) Represents base salary in effect at the end of fiscal 2012.
Variable Incentive Awards and other Bonuses
Element: Variability: Objective: How Established: Fiscal 2013Changes /
Outcome forNEOs:
Short-termincentive plan
Performance-based Offer a variable compensationopportunity based upon the levelof achievement of challengingcorporate goals as well asindividual performance duringeach period.
Target payouts set, in part, bymeasuring total compensationagainst our compensationpeer group. Corporateperformance target levelsbased on challengingoperational goals.
Challengingoperational goalsachieved in 3 of 4fiscal quarters. Q1/Q2 bonus paid at100% and Q3/Q4bonus paid at 90%.New equity grantawarded to Mr. Kirbyfor recognition ofsignificantachievements.
The Bonus Plan offers our executive officers the opportunity to earn bonuses based on the Company’s achievement of key financial and strategic performance targets as well as individual performance during each performance period. The Bonus Plan consists of two performance periods per fiscal year. Each performance period lasts for two consecutive fiscal quarters, and a new performance period will begin on the first day of the first and third fiscal quarters. Each executive officer is assigned a target bonus opportunity, set as a percentage of his base salary, for each performance period (see the table below for each named executive officer’s target bonus opportunity in fiscal 2013). Target bonus opportunities are determined so as to be in the general range of the middle of the competitive market. An executive officer may earn more or less than his target bonus opportunity based on the extent to which achievement of the specified performance goals result in the funding of a bonus pool. If Company performance results in the bonus pool being funded at 100% of target levels, the Bonus Plan participants will be eligible to receive bonuses at their target levels, although the Compensation Committee has discretion to make exceptions and grant bonuses even when the Company performance targets have not been fully achieved.
Proxy
Statement
42
Each fiscal year, management develops and our Board of Directors, after discussion and review, approves an operating plan designed to encourage the growth and development of the Company. The operating plan is intentionally challenging and expected to be achieved by management and the Company as a whole only with significant effort and skill. Because the Bonus Plan’s performance goals and target levels are set by the Compensation Committee based on the Company’s operating plan, the difficulty in achieving the performance goals at the target levels reflects the inherent difficulty in achieving the goals and objectives set forth in the operating plan. Our Board of Directors expects that management will need to perform at high levels and expend significant effort and skill to achieve target level performance under the Bonus Plan.
Consistent with the Company’s operating plan, the performance measures used for purposes of the Bonus Plan are revenue and operating income. Under the Bonus Plan, the funding of a bonus pool is based upon the extent to which the Company meets or exceeds the revenue and operating income target levels for the performance period that are set by our Board of Directors at the start of the fiscal year. For the bonus pool to be funded, the operating income target for the performance period must be met in full and the revenue target for the performance period must be met at a level of at least 97.5%, subject to the Compensation Committee’s discretion to make grants even if the target performance level has not been fully achieved. If these minimum targets are achieved, the bonus pool for the performance period will be funded at the same percentage of achievement of the revenue target, up to a maximum funding level of 110%. For example, if the operating income target is met and 105% of the revenue target is met, then the bonus pool will be funded at a level of 105% of the target amounts of all participants in the Bonus Plan for the performance period. As a result, each participant would be eligible to receive a bonus valued at 105% of his target bonus opportunity for the performance period.
An executive officer must be an employee in good standing to participate in the Bonus Plan. If an executive officer’s employment begins during a performance period that has already begun, he or she will be eligible to receive a pro-rata bonus if he or she is employed by the Company for at least one full fiscal quarter during the performance period, and subject to the other terms and conditions of the Bonus Plan.
Bonuses under the Bonus Plan are paid in the form of restricted stock unit awards for share of our common stock granted under the Company’s 2007 Equity Incentive Plan, as amended (the “2007 Equity Incentive Plan”). Bonuses are paid in the form of equity because they have immediate value upon vesting. The actual number of shares of our common stock subject to a restricted stock unit award for a participant is calculated based on the dollar value of the bonus awarded to such participant divided by the closing price of our common stock on the date of grant. Restricted stock unit awards granted pursuant to the Bonus Plan are immediately vested at the time of grant.
The Compensation Committee retains discretion to increase or decrease (including to zero) the amount of the bonus pool that is funded, the bonus target percentages or bonus target amounts for each participant, and the number of shares of our common stock subject to restricted stock unit awards to be granted as a bonus award.
As of the end of fiscal 2013, the target and maximum (based on bonus pool funding limits) bonus opportunities as a percentage of base salary for fiscal 2013 for each of the named executive officers were as follows:
Executive Officer Target Bonus as aPercentage of Base
Pay
Target BonusAmount for FY13
Maximum Bonus asa Percentage of Base
Pay
Maximum BonusAmount for FY13
Dominic P. Orr 150% $600,000 165.0% $660,000
Michael M. Galvin 75% $236,250 82.5% $259,875
Keerti Melkote 75% $210,000 82.5% $231,000
For the first performance period in fiscal 2013, the Company’s financial targets were $299.0 million of revenue and $62.8 million of operating income, and the actual results were $299.8 million of revenue and $65.0 million of operating income. For the second performance period in fiscal 2013, the Company’s financial targets were $331.0 million of revenue and $70.8 million of operating income, and the actual results

43
were $300.2 million of revenue and $46.7 million of operating income.
Because the Company achieved both its revenue and operating income target levels for the first performance period in fiscal 2013, the following bonuses were paid (in the form of restricted stock unit awards) to the named executive officers under the Bonus Plan:
Executive Officer Target Bonus Amount forFirst Performance Period
of FY13
Maximum Bonus Amountfor First Performance
Period of FY13
Value of RSUs ActuallyAwarded for First
Performance Period ofFY13 (1)
Dominic P. Orr $300,000 $330,000 $250,007
Michael M. Galvin $118,125 $129,938 $118,115
Keerti Melkote $105,000 $115,500 $105,009(1) Value of RSUs Actually Awarded may differ from the percentage of the target approved due to (1) fact that awards are paid inthe form of RSUs and/or (2) Compensation Committee may exercise its discretion to increase or decrease individual awards in itssole discretion.
Although the Company did not achieve its revenue and operating income target levels for the second performance period in fiscal 2013, the Compensation Committee determined to fund bonuses to the participating named executive officers for the second performance period for the following reasons: (1) the Compensation Committee recognized that the unexpectedly mixed macroeconomic climate during the third quarter of fiscal 2013 rendered unachievable the original target revenue and operating income goals for that performance period, (2) during fiscal 2013, the middle range of peer group executive base pay that we target rose, but we did not commensurately increase our executives' base salaries for fiscal 2013, (3) we did not grant any long-term "refresh" equity awards to our executive officers during fiscal 2013, (4) the Compensation Committee desired to maintain the same bonus funding levels for executives as for other employees for the same performance period, and (5) the Compensation Committee believed that payment of such bonuses was necessary for retention purpose. Accordingly, for the second performance period in fiscal 2013 the following bonuses were paid (in the form of restricted stock unit awards) to the named executive officers under the Bonus Plan:
Executive Officer Target Bonus Amount forSecond Performance
Period of FY13
Maximum Bonus Amountfor Second Performance
Period of FY13
Value of RSUs ActuallyAwarded for Second
Performance Period ofFY13 (1)
Dominic P. Orr $300,000 $330,000 $270,010
Michael M. Galvin $118,125 $129,938 $80,007
Keerti Melkote $105,000 $115,500 $94,516(1) Value of RSUs Actually Awarded may differ from the percentage of the target approved due to (1) fact that awards are paid inthe form of RSUs and/or (2) Compensation Committee may exercise its discretion to increase or decrease individual awards in itssole discretion.
Sales Commission Plan for Mr. KirbyMr. Kirby, the Company’s Executive Vice President, Worldwide Sales, did not participate in the
Bonus Plan for fiscal 2013 as he was eligible for a commission plan based on the achievement of revenue and bookings quotas tied to the Company's worldwide sales. Because much of Mr. Kirby’s responsibilities are focused on sales, the Compensation Committee determined that it would be more appropriate for Mr. Kirby to participate in a sales commission plan rather than the Bonus Plan. For fiscal 2013, Mr. Kirby’s annual revenue quota was $664,950,000 and his bookings quota was $715,000,000. At target, Mr. Kirby was eligible to receive $385,000 in commissions and would earn 50% of target at attainment of 50% of his quota and 200% of target at attainment of 150% and above of his quotas. In fiscal 2013, Mr. Kirby achieved 96% of his revenue quota and 90% of his bookings quota and, thus, received commissions totaling $369,600. In addition, Mr. Kirby received a restricted stock unit award in January 2013 in recognition of his sales achievements during fiscal 2012 prior to his promotion to Executive Vice President, Worldwide Sales.
Proxy
Statement

44
Long-Term, Equity-Based Incentive Awards
Element: Variability: Objective: How Established: Fiscal 2013Changes /
Outcome forNEOs:
Restricted stockunit awards
Value tied to stockprice performance
Align long-term interests ofmanagement and stockholders andstrengthen retention with four-yearvesting provisions. Service-basedawards offer some certainty andlong-term retention value.
Target total value of annualawards set using market data(reviewed forcompetitiveness against ourcompensation peer group)and the executive'sresponsibilities, contributionsand criticality to ongoingsuccess. Additional service-based awards may be grantedwhen necessary to remaincompetitive in themarketplace.
No new long-term equity awards made in fiscal 2013.
We use long-term incentive compensation in the form of equity awards to align the interests of our executive officers with those of our stockholders and to provide each executive officer with a significant incentive to manage the Company from the perspective of an owner with an equity stake in the business. Equity awards also function as an important retention tool.
With respect to the equity awards for our executive officers, management (including our CEO and the Vice President of Human Resources) makes recommendations to the Compensation Committee based on our grant guidelines and the executive officer’s previous awards. The grant guidelines assist the Company in keeping its equity awards within the budgeted grant pool approved by the Compensation Committee, and thereby efficiently managing its available equity pool and its overhang.
The Compensation Committee determines the size of each executive officer’s equity award based on such executive officer’s position within the Company and seeks to set a level that will create a meaningful opportunity for stock ownership. In addition, in determining the size of an executive officer’s equity award, the Compensation Committee takes into account an individual’s recent performance, as described above. Although the Compensation Committee has not formalized the process by which it takes an individual’s performance into account, it may do so in the future. In addition, our CEO annually reviews the performance of each of our other executive officers. He may take into account any specific factors that he deems relevant. As described above, an executive officer’s personal performance typically is judged in part on whether the Company’s business objectives have been met, and each executive officer’s experience, skills, knowledge and responsibilities are also considered. Our CEO shares his performance assessment of each executive officer with the Compensation Committee prior to the Compensation Committee’s annual compensation review and determination. In establishing actual compensation, the Compensation Committee may take into account such performance assessment, which addresses both financial and non-financial objectives, other individual factors such as an executive officer’s tenure with the Company, his or her individual performance over a given year and competitive market data for his or her position.
In reviewing and analyzing the appropriate type and amount of equity awards to be granted, the Compensation Committee also reviews the following factors:
• the number of shares of our common stock subject to awards granted to an individual in a given role or position;
• the number of shares of our common stock owned, and the number of shares of our common stock subject to equity awards granted by role or position as a percentage of total shares owned, option shares granted, shares of restricted stock granted and shares subject to restricted stock unit awards granted or outstanding as a percentage of total

45
common stock outstanding; and
• the individual’s vested and unvested equity positions.
The Compensation Committee views these factors as the main motivators to retain and attract key management talent. On a total Company basis, when appropriate, the Compensation Committee also analyzes:
• the number of shares of our common stock used by us during the year with respect to new equity awards (i.e., burn rates);
• the number of shares of our common stock subject to outstanding equity awards relative to the total number of shares issued and outstanding (i.e., issued equity overhang); and
• the number of shares of our common stock subject to outstanding equity awards and available for future awards relative to the total number of shares issued and outstanding (i.e., total equity overhang).
The Compensation Committee believes that analyzing the above factors allows it to assess whether granting additional awards to our executive officers is prudent based on the pool of shares of our common stock that the Company has available for awards to all of its service providers and to take into consideration the impact on the dilution of stockholder interests and the Company’s overhang.
After taking into account the factors described above, and subject to the paragraph below, the Compensation Committee did not grant any long-term equity awards to the named executive officers in fiscal 2013.
Equity Award Grant Policy
We have a policy pursuant to which equity awards are approved in advance of a future effective grant date, which remains in use. Under this policy, on the second Monday of each month, management submits its recommendations for employee equity awards to the Equity Award Committee (or the Compensation Committee with respect to awards to our executive officers or awards that are otherwise outside the scope of the Equity Award Committee’s authority) and, if such equity awards are approved by the Equity Award Committee or the Compensation Committee, as applicable, such equity awards will be granted effective as of the second Friday of the month. If the second Friday of the month precedes the second Monday of the month, then equity awards will be granted effective as of the third Friday of the month. It is our policy to not time equity award grants in relation to the release of material non-public information and it is the intent of this policy to specify the timing of effectiveness of equity awards granted thereunder to avoid such timing. We follow this grant policy as a best practice approach recommended by outside legal counsel to ensure all equity awards comply with laws and regulations. All options to purchase shares of our common stock granted to our executive officers have a per share exercise price equal to the fair market value of our common stock on the grant date.
Proxy
Statement

46
Perquisites and Other Compensation
Element: Variability: Objective: How Established: Fiscal 2013Changes /
Outcome forNEOs:
Benefit plans Primarily fixed Provide competitive employeebenefits. We do not view this as asignificant component of ourexecutive compensation program.
Reviewed forcompetitiveness against ourcompensation peer group.
No changes.
We make only nominal use of perquisites and other personal benefits in compensating our executive officers. In fiscal 2013, the named executive officers (other than our CEO) were eligible to participate in our employee stock purchase plan. Mr. Orr, our CEO, was ineligible to participate in our employee stock purchase plan because the terms of the plan do not permit employees with ownership interests in the Company above certain levels to participate. In addition, the named executive officers were eligible to participate in the health and welfare programs that are generally available to our other employees, including medical, dental, vision, life, short-term and long-term disability, employee assistance, flexible spending, and accidental death & dismemberment.
We also maintain a tax-qualified Section 401(k) plan, which is broadly available to our general US-based employee population. Under the Section 401(k) plan, all Company employees are eligible to participate and there is no Company matching contribution associated with this benefit. We do not provide defined benefit pension plans or defined contribution retirement plans to our executive officers or other employees other than (i) the Section 401(k) plan or (ii) as required in certain countries other than the United States for legal or competitive reasons.
The Section 401(k) plan and other generally available benefit programs allow us to remain competitive, and we believe that the availability of such benefit programs enhances employee loyalty and productivity. The benefit programs are primarily intended to provide all eligible employees with competitive and quality healthcare, financial protection for retirement and enhanced health and productivity. These benefit programs typically do not factor into the decisions regarding the direct compensation components for our executive officers.
Stock Ownership Guidelines
At this time, our Board of Directors has not adopted stock ownership guidelines with respect to the named executive officers, the directors, or otherwise. However, the Compensation Committee has evaluated proposed stock ownership guidelines for members of our Board of Directors and CEO, and we expect that proposal to be recommended to our Board of Directors for adoption during fiscal 2014.
Anti-Hedging Policy
We have an insider trading policy that prohibits, among other things, short sales, hedging of stock ownership positions, and transactions involving derivative securities relating to our common stock. In addition, each named executive officer has previously entered into a Rule 10b5-1 trading plan.
Compensation Recovery Policy
At this time, we have not implemented a policy regarding retroactive adjustments to any cash or equity-based incentive compensation paid to our executive officers and other employees where the payments were predicated upon the achievement of financial results that were subsequently the subject of a financial restatement. The Compensation Committee intends to revisit the issue after the SEC adopts final rules implementing the requirement of Section 954 of the Dodd-Frank Wall Street Reform and Consumer Protection Act.

47
Severance and Change of Control Protection
We provide post-employment compensation in the form of cash severance, reimbursement of premiums paid to continue participation in the Company’s health plans, and certain acceleration of outstanding equity awards if an executive officer’s employment is terminated under certain conditions, including a termination without cause or for good reason following a change in control of the Company.
In March 2010, the Compensation Committee approved certain severance and change of control protections for our executive officers. In September 2011, the Compensation Committee memorialized the arrangements in a Change of Control Severance Policy for Officers and Directors (the “Change of Control Severance Policy”). The Change of Control Severance Policy provides that if there is a change in control of the Company and an executive officer’s employment terminates as a result of an involuntary termination without cause within 12 months following such change of control, then the executive officer will receive various benefits. First, 50% of the then-unvested shares subject to such executive officer’s then-outstanding equity awards will immediately vest and, in the case of options and stock appreciation rights, shall become exercisable. Second, subject to certain conditions, such executive officer will receive a lump sum severance payment equal to a percentage of his or her annual base salary as in effect immediately prior to their termination date. The CEO receives 100% of his or her annual base salary while our other executive officers receive 50% of their annual base salary. Third, subject to certain conditions, the Company will pay, for a limited time, the cost of COBRA to continue the health coverage for such executive officers. The CEO receives 12 months of coverage and our other executive officers receive 6 months of coverage.
The Change of Control Severance Policy has a non-duplication of benefits provision. As such, if an executive officer is entitled to benefits other than through the Change of Control Severance Policy, the executive officer’s benefits under the Change of Control Severance Policy will be reduced by the value of the benefits that the executive officer receives otherwise than through the Change of Control Severance Policy.
It is expected that Aruba from time to time will consider the possibility of an acquisition by another company or other change of control. In setting the terms of the acceleration of equity awards, we recognize that such consideration may be a distraction to executive officers and may cause executive officers to consider alternative employment. We also recognize that our named executive officers might not be retained in comparable positions by a large acquirer, and so the benefit of the equity award incentives provided to them might otherwise be forfeited upon a termination of employment by an acquirer. As a result, we believe it is imperative to provide our executives with severance benefits upon their termination of employment following a change of control to (i) secure their continued dedication and objectivity, notwithstanding the possibility, threat or occurrence of a change of control, (ii) provide such individuals with an incentive to continue employment and motivate them to maximize the value of Aruba upon a change of control for the benefit of its stockholders, and (iii) provide such individuals with enhanced financial security. Further, we felt that these levels of acceleration were necessary to recruit these individuals to their positions and retain them.
The Change of Control Severance Policy is designed to meet these objectives and reflects what the Compensation Committee believes to be the industry standard for change of control and severance agreements used to attract and retain key executives. The Compensation Committee reviews our change of control and severance policies from time to time, and may make changes as circumstances merit.
As described in further detail in the section “Potential Payments Upon Termination or Change of Control” below, Mr. Orr is eligible for additional severance protection not tied to a change of control. Mr. Orr’s employment agreement provides for acceleration of vesting of his outstanding awards in connection with a termination by the Company without cause or his resignation for good reason even without a change of control. This arrangement was necessary to recruit Mr. Orr and negotiated during the hiring process.
Tax and Accounting Considerations
In its review of our executive compensation program for fiscal 2013, the Compensation Committee
Proxy
Statement

48
considered, but did not place great emphasis on, the anticipated tax and accounting treatment of our compensation programs and payments on us or our executive officers. While we may consider tax and accounting treatment in the future, these factors alone are not dispositive. Among other factors that receive greater consideration are the net costs to us and our ability to effectively administer executive compensation in the short-term and long-term interests of stockholders under a proposed compensation arrangement.
Deduction Limit
Section 162(m) of the Internal Revenue Code limits the amount that we may deduct in any taxable year for compensation paid to our CEO and to certain of our executive officers to $1 million per person, unless certain exemption requirements are met. The Compensation Committee is aware of this limitation and has decided that it is not appropriate at this time to limit the Company’s discretion to design the compensation packages payable to our executive officers to comply with this deduction limit.
Nonqualified Deferred Compensation
Section 409A of the Internal Revenue Code imposes additional significant taxes in the event that an executive officer, director or service provider receives “deferred compensation” that does not satisfy the requirements of Section 409A. Although we do not maintain a traditional nonqualified deferred compensation plan, Section 409A does apply to certain severance arrangements and equity awards. Consequently, to assist in avoiding additional tax under Section 409A, in December 2008 we amended certain of the severance arrangements described above and we structure our equity awards in a manner intended to either avoid the application of Section 409A or, to the extent doing so is not possible, comply with the applicable Section 409A requirements.
Accounting for Stock-Based Compensation
We account for stock-based awards in accordance with the requirements of ASC Topic 718. Restricted stock unit awards are more attractive from an accounting perspective than they were under the accounting rules previously in place. The Compensation Committee took this into consideration when it decided that its fiscal 2012 equity compensation program would consist solely of restricted stock unit awards to all levels of employees on a going-forward basis, including the named executive officers.
Compensation and Risk Assessment
The Compensation Committee has assessed the risks associated with the Company’s compensation policies and practices for all employees and, based on its assessment, does not believe that such compensation policies and practices create risks that are reasonably likely to have a material adverse effect on the Company.
Compensation Committee Report
The information contained in this report shall not be deemed to be “soliciting material” or “filed” with the SEC or subject to the liabilities of Section 18 of the Securities Exchange Act of 1934, as amended, except to the extent that Aruba specifically incorporates it by reference into a document filed under the Securities Act of 1933, as amended, or the Securities Exchange Act of 1934, as amended.
The Compensation Committee has reviewed and discussed the Compensation Discussion and Analysis required by Item 402(b) of Regulation S-K with management. Based on such review and discussions, the Compensation Committee has recommended to the Board of Directors that the Compensation Discussion and Analysis be included in this proxy statement.
Respectfully submitted by the members of the Compensation Committee of the Board of Directors:
Willem P. Roelandts (Chairman)Bernard Guidon

49
Fiscal 2013 Summary Compensation Table
The following table presents information concerning the compensation earned for the fiscal years ended July 31, 2013, 2012, and 2011, by (i) our principal executive officer, (ii) our principal financial officer, (iii) our other most highly compensated executive officers, other than our principal executive officer and principal financial officer, who were serving as executive officers at the end of fiscal 2013 (collectively, our “named executive officers”).
Name and Principal PositionFiscalYear
Salary($)
Bonus($)
Stock Awards($)(1)(2)
Option Awards($)(1)
Non-EquityIncentive Plan
Compensation ($)
All OtherCompensation
($)Total
($)
Dominic P. Orr 2013 400,000 — 250,007(3) — — 540(4) 650,547
President, Chief ExecutiveOfficer and Chairman of theBoard of Directors
2012 400,000 — 6,486,459(5) 2,030,400 — — 8,916,859
2011 400,000 — 525,001(6) — — 8,428(7) 933,429
Michael M. Galvin 2013 315,000 — 118,115(3) — — 540(4) 433,655
Chief Financial Officer 2012 315,000 13,407 5,695,370(5) — — — 6,023,777
2011 267,917(8) — 912,121(6) — — — 1,180,038
Keerti Melkote 2013 280,000 — 105,009(3) — — 540(4) 385,549
Co-Founder, Chief TechnologyOfficer and Director 2012 280,000 — 2,060,986(5) — — — 2,340,986
2011 280,000 — 181,988(6) — — — 461,988
Michael Kirby(9) 2013 315,000 — 451,400(10) — 369,600(11) 540(4) 1,136,540
Executive Vice President,Worldwide Sales 2012 298,750 — 5,918,072(12) — 361,742(11) 63,920(13) 6,642,484
(1) Reflects the grant date fair value of each equity award granted in fiscal 2013, 2012 and 2011 computed in accordance with ASC Topic 718. A discussion of the valuation assumptions used for purposes of calculating the grant date fair values is included in Note 10 to our consolidated financial statements which are included in our Annual Report on Form 10-K for the fiscal year ended July 31, 2013, filed with the SEC on September 24, 2013. These amounts do not purport to reflect the value that will be recognized by the named executive officers upon sale of the underlying securities. Additional information regarding outstanding equity awards can be found in the Outstanding Equity Awards at Fiscal 2013 Year-End Table.
(2) Except as otherwise noted, includes stock awards under our executive officer bonus plan ("Bonus Plan") for the fiscal year in which such stock awards were granted.
(3) Reflects stock awards earned under our Bonus Plan with respect to the first performance period in fiscal 2013. Stock awards earned under our Bonus Plan with respect to the second performance period in fiscal 2013 were granted in the first quarter of fiscal 2014 and, therefore, will be disclosed in next year's Summary Compensation Table as compensation for fiscal 2014. Please see the Grants of Plan-Based Awards in Fiscal 2013 Table for more information on the stock awards earned with respect to the second performance period in fiscal 2013.
(4) Represents the dollar value of the premium paid by the Company for life insurance for the benefit of the named executive officer. (5) Includes stock awards earned under our Bonus Plan with respect to the second performance period in fiscal 2011 as follows: Mr.
Orr ($275,006); Mr. Galvin ($96,141); Mr. Melkote ($115,501). There were no stock awards earned with respect to the first and second performance periods in fiscal 2012.
(6) Includes stock awards earned under our Bonus Plan with respect to the second performance period in fiscal 2010 and the first performance period in fiscal 2011 as follows: Mr. Orr (fiscal 2010: $275,003; fiscal 2011: $249,998); Mr. Galvin (fiscal 2010: $64,625; fiscal 2011: $77,099); Mr. Melkote (fiscal 2010: $77,003; fiscal 2011: $104,985).
(7) Mr. Orr received a reimbursement for unused amounts under his health care flexible spending account and a gross-up for the payment of taxes with respect to such reimbursement.
(8) Mr. Galvin’s fiscal 2011 base salary includes a retroactive payment in the amount of $16,250 related to the increase in his salary effective April 1, 2011. This retroactive payment was paid to Mr. Galvin in fiscal 2012.
(9) Mr. Kirby was appointed as an executive officer on June 7, 2012. Accordingly, only information beginning with fiscal 2012 is provided with respect to Mr. Kirby.
(10) Mr. Kirby did not participate in the Bonus Plan for fiscal 2013. He received a short-term equity grant of restricted stock unit awards in recognition of his sales achievements prior to his fiscal 2012 promotion to Vice President, Worldwide Sales.
Proxy
Statement

50
(11) Represents sales commissions received pursuant to Mr. Kirby’s sales incentive plan.(12) Reflects long-term equity plan awards granted to Mr. Kirby in fiscal 2012. Mr. Kirby does not participate in our Bonus Plan.(13) Mr. Kirby received a payment in fiscal 2012 of $45,000 to reimburse him for the costs associated with leasing a car that was used
for Company business, as well as an additional payment of $18,920 to cover the taxes associated with such reimbursement payment.
Grants of Plan-Based Awards in Fiscal 2013 Table
The following table presents information concerning each grant of an award made to a named executive officer in fiscal 2013 under any plan.
NameGrantDate
Estimated Possible Payouts UnderEquity Incentive Plan Awards(1)(2) All Other Stock
Awards: Number of
Shares of Stock or Units
(#)
All Other Option
Awards: Number of Securities
Underlying Options
Exercise or Base Price of Option Awards($/Sh)
Grant DateFair Value
of Stock andOption
Awards ($)(3)
Threshold($)
Target($)
Maximum($)
Dominic P. Orr — — 600,000 660,000 — — — —Michael M. Galvin — — 236,250 259,875 — — — —Keerti Melkote — — 210,000 231,000 — — — —Michael Kirby 1/11/2013 — — — 20,000 — — 451,400
(1) Reflects the dollar value of “target” and “maximum” bonus levels for fiscal 2013 under our executive officer bonus plan, which
provides for awards of restricted stock units based on the achievement of corporate performance objectives. The amounts range from zero (if the minimum level for financial performance is not achieved) to a cap based on a certain percentage of the individual named executive officer’s bonus target. The number of shares of our common stock subject to a restricted stock unit award is determined based on the dollar value attributable to the named executive officer’s bonus for a given performance period, divided by the closing price per share of our common stock on the NASDAQ Global Market on the date of grant. The executive officer bonus plan is described more fully above in “Compensation Discussion and Analysis — Base Salary and Variable Incentive Awards — Variable Incentive Awards, Commissions, and Other Bonuses.”
(2) The following restricted stock unit awards were earned under our Bonus Plan for the first performance period in fiscal 2013 and granted on March 15, 2013: Mr. Orr (9,709 restricted stock units with a grant date fair value of $250,007); Mr. Galvin (4,587 restricted stock units with a grant date fair value of $118,115); Mr. Melkote (4,078 restricted stock units with a grant date fair value of $105,009). The following restricted stock units were earned under our Bonus Plan for the second performance period in fiscal 2013 and granted in fiscal 2014: Mr. Orr (15,298 restricted stock units with a grant date fair value of $270,010); Mr. Galvin (4,533 restricted stock units with a grant date fair value of $80,007); Mr. Melkote (5,355 restricted stock units with a grant date fair value of $94,516). Because stock awards earned under our Bonus Plan with respect to the second performance period in fiscal 2013 were granted in the first quarter of fiscal 2014, such awards will be disclosed in next year's Summary Compensation Table as compensation for fiscal 2014.
(3) Reflects the grant date fair value of each equity award computed in accordance with FASB ASC Topic 718. The assumptions used in the valuation of these awards are set forth in the notes to our consolidated financial statements, which are included in our Annual Report on Form 10-K for the fiscal year ended July 31, 2013, filed with the SEC on September 24, 2013. These amounts do not purport to reflect the actual value that will be recognized by the named executive officers upon sale of the underlying securities.

51
Outstanding Equity Awards at Fiscal 2013 Year-End Table
The following table presents information concerning outstanding unexercised options to purchase shares of our common stock and unvested restricted stock unit awards for each named executive officer as of July 31, 2013.
Option Awards Stock Awards
Number of Securities
Number ofShares orUnits of
Market Value ofShares or Units
Underlying Unexercised Option Option Stock That of Stock ThatOptions (#) Exercise Expiration Have Not Have Not
Name Grant Date(1) Exercisable Unexercisable Price ($) Date Vested (#) Vested ($)(2)Dominic P. Orr 4/18/2006(3) 4,569,443 — 2.25 4/17/2016 — —
6/12/2009 600,000 — 7.58 6/11/2016 — —10/14/2011(4) 65,625 84,375 24.53 10/13/2018 — —7/13/2012(5) — — — — 300,000 5,334,000
Michael M. Galvin 12/12/2008 23,333 — 2.17 12/11/2015 — —3/17/2009 18,472 — 2.91 3/16/2016 — —11/13/2009 2,083 4,167 9.43 11/12/2016 — —
1/14/2011(6) — — — — 15,000 266,70010/14/2011(7) — — — — 69,302 1,232,19010/14/2011(8) — — — — 28,125 500,0637/13/2012(5) — — — — 56,250 1,000,125
Keerti Melkote 12/12/2008 11,000 — 2.17 12/11/2015 — —6/12/2009 178,000 — 7.58 6/11/2016 — —
7/13/2012(5) — — — — 112,500 2,000,250Michael Kirby 9/16/2011(9) — — — — 72,674 1,292,144
10/14/2011(8) — — — — 28,125 500,0634/13/2012(10) — — — — 3,600 64,0087/13/2012(5) — — — — 56,250 1,000,1251/11/2013(11) — — — — 20,000 355,600
(1) Unless otherwise indicated, all options granted to our named executive officers were granted under the 2007 Equity Incentive
Plan and vest over a four-year period, at a rate of 1/4th upon the first anniversary of the grant date and then at a rate of 1/48th per month thereafter.
(2) Market value of shares or units of stock that have not vested was computed by multiplying $17.78, the closing price on the Nasdaq Global Market of common stock on July 31, 2013, by the number of shares or units of stock.
(3) Option was granted under the 2002 Stock Plan.(4) Options vest 1/48th per month over a four-year period.(5) Restricted stock units vest over a four-year period, at a rate of 1/16th per quarter beginning September 15, 2012.(6) Restricted stock units vest over a four-year period, at a rate of 1/4th per year beginning March 15, 2011.(7) Restricted stock units vest over a four-year period, at a rate of 1/4th per year beginning on March 15, 2012.(8) Restricted stock units vest over a four-year period, at a rate of 1/4th per year beginning on June 15, 2012.(9) Restricted stock units vest over a four-year period, at a rate of 1/16th per quarter beginning June 15, 2012. (10) Restricted stock units vest over a two-year period, at a rate of 1/8th per quarter from March 15, 2012.(11) Restricted stock units vested in full on 8/15/2013.
Proxy
Statement

52
Fiscal 2013 Option Exercises and Stock Vested Table
The following table presents certain information regarding the number of shares acquired and the value realized by each named executive officer during fiscal 2013, upon the exercise of stock options and the vesting of stock awards.
Option Awards Stock Awards
Name
Number of SharesAcquired onExercise (#)
Value Realizedon Exercise ($)(1)
Number of SharesAcquired on Vesting
(#)Value Realized on
Vesting ($)(2)Dominic P. Orr 160,000 3,360,428 179,709 3,811,989Michael M. Galvin 12,500 127,431 77,989 1,816,820Keerti Melkote 115,000 1,868,690 41,578 887,395Michael Kirby 360,000 3,682,725 97,387 1,849,059
(1) Reflects the difference between the fair market value of the Company’s common stock at the time of exercise and the exercise
price of the option.(2) Reflects the fair market value of the Company’s common stock on the vesting date of the restricted stock unit.
Potential Payments upon Termination or Change of Control
Termination or Change of Control Arrangements
The Change of Control Severance Policy provides that if there is a change in control of the Company and an executive officer’s employment terminates as a result of an involuntary termination without cause within 12 months following such change in control, then the executive officer will receive various payments and benefits.
• First, 50% of the then-unvested shares of our common stock subject to such executive officer’s then-outstanding equity awards will immediately vest and, in the case of options and stock appreciation rights, shall become exercisable.
• Second, subject to certain conditions such as signing and not revoking a release of claims, such executive officer will receive a lump sum severance payment in cash equal to a percentage of his or her annual base salary as in effect immediately prior to their termination date. Our CEO receives 100% of his or her annual base salary while our other executive officers receive 50% of their annual base salary.
• Third, subject to certain conditions, the Company will pay, for a limited time, the cost of COBRA to continue the health coverage for such executive officers. The CEO receives 12 months of coverage and our other executive officers receive six months of coverage.
The Change of Control Severance Policy supersedes the prior severance and change of control arrangements for our executive officers that were triggered by a change in control of the Company. Mr. Orr also has a severance arrangement that is not related to a change of control, however pursuant to his employment agreement. This additional arrangement was necessary to recruit Mr. Orr and was negotiated at arms length in connection with his joining the Company.
Mr. Orr entered into his employment agreement with the Company in April 2006, which was subsequently amended in December 2008 and March 2010. With respect to severance arrangements not tied to a change of control, Mr. Orr’s employment agreement provides that if his employment is terminated by the Company without “cause” or he resigns for “good reason,” and he signs and does not revoke a release of claims against the Company, he will receive acceleration of his then-outstanding and unvested equity awards

53
in an amount equal to the number of shares of our common stock that would have vested over the six-month period immediately following his termination of employment.
Pursuant to Mr. Orr’s employment agreement, “cause” means (i) an indictment or conviction of any felony or of any crime involving dishonesty; (ii) participation in any fraud against the Company; (iii) material breach of Mr. Orr’s duties to the Company; or (iv) conduct by Mr. Orr which in the good faith and reasonable determination of our Board of Directors demonstrates gross unfitness to serve. Pursuant to Mr. Orr’s employment agreement, he will have “good reason” for resignation if any of the following occurs without his consent, and he notifies the Company in writing, within 14 days after the occurrence of one of the following events, that he intends to terminate his employment no earlier than 30 days after providing such notice: (i) the assignment to him of any duties or responsibilities which result in the material diminution of Mr. Orr’s position; provided, however, that the acquisition of the Company and subsequent conversion of the Company to a division or unit of the acquiring corporation will not by itself result in a diminution of his position; (ii) a reduction by the Company in his annual base salary by greater than 10%, except to the extent the base salaries of all other executive officers of the Company are accordingly reduced; (iii) a relocation of his place of work, or the Company’s principal executive offices if his principal office is at such offices, to a location that increases his daily one-way commute by more than 35 miles; (iv) any material breach by the Company of his employment agreement, which breach remains uncured by the Company following at least 30 days advance written notice by him; or (v) any failure by the Company to obtain the assumption of his employment agreement by any successor or assign of the Company.
Pursuant to Mr. Orr's employment agreement, a “change in control” means any one or more of the following events: (a) the consummation of a merger, consolidation or similar transaction involving (directly or indirectly) the Company and, immediately after the consummation of such merger, consolidation or similar transaction, the shareholders of the Company immediately prior thereto do not own, directly or indirectly, either (i) outstanding voting securities representing a majority of the combined outstanding voting power of the surviving entity in such merger, consolidation or similar transaction or (ii) a majority of the combined outstanding voting power of the parent of the surviving entity in such merger, consolidation or similar transaction, in each case in substantially the same proportions as their ownership of the outstanding voting securities of the Company immediately prior to such transaction; or (b) the consummation of a sale, lease, exclusive license or other disposition of all or substantially all of the consolidated assets of the Company and its subsidiaries, other than a sale, lease, license or other disposition of all or substantially all of the consolidated assets of the Company and its subsidiaries to an entity, a majority of the combined voting power of the voting securities of which are owned by the shareholders of the Company in substantially the same proportions as their ownership of the outstanding voting securities of the Company prior to such sale, lease, license or other disposition.
Estimated Payments upon Termination or Change of Control
The following table provides information concerning the estimated payments and benefits that would be provided in the circumstances described above for each of the named executive officers. Payments and benefits are estimated assuming that the triggering event took place on the last business day of fiscal 2013 (July 31, 2013), and the price per share of our common stock is the closing price on the NASDAQ Global Market as of that date ($17.78). There can be no assurance that a triggering event would produce the same or similar results as those estimated below if such event occurs on any other date or at any other price, of if any other assumption used to estimate potential payments and benefits is not correct. Due to the number of factors that affect the nature and amount of any potential payments or benefits, any actual payments and benefits may be different.
Proxy
Statement

54
Potential Payments Upon InvoluntaryTermination Other Than for Cause or
Voluntary Termination for Good Reason(1)
Name Type of Benefit
Not in ConnectionWith a Change of
Control ($)
Within 12 MonthsAfter a
Change of Control ($)Dominic P. Orr Vesting Acceleration 889,000(2) 2,667,000
Cash Severance – Base Pay — 400,000Continued Coverage – Employee Benefits — 8,775
Michael M. Galvin Vesting Acceleration — 1,516,936Cash Severance – Base Pay — 157,500Continued Coverage of Employee Benefits — 13,316
Keerti Melkote Vesting Acceleration — 1,000,125Cash Severance – Base Pay — 140,000Continued Coverage of Employee Benefits — 13,316
Michael Kirby Vesting Acceleration — 1,605,970Cash Severance – Base Pay — 157,500Continued Coverage of Employee Benefits — 13,316
(1) Reflects the aggregate market value of outstanding unvested options to purchase shares of our common stock with exercise prices
less than $17.78 per shares (“in-the-money options”) and outstanding restricted stock unit awards. For in-the-money options, the aggregate market value is computed by multiplying (i) the difference between $17.78 and the exercise price of such in-the-money option by (ii) the number of shares of our common stock underlying such in-the-money options at July 31, 2013. Does not reflect any market value for options to purchase shares of our common stock with exercise prices in excess of $17.78 per share. For restricted stock unit awards, aggregate market value is computed by multiplying (i) the number of unvested shares at July 31, 2013, by (ii) $17.78.
(2) Subject to certain conditions, Mr. Orr is eligible to receive six months of vesting acceleration benefits.

55
Compensation of Directors
The following table provides information concerning the compensation paid by us to each of our non-employee directors for fiscal 2013. Dominic P. Orr and Keerti Melkote, who are our employees, do not receive additional compensation for their service as directors.
NameStock Awards
($)(1)(2)Option Awards
($)(1)(2)Non-Equity
Compensation Total ($)Bernard Guidon 249,997 — — 249,997Emmanuel Hernandez 249,997 — — 249,997Michael R. Kourey 240,003 — — 240,003Willem P. Roelandts 247,994 — — 247,994Juergen Rottler 240,003 — — 240,003Daniel Warmenhoven 252,000 — — 252,000
(1) Reflects the aggregate grant date fair value of the equity awards granted in fiscal 2013, in accordance with FASB ASC Topic 718.
The assumptions used in the valuation of these awards are set forth in the notes to the Company’s consolidated financial statements, which are included in the Company’s Annual Report on Form 10-K for the year ended July 31, 2013, filed with the SEC on September 24, 2013. These amounts do not necessarily correspond to the actual value that will be recognized by the non-employee directors in connection with these awards.
(2) In fiscal 2013, our non-employee directors received the following options to purchase common stock and restricted stock unit awards:
Name Grant Date
Number of SharesUnderlyingOptions (#)
Number ofRestricted Stock
Units (#)
Per Share GrantDate Fair Value
($)Bernard Guidon 11/29/2012 — 12,607 19.83Emmanuel Hernandez 11/29/2012 — 12,607 19.83Michael R. Kourey 11/29/2012 — 12,103 19.83Willem P. Roelandts 11/29/2012 — 12,506 19.83Juergen Rottler 11/29/2012 — 12,103 19.83Daniel Warmenhoven 11/29/2012 — 12,708 19.83
As of July 31, 2013, the aggregate number of shares of our common stock underlying outstanding options and unvested stock awards for each of our non-employee directors was:
Name
Aggregate Number ofShares Underlying
Outstanding Options(#)
Aggregate Number ofShares Underlying
Unvested Stock Awards(#)
Bernard Guidon — 18,261Emmanuel Hernandez 79,123 12,607Michael R. Kourey 52,500 17,710Willem P. Roelandts 65,000 18,300Juergen Rottler 25,000 17,710Daniel Warmenhoven 70,000 18,595
Standard Director Compensation Arrangements
The Company uses equity compensation to attract and retain qualified candidates to serve on our Board of Directors. The Compensation Committee conducts an annual review of director compensation and, if appropriate, recommends any changes in the type or amount of compensation to our Board of Directors. Any change in director compensation is approved by our Board of Directors. Our Board of Directors has not delegated any authority or responsibility to non-directors with respect to Board of Directors compensation.
Proxy
Statement

56
Equity Compensation
Members of our Board of Directors that are not employees of the Company (“outside directors”) receive equity awards that are granted automatically each fiscal year pursuant to the Company’s Outside Director Compensation Policy, which provides that, except for initial grants in connection with the appointment of an outside director, equity compensation is based on fixed value amounts, rather than a fixed number of shares and options, and such equity compensation is to be delivered in the form of restricted stock unit awards for shares of our common stock and, in certain circumstances, options to purchase shares of our common stock.
Upon appointment to our Board of Directors, an outside director will receive a restricted stock unit award with an aggregate value equal to $460,000 on the date of grant, vesting annually over four years. In addition, annually each outside director will receive an option and/or restricted stock unit award with an aggregate value of $230,000 on the date of the annual meeting of stockholders, if as of such date, he or she will have served on our Board of Directors for at least the preceding six months. On the date of the annual meeting of stockholders, each outside director serving on any of the committees of our Board of Directors will also receive an option and/or restricted stock unit award with an aggregate value as follows: (1) $20,000 for the chair of the Audit Committee and $10,000 for any non-chair member of the Audit Committee; (ii) $12,000 for the chair of the Compensation Committee and $8,000 for any non-chair member of the Compensation Committee; (3) $6,000 for the chair of the Corporate Governance and Nominating Committee and $6,000 for any non-chair member of the Corporate Governance and Nominating Committee; and (4) $6,000 for any member, whether chair or non-chair, of any other standing committee of our Board of Directors. In addition, on the date of the annual meeting of stockholders, the Lead Independent Director will also receive an option and/or restricted stock unit award with an aggregate value of $10,000. Each award under the Outside Director Compensation Policy is governed by the terms of the 2007 Equity Incentive Plan.
The Outside Director Compensation Policy provides that 40% of the aggregate value of the value-based awards granted to an outside director may be granted in the form of a restricted stock unit award (“40% Value RSU Award”) and the remaining 60% of the aggregate value may be granted in the form of either a restricted stock unit award (“60% Value RSU Award”) or an option (“60% Value Option Award”), at the election of the applicable outside director. An outside director must make an election before the date of the annual meeting of stockholders if he or she wishes to receive 60% of the aggregate value in the form of a restricted stock unit award, otherwise the outside director will be deemed to have elected to receive 60% of the aggregate value in the form of an option. Determination of value for purposes of calculating the number of shares of our common stock subject to a restricted stock unit award or an option is based on the fair market value of a share of our common stock in the case of restricted stock unit award, and based on the Black-Scholes option valuation methodology in the case of an option. Any option to purchase shares of our common stock granted under the Outside Director Compensation Policy will have a seven year term. Subject to the terms of the 2007 Equity Incentive Plan, each 40% Value RSU Award will vest in full in one installment after one year, provided that the outside director continues to serve as a director through the end of such one-year period. However, in the event of the death, disability or voluntary resignation of the outside director or the Company’s termination of the outside director’s status as a director (other than for cause), the 40% RSU Value Award will become vested on a pro-rata basis. Subject to the terms of the 2007 Equity Incentive Plan, each 60% Value RSU Award will vest in equal annual installments over a four year period, provided that the outside director continues to serve as a director through each applicable vesting date. Subject to the terms of the 2007 Equity Incentive Plan, each 60% Value Option Award will vest and become exercisable as to 1/48th of the shares of our common stock subject to the award on each monthly anniversary of the grant date, provided that the outside director continues to serve as a director through each applicable vesting date. Vested restricted stock unit awards will be paid in shares of our common stock as soon as practicable after vesting.
Other Arrangements
Our non-employee directors are reimbursed for travel and associated expenses incurred in connection with attending Board of Director and Committee meetings.

57
Equity Compensation Plan Information
The following table summarizes the number of outstanding options, warrants and rights granted, as well as the number of shares of our common stock remaining available for future issuance, under the Company’s equity compensation plans as of July 31, 2013.
Plan Category
(a)Number of Securities
to be Issued UponExercise of
Outstanding Options,Warrants and Rights
(#)
(b)Weighted AverageExercise Price of
Outstanding Options,Warrants and Rights
($)
(c)Number of SecuritiesRemaining Availablefor Future Issuance
Under EquityCompensation PlansExcluding Securities
Reflected in Column (a)(#)(3)(4)
Equity compensation plans approvedby security holders 20,814,127(1) 6.30 5,247,385(2)
Equity compensation plans notapproved by security holders — — —
Equity compensation plans assumedin connection with acquisitions 21,196(5) 0.70 —
Total 20,835,323 5,247,385 (1) This amount includes 10,787,754 shares of restricted stock units outstanding with a weighted average exercise price of $0.0001.(2) This amount includes 4,689,800 shares available for future issuance under the Company’s Employee Stock Purchase Plan (“ESPP”) and 557,585
shares available for future issuance under the 2007 Equity Incentive Plan.(3) The Company’s 2007 Equity Incentive Plan incorporates an evergreen formula pursuant to which on August 1 of each year the aggregate number
of shares reserved for issuance under the 2007 Equity Incentive Plan will increase by a number of shares equal to the lesser of (A) fifteen million (15,000,000) shares, or (B) five percent (5%) of the outstanding shares on the last day of the immediately preceding fiscal year.
(4) The ESPP incorporates an evergreen formula pursuant to which on August 1 of each year the aggregate number of shares reserved for issuance under the ESPP will increase by a number of shares equal to the lesser of (A) six million (6,000,000) shares, or (B) two percent (2%) of the outstanding shares on the last day of the immediately preceding fiscal year.
(5) As of July 31, 2013, options to purchase an aggregate of 21,196 shares of the Company’s Common Stock at a weighted average exercise price of $0.70 per share were outstanding under the AirWave Wireless, Inc. 2000 Stock Plan, which options were assumed in connection with the Company’s acquisition of AirWave Wireless, Inc. No further grants or awards will be made under the assumed equity compensation plan.
Proxy
Statement

58
SECURITY OWNERSHIP OF CERTAIN BENEFICIAL OWNERS AND MANAGEMENT
The following table sets forth certain information regarding the beneficial ownership of the Company’s Common Stock, as of October 15, 2013, for the following:
• each person (or group of affiliated persons) who is known by the Company to beneficially own 5% of the outstanding shares of the Company’s Common Stock;
• each of the Company’s non-employee directors;
• each of the Company’s named executive officers; and
• all of the Company’s directors and current executive officers as a group.
Shares Beneficially Owned(2)Name of Beneficial Owner(1) Number of Shares % of class5% Stockholders:
T. Rowe Price Associates, Inc.(3) 10,512,229 9.6%100 E. Pratt StreetBaltimore, Maryland 21202
Fidelity Management & Research Co.(4) 8,073,211 7.3%82 Devonshire StreetBoston, MA 02109
BlackRock Fund Advisors(5) 6,118,285 5.6%40 East 52nd StreetNew York, NY 10022
The Vanguard Group(6) 6,101,762 5.5%100 Vanguard Blvd.Malvern, PA19355
Non-Employee Directors:Bernard Guidon 14,527 *Emmanuel Hernandez(7) 70,710 *Michael R. Kourey(8) 44,354 *Willem P. Roelandts(9) 82,083 *Juergen Rottler(10) 10,417 *Daniel Warmenhoven(11) 82,282 *
Named Executive Officers:Dominic P. Orr(12) 6,750,704 5.9%Michael M. Galvin(13) 146,871 *Keerti Melkote(14) 1,432,596 1.3%Michael Kirby 543,553 *All directors and current executive officers as a group (10 persons) (15) 9,178,097 8.1%
* Represents less than 1%.(1) Unless otherwise indicated in the table, the address for each listed person is c/o Aruba Networks, Inc., 1344 Crossman Avenue,
Sunnyvale, California 94089.(2) The number and percentage of shares beneficially owned is determined under rules of the SEC, and the information is not
necessarily indicative of beneficial ownership for any other purpose. Under such rules, beneficial ownership includes any shares as to which the individual has sole or shared voting power or investment power and also any shares which the individual has the right to acquire within 60 days of October 15, 2013, including but not limited to, upon the exercise of any options or the vesting and release of restricted stock units. Unless otherwise indicated in the footnotes, each person has sole voting and investment power (or shares such powers with his or her spouse) with respect to the shares shown as beneficially owned.

59
Percentage beneficially owned is based on 110,092,031 shares of Common Stock outstanding on October 15, 2013.(3) Beneficial ownership information is based on information contained in a Form 13F dated June 30, 2013 and filed by T. Rowe
Price Associates, Inc. (4) Beneficial ownership information is based on information contained in a Form 13F dated June 30, 2013 and filed by FMR.(5) Beneficial ownership information is based on information contained in a Form 13F dated June 30, 2013 and filed by BlackRock
Fund.(6) Beneficial ownership information is based on information contained in a Form 13F dated June 30, 2013 and filed by The
Vanguard Group, Inc. (7) Consists of 5,192 shares held of record by Mr. Hernandez and 65,518 shares subject to options that are exercisable within 60
days of October 15, 2013.(8) Consists of 6,854 shares held of record by Mr. Kourey and 37,500 shares subject to options that are exercisable within 60 days
of October 15, 2013.(9) Consists of 22,083 shares held of record by the Willem P Roelandts Trust and 60,000 shares subject to options that are
exercisable within 60 days of October 15, 2013.(10) All such shares are subject to options that are exercisable within 60 days of October 15, 2013.(11) Consists of 7,197 shares held of record by Mr. Warmenhoven, 11,335 shares held of record by the Warmenhoven Revocable
Trust and 63,750 shares subject to options that are exercisable within 60 days of October 15, 2013.(12) Consists of (i) 235,554 shares held of record by Ardmore Ventures, (ii) 300,000 shares held of record by Omano Ventures,
(iii) 2,350 shares held of record by D. Orr Management Company, LLC, (iv) 784,907 shares held of record by Dominic P. Orr Revocable Living Trust, (v) 127,500 shares held by Dominic Orr Charitable Remainder Trust, (vi) 50,000 shares held by the Orr Family Foundation and (vii) 5,250,693 shares subject to options that are exercisable within 60 days of October 15, 2013.
(13) Consists of 101,941 shares held of record by The Galvin Family 2005 Trust and 44,930 shares subject to options that are exercisable within 60 days of October 15, 2013.
(14) Consists of (i) 2,688 shares held of record by Mr. Melkote, (ii) 1,233,948 shares held of record by the Melkote Family Trust, (iii) 304 shares held of record by Mr. Melkote’s wife, (iv) 6,656 shares held of record by trusts for the benefit of Mr. Melkote’s children, (v) 189,000 shares subject to options that are exercisable by Mr. Melkote within 60 days of October 15, 2013.
(15) Includes 5,721,808 shares subject to options that are exercisable within 60 days of October 15, 2013.
Proxy
Statement

60
CERTAIN RELATIONSHIPS AND RELATED PERSON TRANSACTIONS
Review, Approval or Ratification of Related Person Transactions
In accordance with our Code of Business Conduct, our Corporate Governance Principles and the charter of the Audit Committee, the Audit Committee reviews and approves in advance in writing any proposed related person transaction. For purposes of these procedures, “related person” and “transaction” have the meanings contained in Item 404 of Regulation S-K.
The Audit Committee reviews the proposed transaction and makes additional inquiries where appropriate, keeping in mind that any dealings with a related person must be conducted in such a way that no preferential treatment is given to the Company. Following the completion of its review, the Audit Committee either approves or disapproves the transaction; provided, however, that the most significant related person transactions, particularly those involving our directors and officers, must be reviewed and approved in writing in advance by the Board of Directors. The Company will report all such related person transactions under applicable accounting rules, federal securities laws and SEC rules and regulations.
The Company has entered into indemnification agreements with each of its directors and executive officers. With certain exceptions, these agreements provide for indemnification for related expenses including, among other things, attorneys’ fees, judgments, fines and settlement amounts incurred by any of such individuals in any action or proceeding.
SECTION 16(a) BENEFICIAL OWNERSHIP REPORTING COMPLIANCE
Section 16(a) of the Exchange Act requires the Company’s executive officers and directors, and persons who own more than 10% of a registered class of the Company’s equity securities (“10% Stockholders”), to file reports of ownership on Form 3 and changes in ownership on Form 4 or Form 5 with the SEC. Such executive officers, directors and 10% Stockholders are also required by SEC rules to furnish the Company with copies of all such forms that they file.
Based solely on its review of the copies of such forms and amendments thereto furnished to the Company and written representations that no other forms were required to be filed during fiscal 2013, the Company believes that its executive officers, directors and 10% Stockholders have complied with all Section 16(a) filing requirements applicable to them, except Mr. Melkote filed one late Form 4 (reporting one transaction).

61
AUDIT COMMITTEE REPORT
The primary role of the Audit Committee is to assist the Board of Directors in fulfilling its oversight responsibilities by reviewing the Company’s financial reporting, systems of internal control and audit process, and monitoring compliance with applicable laws, regulations and policies. In the performance of its oversight function, the Audit Committee has:
• reviewed and discussed the audited consolidated financial statements for the fiscal year ended July 31, 2013 with the Company’s management, which has primary responsibility for those statements;
• discussed with PricewaterhouseCoopers LLP, the Company’s independent registered public accounting firm, the matters required to be discussed by Statement on Auditing Standards No. 61, as amended (AICPA, Professional Standards, Vol. 1, AU Section 380, as adopted by the Public Company Accounting Oversight Board (“PCAOB”) in Rule 3200T); and
• received and reviewed the written disclosures and the letter from PricewaterhouseCoopers LLP, required by PCAOB Rule 3526 regarding the independent accountant’s communications with the audit committee concerning independence, and has discussed with PricewaterhouseCoopers LLP its independence.
Based upon the review and discussions described in this Report, the Audit Committee recommended to the Board of Directors that the audited consolidated financial statements be included in the Company’s Annual Report on Form 10-K for the fiscal year ended July 31, 2013.
Respectfully submitted by the members of the Audit Committee of the Board of Directors:
Emmanuel Hernandez (Chairman)Michael R. KoureyJuergen Rottler
Proxy
Statement
62
OTHER MATTERS
The Company knows of no other matters to be submitted at the Annual Meeting. If any other matters properly come before the Annual Meeting, the proxy holders will vote the shares they represent in accordance with their best judgment. Discretionary authority with respect to any such other matters is granted by the execution of the proxy, whether through telephonic or Internet voting or, alternatively, by using a paper copy of the proxy card that has been requested.
It is important that your shares be represented at the Annual Meeting, regardless of the number of shares that you hold. You are, therefore, urged to vote by telephone or by using the Internet as instructed on the proxy card or, if so requested, by executing and returning, at your earliest convenience, the requested proxy card in the envelope that will have been provided.
THE BOARD OF DIRECTORS
Sunnyvale, CaliforniaOctober 25, 2013

Aruba Networks, Inc.2013 Annual Report A
nnualReport

[THIS PAGE INTENTIONALLY LEFT BLANK]

UNITED STATESSECURITIES AND EXCHANGE COMMISSION
Washington, D.C. 20549_________________________________________________
FORM 10-K _________________________________________________
ANNUAL REPORT PURSUANT TO SECTION 13 OR 15(d) OF THE SECURITIES EXCHANGE ACTOF 1934
For the fiscal year ended July 31, 2013
OR
TRANSITION REPORT PURSUANT TO SECTION 13 OR 15(d) OF THE SECURITIES EXCHANGEACT OF 1934
For the transition period from to
Commission file number: 001-33347_________________________________________________
Aruba Networks, Inc.(Exact name of registrant as specified in its charter)
_________________________________________________
Delaware 02-0579097(State or Other Jurisdiction of
Incorporation or Organization) (I.R.S. Employer
Identification Number)
1344 Crossman Ave.Sunnyvale, California 94089-1113
(408) 227-4500(Address, including zip code, and telephone number, including area code, of registrant’s principal executive offices)
Securities registered pursuant to Section 12(b) of the Act:
Title of Each Class Name of Exchange on Which Registered
Common Stock, par value $0.0001 per share
The NASDAQ Stock Market LLC(NASDAQ Global Select Market)
Securities registered pursuant to 12(g) of the Act:None
_________________________________________________ Indicate by check mark if the registrant is a well-known seasoned issuer, as defined in Rule 405 of the Securities Act. Yes No
Indicate by check mark if the registrant is not required to file reports pursuant to Section 13 or Section 15(d) of the Act. Yes No
Indicate by check mark whether the registrant (1) has filed all reports required to be filed by Section 13 or 15(d) of the Securities Exchange Act of 1934 during the preceding 12 months (or for such shorter period that the registrant was required to file such reports), and (2) has been subject to such filing requirements for the past 90 days. Yes No
Indicate by check mark whether the registrant has submitted electronically and posted on its corporate Web site, if any, every Interactive Data File required to be submitted and posted pursuant to Rule 405 of Regulation S-T (§ 232.405 of this chapter) during the preceding 12 months (or for such shorter period that the registrant was required to submit and post such files). Yes No
AnnualR
eport

Indicate by check mark if disclosure of delinquent filers pursuant to Item 405 of Regulation S-K is not contained herein, and will not be contained, to the best of registrant’s knowledge, in definitive proxy or information statements incorporated by reference in Part III of this Form 10-K or any amendment to this Form 10-K.
Indicate by check mark whether the registrant is a large accelerated filer, an accelerated filer, a non-accelerated filer, or a smaller reporting company. See the definitions of “large accelerated filer,” “accelerated filer” and “smaller reporting company” in Rule 12b-2 of the Exchange Act. (Check one):
Large accelerated filer Accelerated filer
Non-accelerated filer (Do not check if a smaller reporting company) Smaller reporting company
Indicate by check mark whether the registrant is a shell company (as defined in Rule 12b-2 of the Exchange Act). Yes No
As of January 31, 2013, the last business day of the registrant’s most recently completed second fiscal quarter, the aggregate market value of the registrant’s common stock held by non-affiliates was approximately $2,536,657,275, based on the closing price of such stock reported for such date on the NASDAQ Global Select Market. This calculation does not reflect a determination that persons are affiliates for any other purposes.
The number of outstanding shares of the registrant’s common stock was 115,320,577 as of September 18, 2013._________________________________________________
DOCUMENTS INCORPORATED BY REFERENCE
Portions of the registrant’s Proxy Statement for the 2013 Annual Meeting of Stockholders to be filed with the Securities and Exchange Commission within 120 days after the end of the registrant’s fiscal year ended July 31, 2013 are incorporated by reference into Part III of this Annual Report on Form 10-K.

2
ARUBA NETWORKS, INC.INDEX
Page
PART IItem 1.Item 1A.Item 1B.Item 2.Item 3.Item 4.
PART IIItem 5.
Item 6.Item 7.Item 7A.Item 8.Item 9.Item 9A.Item 9B.
PART IIIItem 10.Item 11.Item 12.Item 13.Item 14.
PART IVItem 15.
Business 4Risk Factors 12Unresolved Staff Comments 34Properties 34Legal Proceedings 34Mine Safety Disclosures 34
Market for Registrant’s Common Equity, Related Stockholder Matters and Issuer Purchases of Equity Securities
35
Selected Consolidated Financial Data 38Management’s Discussion and Analysis of Financial Condition and Results of Operations 40Quantitative and Qualitative Disclosures About Market Risk 59Consolidated Financial Statements and Supplementary Data 60Changes in and Disagreements With Accountants on Accounting and Financial Disclosure 98Controls and Procedures 98Other Information 98
Directors, Executive Officers and Corporate Governance 98Executive Compensation 98Security Ownership of Certain Beneficial Owners and Management and Related Stockholder Matters 98Certain Relationships and Related Transactions and Director Independence 99Principal Accountant Fees and Services 99
Exhibits and Financial Statement Schedule 99Signatures 100Index to Exhibits 101
AnnualR
eport

3
In addition to historical information, this report contains forward-looking statements within the meaning of Section 27A of the Securities Act of 1933 and Section 21E of the Securities Exchange Act of 1934. You can identify these forward-looking statements by words such as “anticipate,” “believe,” “continue,” “could,” “estimate,” “expect,” “intend,” “may,” “plan,” “predict,” “potential,” “should,” “will,” “would” and other similar expressions. These statements include, among other things, statements concerning our expectations:
• that revenue from our indirect channels will continue to constitute a significant majority of our future revenue;• that the number of mobile devices will grow exponentially;• that competition will intensify in the future as other companies introduce new products in the same markets we serve or
intend to enter;• that our product offerings, in particular our Mobile Virtual Enterprise ("MOVE") architecture, including our new
ClearPass and Aruba Instant products, will enable broader networking initiatives by both our current and potential customers;
• that we will increase offshore operations by establishing additional offshore capabilities for certain engineering and general and administrative functions in China, India and Ireland;
• that within our indirect channel, sales through our value-added distributors, ("VADs"), and original equipment manufacturers ("OEMs"), will continue to be significant;
• that international revenue will increase in absolute dollars and as a percentage of total revenue in fiscal 2014 compared with fiscal 2013;
• that research and development expenses for fiscal 2014 will increase on an absolute dollar basis and as a percentage of revenue compared with fiscal 2013;
• that we intend to continue to invest significantly in our research and development efforts;• that sales and marketing expenses for fiscal 2014 will continue to be our most significant operating expense and will
increase on an absolute dollar basis as we continue to invest strategically in this area and will increase as a percentage of revenue compared with fiscal 2013;
• that general and administrative expenses for fiscal 2014 will increase on an absolute dollar basis and decrease as a percentage of revenue compared with fiscal 2013;
• that we have incurred in the past, and may continue to incur, significant legal costs defending ourselves against claims made by third parties and depending on the timing and outcome of lawsuits and the legal process, legal costs and any resulting damages could have a significant impact on our financial statements;
• that our existing cash, cash equivalents, short-term investments and cash generated from operations will be sufficient to meet anticipated cash requirements for at least the next 12 months;
• that we do not plan to incur any material capital expenditures for environmental control facilities in fiscal year 2014;• that we will ensure the safety and preservation of our invested funds by limiting default risk, market risk and
reinvestment risk; and• that we will increase our market penetration and extend our geographic sales reach both domestically and
internationally through our network of channel partners and by increasing our direct sales force.
These forward-looking statements are based on information available to us as of the date of this report and current expectations, forecasts and assumptions are subject to certain risks and uncertainties that could cause our actual results to differ materially from those reflected in the forward-looking statements. Factors that could cause or contribute to such differences include, but are not limited to, those discussed in this report, and in particular, the risks discussed under the heading “Risk Factors” in Part I, Item 1A of this report and those discussed in other documents we file with the Securities and Exchange Commission, or SEC. Our forward-looking statements should not be relied upon as representing our views as of any subsequent date, and we are under no obligation to, and expressly disclaim any responsibility to, update or alter our forward-looking statements, whether as a result of new information, future events or otherwise. Given these risks and uncertainties, readers are cautioned not to place undue reliance on such forward-looking statements.
The following information should be read in conjunction with the Consolidated Financial Statements and the accompanying Notes to Consolidated Financial Statements included in this report.

4
PART I
ITEM 1. BUSINESS
Overview
Aruba Networks, Inc. is a leading global provider of enterprise mobility solutions. We develop, market and sell products and services designed to solve our customers' secure mobility requirements through our Mobile Virtual Enterprise ("MOVE") architecture, which unifies the network infrastructure, access management and mobility applications into one integrated system that offers strong security and a simplified approach to bring-your-own-device ("BYOD") initiatives.
We believe the market for mobility solutions in the enterprise is changing and that the explosion of mobile devices is forcing information technology ("IT") departments to radically revise the way they approach provisioning and supporting these devices in the workplace. Our goal is to provide simplified, dependable solutions that permit IT departments to quickly, securely and cost-effectively meet their mobility and BYOD needs. We address these needs with our flexible MOVE architecture, a fundamentally new network architecture, designed for an increasingly mobile and wireless universe of end-users. MOVE is comprised of three major components. The first component consists of our mobility-centric network infrastructure, including our mobility controllers, access points, mobility access switches, remote access points, Virtual Private Network ("VPN") software and AirWave management. The second component of MOVE is our next-generation access management solution, including ClearPass for application, device and networks usage controls. The third component consists of our mobility applications, including our WorkSpace mobile application, our Application Programming Interfaces ("APIs") and our Meridian application for visitor engagement through indoor way-finding and targeted location-based messaging.
We conduct business in three geographic regions: Americas, Europe, Middle East and Africa ("EMEA"), and Asia Pacific & Japan ("APJ"). Our products and services have been sold to more than 30,000 customers worldwide, including some of the largest and most complex global organizations. Our customer base spans major industries and verticals, including general enterprise, high tech enterprise, industrial enterprise, higher education, K-12 education, health care, retail, federal/state/local government, financial services and hospitality. We typically sell to and support these customers through a two-tier distribution model in most areas of the world, including the United States. Our Value Added Distributors ("VADs") and Original Equipment Manufacturers ("OEMs") sell our portfolio of products, including a variety of our support services, to a diverse number of Value Added Resellers ("VARs"), systems integrators and service providers. Also, certain of our OEMs sell directly to end customers.
Headquartered in Sunnyvale, California and founded in 2002, Aruba is led by Dominic Orr, President and Chief Executive Officer and Keerti Melkote, Founder and Chief Technology Officer. Our website address is www.arubanetworks.com.
Industry Trends and Strategy
The number of mobile devices is growing exponentially and, according to some estimates, could soon equal or exceed the number of people on the planet. In addition, pockets of Wi-Fi hot spots are blending into increasingly continuous coverage zones, making Wi-Fi availability more pervasive than ever. The combination of instant access and mobility is shaping numerous facets of everyday life, including the next-generation workplace.
Supporting mobile users and their devices has become a difficult to address need for IT departments in enterprises of all sizes. What seems easy to a user - getting network access via a personal device - is complex to manage for IT professionals. To accommodate a changing mix of mobile users, IT staff members in different functional areas must make changes to separate network, security and management systems. This takes time because existing network and supporting system designs are generally fixed and port-centric, relying on policies that are tied to a port or stationary device, with little or no regard for the multiple devices and applications in use.
At the same time, in many organizations, control over the selection of mobile computing devices is rapidly shifting from the IT organization to users. Very often, these devices are employee-owned and are being used by enterprise employees for work-related purposes. IT departments cannot simply block these devices or deliver only restricted network access, but instead must find a way to securely provision and support these devices quickly, easily and cost effectively.
Traditional port-based network architectures were designed for enterprise-owned, fixed devices connected to physical Ethernet ports. These legacy networks treated wireless as a "convenience network" and are not well suited to accommodate the growing trend of mobility in the enterprise. As a result, organizations need a fundamentally new network architecture, designed for mobility and built on the assumption that a majority of users will soon be "all-wireless."
AnnualR
eport

5
Aruba is executing on a comprehensive, mobility-centric strategy to help our customers address this need. Our strategy focuses on delivering innovation, differentiation and a go-to-market and customer service experience defined by best-in-class wireless and mobility technical expertise. Our products and services are designed to solve the three fundamental mobile enterprise needs for: network infrastructure, access management and mobility applications. The following are key market and customer requirements that guide our strategy and product development efforts:
Network Infrastructure Needs• Support for diverse network environments - A typical mobile enterprise is comprised of a wide variety of
environments, ranging from very large campuses with thousands of users, to small branch locations that may even include tele-worker locations with a single user. Implementing point solutions for each environment would be too costly and complex for IT to manage. As a result, these mobile enterprises need a seamless mobile access solution that is cost-optimized for each of these environments.
• Scalability to support the entire enterprise - As more users abandon the legacy wired network and use an increasing number of mobile devices, customers need mobile access solutions that have the ability to scale dramatically, not just for users and applications but for future demands as well.
• Support for emerging mobile applications - Employees and visitors to mobile enterprises demand secure mobility solutions designed to support emerging applications such as location services (way finding, user engagement, asset-tracking and inventory management, etc.), high-definition video and unified communications.
• Reliable, high-capacity Radio Frequency ("RF") even as the variety and density of devices increases - Enterprise users often use multiple wireless-enabled devices simultaneously - and we expect the number of employed devices to continue to increase. As the environments in which these devices are used become more crowded, customers have begun to demand mobile access solutions that function with a wide variety of devices and provide high throughput and optimal performance in very user- and device-dense environments.
• Ease of implementation and efficient operations - In a mobile enterprise, IT may need to support mobile access networks in hundreds of locations, some of them thousands of miles away without local IT support. To meet these demands, IT departments will need simple network set up and configuration as well as easy to use management solutions to streamline operations and reduce overhead costs. These management systems must automate and simplify network set-up, configuration, end-to-end diagnostics, troubleshooting, reporting and more. To provide complete visibility and control as global enterprise networks evolve over time, the management systems that IT employs must support both new and legacy wired and wireless infrastructure from multiple vendors.
Access Management Requirements• User-based policy for both security and mobility - Wireless networks cannot be confined within a building's walls,
rendering obsolete traditional wired network physical security models that depend on an impenetrable physical perimeter. Network access privileges and permissions must be clearly defined on a per-user basis to enable secure access and the reliable delivery of data, voice, video, and other applications to mobile users. Guests and contractors must be supported, but unauthorized wireless devices that could potentially circumvent network security must be detected and blocked. Enforcing these security policies must not negatively impact the user experience or interfere with user mobility.
• Enable "self-service" models for the new BYOD enterprise - IT organizations are typically staffed to support a traditional model in which a user is assigned a single PC that is owned and managed by the enterprise, with a defined set of enterprise applications. The BYOD phenomenon has disrupted this support model, but enterprises generally cannot afford to dramatically increase IT staff to support the unprecedented number and variety of devices and user-selected applications. As a result, IT departments need mobility solutions that address this challenge by enabling self-support work flows to relieve the burden on IT and empower users to securely provision and support themselves.
Mobility Application Demands• Delivering applications reliably in a mobile environment - As enterprise users evolve to an "all-wireless" access
model, latency-sensitive applications (like voice and video) that were previously delivered over a fixed wired network must perform optimally in a wireless environment. Because early generations of wireless networks lacked “application awareness,” enterprises struggled with the mobile unified communications applications that have become increasingly prevalent and important to their businesses. New mobility access solutions must be “application aware” so they can identify, secure and prioritize traffic from these applications to ensure optimal performance.
• Engaging the public and customers - “Public Facing Enterprises” such as businesses and organizations in the health care, retail and hospitality industries are increasingly looking to mobile devices and applications as critical touch points to their customers to improve overall customer engagement and loyalty. As a result, mobile applications that
6
leverage network infrastructure (with context on user, device, application and location) will be attractive to these public-facing enterprises.
Solutions, Products and Technologies
Keeping in mind each of these key industry trends and customer needs, we have designed our BYOD and mobility infrastructure solutions based on our flexible MOVE architecture. Our core solutions include products that:
• deliver smarter, faster Wi-Fi access with 802.11n and 802.11ac; • mobilize voice and video unified communications;• deliver simple wireless networking for mobile, printing and display devices;• enable self-service BYOD access management;• provide simple Wi-Fi management solutions for distributed enterprises and small-to-medium enterprises; and• offer indoor mobile engagement applications for public-facing enterprises.
To enable these solutions, we leverage layer 4-7 contextual visibility - meaning that our products are able to manage user roles, device types, application flows, location and time-of-day - and we extend this intelligence across the network to devices and applications. Our MOVE architecture can be deployed in various ways,with centralized or distributed branch options, based on an enterprise's size, needs and budget. Our flexible approach allows our customer IT departments to support mobility and BYOD cost-effectively.
Our MOVE architecture is comprised of three major components: • Mobility-Centric Network infrastructure. This is comprised of Mobility Controllers for flow-based traffic
management, wireless Access Points (APs), Mobility Access Switches, Remote Access Points (RAPs), Virtual Intranet Access VIA client software and AirWave management for wired, wireless and remote networks.
• Next-Generation Access Management. This is our ClearPass Access Management System for application, device and network usage controls.
• Mobility applications. These end-user tools include the Aruba WorkSpace mobile app for BYOD; Aruba APIs for location and analytics applications; and the Meridian application for visitor engagement through indoor way-finding and targeted location-based messaging.
Mobility-Centric Network Infrastructure
Our suite of mobility-centric network infrastructure solutions are designed to alleviate the pain points we believe our customers and their IT departments are facing, including the need to provide support for diverse network environments, scalability to support the entire enterprise, support for emerging mobile applications, reliable high-capacity RF for high-density environments, and ease of implementation and efficient operations.
Access Points
Based on industry standards, including 802.11ac, Aruba APs are designed to deliver secure Wi-Fi client access to a variety of indoor and outdoor enterprise wireless Local Area Network ("WLAN") environments. Our APs can be centrally managed by Aruba Mobility Controllers or deployed in controllerless Aruba Instant mode.
In controllerless Aruba Instant mode, a dynamically elected AP automatically distributes the network configuration to other Aruba Instant APs in the WLAN. Users can simply power-up one Instant AP, configure it over the air, and plug in the other APs, permitting the setup of an entire network in minutes.
When managed by our Mobility Controllers, Aruba APs offer centralized configuration, data encryption, policy enforcement and network services, as well as distributed and centralized traffic forwarding.
Aruba APs are designed to meet the most challenging security, client performance and density requirements with capabilities such as:
• patented ClientMatch technology that ensures mobile devices roam efficiently by steering them to the AP and radio with the best reception for that device;
• adaptive Radio Management technology that ensures Aruba APs stay clear of interference, resulting in a more reliable, higher performance WLAN;
• integrated wireless security that identifies and mitigates wireless threats and intrusions by rogue devices; and• integrated spectrum analysis that identifies sources of RF interference and eliminates the need for hand held
spectrum monitors multiple management servers, new APs and dedicated sensors.
AnnualR
eport

7
Mobility Controllers
Aruba Mobility Controllers are designed to create a single, unified network to manage wired and wireless access across indoor, outdoor and remote locations. Aware of all network devices, users, applications and locations, Mobility Controllers run the ArubaOS operating system and also maintain configurations and automate software updates for other Aruba Mobility Controllers, Mobility Access Switches and APs.
With ArubaOS, Mobility Controllers perform security and system administration, as well as hardware-based routing, switching and data encryption. ArubaOS supports additional software modules including the Policy Enforcement Firewall with AppRF technology, RFProtect with Spectrum Analysis and Wireless Intrusion Protection, Advanced Cryptography with military-grade Suite B encryption, and xSec advanced Layer 2 encryption.
Mobility Access Switches
Aruba Mobility Access Switches enable secure, role-based network access for wired users and devices, independent of their location or application. Installed in the wiring closet or at branch offices, Mobility Access Switches deliver wire-speed Gigabit Ethernet switching and operate as high-performance wired access points when deployed with Aruba Mobility Controllers.
Remote Access Points
Designed for branch offices and home tele-workers, these are single- and dual-radio RAPs that feature wired and wireless network access, zero-touch provisioning, role-based access control, policy-based forwarding, air monitoring, and wireless intrusion protection.
AirWave Network Management
AirWave offers end-to-end clarity and control over mobile users on multi-vendor, multi-site networks. It includes user location and mapping capabilities, real-time monitoring, proactive alerts, historical reporting, and troubleshooting.
Virtual Intranet Access
VIA client software provides secure Wi-Fi connectivity for Android, iOS, Mac OS and Windows mobile devices and laptops. Unlike legacy VPNs, VIA chooses the most optimal enterprise network connection and configures mobile device settings to ensure a simple, zero-touch wireless experience.
Outdoor Wireless Mesh Routers
Aruba AirMesh outdoor wireless mesh routers are designed to be deployed where wired connectivity is impractical or unavailable. They combine a high-performance multi-radio architecture with intelligent Layer 3 routing for greater reliability and scalability. The result is a high-capacity, multi-service mesh network that is optimized for multimedia applications in municipal, public safety and industrial deployments.
Access Management
Our ClearPass access management system is designed to solve our customers' need for user-based policy for both security and mobility as well as enablement of the self-service model for the BYOD enterprise.
ClearPass Access Management
The Aruba ClearPass Access Management System, with its WorkSpace capabilities, integrates network access control (NAC), mobile device management (MDM) and mobile application management (MAM) into a single platform that can be deployed with almost any network. ClearPass also simplifies the provisioning of guest network access, allowing employees to create accounts for their own guests or visitors to self-register. Account credentials can be sent to guests via text message and can be set to expire automatically. ClearPass offers visibility into guest access activities, making it easy to audit network usage and meet compliance mandates.
Mobility Applications
Our suite of mobility applications are designed to address our enterprise customers' desire to deliver applications in a mobile environment and to provide solutions that engage the public and end-users with location-based way-finding and messaging.

8
WorkSpace Mobile Application
The WorkSpace mobile application enables users to onboard their own devices, organize work apps, share AirPrint and AirPlay devices, and provision guest network access. Users can view app policy status, access an enterprise app store, and obtain a single sign-on for work apps.
Meridian Applications for Visitor Engagement
Meridian-powered custom and consumer mobile applications leverage location-over-Wi-Fi information to provide vistor engagement services to casinos, hospitals and, large public venues, and other facilities. Many retailers and resort hotels use Meridian to engage customers with indoor way-finding and targeted location-based messaging.
Customer Support, Professional Services and Training
Aruba provides world-class customer support and professional services designed to keep our customers' networks operational and running at peak efficiency. The Aruba Support Center provides customers and partners with 24×7 access to critical technical information, such as FAQs, field alerts, release notes, product documentation, best practices documentation, and software and firmware updates and upgrades. Customers may receive 24x7 support directly from Aruba's technical assistance center ("TAC") or through Aruba authorized support partners. Extended support agreements, premium support services and advance hardware replacement are also offered.
Design, implementation, configuration and optimization of Aruba products in customer environments may require expert-level services. These professional services are typically delivered by Aruba's authorized VARs and other partners. Aruba maintains a network of ServiceEdge partners who are specifically trained to provide these types of services to customers and other partners. In addition, Aruba sometimes delivers professional services for ClearPass and other technologies directly to customers, using Aruba's own high-skilled service delivery engineers.
Aruba also offers online and hands-on, instructor-led technical training for our broad range of products, which includes rigorous Technical Certification Programs for customers and partners who have demonstrated excellence in specific Aruba technologies. Finally, Aruba customers and partners can leverage our on-line community, Airheads Social, for Aruba and community-sourced technical information, best practices and customer support services. Our community can be accessed at community.arubanetworks.com.
Segment Information
We operate as one reportable and operating segment—selling our ArubaOS operating system, controllers, wireless access points, switches, application software modules, access management solution, multi-vendor management solution software, and professional services and support.
Operating segments are defined as components of an enterprise about which separate financial information is available that is evaluated regularly by the chief operating decision maker, or decision making group, in deciding how to allocate resources and in assessing performance. Our chief operating decision maker is our chief executive officer. Our chief executive officer reviews financial information presented on a consolidated basis for purposes of allocating resources and evaluating financial performance and evaluates performance based primarily on revenue in the geographic locations in which we operate. Revenue is attributed by geographic location based on the ship-to location of our customers. Our assets are primarily located in the U.S. and not allocated to any specific region. Further information regarding our operating segment is presented in Note 12 of Notes to Consolidated Financial Statements.
Customers
Our products and services are sold and supported worldwide to customers in most major industries including: general enterprise; high tech enterprise; industrial enterprise; higher education; K-12 education; health care; retail; federal, state, and local governments; financial services; and hospitality. Our products are deployed in a wide range of organizations from small organizations to large multinational corporations.
For a description of our revenue based on our customers’ geographic locations, see Note 12 -Segment Information and Significant Customers of Notes to Consolidated Financial Statements.
AnnualR
eport

9
Sales and Marketing
We sell our products and services directly through our sales force and indirectly through our VAR, VAD and OEM partners:
• Our sales force — Our sales force operates in each of the following regions: the Americas, EMEA and APJ. Each sales force is responsible for managing all direct, as well as channel, business within its designated geographic territory.
• VARs, VADs and OEMs — Our VARs, VADs and OEMs market, sell, and deploy our solutions to a broad array of organizations. Some of these VARs also purchase our solutions and offer them to their end customers as a managed service. We continue to grow the use of our channel partners in each of our theatres of operations.
As part of our continuing efforts to improve operating leverage through our channel partners, we are increasingly relying on our VARs, channel managers, and sales support team to manage smaller-sized deals. This improves our sales productivity and enables our direct sales teams to focus on large customers.
Our marketing activities include lead generation, training, tele-sales, advertising, website operations, direct marketing, and public relations, as well as participation at technology conferences and trade shows.
We expect that, over time, our channel partner sales will continue to constitute a significant majority of our total revenue and we intend to increase our market penetration and extented our geographic sales reach both domestically and internationally through our network of channel partners and by increasing our direct sales force.
Research and Development
Continued investment in research and development is critical to our business. To this end, we have assembled a team of engineers with expertise in various fields, including networking, security, software development and RF. Our research and development efforts are focused in Sunnyvale, California, Bangalore, India and Beijing, China. We have invested significant time and financial resources into the development of our unified mobility solutions and architecture. We will continue to expand our product offerings and solutions capabilities in the future and plan to dedicate significant resources to these continued research and development efforts. Research and development expenses for fiscal years 2013, 2012, and 2011 are disclosed in the Consolidated Statements of Operations and Comprehensive Income (Loss).
Manufacturing
We outsource the manufacturing of a significant majority of our hardware products to contract manufacturers and original design manufacturers. These manufacturing partners help us optimize our operations by lowering costs and reducing time to market. Our major manufacturing partners are Flextronics, Sercomm, Accton and Wistron NeWeb Corp. Our manufacturing agreement with Flextronics is automatically renewed each year for successive one-year terms unless we or Flextronics provides at least 90 days’ advance written notice to the other party of an intent not to renew. In addition, the agreement may be terminated by us or Flextronics for any reason upon 180 days’ advance written notice to the other party.
In addition, we utilize a Flextronics facility in Singapore for production of specialized products and fulfillment operations for customer shipments to most APJ and EMEA destinations. We also have a second fulfillment center located in Sunnyvale, California that is primarily responsible for customer shipments destined to locations in the Americas. We perform rigorous in-house quality control inspection and testing at both of our fulfillment centers to ensure the reliability and quality of our hardware components.
We utilize components from many suppliers. Whenever possible, we strive to have multiple sources for these components to ensure continuous supply and competitive costs. We work in conjunction with the extensive supply chain management organizations at all of our manufacturing partners to select and utilize suppliers with established delivery and quality track records. We source a limited number of components that are technically unique and only available from specific suppliers, but neither we nor our manufacturing partners have entered into any long-term supply agreements with these suppliers. Instead, we maintain close, direct relationships with these suppliers to ensure supply meets our requirements including, in some cases, entering into license agreements that allow us to incorporate certain of their components into our products.
We also incorporate certain generally available software programs into our architecture through license agreements with third parties. We have also entered into license agreements with Qualcomm, Inc. (“Qualcomm”) and Broadcom Corporation (“Broadcom”), each of which is a sole supplier of certain components used by our manufacturing partners, in the production of our products. These license agreements are only for one-year terms and each may be terminated prior to the end of the then-current term. If these agreements were to be terminated, we would be required to redesign our hardware and software in order to incorporate technology from alternative sources.

10
Competition
The market for secure mobility products is highly competitive and constantly evolving. We believe that we compete primarily on the basis of providing a comprehensive solution that enables mobility, security, and the delivery of converged application services. We believe other principal competitive factors in our market include the performance and reliability of our solutions, the average selling price (including the size of any discounts), total cost of ownership, return on investment, our ability to introduce new products quickly and effectively, our ability to deploy easily into existing networks, the interoperability of our solutions with other devices, the scalability of our solutions, our ability to reduce production costs, our ability to increase brand awareness and our reputation, our ability to provide secure mobile access to the network, speed of our mobile connectivity offering, our ability to allow the centralized management of networks, our ability to conform to standards and obtain regulatory and other industry certifications, and the strength and scale of our sales and marketing efforts, professional services and customer support.
Our competitive position also depends on our ability to innovate and adapt to meet the evolving needs of our customers. We believe we compete favorably in each of these areas, although, we expect competition to intensify in the future as other companies introduce new products in the same markets we serve or intend to enter.
Our primary competitors include a number of large and well-established public companies including Cisco Systems, Inc., Hewlett-Packard Company, and Motorola Solutions, Inc. We also face competition from a number of smaller public and private companies and new market entrants.
Our key competitive differentiators include the following:• the ability of our MOVE architecture to seamlessly unify wired and wireless into one cohesive network access
solution, providing context-aware and secure user access to appropriate network services;• our adaptive 802.11ac and 802.11n products with infrastructure-based controls which lower customer costs by
simplifying deployments, as well as securely and reliably delivering data, toll-grade voice, and high-definition video applications;
• our NSA-developed Suite B military-grade security for access control and data privacy;• our Virtual Branch Network (“VBN”) solution, including Mobility Controllers, Aruba Instant, Remote Access Points
and Virtual Internet Access client software which delivers the security of VPN, the economy of broadband, the simplicity of one-touch installation and the efficiency of centralized management for tele-workers and small branch offices;
• our AirWave Wireless Management Suite, which enhances operations management, reduces complexity and support costs, and extends the life of existing infrastructure through a multi-vendor, user-centric approach;
• our ClearPass solution, which delivers a complete solution for BYOD environments and access management;• our recently acquired Meridian application which leverages our access point Wi-Fi information to provide visitor
engagement services to our customers' end-users in the public facing enterprise environment, allowing these customers to provide indoor way-finding and targeted location-based messaging to the end-users within their establishments; and
• our Aruba Instant product for enterprise branch, mid-market business and managed services opportunities.
Backlog
In our experience, the actual amount of product backlog at any particular time is not a meaningful indication of our future business prospects. Because we allow customers to cancel or change orders with limited advance notice prior to shipment or performance and because some orders remain in backlog due to concerns about the credit worthiness of the partner or customer, we do not consider backlog to be firm and do not believe our backlog information is a reliable indicator of our ability to achieve any particular level of revenue or financial performance.
Intellectual Property
Our success as a company depends critically upon our ability to protect our core technology and intellectual property. To accomplish this, we rely on a combination of intellectual property rights including patents, trade secrets, copyrights and trademarks, as well as customary contractual protections.
We have been granted numerous patents and have a growing pending patent portfolio. We intend to file additional patents in the future, as well as counterparts for these patents and patent applications in other jurisdictions around the world as appropriate.
AnnualR
eport

11
Aruba Networks®, Aruba The Mobile Edge Company® (stylized), Aruba Mobility Management System®, People Move Networks Must Follow®, Mobile Edge Architecture®, RFProtect®, Green Island®, ETips®, ClientMatch™, Virtual Intranet Access™, ClearPass Access Management Systems™, Aruba Instant™, ArubaOS™, xSec™, ServiceEdge™, Aruba ClearPass Access Management System™, Airmesh™, AirWave™, Aruba Central™, and “ARUBA@WORK™ are Marks of Aruba Networks, Inc. in the U.S. and certain other countries. This list may not necessarily be complete and all-inclusive.
In addition to the foregoing protections, we generally control access to and use of our proprietary software and other confidential information through the use of internal and external controls, including contractual protections with employees, contractors, customers and partners. Our software is protected by U. S. and international copyright laws.
Environmental Laws
Our products and certain aspects of our operations are regulated under various environmental laws in the U.S., Europe and other parts of the world. These environmental laws are broad in scope and regulate numerous activities including the discharge of pollutants into the air and water, the management and disposal of hazardous substances and wastes, the cleanup of contaminated sites, the content of our products and the recycling and treatment and disposal of our products. Certain of these laws also pertain to tracking and labeling potentially harmful substances that have been incorporated into our products. These product labeling laws require us to know whether certain substances are present in our products, and to what degree. Environmental laws may limit the use of certain substances in our products, or may require us to provide product safety information to our customers if certain substances are present in our products in sufficient quantities. Additionally, we may be required to recycle certain of our products when they become waste. Our products contain modest amounts of gold and tantalum and in accordance with the Dodd-Frank Wall Street Reform and Consumer Protection Act (the "Dodd-Frank Act"), we are undertaking a comprehensive analysis of our supply base to ensure none of these minerals are sourced from the Democratic Republic of the Congo or adjoining countries. We do not knowingly use minerals sourced from these countries. Compliance with environmental laws and regulations across multiple jurisdictions is complex and we regularly review known and pending laws and regulations to ensure we are compliant. In addition, when selecting manufacturing and distribution partners we evaluate their supply chain policies to reasonably ensure they are compliant and then monitor these partners to reasonably ensure they remain in compliance. We did not incur any material capital expenditures for environmental control facilities in fiscal year 2013, and none are planned for fiscal year 2014.
Corporate Information
We were incorporated in Delaware in February 2002. Our principal executive offices are located at 1344 Crossman Ave., Sunnyvale, California 94089-1113, and our telephone number is (408) 227-4500. Our website address is www.arubanetworks.com.
Employees
As of July 31, 2013, we had 1,473 employees worldwide, of which 580 were engaged in sales and marketing, 586 were engaged in research and development, 166 were engaged in general and administrative functions, 103 were engaged in customer services and 38 were engaged in operations. None of our employees are represented by labor unions, and we consider current employee relations to be good.
Website Posting of SEC Filings
Our annual reports on Form 10-K, quarterly reports on Form 10-Q, current reports on Form 8-K and amendments to such reports are available, free of charge, as soon as reasonably practical after they are electronically filed or furnished with the SEC, on our website and can be accessed by clicking on the “Company/Investor Relations” tab. Further, copies of materials filed by us with the SEC may be read and copied at the SEC’s Public Reference Room at 100 F Street, NE, Washington, D.C. 20549. Information on the operation of the Public Reference Room can be obtained by calling the SEC at 1-800-SEC-0330. The SEC maintains an internet site that contains reports, proxy and information statements and other information regarding our filings at www.sec.gov. The contents of our website are not incorporated into, or otherwise to be regarded as a part of, this report or any other report we file with or furnish to the SEC.

12
ITEM 1A. RISK FACTORS
Set forth below and elsewhere in this report, and in other documents we file with the SEC, are risks and uncertainties that could cause actual results to differ materially from the results contemplated by the forward-looking statements contained in this report and in our other public statements. Because of the following factors, as well as other factors affecting our financial condition and operating results, past financial performance should not be considered to be a reliable indicator of future performance, and investors should not use historical trends to anticipate results or trends in future periods. These risks are not presented in order of importance or probability of occurrence.
Risks Related to Our Business and Industry
Risks Relating to Our Finances and Operations
Our operating results may fluctuate significantly, which makes our future results difficult to predict and could cause our operating results to fall below expectations or our guidance and could cause our stock price to fluctuate.
Our annual and quarterly operating results have fluctuated in the past and may fluctuate significantly in the future, which makes it difficult for us to predict our future results. These fluctuations may be due to a variety of factors, many of which are outside of our control. As a result, comparing our operating results on a period-to-period basis may not be meaningful, and investors should not rely on our past results as an indication of our future performance.
In general, our product revenue reflects orders shipped in the same quarter that orders are received. In addition, we receive a substantial portion of our orders for each fiscal quarter in the last month of that fiscal quarter, which is a trend we expect to continue. We face risks of both under-estimating and over-estimating the amount and timing of orders from our customers. On the one hand, even though we may have business indicators about customer demand during a quarter, if we are unable to ship enough product to fulfill the orders we receive in the last month of each fiscal quarter, we would be forced to delay those shipments and the revenue that goes with those orders. On the other hand, because our budgeted expense levels depend in part on our expectations of future revenue, if the orders we receive in the last month of each fiscal quarter do not meet our expectations, we may not be able to reduce our costs quickly enough to compensate for the amount of unexpected revenue shortfall. If either of these eventualities were to occur, we would expect our revenue to be adversely affected, and we might fail to meet securities analysts' and investors' expectations, which could cause our stock price to decline.
In addition to other risks listed in this “Risk Factors” section, factors that may cause our operating results to fluctuate include:
• the impact of unfavorable worldwide economic and market conditions;• the amount of orders booked but not shipped in prior quarters that are shipped in the current quarter;• reductions in customers' budgets for information technology purchases and delays in their purchasing cycles;• the sale of our products in the timeframes we anticipate, including the number and size of orders in each quarter;• our dependence on several large vertical markets, including the government, health care, retail, enterprise and
education vertical markets;• our ability to control costs, including our operating expenses, and the costs of the components we purchase;• product mix and average selling prices, as well as increased discounting of products by us and our competitors;• our ability to maintain volume manufacturing pricing from our contract manufacturers and component suppliers;• our contract manufacturers' and component suppliers' ability to meet our product demand forecasts;• any decision to increase or decrease operating expenses in response to changes in the marketplace or perceived
marketplace opportunities;• our ability to derive benefits from our investments in sales, marketing, engineering or other activities;• volatility in our stock price, which may lead to higher stock compensation expenses;• the timing of revenue recognition in any given quarter as a result of timing of the orders meeting the relevant
revenue recognition criteria;• fluctuations in our tax rate due to various factors, including the mix of our domestic and international revenue;• the impact of one-time events, such as acquisitions and litigation settlements;• the regulatory environment for the certification and sale of our products; and• seasonal demand for our products, some of which may not be currently evident due to our revenue growth during
recent fiscal years.
Our prospects should be considered and evaluated in light of the risks and uncertainties frequently encountered by companies in rapidly evolving markets characterized by rapid technological change of our size, resources and operating history. Because our quarterly operating results are difficult to predict even in the near term, in one or more future quarterly periods, our operating results may fall below the expectations of securities analysts and investors or below any guidance we may
AnnualR
eport
13
provide to the market. If this were to occur, the trading price of our common stock could decline significantly. Stock price declines could occur, and have occurred in the past, even when we have met our publicly stated revenue and/or earnings guidance.
Our business, operating results and growth rates may be adversely affected by unfavorable economic and market conditions.
Our business depends significantly on economic conditions generally and the demand for products and services in the enterprise mobility market specifically. Global economic conditions have been challenging due to the recent recession, adverse global credit conditions, low economic growth, high unemployment rates, reduced capital spending, and uncertainty regarding the U.S. federal budget and the recent sequestration. In addition, the sovereign debt default risks in certain European Union countries as well as conflicts in the Middle East and elsewhere have created political and economic uncertainties that have impacted, and continue to impact, worldwide markets. Economic growth in the U.S. and many other countries remains low and the length of time these adverse economic conditions may persist is unknown.
These global and regional adverse economic conditions directly and indirectly impact our customers and the decisions they make regarding whether to make capital commitments and spend resources on IT generally and our solutions in particular. A customer's decision to purchase our solutions, or to replace existing infrastructure, tends to be discretionary and generally involves a significant commitment of capital and other resources. As a result, when our customers and potential customers are faced with weak economic conditions, we can expect one or more of the following reactions: reductions in overall IT expenditures, longer sales cycles, demand for lower prices, requests for longer payment terms, reduced unit sales, and purchases of lower cost solutions with fewer features.
These types of customer reactions have in the past resulted in (and may in the future continue to result in) delayed sales cycles, canceled sales and lower overall revenues, which have (as we experienced in the third quarter of fiscal 2013) negatively impacted (and may again negatively impact) our ability to meet our financial forecasts and achieve our expected rates of growth. Although we would expect the impacts of these customer reactions to ameliorate as economic conditions improve, one or all of these reactions could continue or increase even if global and regional economic and market conditions become more favorable.
Although demand for products and services in the enterprise mobility market has continued to grow despite the global economic slowdown, the rate of that growth has slowed. We believe that the adverse global economic climate has played (and will continue to play) a roll in the slower growth rates for products and services in the enterprise mobility market, including our suite of solutions. If the overall market demand for the types of solutions we sell does not grow or fails to grow at the rates we expect (and we do not otherwise increase our share of the market), then our revenue, business and operating results would likely be adversely impacted. In addition, if interest rates were to rise or foreign exchange rates were to weaken for our international customers, overall demand for our solutions could be further dampened, and related IT spending might be reduced. Furthermore, any increase in worldwide commodity prices might result in higher component prices and increased shipping costs, both of which would be likely to negatively impact our financial results.
We expect our gross margin to vary over time and our recent level of product gross margin may not be sustainable. Fluctuations and/or declines in our gross margin could cause our stock price to decline.
Our product gross margins vary from quarter to quarter. For example, our level of product margins declined in fiscal 2013 relative to fiscal 2012 and may continue to decline and may be adversely affected in the future by numerous factors, including: changes in the mix of products sold in our channel, the percentage of revenue we receive from international regions, increased price competition and discounting pressures, increases in material, labor or other manufacturing-related costs, excess product component or obsolescence charges from our contract manufacturers, write-downs for obsolete or excess inventory, increased costs due to changes in component pricing or charges incurred due to component holding periods if our forecasts do not accurately anticipate product demand, timing of revenue recognition and revenue deferrals, warranty-related issues, product discounting, freight charges, or our introduction of new products or new product platforms or entry into new markets with different pricing and cost structures. If one or more of these factors were to impact our results, our gross margin may be adversely affected, which in turn could cause our stock price to decline.
Access to capital and ability to bid for acquisitions against much larger capitalized competitors could prevent us from making acquisitions, which could cause us to forego opportunities that would otherwise have increased our market share or expanded our product portfolio.
We have in the past, and may in the future, seek to acquire businesses or technologies to stimulate our growth, enhance our existing solutions, acquire additional talented employees and/or foster our ability to bring new solutions to market. We intend to address these needs through acquisitions of other companies, business divisions, technologies, and personnel.

14
However, even if we are able to identify attractive acquisition targets, we may not be able to complete those acquisitions, which could negatively impact our growth strategy and cause us to unnecessarily expend management time and other resources.
In any competitive bidding contest for an attractive acquisition target, we may not be able to provide the most attractive offer because several of our competitors have significantly greater cash available for acquisitions. As a result, we may be required to make our offer contingent upon obtaining outside equity or debt financing, which could be perceived by the target as inferior to a non-contingent cash offer, even if our offer were higher. In addition, our larger competitors have greater resources than we do to devote to identifying potential acquisition targets, which also puts us at a competitive disadvantage. If our larger competitors are successful in identifying more candidates and/or placing more favorable bids for target companies, we would be compelled to forego opportunities that otherwise might have increased our market share, employee count or technologies.
We may engage in future acquisitions that could disrupt our business, cause dilution to our stockholders and harm our business, operating results and financial condition.
In the event we are successful in acquiring new businesses, products or technologies, we will face additional risks, including the following:
• difficulties in integrating the personnel, operations, systems (including financial reporting and internal control systems), technologies and products of the acquired companies, particularly companies located in foreign jurisdictions or with widespread operations and/or complex products;
• challenges in retaining and motivating key personnel from these acquired businesses, particularly those critical to the continued success of those businesses;
• markets not evolving as we anticipated or acquired technologies not proving to be those needed to be successful in our markets;
• difficulties in maintaining uniform standards, controls, procedures and policies across locations, or in managing geographically or culturally diverse locations;
• acquired product quality complications;• diversion of management attention from normal daily operations;• challenges of managing larger and more widespread operations;• difficulties in completing projects associated with in-process research and development (R&D) intangibles;• challenges in entering markets in which we have no or limited direct prior experience that have strong competitors;• challenges of creating a new go-to market sales action for acquired products outside our traditional area of expertise;• increased expenses without sufficient offsetting revenue from the acquired business;• failure to achieve targeted cost and revenue synergies;• acquired business liabilities, including claims of patent or other intellectual property infringement;• initial dependence on unfamiliar or small supply partners; and• loss of key employees, customers, distributors, vendors and other business partners of both us and the companies we
acquire.
In addition, even if we manage these integration and other risks, the acquisition may fall short of our expectations and may not strengthen our competitive position or otherwise achieve our goals. Moreover, any future acquisition could be viewed negatively by financial markets or investors, which could cause a decline in our stock price.
Depending on the terms of the acquisitions, we could be required to take one or more of the following actions:• issue shares of our common stock, which would cause dilution;• use a substantial portion of our cash resources, or incur debt, which may require us to agree to restrictive financial
covenants;• assume known or unknown liabilities;• record goodwill and non-amortizable intangible assets that are subject to potential periodic impairment charges;• incur amortization expenses related to intangible assets;• incur tax expenses related to the acquisition effect on our intercompany cost sharing arrangement and legal
structure; or• incur large and immediate write-offs and restructuring expenses.
Certain acquisition candidates in the industries in which we participate, particularly in the software business, may carry higher relative valuations (based on earnings multiples) than we do. Acquiring a business may be dilutive to our earnings, especially if the acquired business has little or no revenue. Ultimately, mergers and acquisitions of high-technology companies are inherently risky and subject to many factors outside of our control, and we cannot assure investors that our previous or future acquisitions will be successful.
AnnualR
eport

15
If we fail to manage future growth effectively, our business would be harmed.
We have expanded our operations and anticipate that further expansion will be required in order to sustain and increase our growth. We intend to increase our market penetration and extend our geographic sales reach both domestically and internationally through our network of channel partners and by increasing our direct sales force. We have increased our offshore operations by establishing additional offshore capabilities for certain engineering and general and administrative functions in China, India and Ireland, which we plan to continue.
This growth has placed and, we expect it will continue to place, significant demands on our management, infrastructure and other resources. To manage any future growth, we will need to hire, integrate and retain highly skilled and motivated employees. We will also need to continue to improve and expand our information technology and financial infrastructure, operating and administrative systems and controls, and continue to manage headcount, capital and processes in an efficient manner.
If we fail to manage our growth effectively, we may experience a wide variety of negative impacts to our business. For example, we expect that our continued growth will require us to make significant investments in information technology, or IT, infrastructure. If we do not timely purchase or properly implement these IT infrastructure purchases, we could inaccurately forecast customer demand for a particular product, which could lead to insufficient inventory and then lost sales opportunities. Alternatively, if our IT systems fail to operate as we intend, we could overestimate demand and finish a quarter with obsolete or excess inventory. If any of these were to occur, our growth rate could be impeded. In addition, if our IT systems and related control environments are insufficient to scale with the growth of our operations, we may identify one or more significant deficiencies or material weaknesses in our internal control over financial reporting. If this were to occur, we could miss a filing deadline for one of our periodic reports, which could in turn cause investors to lose confidence in us, negatively impact our ability to access the capital market and cause our stock price to decline.
Also, any future growth would add complexity to our organization and require effective coordination within our organization. We may not be able to successfully implement improvements to our systems and processes in a timely or efficient manner to manage our increasingly disparate and complex organization, which could result in additional operating inefficiencies and could cause our costs to increase more than planned, negatively impact our ability to provide high quality products and services, damage our reputation and brand, and ultimately reduce our rate of growth and harm our business.
In our recent history we have incurred net losses and we may not achieve profitability in the future.
We have a history of losses, with a few quarters of profitability during fiscal 2013, 2012 and 2011. We reported a net loss of $31.6 million for fiscal 2013, a net loss of $8.9 million for fiscal 2012 and net income of $70.7 million for fiscal 2011. As of July 31, 2013 and 2012, our accumulated deficit was $145.4 million and $113.8 million, respectively. Expenses associated with the continued development and expansion of our business, including expenditures to hire and retain additional personnel for sales and marketing and technology development, as well as costs of investing in infrastructure and IT systems to sustain our business, could limit our ability to sustain operating profits. If we fail to increase revenue or manage our cost structure, we may not achieve profitability again in the future. As a result, our business could be harmed, and our stock price could decline.
Impairment of our goodwill or other assets would negatively affect our results of operations.
Our acquisitions have resulted in total goodwill of $67.2 million and intangible assets, net of $26.9 million as of July 31, 2013. Goodwill is reviewed for impairment at least annually. Other intangible assets that are deemed to have finite useful lives are amortized over their useful lives but reviewed for impairment upon certain events or changes in circumstances. Screening for and assessing whether impairment indicators exist, or if events or changes in circumstances have occurred, requires significant judgment. Therefore, it is possible that a charge to operations might occur as a result of future goodwill and intangible asset impairment tests.
If goodwill or intangible assets were deemed to be impaired, an impairment loss equal to the amount by which the carrying amount exceeds the fair value of the assets would be recognized, which would result in incremental expenses for that quarter and a reduction to any earnings or an increase to any loss for the period in which the impairment was determined to have occurred. If and when these write-downs occur, they could harm our business, financial condition, and results of operations. No goodwill or long-lived assets impairment charges were recorded during fiscal 2013, 2012, or 2011.
As in the past, any future economic weakness could cause price and volume fluctuations in global stock markets that might also reduce the market price of our common stock. Declines in our stock price, level of revenues or gross margins would increase the risk that goodwill and intangible assets might become impaired in future periods, which would have an adverse effect on our results of operations. In addition, in response to changes in industry and market conditions, we may be required to strategically realign our resources and consider restructuring, disposing of, or otherwise exiting businesses. Any decision to

16
limit investment in or dispose of or otherwise exit businesses may result in the recording of special charges, such as inventory and technology-related write-offs, workforce reduction costs, charges relating to consolidation of excess facilities, or claims from third parties who were resellers or users of discontinued products.
We may need to raise additional funds in the future and those funds may not be available on acceptable terms or at all.
We believe that our existing cash, cash equivalents, short-term investments and cash from operations will be sufficient to meet our anticipated cash requirements for at least the next 12 months. We may, however, need to raise substantial additional capital to: fund our operations, continue our research and development, develop and commercialize new products, acquire companies, license products or other intellectual property, expand sales and marketing activities, or repurchase shares of our common stock.
Our future funding requirements will depend on many factors, including: customer acceptance of our solutions, cost of our research and development efforts, cost of establishing additional sales, marketing and distribution channels, cost of defending and prosecuting intellectual property infringement claims, competition from our competitors, including pricing pressures that negatively affect our gross margins, the market for different types of funding and overall economic conditions, and the cost of building out our infrastructure.
We may require additional funds in the future, and we may not be able to obtain those funds on acceptable terms, or at all. If we raise additional funds by issuing equity or convertible debt securities, our stockholders may experience dilution. Debt financing, if available, may involve covenants restricting our operations or our ability to incur additional debt. Any debt or additional equity financing that we might raise could contain terms that are not favorable to us or our stockholders.
If we do not have, or are not able to obtain, sufficient funds, we may have to delay development or commercialization of our products or license to third parties the rights to commercialize products or technologies that we would otherwise seek to commercialize. If we raise additional funds through collaboration and licensing arrangements with third parties, it may be necessary to relinquish some rights to our technologies or our products, or to grant licenses on terms that are not favorable to us. If we are unable to raise adequate funds, we may have to liquidate some or all of our assets, or delay, reduce the scope of or eliminate some or all of our development programs. We also may have to reduce sales, marketing, customer support or other resources devoted to our products or cease operations. Any of these actions could harm our operating results.
Risks Relating to our Products, Target Market and Competition
The market in which we compete is highly competitive, and competitive pressures from existing and new companies may have a material adverse effect on our business, revenue, growth rates and market share.
The enterprise mobility market in which we compete is highly competitive and is influenced by the following factors:• comprehensiveness of our solutions;• performance, reliability and features of our solutions;• average sales price (including the size of any discounts), total cost of ownership, and return-on-investment;• ability to introduce new products quickly and efficiently;• ability to easily deploy and operate our solutions in our customers' existing networks;• interoperability of our solutions with other devices;• scalability of our solutions;• ability to reduce production costs;• brand awareness and reputation;• strength and scale of sales and marketing efforts, professional services and customer support;• ability to provide secure mobile access to the network;• speed of mobile connectivity offering;• ability to allow centralized management of products; and• ability to conform to standards and obtain regulatory and other industry certifications.
Currently, we compete with a number of large and well-established public companies in the broader edge-access market (primarily in the WLAN space), including Cisco Systems, Inc., Hewlett-Packard Company and Motorola Solutions, Inc., as well as smaller public and private companies and new market entrants. A number of our current or potential competitors have longer operating histories, greater name recognition, larger customer bases and significantly greater financial, technical, sales, marketing and other resources than we do. As a result, these competitors may be able to devote greater resources to the promotion and sale of their products and services, better initiate or withstand substantial price competition, more readily take advantage of acquisitions or other opportunities, more quickly develop and expand their product and service offerings, more quickly anticipate, influence or adapt to new or emerging technologies and customer requirements than we can.
AnnualR
eport

17
Competitors offering a broader range of products than we offer have in the past bundled (and may in the future continue to bundle) products in a manner that makes it challenging for us to compete based on price. Some of these competitors also may have the ability to leverage their relationships with customers based on other products or incorporate functionality into existing products to gain business in a manner that discourages customers from purchasing our products.
We expect competition to intensify in the future based on the following factors:• continued consolidation among our competitors;• emergence of new companies as competitors in our markets or new markets in which we elect to participate; • expansion by us into new geographic and product markets with new competitors (including companies outside of
the traditional infrastructure market) as we broaden our offering of solutions;• introduction by other companies of new products in the markets we serve or intend to enter;• marketing of competitive products and services by our channel partners; and• the rapid pace of technological advancement.
For example, some of our competitors have made acquisitions or entered into partnerships or other strategic relationships with one another to offer more comprehensive solutions than they individually had offered. We expect this trend to continue as companies attempt to strengthen or maintain their market positions. The companies resulting from these consolidations could create more compelling product offerings and offer greater pricing flexibility, either or which would make competing on the basis of price, sales and marketing programs, technology or product functionality more difficult for us. Continued industry consolidation may adversely impact customers' perceptions of the viability of medium-sized technology companies and, consequently, customers' willingness to purchase from such companies.
In addition, we can expect competition to develop from new market entrants, which could include our channel partners and customers. If our channel partners purchase companies that compete with us or otherwise begin to market products and services that compete with our products and services, the resulting pressures could adversely affect our business, operating results and financial condition in a material way and may even result in the termination of our relationship with those channel partners. Any actual or speculated consolidation among competitors, or the acquisition of our partners and/or resellers by competitors, is likely to increase the competitive pressures faced by us as customers may delay spending decisions or not purchase our products at all. As we continue to expand globally, we may see new competition in different geographic regions from existing companies with strong technological, marketing and sales positions in those markets. In particular, we have experienced price-focused competition from competitors in Asia, especially from China, and we anticipate this will continue. Moreover, companies with whom we have strategic alliances in some areas may be competitors in other areas, which could negatively impact our existing business relationship with these companies and harm our business.
Competitive products may have better performance, more and/or better features, lower prices and broader acceptance than our products. As a result, if we do not keep pace with product and technology advances, there could be a material adverse effect on our competitive position, revenue and prospects for growth. Even if we keep pace with technological advances and market products with better performance or features than our competitors, potential customers may prefer to purchase from their existing suppliers (or a single provider) rather than a new supplier, regardless of product performance or features. Each of these competitive factors could result in increased pricing pressure, reduced profit margin, increased sales and marketing expenses and failure to increase (or the loss of) market share, any of which would likely seriously harm our business, operating results or financial condition.
If the market for our products and services does not continue to grow as we expect, our sales, future operating results and financial condition would be adversely affected.
We develop and provide enterprise mobility products and services. The success of our business depends substantially on the continued growth and reliance on Wi-Fi in these markets. The recent growth of the market for Wi-Fi networks is being driven by the increased use of Wi-Fi-enabled mobile devices and the use of Wi-Fi as a preferred connectivity option to support video, voice and other higher-bandwidth uses.
As one of the leading providers of enterprise mobility products and services that operate in a Wi-Fi environment, our year-over-year sales growth depends in part on the growth of the Wi-Fi market as a whole. We expect the market for Wi-Fi in general to continue to grow in the near future, but there can be no guarantee that future growth rates will be consistent with average historical growth rates. Moreover, even though we have continued to grow with the Wi-Fi market, growth in the Wi-Fi market as a whole may be driven in any given year by particular segments of the market in which we have a less significant presence, in which case we would not expect to necessarily grow in lock step with the larger market.
There are a number of reasons why the Wi-Fi market as a whole and the enterprise mobility market in particular may not continue to grow at the rate we expect, including: lower customer adoption rates than we forecast for our new technologies, customer use of alternative technologies (such as 4G and licensed spectrum) to address mobility requirements, increased use by

18
enterprise customers of low-cost, consumer-grade, or customers purchasing Wi-Fi products or managed services from partners with whom we do not have broad, or any, relationships. In the event that continued growth and reliance on Wi-Fi slows in the markets we serve, we would expect that our sales, future operating results and financial condition would be negatively impacted.
Our products are highly technical and may contain undetected hardware errors or software bugs, which could cause harm to our reputation and adversely affect our business.
Our products are highly technical and complex and, when deployed, are critical to the operation of many networks. We have focused, and intend to focus in the future, on getting our new products to market quickly. Due to our rapid product introductions, defects and bugs that may be contained in our products may not have manifested prior to shipment. We cannot provide assurance that our pre-shipment testing programs will be adequate to detect all defects. As a result, some errors in our products may only be discovered after a product has been installed and used by customers. Any errors, bugs, defects, malware or security vulnerabilities discovered in our products after commercial release could result in temporary or permanent withdrawal of a product, monetary penalties, decreased customer satisfaction, loss of current or prospective customers, damage to our brand and reputation, reduced sales opportunities, loss of revenues or delay in revenue recognition, reduction in the market acceptance of our new products or new versions of our products, increased development costs, incurrence of product reengineering expenses, increased inventory costs and increased service and warranty cost, any of which could adversely affect our business, operating results and financial condition.
In addition, we could face claims for product liability, tort or breach of warranty, including claims relating to changes to our products made by our channel partners. Our contracts with customers contain provisions relating to warranty disclaimers and liability limitations, which may not be upheld. Defending a lawsuit, regardless of its merit, is costly and may divert management's attention and adversely affect the market's perception of us and our products. In addition, if our business liability insurance coverage proves inadequate or future coverage is unavailable on acceptable terms or at all, our business, operating results and financial condition could be adversely impacted.
We depend upon the development of new products and enhancements to our existing products. If we fail to predict and respond to the end-customers' changing needs or to emerging technological trends and industry standards, we may not be able to remain competitive and our business, operating results, financial condition and market share could be adversely affected.
The enterprise mobility market in which we participate is characterized by quickly changing end-customer needs and rapidly evolving technological trends and industry standards, which result in the frequent introduction of new products and services. For example, changes in customer network architectures are driving a demand for, among other things, cloud-based solutions. To succeed, we must accurately anticipate and rapidly adapt to the new device purchases and application preferences of our end-user customers, quickly react to other technological advances that affect our market, and out-pace our competitors by bringing new products, features and services to market that will meet the latest customer demands, market trends and regulatory requirements. If, for any reason, we fail to successfully react to these market pressures and do not bring competitive new products to market in a timely fashion, then we may not be able to remain competitive and our business, operating results, financial condition and market share could be adversely affected.
Adaptability to Changing End-Customer Habits and Needs
We expend significant resources on research and development attempting to drive or otherwise anticipate and react to our customers' needs. In addition, from time to time, we acquire other companies to expedite our ability to more rapidly bring products to market and enhance our range of product offerings. For example, for the fiscal year ended July 31, 2013, we spent approximately $139.7 million dollars on R&D of new products and technologies and on enhancements to our existing products, as well as an additional cash payment of $16.8 million to acquire Meridian Apps, Inc. In addition, we are obligated to pay additional cash consideration of up to $10.2 million to certain former Meridian employees who became our employees, which will be made over a period of approximately three years from the closing date, subject to certain continued employment restrictions. Both R&D in the enterprise mobility industry and the process of acquiring and integrating new technologies are complex and filled with uncertainties, including:
• loss of opportunities due to R&D;• delays in customer purchases due to budgetary concerns, lengthy evaluation cycles or internal decisions to rely on
older technologies or defer purchases until newer technologies are available; • failure of new products or enhancements to achieve anticipated acceptance rates by our channel partners and the
market; or • incompatibility of new products with our existing solutions in terms of technical integration and/or go-to-market
strategy.
AnnualR
eport

19
As a result, we cannot guarantee that any of our significant research and development or acquisition expenditures will lead to the successful or timely introduction of high quality products that will be adopted in our market or compete successfully against the offerings of our competitors.
Response to Technological Advances and Evolving Industry Standards
We also expend significant resources on research and development so that we can rapidly respond to the latest technological advances and industry standards in the enterprise mobility market. We manufacture our products to comply with standards established by various standards bodies, including the Institute of Electrical and Electronics Engineers, Inc., or the IEEE, to ensure that our products are designed to be compatible with industry standards for secure communications over wireless and wireline networks. If we are not able to adapt to new or changing standards that are ratified by these bodies, our ability to sell our products may be adversely affected. In addition, if we adapt too quickly to an evolving standard, we face the risk that the adaptation we make may not be aligned with the final adopted standard. For example, recently we began shipping products that comply with the new 802.11ac wireless LAN standard, or the .11ac standard. Although these products are backwards compatible with the .11n standard, we cannot guarantee that the new .11ac standard will be widely adopted or that the IEEE will not modify the .11ac standard in the future. We remain subject to any changes adopted by various standards bodies, which would require us to modify our products to comply with the new standards, require additional time and expense and could cause a disruption in our ability to market and sell the affected products.
Race to Market and Marketplace Pressures
Even if we accurately anticipate customer needs and react in a timely way to evolving industry standards and technological advances, we may not be successful in developing new products or new product enhancements, or our competitors could beat us to market with their solutions or offer better functionality than we are able to provide. Additionally, even if we are successful in bringing a product to market, once a product is in the marketplace, its selling price often decreases over the life of the product, especially after a new competitive product is publicly announced. To lessen the effect of price decreases, our product management team attempts to reduce development and manufacturing costs in order to maintain or improve our margin. However, if cost reductions do not occur in a timely manner, there could be a material adverse effect on our operating results and market share. Further, the introduction of new products may decrease the demand for older products currently included in our inventory balances. As a result, we may need to record incremental inventory reserves for the older products that we do not expect to sell. In addition, the introduction of new products and software updates may negatively affect our reputation if customers with legacy products become dissatisfied because the legacy products are unable to support and benefit from our software updates. Any of these challenges may have a material adverse effect on our operating results and market share.
If we are unable to recruit and retain key employees, including members of our senior management, on a cost-effective basis, or if we fail to effectively integrate new key personnel into our organization, we will not be able to compete effectively and our business would be harmed.
Our ability to compete is substantially dependent upon the performance of our key employees, including members of our senior management. As a result, our success is substantially dependent upon our ability to attract and retain talented personnel for all areas of our organization, particularly in our sales, research and development, and customer service departments. Experienced management and technical, sales, marketing and support personnel in the IT industry are in high demand, and competition for their talents is intense, especially in the San Francisco Bay Area. Additionally, fluctuations or a sustained decrease in the price of our stock could affect our ability to attract and retain such personnel. In the event our competitors offer more attractive salaries, benefits or equity grants, we may not be successful in attracting and retaining such personnel on a timely basis, on competitive terms, or at all. The loss of, or the inability to recruit, such employees could have a material adverse effect on our business.
All of our executive officers are at-will employees, and we do not maintain any key-man life insurance policies. The loss of the services of any members of our management team may significantly delay or prevent the achievement of our product development and other business objectives and could harm our business.
Risks Related to Tax
Changes in our tax rates could adversely affect our future results.
Our provision for income taxes could be adversely affected by lower than anticipated earnings in countries that have lower tax rates, and higher than anticipated in countries that have higher tax rates. This factor can result in our effective tax rate being volatile from year to year and from quarter to quarter. Our provision for income taxes also could be adversely affected by non-deductible stock-based compensation, changes in research and development tax credit laws, transfer pricing adjustments,

20
changes in the valuation of our deferred tax assets and liabilities, changes in actual results versus our estimates, or changes in accounting principles, tax laws, regulations, including possible U.S. changes to the taxation of earnings of our foreign subsidiaries.
We are also subject to the periodic examination of our income tax returns by the Internal Revenue Service and other tax authorities. We regularly assess the likelihood of adverse outcomes resulting from these examinations to determine the adequacy of our provision for income taxes. We may underestimate the outcome of such examinations which, if significant, would have a material adverse effect on our results of operations and financial condition.
If we do not achieve increased tax benefits as a result of our recently modified corporate structure, our financial condition and operating results could be adversely affected.
We recently implemented a modified structure of our corporate organization to more closely align our corporate organization with the international nature of our business activities and to reduce our overall effective tax rate. Although we anticipate achieving a reduction in our overall effective tax rate in the future as a result of these changes, it is possible that the taxing authorities of the jurisdictions in which we operate or to which we are otherwise deemed to have sufficient tax nexus will challenge the tax benefits that we expect to realize as a result of the modified structure. In addition, future changes to U.S. or non-U.S. tax laws, including proposed legislation to reform U.S. taxation of international business activities, would negatively impact the anticipated tax benefits of the new structure. Any benefits to our tax rate will also depend on our ability to operate our business in a manner consistent with the new structure of our corporate organization and applicable taxing provisions, including by eliminating the amount of cash distributed to us by our subsidiaries. If any of these negative effects were to occur, we might not achieve the financial efficiencies that we have anticipated, and our future operating results and financial condition could be adversely affected.
An increasing amount of our cash and cash equivalents may in the future be held outside of the United States and we could be subject to repatriation delays and costs, which could reduce our financial flexibility.
Under our international structure, we expect an increasing amount of our cash and cash equivalents may in the future be held outside the U.S., while many of our liabilities are payable in the U.S. Repatriation of some of the funds could be subject to delay for local country approvals and could have potential adverse tax consequences. As a result of having a lower amount of future cash and cash equivalents in the U.S., our financial flexibility in the future may be reduced, particularly in the areas of acquisition and other investment activity.
Risks Relating to Our Sales
Because we sell a majority of our products through VADs, VARs, and OEMs, if we experience problems affecting our sales with these channel partners, our revenue, cash flow and market share could be harmed.
Our future success is highly dependent upon establishing and maintaining successful relationships with a variety of VADs, VARs, and OEMs, which we refer to as our channel partners. If our channel partners do not perform their services adequately or efficiently, fail to meet their obligations to us, exit the industry, elect to replace our products with products of our competitors or otherwise reduce or terminate our contractual relationship, and we are not able to quickly find adequate replacements, there could be a material adverse effect on our revenue, cash flow and market share.
We have dedicated a significant amount of effort to increase the use of our VADs and VARs in each of our theatres of operations. The percentage of our total revenue fulfilled from sales through our indirect channel was 93.4%, 92.5% and 93.0% for fiscal 2013, 2012 and 2011, respectively. We expect that over time, our channel partner sales will continue to constitute a significant majority of our total revenue. The table below represents the percentage of total revenue from our top channel partners:
Years ended July 31, 2013 2012 2011
ScanSource, Inc. (“Catalyst”) 20.8% 21.4% 19.4%Synnex Corp. 11.6% * *Avnet Logistics U.S. LP * 14.1% 17.1%Alcatel-Lucent * * 13.9%
(*) Indicates less than 10%.
AnnualR
eport

21
Because each of our top channel partners represents such a significant percentage of our overall revenue, the loss of all or substantially all sales generated by any one of these top channel partners would be harmful to our business. However, we cannot be certain that our top channel partners, or any of our other channel partners, will continue to sell our products and services at the same volumes, or at all, because we have no minimum purchase commitments with any of them and the contracts we do have generally provide that our channel partners use only reasonable commercial efforts to sell our products. In addition, our contracts with these channel partners do not prohibit them from offering products or services that compete with ours or from terminating our contracts on short notice. For example, our agreements with our top channel partners, ScanSource, Inc., Synnex Corp, and Avnet Logistics U.S. LP are all for no more than one-year terms.
Existing and future channel partners will likely make decisions about whether or not to sell our products based on the quality of our products, the market acceptance of our products, the fact that our direct sales channel may compete with them, whether we elect to establish relationships with channel partners they perceive to be competitive threats, the discounts we offer versus those that our competitors may provide and the commercial viability of our contracts with them. If we fail to maintain the quality of our products or to update and enhance them, existing and future channel partners may elect to work instead with one or more of our competitors. In addition, the terms of our arrangements with our channel partners must be commercially reasonable for both parties. If we are unable to reach agreements that are beneficial to both parties, then our channel partner relationships will not succeed. Our competitors may be effective in providing incentives to existing and potential channel partners to favor their products or to prevent or reduce sales of our products and services. Furthermore, we compete with some of our channel partners, including through our direct sales, which may lead these channel partners to use other suppliers that do not directly sell their own products and services. Other channel partners, particularly some of our OEMs who already have diverse product lines, may acquire one of our competitors or internally develop competitive products and then elect to limit or stop incorporating our solutions into their product lines. For this or any other reason, our channel partners may choose not to focus primarily on the sale of our products or offer our products at all. Some of our channel partners may have insufficient financial resources and may not be able to withstand changes in worldwide business conditions, including economic downturns, abide by our inventory and credit requirements, or have the ability to meet their financial obligations to us. The table below represents the percentage of total accounts receivable from our top channel partners:
July 31,2013
July 31,2012
ScanSource, Inc. (“Catalyst”) 21.4% 15.7%Synnex Corp. 12.1% *Avnet Logistics U.S. LP 13.1% 19.0%
(*) Indicates less than 10%.
In addition to being unable to meet financial obligations to us, channel partners who are impacted by the poor overall economic climate may be forced to layoff sales and support personnel, which may in turn negatively impact their ability to sell our products and services. These channel partners may also face cash flow problems that could prevent them from capitalizing on larger deals that would require them to make inventory purchases beyond their available cash or lines of credit. If the economic situation for these channel partners does not improve, we may be negatively impacted by increased bad debt or decreased sales or both.
Our reliance on our channel partners may expose us to additional risks that could harm our business.
By relying on our indirect channel partners for a significant percentage of our revenue, we may have less contact with the end users of our products, thereby making it more difficult for us to establish brand awareness, ensure proper delivery and installation of our products, service ongoing customer requirements and respond to evolving customer needs. Reduced contact with the end users of our products also would make it more difficult and more costly to establish direct sales relationships with these end users in the event our indirect relationships terminate. In addition, we may be exposed to import/export and other risks when our indirect channel partners make sales into restricted jurisdictions. We depend on our channel partners globally to comply with applicable regulatory requirements. To the extent that they fail to do so, that could have a material adverse effect on our business, operating results, and financial condition.
We may provide our indirect channel partners volume discounts off of our list prices, which could reduce our margin to the extent revenue from such channel partners increases as a proportion of our overall revenue. Historically, we have seen fluctuations in our gross margins based on changes in the balance of our distribution channels. Although variability to date has not been significant, there can be no assurance that changes in the balance of our distribution model in future periods would not have an adverse effect on our gross margins and profitability.

22
Recruiting and retaining qualified channel partners and training them in our technology and product offerings requires significant time and resources. In order to develop and expand our distribution channel, we must continue to scale and improve our processes and procedures that support our channel partners, including investment in systems and training, and those processes and procedures may become increasingly complex and difficult to manage. We have previously entered into OEM agreements with partners pursuant to which they rebrand and resell our products as part of their product portfolios. These types of relationships are complex and require additional processes and procedures that may be challenging and costly to implement, maintain and manage. Our failure to successfully manage and develop our distribution channel and the programs, processes and procedures that support it could adversely affect our ability to generate revenues from the sale of our products.
In addition, as we expand into new regions domestically and internationally, we incur substantial costs in hiring, training and retaining salespersons and system engineers in those territories to support our channel partners. If we are not successful in hiring and enabling these new sales personnel, then the revenues that we expect them to generate both directly and through our channel partners may not be sufficient to justify the expense and our business would be harmed.
Our sales cycles can be long and unpredictable, and our sales efforts require considerable time and expense. As a result, our sales are difficult to predict and may vary substantially from quarter to quarter, which may cause our operating results to fluctuate significantly.
The timing of our revenue is difficult to predict due the length of our sales cycle, the buying habits and budgetary considerations of our customers, the actual or perceived condition of the economy and the impact of revenue recognition rules on our sales agreements. The length of our sales cycle is influenced by a number of factors. First, because of the highly technical nature of our solutions, our sales efforts, particularly for our new products, involve educating our proposed customers about the use and benefits of our solutions, including the technical capabilities of our solutions and the potential cost savings our solutions can provide. Second, because a customer's decision to purchase certain of our products, particularly new products, involves a significant commitment of its resources, customers may undertake a significant evaluation process, which may involve not only our products but also those of our competitors. These customer evaluations typically range from four to nine months in length, but can be longer. In particular, customers considering the design and implementation of large network deployments may engage in very lengthy procurement processes that may delay or impact expected future orders. Specifically, we view the federal and service provider verticals as highly dependent on large transactions, and therefore we could experience fluctuations from period to period in these vertical.
Even after a customer makes the decision to purchase our solutions, there are a number of factors that may still impact the timing of the actual sale and recognition of revenue from that sale. For example, we may successfully complete a proof of concept with a customer and the customer's IT department may agree to make the purchase, but because of internal customer budget constraints, additional required departmental approvals or unplanned administrative, processing or other delays, the actual sale and deployment may be postponed. We have experienced and may experience in the future purchase delays due to the volatile global economic environment and due to customer anticipation of new Wi-Fi or other standards, or announced releases of new products or enhancements by our competitors or us. In addition, depending on the terms of the sale, we have from time to time been required to delay recognition of revenue from that purchase. If sales expected from a specific customer for a particular quarter are not realized in that quarter or at all, our business, operating results and financial condition could be adversely affected in a material way. In addition to the challenges presented by long sales cycles and risks of purchase delays by our customers, our revenue can also be difficult to predict due to customers that sporadically place large orders with short lead times. As a result, we cannot easily predict whether a sale will be completed, the particular fiscal period in which a sale will be completed or the fiscal period in which revenue from a sale will be recognized, which in turn makes our operating results difficult to forecast and may cause our operating results to vary significantly and unexpectedly from quarter to quarter.
Our ability to sell our solutions is highly dependent on the quality of our support and services offerings, and our failure to offer high quality support and services would have a material adverse effect on our sales and results of operations.
Our customers rely on our support and services organizations to assist them and our partners in implementing our solutions and resolving issues relating to our solutions. A high level of support is critical for the successful marketing and sale of our solutions. In some cases, our channel partners provide support directly to our end-customers. We do not have complete control over the level or quality of support provided by our channel partners. These channel partners may also provide support for other third-party products, which may potentially distract resources from support for our products. If we or our channel partners do not effectively assist our end customers in deploying our solutions, succeed in helping our end customers quickly resolve post-deployment issues, or provide effective ongoing support, it would adversely affect our ability to sell our products to existing customers and could harm our reputation with potential customers. In addition, as we expand our operations internationally, our support organization will face additional challenges, including those associated with delivering support, training and documentation in languages other than English. As a result, our failure, or the failure of our channel partners, to
AnnualR
eport

23
maintain high quality support and services would have a material adverse effect on our business, operating results and financial condition.
Sequestration or other actions of the U.S. Government resulting in significant cuts in U.S. government spending could adversely affect our sales and future results.
On August 2, 2011, the President signed into law the Budget Control Act of 2011, or the Budget Control Act, which raised the debt ceiling and put into effect a series of actions for deficit reduction. The Budget Control Act triggered automatic reductions in discretionary and mandatory spending, known as "sequestration" starting in 2013. As a result of sequestration, it is expected that federal government customers may become more cautious with contract awards and spending. Because we depend on several large vertical markets that rely directly or indirectly on federal support, including government, health care and education, any decreased spending as a result of sequestration would adversely impact our sales and future operating results.
In addition, the nation's debt ceiling is currently expected to be reached during the second half of calendar 2013. If the existing statutory limit on the amount of permissible federal debt is not raised, we may be required to continue to perform for some period of time on certain of our U.S. government contracts even if the U.S. government is unable to make timely payments. Furthermore, such limits could also potentially delay program/contract start dates in an effort to curb obligations until all debt negotiations are complete or the U.S. government may issue a stop work order and later order the work to resume or may terminate the contract altogether. While Congress and the Administration continue to debate how the nation should proceed on these issues, the outcome of that debate could have a significant impact on future U.S. Government spending plans.
Risks Relating to Our Manufacturing and Supply Chain
Because we outsource the manufacturing of most of our hardware products to third party manufacturers, if these manufacturers do not implement adequate quality controls or suffer significant changes in their financial or business condition, our ability to supply quality products to our customers could be disrupted and our business could be harmed.
We outsource the manufacturing of our products to primarily four contract manufacturers and original design manufacturers, Accton, Flextronics, Sercomm and Wistron NeWeb Corp, each of which conducts its manufacturing activities in China. Our reliance on these third-party manufacturers reduces our control over the manufacturing process and exposes us to a variety of risks, including: interruptions in steady flow of inventory at steady prices due to lack of long-term supply contracts, long lead times to qualify new third-party manufacturers, reduced control over quality assurance, product costs, and product supply and timing, increased reliance on system interoperability to ensure timely product deliveries, and the potential for infringement or misappropriation of our intellectual property.
Because these contract manufacturers are all located in Asia, we face additional risks, including supply interruption in the event of unrest, disease outbreak or other disruptions in the region. In addition, shipping products from Asia in the most cost-effective manner requires at least 22 days of travel by sea to the U.S., which in turn requires us to have significant advance notice of any inventory requirements. Any manufacturing disruption or shipping delay by these third-party manufacturers could severely impair our ability to fulfill orders.
Because we do not have long-term contracts with these manufacturers, we typically fulfill our supply requirements with individual orders. As a result, these manufacturers do not guarantee us any amount of capacity, the continuation of particular pricing terms or the extension of credit limits. This means that our third-party manufacturers are not obligated to continue to fulfill our supply requirements and could decrease or cease supplies to us or raise prices on short notice, which could result in supply shortages and negative effects on our gross margin. For example, our manufacturing agreement with Flextronics has only a one-year term, may not be renewed and may be terminated for any reason upon 180 days' advance written notice. In addition, our orders with these manufacturers represent a relatively small percentage of the overall orders received by them from their customers. As a result, fulfilling our orders may not be considered a priority in the event our contract manufacturers are constrained in their abilities to fulfill all of their customer obligations in a timely manner.
We provide demand forecasts to our contract manufacturers. If the demand forecast is binding and we overestimate our requirements, our contract manufacturers may assess charges, or we may have liabilities for excess inventory, each of which could negatively affect our gross margin. Conversely, because lead times for required materials and components vary significantly and depend on factors such as the specific supplier, contract terms and the demand for each component at a given time, if we underestimate our requirements, our contract manufacturers may have inadequate materials and components required to produce our products. This could result in an interruption of the manufacturing of our products, delays in shipments and deferral or loss of revenue. In addition, on occasion we have underestimated our requirements, and, as a result, we have

24
been required to pay additional fees to our contract manufacturers in order for manufacturing to be completed and shipments to be made on a timely basis.
If for any reason our manufacturers do not continue manufacturing our products, we will be required to identify one or more alternative manufacturers. It is time consuming, costly and often impractical to begin using new manufacturers. Also, the addition of manufacturing locations or contract manufacturers would increase the complexity of our supply chain management. In addition, changes in our third-party manufacturers may cause significant interruptions in supply if the new manufacturers have difficulty manufacturing products to our specifications. As a result, our ability to meet our scheduled product deliveries to our customers could be adversely affected, which could cause the loss of sales to existing or potential customers, delayed revenue or an increase in our costs.
Although we perform rigorous in-house quality control inspection and testing at both of our fulfillment centers to ensure the reliability and quality of our hardware components, we do not have the ability to control the manufacturing processes of our third-party manufacturers. As a result, quality or performance failures of our products due to the internal quality controls of our third-party manufacturers could disrupt our ability to supply quality products to our customers and thereby have a material adverse effect on our business, revenue and financial condition.
Some of our business processes depend upon our IT systems as well as the systems and processes of third parties. If those systems fail or are interrupted, our processes may function at a diminished level or not at all. This could negatively impact our ability to ship products or otherwise operate our business, and our financial results could be harmed. In addition, as a result of current global financial market conditions, natural disasters or other causes, it is possible that any of our manufacturers could experience interruptions in production, cease operations or alter our current arrangements, in which case our ability to ship products to our customers would be delayed, sales of our products would be negatively affected and our business, operating results and financial condition would be harmed.
Because our third-party manufacturers purchase some components, subassemblies and products from a single supplier or a limited number of suppliers, the loss of any of these suppliers could cause us to incur additional set-up costs, result in delays in manufacturing and delivering our products, cause us to carry excess or obsolete inventory and ultimately materially adversely affect our business.
To manufacture our products, we utilize components from many suppliers. Whenever possible, we strive to have multiple sources for these components to ensure continuous supply and competitive costs. We work in conjunction with the extensive supply chain management organizations at all of our manufacturing partners to select and utilize quality suppliers. However, several of the components we source are technically unique and only available from specific suppliers. We rely on our contract manufacturers to obtain the components, subassemblies and products necessary for the manufacture of our products and we do not maintain direct contractual supply arrangements with any of these suppliers. Any reduction or interruption in these components and subassemblies or a significant increase in the price of these supplies could have a negative impact on our business, particularly if supplies of technically unique components were disrupted.
For example, the chipsets that our contract manufacturers source and incorporate into our hardware products are currently available only from a limited number of suppliers. In addition, the majority of our access points incorporate components from Qualcomm, and some of our mobility controllers incorporate components from Broadcom. As a result, most of our product revenue is dependent upon the sale of products that incorporate components from Qualcomm or Broadcom. However, neither we, nor our manufacturing partners, have entered into any long-term supply agreements with these suppliers. As there are no other sources for identical components, in the event that our contract manufacturers are unable to obtain these components from Qualcomm or Broadcom, we would be required to redesign our hardware and software in order to incorporate components from alternative sources. The resulting stoppage or delay in selling our products and the expense of redesigning our products could result in lost sales opportunities and damage to customer relationships, which would adversely affect our reputation, business and operating results.
We also incorporate certain generally available software programs into our architecture through license agreements with third parties. Although we do not have supply agreements with Qualcomm or Broadcom, in some cases, we have entered into license agreements that allow us to incorporate certain of their components into our products. These license agreements are only for one-year terms and each may be terminated prior to the end of the then-current term. If these agreements were to be terminated, we would be required to redesign our hardware and software in order to incorporate technology from alternative sources.
Even when we have multiple sources for certain components and subassemblies, we remain subject to potential price increases and limited availability due to increased market demand for such components and subassemblies by third parties. In the past, unexpected demand for communication products caused worldwide shortages of certain electronic parts, making the predictability of component availability more limited. For example, from time to time, we have experienced component
AnnualR
eport

25
shortages that resulted in delays of product shipments. The development of alternate sources for those components is time-consuming, difficult, and costly. In addition, the lead times associated with certain components are lengthy and preclude rapid changes in quantities and delivery schedules. Any future growth in our business, IT spending and the economy in general is likely to create greater pressures on us and our suppliers to accurately forecast overall component demand and to establish optimal component inventories. We carry very little to no inventory of our product components, and we and our contract manufacturers rely on our suppliers to deliver necessary components in a timely manner. As a result, even if available, we or our contract manufacturers may not be able to secure sufficient components at reasonable prices or of acceptable quality to build products in a timely manner and, therefore, may not be able to meet customer demands for our products, which would have a material adverse effect on our business, operating results and financial condition.
Our inventory management relating to our sales to our two-tier distribution channel is complex, and excess inventory may harm our gross margins.
We must manage our inventory relating to sales to our distributors effectively because inventory held by them could affect our results of operations. Inventory management requires us to make forecasts that are based on multiple assumptions, each of which may cause our estimates to be inaccurate which, in turn, could negatively affect our ability to provide products to our customers. Our distributors may increase orders during periods of product shortages, cancel orders if their inventory is too high, or delay orders in anticipation of new products. They also may adjust their orders in response to the supply of our products and the products of our competitors that are available to them, and in response to seasonal fluctuations in end-user demand. Revenue to our distributors generally is recognized based on a sell-through method using information provided by them, and they are generally given business terms that allow them to rotate a portion of inventory, receive credits for changes in selling price, and participate in various cooperative marketing programs. Inventory management remains an area of focus as we balance the need to maintain strategic inventory levels to ensure competitive lead times against the risk of inventory obsolescence because of rapidly changing technology and customer requirements. When facing component supply-related challenges, we have increased our efforts in procuring components in order to meet customer expectations. If we ultimately determine that we have excess inventory, we may have to reduce our prices and write down inventory, which in turn could result in lower gross margins.
If we are unable to manage our supply chain and manufacturing to the actual demand for our solutions, our supply and manufacturing costs could increase, our ability to fulfill orders could be delayed, sales opportunities could be lost and our excess or obsolete inventory levels could increase, any of which could have an adverse impact on our gross margins, business and operating results.
To satisfy end customer and distribution center demand for our solutions, our product line management estimates demand on a rolling monthly basis and those forecasts drive the supply decisions that we make. Typically, we require 90 days from an initial estimate of a specified amount of product demand to actual delivery of that amount of product. If we significantly overestimate demand, an oversupply of product could result in excess or obsolete inventory level increases that could adversely affect our gross margin. Conversely, if actual demand for a specific product, such as our new .11ac access points, turns out to be significantly higher than our estimates, we could suffer any or all of the following adverse effects:
• we might be required to request expedited manufacture of additional product to satisfy the unexpected demand, which would result in supply chain and manufacturing surcharges and a decrease to our gross margins;
• we might be required to delay the sale and thereby delay recognition of revenue; or• if we are unable to deliver the product on an acceptable time frame for the customer, we may cause damage to our
reputation with both our customers and distributors, lose the sale opportunity and thereby cause a decrease to our revenue and harm to our business.
We have experienced occasional inventory shortages in the past, including shortages caused by manufacturing process and quality control issues, that have affected our operations. These issues are particularly acute during product transition periods, such as the one we are going through now with the roll-out of our 802.11ac access points. We may in the future experience a shortage of certain products as a result of manufacturing issues at our third party manufacturers or their downstream suppliers, capacity problems experienced by our third party manufacturers, or strong demand in the industry for subcomponents to our products. A return to robust growth in the economy is likely to create greater pressures on us and our suppliers to accurately project overall demand and to establish optimal supply levels and manufacturing capacity, especially for labor-intensive components and highly complex products. If shortages should occur for our product components or for the resources of our third party manufacturers, our costs are likely to increase or, in the worst case, supplies may not be available at all, in which case our revenue and gross margins could suffer until other sources can be developed.
In addition, we believe that we may be faced with the following supply chain and manufacturing challenges in the future: • new markets in which we participate may grow quickly, which may make it difficult to quickly obtain our product
requirements in a timely fashion;

26
• as we acquire companies and new technologies, we may be dependent, at least initially, on unfamiliar supply chains or relatively small supply partners that may not be reliable or cost-effective suppliers; and
• we may face new competition for the subcomponents used in our products from companies both in and outside of our mobile enterprise market.
Risks Relating to Our International Operations
Our international sales and operations subject us to additional risks that may adversely affect our operating results.
Our customers, suppliers and employees are located throughout the world. In fiscal 2013, approximately 37% of our revenue was generated by customers outside the U.S. As of July 31, 2013, we had approximately 280 sales and technical support personnel in numerous countries outside the U.S. In addition, some product configuration and fulfillment are handled in Singapore and a portion of our engineering, support and order management efforts are currently handled by personnel located in India and China. We expect to expand our offshore development efforts within India and China and expect to continue to add personnel in additional countries.
Because we have sizeable sales and operations outside the U.S., we have more complexity in our operations and are exposed to a set of global risks that could negatively impact sales or profitability, including:
• the difficulty and cost of managing and staffing international offices and the increased travel, infrastructure and legal compliance costs associated with multiple international locations;
• challenges in enforcing contracts and collecting accounts receivable, and longer payment cycles, especially in emerging markets;
• the need to localize our products for international customers, including customs classifications and certifications;• tariffs, trade barriers and trade disputes, import/export regulations and other regulatory or contractual limitations on
our ability to sell or develop our products in certain foreign markets;• changes in U.S. and non-U.S. rules related to trade, environmental, health and safety, technical standards and
consumer protection;• limited protection for intellectual property rights in some countries; • employment regulations and local labor laws, including increased cost of terminating international employees in
some countries;• tax issues, such as tax law and treaty changes, variations in tax laws from country to country and as compared to the
U.S., obligations under tax incentive agreements, difficulties in repatriating cash generated or held abroad in a tax-efficient manner and difficulties in securing local country approvals for cash repatriations;
• increased exposure to foreign currency exchange rate risk;• foreign exchange regulations, which may limit our ability to convert or repatriate foreign currency; • cultural, business practice and language differences; • increased exposure to instability in economic or political conditions, including inflation, recession and actual or
anticipated military or political conflicts; • natural disasters, public health issues or outbreaks of disease; and• litigation in foreign court systems and foreign administrative proceedings.
All of our hardware products are manufactured outside the U.S. in Asia. If manufacturing in this region is disrupted, our overall capacity could be significantly reduced and sales or profitability could be negatively impacted. We have engineering resources in India that could be disrupted as a result of hostilities in that country. We also sell our products and services throughout the Middle East and demand for our products and services could be negatively impacted by political conflicts and hostilities in this region. The potential for future unrest, terrorist attacks, increased global conflicts and the escalation of existing conflicts has created worldwide uncertainties that have negatively impacted, and may continue to negatively impact, demand for certain of our products.
As we continue to expand our business globally, our success will depend, in large part, on our ability to anticipate and effectively manage these and other risks associated with our international operations. Our failure to manage any of these risks successfully could harm our international operations and reduce our international sales, adversely affecting our business, operating results and financial condition.
We are subject to governmental export and import controls that could subject us to liability or impair our ability to compete in international markets.
Because we incorporate encryption technology into our products, our products are subject to U.S. export controls and may be exported outside the U.S. only with the required level of export license or through an export license exception. In addition, various countries regulate the import of certain encryption technology and radio frequency transmission equipment and have enacted laws that could limit our ability to distribute our products or could limit our customers' ability to implement
AnnualR
eport

27
our products in those countries. Changes in our products or changes in export and import regulations may increase the cost of building and selling our products, create delays in the introduction of our products in international markets, prevent our customers with international operations from deploying our products throughout their global systems or, in some cases, prevent the export or import of our products to certain countries altogether. Any change in export or import regulations or related legislation, shift in approach to the enforcement or scope of existing regulations, or change in the countries, persons or technologies targeted by such regulations, could result in decreased use of our products by, or in our decreased ability to export or sell our products to, existing or potential customers with international operations. In addition, because we sell through indirect channel partners, we may incur liabilities on account of actions by our channel partners, including such actions as inadvertent sales of our products to countries in violation of applicable import or export regulations. Any decreased use of our products or limitation on our ability to export or sell our products would harm our business, operating results and financial condition.
We may not successfully sell our products in certain international geographic markets or develop and manage new sales channels in accordance with our business plans.
We expect to continue to sell our products in certain international geographic markets where we do not have significant current business and to a broader customer base. To succeed in certain of these markets, we believe we will need to develop and manage new sales channels and distribution arrangements. Because we have limited experience in developing and managing such channels, we may not be successful in further penetrating certain geographic regions or reaching a broader customer base. In addition, certain geographic markets have slower wide area networks, which negatively impact the performance of certain of our solutions. As a result, local infrastructure insufficiencies or our failure to develop or manage additional sales channels effectively would limit our ability to succeed in these markets and could adversely affect our ability to grow our customer base and revenue.
We are exposed to fluctuations in currency exchange rates, which could negatively affect our financial condition and operating results.
To date, substantially all of our international sales have been denominated in U.S. dollars; however, most of our expenses associated with our international operations are denominated in local currencies. Foreign currencies periodically experience rapid fluctuations in value against the U.S. dollar. Any foreign currency devaluation against the U.S. dollar increases the real cost of our products to our customers and partners in foreign markets where we sell in U.S. dollars, which has resulted in the past and may result in the future in delayed or cancelled purchases of our products and, as a result, lower revenue. In addition, this increase in cost increases the risk to us that we will be unable to collect amounts owed to us by such customers or partners, which in turn would impact our revenue and could adversely impact our business and financial results in a material way. Any devaluation may also lead us to more aggressively discount our prices in foreign markets in order to maintain competitive pricing, which would negatively impact our revenue and gross margin. Conversely, a weakened U.S. dollar could increase the cost of local operating expenses and procurement of raw materials to the extent we purchase components in foreign currencies. To date, we have not used risk management techniques to hedge the risks associated with these fluctuations. Even if we were to implement hedging strategies, not every exposure can be hedged and, where hedges are put in place based on expected foreign currency exchange exposure, they are based on forecasts that may vary or that may later prove to have been inaccurate. As a result, fluctuations in foreign currency exchange rates or our failure to successfully hedge against these fluctuations could have a material adverse effect on our operating results and financial condition.
Failure to comply with the U.S. Foreign Corrupt Practices Act and similar laws associated with our activities outside the U.S. could subject us to penalties and other adverse consequences.
A significant portion of our revenue is and will be from jurisdictions outside of the U.S. As a result, we are subject to the U.S. Foreign Corrupt Practices Act, or the FCPA, which generally prohibits U.S. companies and their intermediaries from making corrupt payments to foreign officials for the purpose of directing, obtaining or keeping business, and requires companies to maintain reasonable books and records and a system of internal accounting controls. The FCPA applies to companies and individuals alike, including company directors, officers, employees and agents. Under the FCPA, we may be held liable for the corrupt actions taken by our employees, strategic or local partners or other representatives. In addition, the government may seek to rely on a theory of successor liability and hold us responsible for FCPA violations committed by companies or associated with assets that we acquire.
In many foreign countries where we operate, particularly in countries with developing economies, local laws and customs may differ significantly from those in the U.S. For example, it may be a local custom in certain countries for businesses to engage in practices that are prohibited by our internal policies and procedures or U.S. regulations applicable to us, such as the FCPA and the U.K. Bribery Act. Even though we have conducted formal FCPA compliance training, we cannot guarantee that that our employees, contractors, and agents will comply with all of our policies and procedures. As a result of our rapid growth,

28
our development of infrastructure designed to identify FCPA matters and monitor compliance is at an early stage. If we or our intermediaries fail to comply with the requirements of the FCPA or similar legislation (whether intentionally or accidentally), governmental authorities in the U.S. and elsewhere could seek to impose civil and/or criminal fines and penalties which could have a material adverse effect on our business, operating results and financial conditions. We may also face collateral consequences such as debarment and the loss of our export privileges.
Risks Relating to Intellectual Property and Security
Claims by others that we infringe their intellectual property rights could harm our business.
Third parties have asserted and may in the future assert claims of infringement of intellectual property rights against our company, our customers or our channel partners. Due to the rapid pace of technological change in our industry, much of our business and many of our products rely on proprietary technologies of third parties, and we may not be able to obtain, or continue to obtain, licenses from such third parties on reasonable terms. Technology companies frequently enter into litigation based on allegations of patent infringement or other violations of intellectual property rights. In addition, patent holding companies seek to monetize patents they have purchased or otherwise obtained. As our business expands, through acquisitions or organically, and the number of products and competitors in our market increases, we expect that infringement claims may increase in number and significance. Intellectual property lawsuits are subject to inherent uncertainties due to the complexity of the technical issues involved, and we cannot be certain that we will be successful in defending ourselves against intellectual property claims. Furthermore, a successful claimant could secure a judgment that requires us to pay substantial damages or prevents us from distributing certain products or performing certain services. In addition, we might be required to seek a license for the use of this intellectual property, which may not be available on commercially acceptable terms or at all. Alternatively, we may be required to develop non-infringing technology, which could require significant effort and expense and may ultimately not be successful. Any claims or proceedings against us, whether meritorious or not, could be time consuming, result in costly litigation, require significant amounts of management time, result in the diversion of significant operational resources, or require us to enter into royalty or licensing agreements, or require us to pay substantial settlement amounts or judgment damages. In an effort to avoid costly litigation or for other reasons, we may determine to settle these types of claims or proceedings at any time, and the amounts we may have to pay could be material. In light of our operation results, a large settlement or non-appealable judgment could have a material adverse effect on our financial condition.
System security risks, data protection breaches, and cyber-attacks on our systems or products could compromise our proprietary information, disrupt our internal operations and harm public perception of our products, which could cause our business and reputation to suffer, create additional liabilities and adversely affect our financial results and stock price.
In the ordinary course of business, we store sensitive data, including intellectual property, our proprietary business information and that of our customers, suppliers and business partners on our internal systems and networks. Additionally, we design and sell products that allow our customers to wirelessly access sensitive data on their own systems. Our products incorporate complex technology and must operate and support a wide range of mobile devices that use Wi-Fi as well as the complex applications that run on those devices, which use multiple communication industry standards. The secure maintenance of sensitive information on our own networks and the intrusion protection features of our products are both critical to our operations and business strategy.
Increasingly, companies are facing a wide variety of attacks from computer “hackers” who develop and deploy destructive software programs (such as viruses and worms) to attack networks. Due to our business model and the location of some of our development centers, we have faced and are likely to face similar threats that target both our internal systems and our products, which, in turn, may threaten our customers' networks, devices and applications. Because the techniques used by hackers to access or sabotage networks are becoming increasingly sophisticated, change frequently and generally are not recognized until launched against a target, even with the significant efforts we take to create security barriers to such attacks, it is virtually impossible for us to entirely eliminate this risk. Additionally, our information technology and infrastructure may be breached due to employee error, malfeasance (either internal or external and either at home or abroad) or other disruptions.
Although we make significant efforts to maintain the security and integrity of our systems and products, any destructive or intrusive breach of our internal systems could compromise our networks, creating system disruptions or slowdowns, and the information stored on our networks could be accessed, publicly disclosed, lost or stolen. Additionally, an effective attack on our products could disrupt the proper functioning of our products, allow unauthorized access to sensitive, proprietary or confidential information of ours or our customers, disrupt or temporarily interrupt customers' networking traffic, or cause other destructive outcomes.
Real or perceived defects or errors in our products (particularly in our cloud-based offerings which are sometimes perceived as being inherently less secure) could result in claims by channel partners and end-customers for losses that they
AnnualR
eport

29
sustain, including potentially losses resulting from security breaches of our end-customers' networks and/or downtime of those networks. If channel partners or end-customers make these types of claims, we may be required, or may choose, for customer relations or other reasons, to expend additional resources in order to help correct the problem, including warranty and repair costs, process management costs and costs associated with re-manufacturing our inventory. In addition, if an actual or perceived breach of security occurs in our network or in the network of a customer of one of our products (particularly our cloud-based offerings), regardless of whether the breach is attributable to our products, the market perception of the effectiveness of our products could be harmed. The economic costs to us to eliminate or alleviate cyber or other security problems, viruses, worms, malicious software systems and security vulnerabilities could be significant and may be difficult to anticipate or measure because the damage may differ based on the identity and motive of the programmer or hacker, which are often difficult to identify.
There has been a sharp increase in laws in Europe, the U.S. and elsewhere imposing requirements for the handling of personal data, including data of employees, consumers and business contacts as well as privacy-related matters. For example, the State of California has adopted legislation requiring operators of commercial websites and mobile applications that collect personal information from California residents to conspicuously post and comply with privacy policies that satisfy certain requirements. Several other U.S. states have adopted legislation requiring companies to protect the security of personal information that they collect from consumers over the Internet, and more states may adopt similar legislation in the future. The European Union also has adopted various directives regulating data privacy and security and the transmission of content using the Internet involving residents of the European Union, including those directives known as the Data Protection Directive, the E-Privacy Directive, and the Privacy and Electronic Communications Directive, and may adopt similar directives in the future. Given the variety of global privacy and data protection regimes, it is possible we may find ourselves subject to inconsistent obligations. In addition, there is a risk that failures in systems designed to protect private, personal or proprietary data held by us will allow such data to be disclosed to or seen by others, resulting in application of regulatory penalties, enforcement actions, remediation obligations and/or private litigation by parties whose data were improperly disclosed. There is also a risk that we (directly or as the result of some third-party service provider we use) could be found to have failed to comply with the laws or regulations of some country regarding the collection, consent, handling, transfer, or disposal of such personal data, which could subject us to fines or other sanctions, as well as adverse reputational impact.
If we are unable to protect our intellectual property rights, our competitive position could be harmed or we could be required to incur significant expenses to enforce our rights.
We depend on our ability to protect our proprietary technology. We protect our proprietary information and technology through licensing agreements, third-party nondisclosure agreements and other contractual provisions, as well as through patent, trademark, copyright and trade secret laws in the U.S. and similar laws in other countries. We cannot provide assurances that these protections will be available in all cases or will be adequate to prevent our competitors from copying, reverse engineering or otherwise obtaining and using our technology, proprietary rights or products. For example, the laws of certain countries in which our products are manufactured or licensed do not protect our proprietary rights to the same extent as the laws of the U.S., and mechanisms for enforcement of intellectual property rights may be inadequate. In addition, third parties may seek to challenge, invalidate or circumvent our patents, trademarks, copyrights and trade secrets, or applications for any of the foregoing. To prevent substantial unauthorized use of our intellectual property rights, it may be necessary to prosecute actions for infringement and/or misappropriation of our proprietary rights against third parties. Any action that we initiate could result in significant costs and diversion of our resources and management's attention, and there can be no assurance that we will be successful. Furthermore, many of our current and potential competitors have the ability to dedicate substantially greater resources to enforce their intellectual property rights than we do. Accordingly, despite our efforts, we may not be able to prevent third parties from infringing upon or misappropriating our intellectual property.
Enterprises are increasingly concerned with the security of their data, and to the extent they elect to encrypt data between the end user and the server, our products will become less effective.
Our products depend on the ability to identify applications. Our products currently do not identify applications if the data is encrypted as it passes through our mobility controllers. Since most organizations currently encrypt most of their data transmissions only between sites and not on the LAN, the data is not encrypted when it passes through our mobility controllers. If more organizations elect to encrypt their data transmissions from the end user to the server, our products will offer limited benefits unless we have been successful in incorporating additional functionality into our products that address those encrypted transmissions. At the same time, if our products do not provide the level of network security expected by our customers, our reputation and brand would be damaged, and we would expect to experience decreased sales. Our failure to provide such additional functionality and expected level of network security could adversely affect our business, operating results and financial condition.

30
Our use of open source software could impose limitations on our ability to commercialize our products.
We incorporate open source software into our products. Use and distribution of open source software may entail greater risks than use of third-party commercial software, as open source licensors generally do not provide warranties or other contractual protections regarding infringement claims or the quality of the code. Some open source licenses contain requirements that we make available source code for modifications or derivative works we create based upon the type of open source software we use. If we combine our proprietary software with open source software in a certain manner, we could, under certain of the open source licenses, be required to release the source code of our proprietary software to the public. This could allow our competitors to create similar products with lower development effort and time, and ultimately could result in a loss of product sales for us.
Although we monitor our use of open source closely, the terms of many open source licenses have not been interpreted by U.S. courts, and there is a risk that such licenses could be construed in a manner that could impose unanticipated conditions or restrictions on our ability to commercialize our products. We could also be subject to similar conditions or restrictions should there be any changes in the licensing terms of the open source software incorporated into our products. In either event, we could be required to seek licenses from third parties in order to continue offering our products, to re-engineer our products or to discontinue the sale of our products in the event re-engineering cannot be accomplished on a timely basis, any of which could adversely affect our business, operating results and financial condition.
We rely on the availability of third-party licenses and could be subject to product release or shipment delays if we were unable to renew existing licenses or enter into applicable licenses for product enhancements or new products.
Many of our products are designed to include software or other intellectual property licensed from third parties. For example, our products incorporate certain technology that we license from Qualcomm. From time to time, we may be required to seek or renew licenses relating to various aspects of these products or to seek additional licenses for product enhancements or new products. There can be no assurance that the necessary licenses would be available on acceptable terms, if at all. The inability to obtain certain licenses or other rights or to obtain such licenses or rights on favorable terms, or the need to engage in litigation regarding these matters, could result in delays in product releases or shipments until such time, if ever, as equivalent technology could be identified, licensed or developed and integrated into our products and might have a material adverse effect on our business, operating results, and financial condition. Moreover, the inclusion in our products of software or other intellectual property licensed from third parties on a nonexclusive basis could limit our ability to protect our proprietary rights in our products.
Our business is subject to the risks of earthquakes, fire, floods and other natural catastrophic events, and to interruption by man made problems such as computer viruses or terrorism.
Our corporate headquarters are located in the San Francisco Bay Area, a region known for seismic activity. A significant natural disaster, such as an earthquake, fire or a flood, occurring at our headquarters or in either China or Singapore, where our major contract manufacturers and distribution centers are located, could have a material adverse impact on our business, operating results and financial condition. In addition, our support operations are largely concentrated in a single location in India. A natural catastrophe in this location can bring down our support operation. Our servers are vulnerable to computer viruses, break-ins and similar disruptions from unauthorized tampering with our computer systems. In addition, natural disasters, acts of terrorism or war could cause disruptions in our or our customers' businesses or the economy as a whole. We also rely on information technology systems to communicate among our workforce and with third parties. Any disruption to our communications, whether caused by a natural disaster or by man made problems, such as power disruptions, could adversely affect our business. To the extent that any such disruptions result in delays or cancellations of customer orders, or the deployment of our products, our business, operating results and financial condition would be adversely affected.
Risks Relating to Applicable Laws and Regulations
New regulations or changes in existing regulations related to our products may result in unanticipated costs or liabilities, which could place additional burdens on the operations of our business and have a material adverse effect on our future sales, business and results of operations.
Our products are subject to governmental regulations in a variety of jurisdictions. If any of our products becomes subject to new regulations or if any of our products becomes specifically regulated by additional government entities, compliance with such regulations could become more burdensome, and there could be a material adverse effect on our business and results of operations. For example, radio emissions are subject to regulation in the U.S. and in other countries in which we do business. In the U.S., various federal agencies including the Center for Devices and Radiological Health of the Food and Drug Administration, the Federal Communications Commission, the Occupational Safety and Health Administration and various state agencies have promulgated regulations that concern the use of radio/electromagnetic emissions standards. Member
AnnualR
eport

31
countries of the European Union, or EU, have enacted similar standards concerning electrical safety and electromagnetic compatibility and emissions, and chemical substances and use standards.
If any of our products becomes subject to new regulations or if any of our products becomes specifically regulated by additional government entities, compliance with such regulations could become more burdensome. In addition, our wireless communication products operate through the transmission of radio signals. Currently, operation of these products in specified frequency bands does not require licensing by regulatory authorities. Regulatory changes restricting the use of frequency bands or allocating available frequencies could become more burdensome. If either of these were to occur, there could be a material adverse effect on our future sales, business and results of operations.
Compliance with environmental matters and worker health and safety laws could be costly, and noncompliance with these laws could have a material adverse effect on our results of operations, expenses and financial condition.
Some of our operations use substances regulated under various federal, state, local and international laws governing the environment and worker health and safety, including those governing the discharge of pollutants into the ground, air and water, the management and disposal of hazardous substances and wastes, and the cleanup of contaminated sites. Some of our products are subject to various federal, state, local and international laws governing chemical substances in electronic products. We could be subject to increased costs, fines, civil or criminal sanctions, third-party property damage or personal injury claims if we violate or become liable under environmental and/or worker health and safety laws.
We may be unable to obtain a sufficient supply of components and parts that are verified free of conflict minerals, which could result in a shortage of such components and parts, reputational damages or loss of sales if we are unable to determine that our products are free of such minerals.
The Dodd-Frank Act included disclosure requirements regarding the use of “conflict” minerals mined from the Democratic Republic of Congo and adjoining countries (or DRC) and procedures regarding a manufacturer's efforts to prevent the sourcing of such “conflict” minerals. The final rules implementing these requirements were released in August 2012. The short implementation time frame may limit the pool of suppliers who can provide us verifiable DRC Conflict Free components and parts, and we are not certain that we will be able to obtain products in sufficient quantities that meet the DRC Conflict Free determination as required by the rule in order to declare our products DRC Conflict Free. Compliance with these rules is also likely to result in additional cost and expense, including the cost associated with the due diligence required to determine and verify the sources of any conflict minerals used in our products, in addition to the cost of remediation and other changes to products, processes, or sources of supply as a consequence of such verification activities. These rules may also affect the sourcing and availability of minerals used in the manufacture of our products, as there may be only a limited number of suppliers offering “conflict free” metals that can be used in our products. In addition, local states and other countries in which we do business may enact legislation that bars their departments and agencies from purchasing products from companies that are unable to certify that all product components are from conflict-free sources (whether DRC or otherwise). As a result, we may face reputational challenges and the loss of sales if we are required to publicly state that we are unable to sufficiently verify the origins for the defined “conflict” metals used in our products.
We incur significant costs as a result of operating as a public company, and our Board of Directors and management devote substantial time to compliance initiatives.
We incur significant legal, accounting and other expenses as a public company, including costs resulting from regulations regarding corporate governance practices and costs relating to compliance with the Sarbanes-Oxley Act. For example, the listing requirements of the NASDAQ Stock Market's Global Select Market require that we satisfy certain corporate governance requirements relating to independent directors, audit committees, distribution of annual and interim reports, stockholder meetings, stockholder approvals, solicitation of proxies, conflicts of interest, stockholder voting rights and codes of conduct. In addition, the Dodd-Frank Wall Street Reform and Consumer Protection Act contains various provisions applicable to the corporate governance functions of public companies. Our Board of Directors, management and other personnel devote a substantial amount of time to these compliance initiatives. Moreover, these rules and regulations have increased our legal and financial compliance costs and will make some activities more time consuming and costly. Moreover, these rules and regulations and their associated costs both in terms of time and expense could make it more difficult for us to attract, recruit and retain qualified persons to serve on our Board of Directors, our board committees or as executive officers or other key personnel.
Failure of our suppliers, subcontractors, distributors, resellers and representatives to use acceptable legal or ethical business practices could negatively impact our business.
It is our policy to require our suppliers, subcontractors, distributors, resellers, and third-party sales representatives to operate in compliance with applicable laws, rules and regulations regarding working conditions, employment practices,

32
environmental compliance, anti-corruption and trademark and copyright licensing. However, we do not control their labor and other business practices. If one of our suppliers, subcontractors, distributors, resellers, or other representatives violates labor or other laws or implements labor or other business practices that are regarded as unethical, the shipment of finished products to us could be interrupted, orders could be canceled, relationships could be terminated and our reputation could be damaged. If one of our suppliers or subcontractors fails to procure necessary license rights to trademarks, copyrights or patents, legal action could be taken against us that could impact the salability of our products and expose us to financial obligations to a third-party. Any of these events could have a negative impact on our sales and results of operations.
Risks Related to Ownership of our Common Stock
Our stock price may be volatile.
The trading price of our common stock has been and may continue to be volatile and could be subject to wide fluctuations in response to various factors, some of which are beyond our control. Factors that could affect the trading price of our common stock could include:
• variations in our operating results;• announcements of technological innovations, new products or product enhancements, strategic alliances or
significant agreements by us or by our competitors;• the gain or loss of significant customers;• recruitment or departure of key personnel;• the impact of unfavorable worldwide economic and market conditions;• variations between our actual financial results and the published expectations of analysts;• developments or disputes concerning our intellectual property or other proprietary rights;• commencement of, or our involvement in, litigation;• announcements by or about us regarding events or news adverse to our business;• the loss or bankruptcy of any of our major customers, distribution partners or suppliers;• variations in the operating results of other publicly traded corporations deemed by investors to be in our peer group;• an announced acquisition of or by a competitor, or an announced acquisition of or by us;• rumors and market speculation involving us or other companies in our industry;• providing estimates of our future operating results, or changes in these estimates, either by us or by any securities
analysts who follow our common stock, or changes in recommendations by any securities analysts who follow our common stock;
• significant sales, or announcement of significant sales, of our common stock by us or our stockholders;• adoption or modification of regulations, policies, procedures or programs applicable to our business; and• other events or factors, including those resulting from war, incidents of terrorism or responses to these events.
In addition, the stock market in general, and the market for technology companies in particular, has experienced extreme price and volume fluctuations that have often been unrelated or disproportionate to the operating performance of those companies. Broad market and industry factors may seriously affect the market price of our common stock, regardless of our actual operating performance. In addition, in the past, following periods of volatility in the overall market and the market price of a particular company's securities, securities class action litigation has often been instituted against these companies. This litigation could result in substantial costs and a diversion of our management's attention and resources. All of these factors could cause the market price of our common stock to decline, and investors may lose some or all of the value of their investment.
If securities or industry analysts do not publish research or reports about our business, or if they issue an adverse or misleading opinion regarding our stock, our stock price and trading volume could decline.
The trading market for our common stock will be influenced by the research and reports that industry or securities analysts publish about us or our business. If any of the analysts who cover us issue an adverse or misleading opinion regarding our stock, our stock price would likely decline. If one or more of these analysts cease coverage of our company or fail to publish reports on us regularly, we could lose visibility in the financial markets, which in turn could cause our stock price or trading volume to decline.
Provisions in our charter documents, Delaware law, employment arrangements with certain of our executives, and our OEM supply agreement with Alcatel-Lucent could discourage a takeover that stockholders may consider favorable.
Provisions in our certificate of incorporation and bylaws may have the effect of delaying or preventing a change of control or changes in our management. These provisions include the following:
• our Board of Directors has the right to elect directors to fill a vacancy created by the expansion of the Board of
AnnualR
eport

33
Directors or the resignation, death or removal of a director, which prevents stockholders from being able to fill vacancies on our Board of Directors;
• our stockholders may not act by written consent or call special stockholders' meetings; as a result, a holder, or holders, controlling a majority of our capital stock would not be able to take certain actions other than at annual stockholders' meetings or special stockholders' meetings called by the Board of Directors, the Chairman of the Board, the Chief Executive Officer or the President;
• our certificate of incorporation prohibits cumulative voting in the election of directors, which limits the ability of minority stockholders to elect director candidates;
• stockholders must provide advance notice and additional disclosures in order to nominate individuals for election to the board of directors or to propose matters that can be acted upon at a stockholders' meeting, which may discourage or deter a potential acquirer from conducting a solicitation of proxies to elect the acquirer's own slate of directors or otherwise attempting to obtain control of our company; and
• our Board of Directors may issue, without stockholder approval, shares of undesignated preferred stock; the ability to issue undesignated preferred stock makes it possible for our board of directors to issue preferred stock with voting or other rights or preferences that could impede the success of any attempt to acquire us.
As a Delaware corporation, we are also subject to certain Delaware anti-takeover provisions. Under Delaware law, a corporation may not engage in a business combination with any holder of 15% or more of its capital stock unless the holder has held the stock for three years or, among other things, the Board of Directors has approved the transaction. Our Board of Directors could rely on Delaware law to prevent or delay an acquisition of us.
Certain of our executives may be entitled to accelerated vesting of their stock options pursuant to the terms of their employment arrangements upon a change of control of our company. In addition to the arrangements currently in place with some of our executives, we may enter into similar arrangements in the future with other executives. Such arrangements could delay or discourage a potential acquisition of our company.
In addition, our OEM supply agreement with Alcatel-Lucent provides that, in the event of a change of control that would cause Alcatel-Lucent to purchase our products from an entity that is an Alcatel-Lucent competitor, we must, without additional consideration, (1) provide Alcatel-Lucent with any information required by Alcatel-Lucent to make, test and support the products that we distribute through our OEM relationship with Alcatel-Lucent, including all hardware designs and software source code, and (2) otherwise cooperate with Alcatel-Lucent to transition the manufacturing, testing and support of these products to Alcatel-Lucent. We are also obligated to promptly inform Alcatel-Lucent if and when we receive an inquiry concerning a bona fide proposal or offer to effect a change of control and will not enter into negotiations concerning a change of control without such prior notice to Alcatel-Lucent. Each of these provisions could delay or result in a discount to the proceeds our stockholders would otherwise receive upon a change of control or could discourage a third party from making a change of control offer.
We are required to evaluate our internal control over financial reporting under the Sarbanes-Oxley Act of 2002 and any adverse results from such evaluation could result in a loss of investor confidence in our financial reports and have an adverse effect on our stock price.
The Sarbanes-Oxley Act requires us to furnish a report by our management on our internal control over financial reporting. Such report contains, among other matters, an assessment of the effectiveness of our internal control over financial reporting as of the end of our fiscal year, including a statement as to whether or not our internal control over financial reporting is effective. This assessment must include disclosure of any material weaknesses in our internal control over financial reporting identified by management. We must continue to monitor, enhance and assess our internal control over financial reporting. If we are unable to assert in any future reporting period that our internal control over financial reporting is effective (or if our independent registered public accounting firm is unable to express an opinion on the effectiveness of our internal control over financial reporting), we could lose investor confidence in the accuracy and completeness of our financial reports, which would have an adverse effect on our stock price.

34
ITEM 1B. UNRESOLVED STAFF COMMENTS
Not applicable.
ITEM 2. PROPERTIES
As of July 31, 2013, we leased approximately 500,000 square feet of space in our domestic and international locations. Approximately 60% of our leased properties are located in the U.S.. These domestic locations are primarily located in Sunnyvale California, which is where our corporate headquarters and warehouse facilities are located. Our international locations, which comprise approximately 40% of all our properties, are mainly located in India and China. Our international properties are primarily used for customer service centers, sales offices and research and development facilities. A significant portion of our office leases will expire in fiscal 2016. See Note 13, Commitments and Contingencies, of the Notes to Consolidated Financial Statements for information regarding our lease obligations.
We believe that our current facilities are suitable and adequate to meet our current needs and we intend to add new facilities or expand existing facilities as necessary.
ITEM 3. LEGAL PROCEEDINGS
The information set forth under the heading "Legal Matters" in Note 13, Commitments and Contingencies, of Notes to Consolidated Financial Statements, in Item 8 of Part II of this Annual Report on Form 10-K, is incorporated herein by reference. For additional discussion of certain risks associated with legal proceedings, see Item 1A, “Risk Factors.”
ITEM 4. MINE SAFETY DISCLOSURES
Not applicable.
AnnualR
eport

35
PART II
ITEM 5. MARKET FOR REGISTRANT’S COMMON EQUITY, RELATED STOCKHOLDER MATTERS AND ISSUER REPURCHASES OF EQUITY SECURITIES
Market Information for Our Common Stock
Our common stock is traded on the NASDAQ Global Select Market under the symbol “ARUN”. The following table sets forth, for the periods indicated, the high and low sales prices for our common stock as reported on the Nasdaq Global Select Market.
High Low
Fiscal 2012First Quarter $ 25.55 $ 16.20Second Quarter $ 25.10 $ 17.20Third Quarter $ 25.00 $ 19.20Fourth Quarter $ 21.05 $ 12.36Fiscal 2013First Quarter $ 22.49 $ 13.20Second Quarter $ 23.70 $ 17.87Third Quarter $ 26.02 $ 20.80Fourth Quarter $ 22.05 $ 13.07
Holders
As of September 18, 2013, there were approximately 248 holders of record of our common stock. Because many of our shares are held by brokers and other institutions on behalf of stockholders, we are unable to estimate the total number of stockholders represented by these record holders.
Stock Performance Graph
The following graph compares, for the period between July 31, 2008 and July 31, 2013, the cumulative total stockholder return for our common stock, the NASDAQ Composite Index and the NASDAQ Computer Index. The graph assumes that $100 was invested on July 31, 2008 in our common stock, the NASDAQ Composite Index and the NASDAQ Computer Index and assumes reinvestment of any dividends. The stock price performance on the following graph is not necessarily indicative of future stock price performance. This performance graph shall not be deemed “filed” for purposes of Section 18 of the Securities Exchange Act of 1934, as amended (the “Exchange Act”), or incorporated by reference into any of our filings under the Exchange Act or the Securities Act of 1933, as amended, except as shall be expressly set forth by specific reference in such filing.

36
Dividend Policy
We have never declared or paid any cash dividend on our capital stock. We currently intend to retain any future earnings and do not expect to pay any dividends in the foreseeable future.
Repurchases of Equity Securities by the Issuer and Affiliated Purchasers
On June 13, 2012, we announced a stock repurchase program for up to $100.0 million of our common stock, which was increased by an additional $100.0 million on July 15, 2013. We are authorized to make repurchases in the market until our Board of Directors' terminates the program or until expenditures reach the authorized amount, whichever occurs first. Any repurchases under the program will be funded from available working capital. The number of shares repurchased and the timing of repurchases are based on the price of our common stock, general business and market conditions, and other investment considerations. Shares are retired upon repurchase. Our policy related to repurchases of our common stock is to charge any excess of cost over par value entirely to additional paid-in capital. During our fiscal years ended July 31, 2013 and 2012, we repurchased a total of 5,311,332 shares and 1,408,504 shares, respectively, for a total of purchase price of $86.2 million and $19.9 million, respectively. At July 31, 2013, $93.9 million remains authorized for repurchase under our stock repurchase program.
AnnualR
eport

37
Common stock repurchase activity under our repurchase program during our fiscal 2013 and 2012 was as follows (in thousands, except number of shares and per share amounts):
Total Number ofShares Purchased
Average PricePer Share
Total Number ofShares Purchased As Part
of Publicly Announced Plan
Maximum ApproximateDollar Value of Shares
That May Yet Be PurchasedUnder the Program
(in thousands)
Year ended July 31, 2012May 1, 2012 - May 31, 2012 — $ — — $ —June 1, 2012 - June 30, 2012 480,659 14.55 480,659 $ 93,008July 1, 2012 - July 31, 2012 927,845 13.90 927,845 $ 80,115
Total 1,408,504 $ 14.12 1,408,504
Year ended July 31, 2013August 1, 2012 - August 31, 2012 — $ — — $ 80,115September 1, 2012 - September 30, 2012 79,437 19.98 79,437 $ 78,529October 1, 2012 - October 31, 2012 510,704 19.46 510,704 $ 68,592November 1, 2012 - November 30, 2012 1,014,001 18.72 1,014,001 $ 49,605December 1, 2012 - December 31, 2013 — — — $ 49,605January 1, 2013 - January 31, 2013 — — — $ 49,605February 1, 2013 - February 28, 2013 — — — $ 49,605March 1, 2013 - March 31, 2013 — — — $ 49,605April 1, 2013 - April 30, 2013 — — — $ 49,605May 1, 2013 - May 31, 2012 1,754,370 13.68 1,754,370 $ 25,611June 1, 2013 - June 30, 2013 68,262 14.73 68,262 $ 24,605July 1, 2013 - July 31, 2013 1,884,558 16.29 1,884,558 $ 93,906
Total 5,311,332 $ 16.23 5,311,332
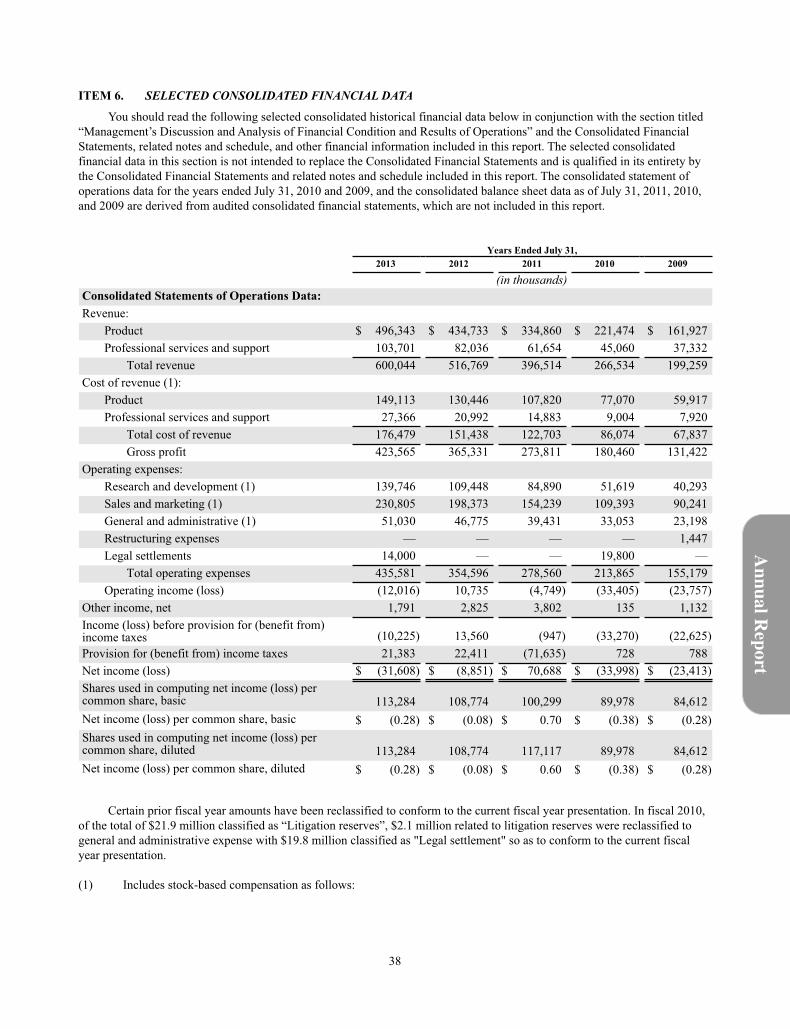
38
ITEM 6. SELECTED CONSOLIDATED FINANCIAL DATA
You should read the following selected consolidated historical financial data below in conjunction with the section titled “Management’s Discussion and Analysis of Financial Condition and Results of Operations” and the Consolidated Financial Statements, related notes and schedule, and other financial information included in this report. The selected consolidated financial data in this section is not intended to replace the Consolidated Financial Statements and is qualified in its entirety by the Consolidated Financial Statements and related notes and schedule included in this report. The consolidated statement of operations data for the years ended July 31, 2010 and 2009, and the consolidated balance sheet data as of July 31, 2011, 2010, and 2009 are derived from audited consolidated financial statements, which are not included in this report.
Years Ended July 31, 2013 2012 2011 2010 2009 (in thousands)Consolidated Statements of Operations Data:Revenue:
Product $ 496,343 $ 434,733 $ 334,860 $ 221,474 $ 161,927Professional services and support 103,701 82,036 61,654 45,060 37,332
Total revenue 600,044 516,769 396,514 266,534 199,259Cost of revenue (1):
Product 149,113 130,446 107,820 77,070 59,917Professional services and support 27,366 20,992 14,883 9,004 7,920
Total cost of revenue 176,479 151,438 122,703 86,074 67,837Gross profit 423,565 365,331 273,811 180,460 131,422
Operating expenses:Research and development (1) 139,746 109,448 84,890 51,619 40,293Sales and marketing (1) 230,805 198,373 154,239 109,393 90,241General and administrative (1) 51,030 46,775 39,431 33,053 23,198Restructuring expenses — — — — 1,447Legal settlements 14,000 — — 19,800 —
Total operating expenses 435,581 354,596 278,560 213,865 155,179Operating income (loss) (12,016) 10,735 (4,749) (33,405) (23,757)
Other income, net 1,791 2,825 3,802 135 1,132Income (loss) before provision for (benefit from)income taxes (10,225) 13,560 (947) (33,270) (22,625)Provision for (benefit from) income taxes 21,383 22,411 (71,635) 728 788Net income (loss) $ (31,608) $ (8,851) $ 70,688 $ (33,998) $ (23,413)Shares used in computing net income (loss) percommon share, basic 113,284 108,774 100,299 89,978 84,612Net income (loss) per common share, basic $ (0.28) $ (0.08) $ 0.70 $ (0.38) $ (0.28)Shares used in computing net income (loss) percommon share, diluted 113,284 108,774 117,117 89,978 84,612Net income (loss) per common share, diluted $ (0.28) $ (0.08) $ 0.60 $ (0.38) $ (0.28)
Certain prior fiscal year amounts have been reclassified to conform to the current fiscal year presentation. In fiscal 2010, of the total of $21.9 million classified as “Litigation reserves”, $2.1 million related to litigation reserves were reclassified to general and administrative expense with $19.8 million classified as "Legal settlement" so as to conform to the current fiscal year presentation.
(1) Includes stock-based compensation as follows:
AnnualR
eport
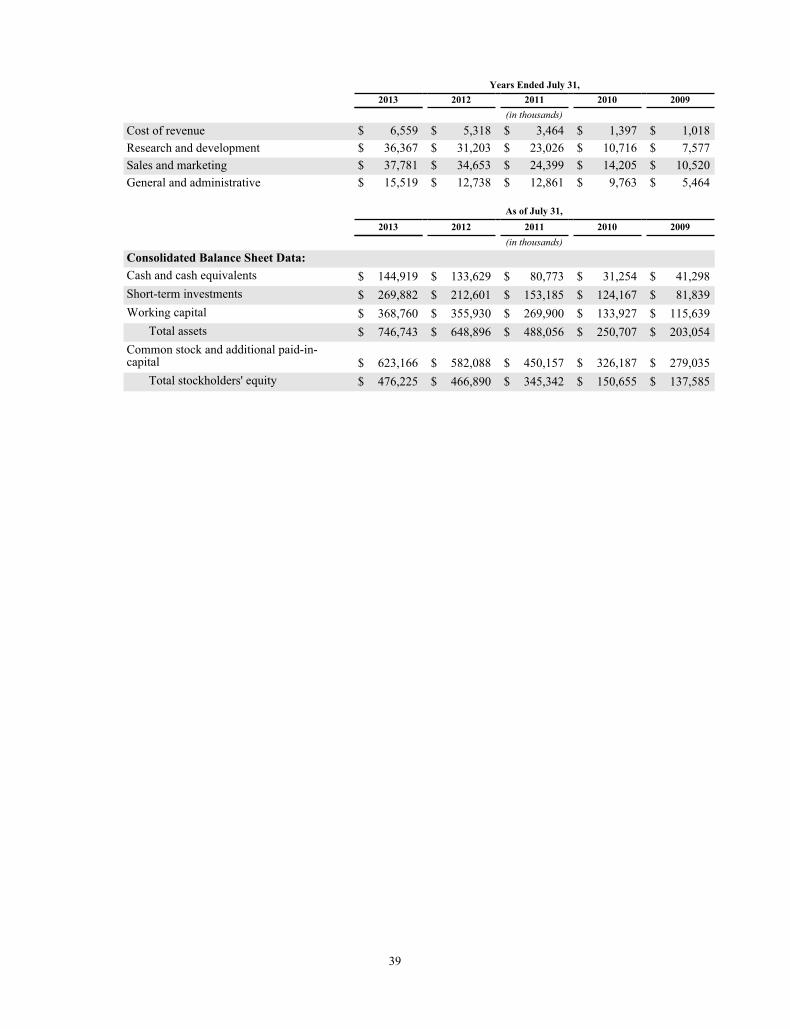
39
Years Ended July 31, 2013 2012 2011 2010 2009 (in thousands)
Cost of revenue $ 6,559 $ 5,318 $ 3,464 $ 1,397 $ 1,018Research and development $ 36,367 $ 31,203 $ 23,026 $ 10,716 $ 7,577Sales and marketing $ 37,781 $ 34,653 $ 24,399 $ 14,205 $ 10,520General and administrative $ 15,519 $ 12,738 $ 12,861 $ 9,763 $ 5,464
As of July 31, 2013 2012 2011 2010 2009 (in thousands)Consolidated Balance Sheet Data:Cash and cash equivalents $ 144,919 $ 133,629 $ 80,773 $ 31,254 $ 41,298Short-term investments $ 269,882 $ 212,601 $ 153,185 $ 124,167 $ 81,839Working capital $ 368,760 $ 355,930 $ 269,900 $ 133,927 $ 115,639
Total assets $ 746,743 $ 648,896 $ 488,056 $ 250,707 $ 203,054Common stock and additional paid-in-capital $ 623,166 $ 582,088 $ 450,157 $ 326,187 $ 279,035
Total stockholders' equity $ 476,225 $ 466,890 $ 345,342 $ 150,655 $ 137,585

40
ITEM 7. MANAGEMENT’S DISCUSSION AND ANALYSIS OF FINANCIAL CONDITION AND RESULTS OF OPERATIONS
The following discussion and analysis of our financial condition and results of operations should be read together with our Consolidated Financial Statements and related notes included elsewhere in this report.
Overview
Aruba Networks, Inc. is a leading global provider of enterprise mobility solutions. We develop, market and sell products and services designed to solve our customers' secure mobility requirements though our MOVE architecture, which unifies the network infrastructure, access management and mobility applications into one integrated system that offers strong security and a simplified approach to BYOD initiatives.
We believe the market for mobility solutions in the enterprise is changing and that the explosion of mobile devices is forcing IT departments to radically revise the way they approach provisioning and supporting these devices in the workplace. Our goal is to provide simplified, dependable solutions that permit IT departments to quickly, securely and cost-effectively meet their mobility and BYOD needs. We address these needs with our flexible MOVE architecture, a fundamentally new network architecture, designed for an increasingly mobile universe of end-users. Our MOVE architecture is comprised of three major components. The first component consists of our mobility-centric network infrastructure, including our mobility controllers and software modules, wireless access points, mobility access switches, remote access points, VPN software and AirWave management. The second component is our next-generation access management solution, including ClearPass software for network access control as well as device and application management. The third component consists of our mobility applications, including our WorkSpace mobile application, our APIs and our Meridian application for visitor engagement through indoor way-finding and targeted location-based messaging.
Aruba conducts business in three geographic regions: Americas, EMEA, and APJ. Our products and services have been sold to more than 30,000 customers worldwide, including some of the largest and most complex global organizations. Our customer base spans major industries and verticals, including general enterprise, high tech enterprise, industrial enterprise, higher education, K-12 education, health care, retail, federal/state/local government, financial services and hospitality. We typically sell to and support these customers through a two-tier distribution model in most areas of the world, including the United States. Our VADs and OEMs sell our portfolio of products, including a variety of our support services, to a diverse number of VARs, system integrators and service providers. Also, certain of our OEMs sell directly to end customers.
Major Trends Affecting Our Financial Results
Worldwide Economic Conditions
Our business depends on the overall demand for IT initiatives and on the economic health and general willingness of our current and prospective customers to make capital commitments. If the conditions in the global economic environment remain uncertain or continue to be volatile, or if these conditions deteriorate, our business, operating results, and financial condition may be adversely affected in a material way. Economic weakness, customer financial difficulties and constrained spending on IT initiatives have resulted, and may in the future result, in challenging and delayed sales cycles and could negatively impact our ability to forecast future periods. Sequestration or other significant cuts in U.S. government spending could adversely affect our future results. We cannot be assured of the level of IT spending, the deterioration of which could have a material adverse effect on our results of operations.
Revenue
Our ability to increase our revenue will depend significantly on continued growth in the market for enterprise mobility and remote networking solutions, continued acceptance of our products in the marketplace, our ability to continue to attract new customers, our ability to compete, the willingness of customers to displace wired networks with wireless LANs, our ability to retain existing distribution partners, and our ability to continue to sell into our installed base of existing customers. We believe that our MOVE architecture, including our ClearPass and Aruba Instant offerings, will enable broader networking initiatives by both our current and potential customers. Our growth in support revenue is dependent upon increasing the number of products under support contracts, which is dependent on both growing our installed base of customers and renewing existing support contracts. Our future profitability and rate of growth, if any, will also be directly affected by the timing and size of orders, product and channel mix, average selling prices, costs of our products, our ability to effectively manage our two-tier distribution model, general economic conditions, and the extent to which we invest in our sales and marketing, research and development, and general and administrative resources.
AnnualR
eport

41
The revenue growth that we have experienced has been driven primarily by an expansion of our customer base coupled with increased purchases from existing customers. We believe the growth we have experienced is the result of business enterprises and other organizations needing to provide secure mobility to their users in a manner that we believe is more cost effective than the traditional approach of using port-centric networks. Our revenue grew 16.1% in fiscal 2013 as compared to in fiscal 2012. This performance was driven by solid execution, improvements across most of our geographical theatres and increased demand in our core verticals globally. Looking forward, we believe that we have strong growth drivers with our 802.11ac products, ClearPass, public facing enterprise solutions and Aruba Instant.
Our ability to meet our product revenue expectations is dependent upon (1) new orders received, shipped, and recognized in a given quarter, (2) the amount of orders booked but not shipped in prior quarters that are shipped in the current quarter, and (3) the amount of deferred revenue entering a given quarter that is recognized as revenue in the quarter.
Our product deferred revenue is comprised of:• product orders that have shipped but where the terms of the agreement, typically with our large customers, contain
acceptance terms and conditions or other terms that require that the revenue be deferred until all revenue recognition criteria are met; and
• product orders shipped to our VADs and OEMs for which we have not yet received persuasive evidence of sell-through from the VADs or OEMs.
We typically ship products within 10 days after the receipt of an order.
Costs and Expenses
Our operating expenses consist of research and development, sales and marketing, and general and administrative expenses. The largest component of our operating expenses in each of these categories is personnel costs. Personnel costs consist of salaries, benefits and incentive compensation for our employees, including commissions for sales personnel and stock-based compensation for employees. As of July 31, 2013, we had 1,473 employees worldwide compared to 1,223 employees at July 31, 2012. The increase in employees is the most significant driver behind the increase in costs and operating expenses in the year ended July 31, 2013. We expect to continue investing in our infrastructure and operations, including continuation of hiring of employees throughout the Company.
Significant Events
Our consolidated financial statements during the year ended July 31, 2013 were affected by certain significant events that should be considered in comparing the periods presented.
Business Combinations
On May 13, 2013, we acquired Meridian Apps, Inc. (“Meridian”), a privately-held mobile-software company providing software for visitor engagement through indoor way-finding and targeted location-based messaging. The purchase price was $16.8 million, all of which was paid in cash. In addition, we are obligated to pay additional cash consideration of up to $10.2 million to certain former Meridian employees who became our employees, which will be made over a period of approximately three years from the closing date, subject to certain continued employment restrictions. For the year ended July 31, 2013, we recorded compensation costs of $0.8 million in general and administrative expenses associated with this additional cash compensation. Acquisition related costs, included in general and administrative expenses, were not material. As a result of the acquisition, we expect to offer new indoor location-based services by combining our unique, network-based contextual information about users, devices and applications with Meridian's Wi-Fi based visitor engagement solution for smart phones and tablets.
In connection with this acquisition, we retained the services of a third-party firm to complete a valuation of the assets acquired in order to allocate the purchase price consideration. The total purchase price consideration was allocated to the net tangible and identified intangible assets based upon the fair values as of May 13, 2013, in accordance with our review and oversight of the third-party valuation. The excess purchase price over the value of the net tangible and identifiable intangible assets was recorded as goodwill.
The purchase price consideration of the acquisition was allocated as follows (in thousands, except years):

42
Purchase price consideration:Cash $ 16,777
Tangible assets acquired and liabilities assumed (1,218)Estimated
Useful Lives
Identifiable intangible assets:Existing technology 5,000 3 yearsPatent 2,000 11 yearsCustomer contracts and related relationships 300 4 yearsTrade name and trademarks 400 4 years
Goodwill 10,295
Total purchase price consideration $ 16,777
We expensed $0.1 million of acquisition-related costs incurred as general and administrative expenses in the Consolidated Statements of Operations and Comprehensive Income (Loss) in fiscal 2013.
Stock Repurchase
On June 13, 2012, we announced a stock repurchase program for up to $100.0 million of our common stock, which was increased by an additional $100.0 million on July 15, 2013. We are authorized to make repurchases in the market until our Board of Directors' terminates the program or until expenditures reach the authorized amount , whichever occurs first. Any repurchases under the program will be funded from available working capital. The number of shares repurchased and the timing of purchases are based on the price of our common stock, general business and market conditions and other investment considerations. Shares are retired upon repurchase and it is our policy to charge any excess of cost over par value entirely to additional paid-in capital. During the fiscal years ended July 31, 2013 and 2012, we repurchased a total of 5,311,332 shares and 1,408,504 shares, respectively for a total of purchase price of $86.2 million and $19.9 million, respectively. At July 31, 2013, $93.9 million remains authorized for repurchase under our stock repurchase program.
Legal Settlement
During the fourth quarter of our fiscal 2013, we reached a settlement resolving the lawsuit filed against us by Nomadix, Inc. As part of the settlement, we agreed to pay Nomadix an amount in consideration for, among other things, a perpetual non-exclusive license to the patent asserted by Nomadix. The settlement amount was recorded in the fourth quarter of fiscal 2013. The terms of the settlement are confidential. Although the settlement did have a material impact to our Consolidated Statements of Operations and Comprehensive Income (Loss), it did not have a material adverse effect on our consolidated financial position or cash flows for fiscal 2013.
Revenue, Cost of Revenue and Operating Expenses
Revenue
We derive our revenue from sales of our ArubaOS operating system, controllers, wired and wireless access points, switches, application software modules, access-management solution, multi-vendor management solution software, and professional services and support.
We sell our products and services directly through our sales force and indirectly through partners including VADs, VARs, service providers and OEMs. We expect revenue from indirect channels to continue to constitute a significant majority of our future revenue.
We sell our products to channel partners and end customers located in the United States, Europe, Middle East, Africa, Asia Pacific, Japan and other parts of the world. We continue to expand into international locations and introduce our products in new markets, and we expect international revenue to increase in absolute dollars and increase as a percentage of total revenue in fiscal 2014 compared to fiscal 2013. For more information about our international revenue, see Note 12, Segment Information and Significant Customers, of the Notes to Consolidated Financial Statements.
Professional services revenue consists of consulting and training services. Consulting services primarily consist of design
AnnualR
eport

43
and installation support services. Training services are typically instructor-led courses on the use of our products. Support services typically consist of software updates, on a when-and-if available basis, and telephone and Internet access to technical support personnel and hardware support. We provide customers with rights to unspecified software product upgrades and to maintenance releases and patches released during the term of the support period.
Cost of Revenue
Cost of product revenue consists primarily of manufacturing costs for our products, shipping and logistics costs, charges for inventory obsolescence, amortization of existing technology and warranty obligations. We utilize third parties to manufacture our products and perform shipping logistics. We have outsourced the substantial majority of our manufacturing, repair and supply chain operations. Accordingly, the substantial majority of our cost of product revenue consists of payments to our contract manufacturers. Our contract manufacturers produce our products in Asia using quality assurance programs and standards that we jointly established. Manufacturing, engineering and documentation controls are conducted at our facilities in Sunnyvale, California, Bangalore, India and Beijing, China. Cost of product revenue also includes amortization expense from our purchased intangible assets.
Cost of professional services and support revenue is primarily comprised of personnel costs, including stock-based compensation, for providing technical support. In addition, we engage third-party support vendors to complement our internal support resources, the costs of which are included within costs of professional services and support revenue.
Gross Margin
Our gross margin has been, and will continue to be, affected by a variety of factors, including:• changes in the mix of products sold or manner in which products are sold in our channel;• the percentage of revenue from international regions;• increased price competition and discounting pressures;• increases in material, labor or other manufacturing-related costs;• excess product component or obsolescence charges from our contract manufacturers;• write-downs for obsolete or excess inventory;• increased costs due to changes in component pricing or charges incurred due to component holding periods if our
forecasts do not accurately anticipate product demand;• timing of revenue recognition and revenue deferrals;• warranty-related issues;• freight charges;• our introduction of new products or new product platforms or entry into new markets with different pricing and cost
structures;• amortization expense from our intangible assets which is mainly existing technology; and• amortization of capitalized software development costs.
Due to higher net effective discounts for products sold through our indirect channel, our overall gross margins for indirect channel sales are typically lower than those associated with direct sales. We expect product revenue from our indirect channel to continue to constitute a significant majority of our total revenue, which we expect will continue to negatively impact our gross margin. Further, we expect that within our indirect channel, sales through our VADs and OEMs will continue to be significant, which will negatively impact our gross margins as VADs and OEMs generally experience a larger net effective discount than our other channel partners.
Research and Development Expenses
Research and development expenses primarily consist of personnel costs and facilities costs. We expense research and development expenses as incurred. We are devoting substantial resources to the continued development of additional functionality for existing products and the development of new products. We intend to continue to invest significantly in our research and development efforts because we believe it is essential to maintaining our competitive position. For fiscal 2014, we expect research and development expenses to increase on an absolute dollar basis and as a percentage of revenue compared to fiscal 2013.
Sales and Marketing Expenses
Sales and marketing expenses represent the largest component of our operating expenses and primarily consist of personnel costs, sales commissions, marketing programs and facilities costs. A portion of the amortization expense related to our intangible assets is also included in sales and marketing expenses. Marketing programs are intended to generate revenue from new and existing customers and are expensed as incurred. We plan to continue to invest strategically in sales and marketing with the intent to add new customers and increase penetration within our existing customer base, expand our domestic and international sales and marketing activities, build brand awareness and sponsor additional marketing events. We

44
expect future sales and marketing expenses to continue to be our most significant operating expense. Generally, sales personnel are not immediately productive, and thus, the increase in sales and marketing expenses that we experience as we hire additional sales personnel is not expected to immediately result in increased revenue. As a result, these expenses will reduce our operating margin until the new sales personnel become productive and generate revenue. Accordingly, the timing of sales personnel hiring and the rate at which they become productive will affect our future performance. For fiscal 2014, we expect sales and marketing expenses to increase on an absolute dollar basis as we continue to invest strategically in this area and will increase as percentage of revenue compared to fiscal 2013.
General and Administrative Expenses
General and administrative expenses primarily consist of personnel and facilities costs related to our executive, finance, human resource, information technology and legal organizations, as well as insurance, investor relations, and IT infrastructure costs related to our enterprise resource planning (“ERP”) system. Further, our general and administrative expenses include professional services consisting of outside legal, audit, Sarbanes-Oxley and IT consulting costs. We have incurred in the past, and may continue to incur, significant legal costs defending ourselves against claims made by third parties. These expenses are expected to continue as part of our ongoing operations and, depending on the timing and outcome of lawsuits and the legal process, could have a significant impact on our financial statements. For fiscal 2014, we expect general and administrative expenses to increase in absolute dollars and decrease as a percentage of revenue compared to fiscal 2013. However, third-party professional services are subject to material fluctuations given the needs of the business, which may cause our expected expenditures in absolute dollars and as a percentage of revenue to differ from our forecasted expectations.
Other Income, net
Other income, net includes interest income on cash balances, accretion of discount or amortization of premium on short-term investments, losses or gains from foreign exchange rate changes, and in connection with our acquisition of Azalea Networks ("Azalea") from September 2, 2010 to December 31, 2012, changes in the fair value or gains from the release of our contingent rights liability. See Note 2, Business Combinations of the Notes to Consolidated Financial Statements for more information on the Azalea acquisition and the contingent rights liability.
Critical Accounting Policies
Our Consolidated Financial Statements are prepared in accordance with U.S. generally accepted accounting principles (“GAAP”). These accounting principles require us to make estimates and judgments that affect the reported amounts of assets and liabilities as of the date of the Consolidated Financial Statements, as well as the reported amounts of revenue and expenses during the periods presented. We believe that the estimates and judgments upon which we rely are reasonable based upon information available to us at the time that these estimates and judgments are made. To the extent there are material differences between these estimates and actual results, our Consolidated Financial Statements will be affected. The accounting policies that reflect our more significant estimates and judgments and which we believe are the most critical to aid in fully understanding and evaluating our reported financial results include revenue recognition, share-based compensation, inventory valuation, allowance for doubtful accounts, impairment of goodwill and intangible assets, and accounting for income taxes.
Revenue Recognition
Total revenue is derived primarily from the sale of products and services, including professional services and support. The following revenue recognition policies define the manner in which we account for our sales transactions.
We recognize revenue when all of the following have occurred: (1) we have entered into a legally binding arrangement with a customer; (2) delivery has occurred or the title and risk of loss has passed; (3) customer payment is deemed fixed or determinable and free of contingencies and significant uncertainties; and (4) collection is reasonably assured.
Our fees are typically considered to be fixed or determinable at the inception of an arrangement, generally based on specific products and quantities to be delivered. Substantially all of our contracts do not include rights of return or acceptance provisions. To the extent that agreements contain such terms, we recognize revenue once the customer has accepted, or once the acceptance provisions or right of return lapses. Payment terms to customers generally range from net 30 to 90 days. In the event payment terms are provided that differ from our standard business practices, the fees are deemed to not be fixed or determinable and revenue is recognized when the payments are received, provided the remaining criteria for revenue recognition have been met.
We assess the ability to collect from our customers based on a number of factors, including credit worthiness of the customer and past transaction history of the customer. If the customer is not deemed credit worthy, we defer revenue from the arrangement until payment is received and all other revenue recognition criteria have been met. We record estimated sales returns as a reduction to revenue upon shipment based on our contractual obligations and historical returns experience. In cases
AnnualR
eport

45
where we are aware of circumstances that will likely result in a specific customer's request to return purchased equipment, we record a specific sales returns reserve.
Our revenue recognition policies provide that, when a sales arrangement contains multiple elements, such as hardware and software products, licenses and/or services, we allocate revenue to each element based on a selling price hierarchy. The selling price for a deliverable is based on its vendor specific objective evidence (“VSOE”) of selling price if available, third party evidence (“TPE”) of selling price, if VSOE is not available, or best estimated selling price (“BESP”), if neither VSOE nor TPE is available. In multiple element arrangements where non-essential software deliverables are included, revenue for these multiple-element arrangements is allocated to the software deliverable and the non-software deliverables based on the relative selling prices of all of the deliverables in the arrangement using the hierarchy in the applicable accounting guidance. We limit the amount of revenue recognition for delivered elements to the amount that is not contingent on the future delivery of products or services, future performance obligations or subject to customer-specified return or refund privileges.
We establish VSOE of selling price using the price charged for a deliverable based upon the normal pricing and discounting practices when sold separately. VSOE for support services is measured by the stand-alone renewal rate offered to the customer. In determining VSOE, we require that a substantial majority of the selling prices for an element falls within a reasonably narrow pricing range, generally evidenced by a substantial majority of such historical stand-alone transactions falling within a reasonably narrow range of the median rates. In addition, we consider major service groups, geographies, customer classifications, and other variables in determining VSOE.
TPE of selling price is established by evaluating largely similar and interchangeable competitor products or services in standalone sales to similarly situated customers. We are typically not able to determine TPE for our products or services. Generally, our go-to-market strategy differs from that of our peers and our offerings contain a significant level of differentiation such that the comparable pricing of products with similar functionality cannot be obtained. Furthermore, we are unable to reliably determine selling prices of competitor products and services on a stand-alone basis.
When we are unable to establish the selling price of our non-software elements using VSOE or TPE, we use BESP in the allocation of arrangement consideration. The objective of BESP is to determine the price at which we would transact a sale if the product or service were sold on a stand-alone basis. We determine BESP for a product or service by considering multiple factors including, but not limited to, cost of products, gross margin objectives, pricing practices, geographies, customer classes and distribution channels.
We regularly review estimated selling price of the product offerings and maintain internal controls over the establishment and updates of these estimates. We currently do not expect a material impact in the near term from changes in estimated selling prices, including VSOE of selling price.
Products
Product revenue consists of revenue from sales of our hardware appliances and perpetual software licenses. The majority of our products are hardware appliances containing software components that function together to provide the essential functionality of the product. Therefore, our hardware appliances are considered non-software elements and are not subject to the industry-specific software revenue recognition guidance. For these appliances, delivery occurs upon transfer of title and risk of loss, which is generally upon shipment. It is our practice to ensure an end-user has been identified by the channel partner prior to shipment to a channel partner. For end-users and channel partners, we generally have no significant obligations for future performance such as rights of return or pricing credits.
For sales to direct end-users and certain channel partners, including value-added resellers (“VARs”), and original equipment manufacturers (“OEMs”), we recognize product revenue upon delivery, assuming all other revenue recognition criteria are met. We also sell through value-added distributors (“VADs”). A significant portion of our sales are made through VADs under agreements allowing for stocking of our products in their inventory, pricing credits and limited rights of return for stock rotation. Product revenue on sales made through these VADs is initially deferred and revenue is recognized upon sell-through as reported by the VADs to us. Our product revenue also includes revenue from the sale of stand-alone software products. Stand-alone software products may operate on our hardware appliance but are not considered essential to the functionality of the hardware. Sales of stand-alone software generally include a perpetual license to our software. For sales of stand-alone software, we recognize revenue based on software revenue recognition guidance. Under the software revenue recognition guidance, we use the residual method to recognize revenue when a product agreement includes one or more elements to be delivered at a future date and VSOE of the fair value of all undelivered elements exists. In the majority of our contracts, the only element that remains undelivered at the time of delivery of the product is support services. Under the residual method, the fair value of the undelivered elements is deferred and the remaining portion of the contract fee is recognized as product revenue. If evidence of the fair value of one or more undelivered elements does not exist, all revenue is generally deferred and recognized when delivery of those elements occurs or when fair value can be established. When only the

46
undelivered element for which we do not have VSOE of selling price is support, revenue for the entire arrangement is bundled and recognized ratably over the support period.
Services
Service revenue consists of revenue from support agreements, professional services, and training. Support services include repair and replacement of defective hardware appliances, software updates and access to technical support personnel. Software updates provide customers with rights to unspecified software product upgrades and to maintenance releases and patches released during the term of the support period. Revenue for support services is recognized on a straight-line basis over the service contract term, which is typically one to five years. Revenue for professional services is recognized upon delivery or completion of performance. Professional service arrangements are typically short-term in nature and are largely completed within 90 days from the start of service. Revenue for training services is recognized upon delivery of the training. Costs associated with these service offerings are expensed as incurred.
Post-contractual services (“PCS”) that we provide to our channel partners differ from PCS that we provide to our end customers in that we are only obligated to provide support services to the channel partner directly, while the channel partner is obligated to provide support services directly to the end customer. The channel partner is obligated to provide to the end customer first level troubleshooting assistance as well as second level support for high-level technical and product diagnosis which might include returned merchandise fulfillment. Our obligations are only to provide software upgrades and, in the unusual scenario in which the channel partner is unable to provide the technical support that the end customer requires, a third level technical diagnosis and support.
Services revenue also includes certain revenue arrangements prior to the second quarter of fiscal 2006 and those acquired through business combinations where we were not able to establish VSOE on prior services and support offerings are recognized ratably over the support period. As discussed in Note 1, The Company and its Significant Accounting Policies, of the Notes to Consolidated Financial Statements, ratable product and related professional services and support revenue and the related cost of revenue in fiscal years 2012 and 2011 have been reclassified to professional services and support revenue and related cost of revenue.
Shipping and Handling
Shipping charges billed to customers are included in product revenue and the related shipping costs are included in cost of product revenue.
Stock-Based Compensation
We measure and recognize compensation expense for all stock-based payment awards made to employees and non-employees under the fair value method. Our stock-based payment awards include stock options, restricted stock units and awards, employee stock purchase plan awards and performance-based awards. We calculate the fair value of restricted stock based on the fair market value on the date of grant. We calculate the fair value of stock options and employee stock purchase plan shares on the date of grant using the Black-Scholes option-pricing model. This methodology requires the use of subjective assumptions, including expected stock price volatility over the term of the awards, actual and projected employee stock option exercise behavior, risk-free interest rates and expected dividends. This fair value is then amortized on a straight-line basis over the requisite service periods of the awards, which is generally the vesting period. We determine the amount of stock-based compensation expense based on awards that we ultimately expect to vest, reduced for estimated forfeitures. In addition, compensation expense includes the effects of awards modified, repurchased or cancelled.
Inventory Valuation
Inventory consists of hardware and related component parts and is stated at the lower of cost or market. Cost is computed using the standard cost, which approximates actual cost, on a first-in, first-out basis. We record inventory write-downs for potentially excess inventory based on forecasted demand, economic trends, technological obsolescence of our products and transition of inventory related to new product releases. If future demand or market conditions are less favorable than our projections, additional inventory write-downs could be required and would be reflected in cost of product revenue in the period the revision is made. At the point of the loss recognition, a new, lower-cost basis for that inventory is established, and subsequent changes in facts and circumstances do not result in the restoration or increase in that newly established cost basis. Inventory write-downs amounted to $5.6 million, $4.1 million, and $2.6 million for fiscal years 2013, 2012, and 2011, respectively with amounts increasing as a result of growth in our business, as well as new product releases and increased diversity of our product offerings.
AnnualR
eport

47
Allowance for Doubtful Accounts
We record an allowance for doubtful accounts based on historical experience and a detailed assessment of the collectability of our accounts receivable. In estimating the allowance for doubtful accounts, our management considers, among other factors, (1) the aging of the accounts receivable, including trends within and ratios involving the age of the accounts receivable, (2) our historical write-offs, (3) the credit-worthiness of each customer, (4) the economic conditions of the customer’s industry, and (5) general economic conditions, especially given the recent financial crisis in today’s economic environment. In cases where we are aware of circumstances that may impair a specific customer’s ability to meet their financial obligations to us, we record a specific allowance against amounts due from the customer, and thereby reduce the net recognized receivable to the amount we reasonably believe will be collected. The allowance for doubtful accounts was $0.8 million and $0.3 million at July 31, 2013 and 2012.
Impairment of Goodwill and Intangible Assets
Goodwill represents the excess cost of a business acquisition over the fair value of the net assets acquired. We perform impairment testing on goodwill at least annually, as of June 30th, and more frequently if indicators of impairment exist at the reporting unit level. We perform the impairment testing by first assessing qualitative factors to determine whether the existence of events or circumstances leads to a determination that it is more likely than not that the fair value of its reporting unit is less than its carrying amount. If, after assessing the totality of events or circumstances, we determine it is more likely than not that the fair value of a reporting unit is less than its carrying amount, we perform a two-step impairment test. The first step requires the identification of the reporting units and comparison of the fair value of a reporting unit with its carrying amount, including goodwill. If the fair value of the reporting unit is less than its carrying value, an indication of goodwill impairment exists for the reporting unit and the second step of the impairment test is performed to compute the amount of the impairment. Under the second step, an impairment loss is recognized for any excess of the carrying amount of the reporting unit's goodwill over the implied fair value of that goodwill. We have determined that we have only one reporting unit. There have been no impairments recorded in any of the periods presented.
Purchased intangible assets with finite lives are amortized using the straight-line method over the estimated economic lives of the assets, which range from one to 11 years. Amortization expense is recorded in the Consolidated Statements of Operations and Comprehensive Income (Loss) in cost of revenue and sales and marketing expenses.
Long-lived assets, including intangible assets, are reviewed for impairment whenever events or changes in circumstances indicate that the carrying amount of such assets may not be recoverable. Some factors we consider important which could trigger an impairment review include the following:
• significant under performance relative to estimated results;• significant changes in the manner of our use of the acquired assets or the strategy for our overall business; and• significant negative industry or economic trends.
Determination of recoverability of purchased intangible assets is based on an estimate of undiscounted future cash flows resulting from the use of the asset and its eventual disposition. Measurement of an impairment loss is based on the fair value of the asset. We did not record any impairment charges in any of the periods presented.
Screening for and assessing whether impairment indicators exist or if events or changes in circumstances have occurred, including market conditions, operating fundamentals, competition and general economic conditions, requires significant judgment. Additionally, changes in the technology industry occur frequently and quickly. Therefore, there can be no assurance that a charge to operating expenses will not occur as a result of future goodwill and intangible impairment tests.
Income Taxes
We are subject to income taxes in the United States and numerous foreign jurisdictions. In the ordinary course of a global business, there are many transactions and calculations where the ultimate tax outcome is uncertain. Some of these uncertainties arise as a consequence of cost reimbursement arrangements among related entities and the segregation of foreign and domestic earnings and expenses to avoid double taxation. Significant judgment is required in determining our worldwide income tax provision. Although we believe that our estimates are reasonable, the final tax outcome of these matters could be different from that which is reflected in our historical income tax provisions and accruals. Such differences could have a material effect on our income tax provision and net income in the period in which such determination is made.
Our effective tax rate includes the impact of certain undistributed foreign earnings for which zero U.S. taxes have been provided because such earnings are planned to be indefinitely reinvested outside the U.S. We plan any remittances of foreign earnings to the U.S. based on projected cash flow, working capital and investment needs of our foreign and domestic operations. Based on these assumptions, we estimate the amount that will be distributed to the United States and provide U.S.

48
federal taxes on these amounts. As of July 31, 2013, we estimate that all foreign earnings are permanently reinvested outside the U.S. and therefore have excluded a U.S. tax provision on these earnings. Material changes in our estimates as to how much of our foreign earnings will be distributed to the United States or tax legislation that limits or restricts the amount of undistributed foreign earnings that we consider indefinitely reinvested outside the U.S. could materially impact our income tax provision and effective tax rate.
We estimate our current tax liability and assess temporary differences that result from differing treatments of certain items for tax and accounting purposes. These differences result in deferred tax assets and liabilities, which we show on our balance sheet. We must then assess the likelihood that our deferred tax assets will be realized. We record a valuation allowance to reduce our deferred tax assets to the amount that is more likely than not to be realized. In order for us to realize our deferred tax assets, we must be able to generate sufficient taxable income in those jurisdictions where the deferred tax assets are located. In determining the need for a valuation allowance, we consider future growth, forecasted earnings, future taxable income, the mix of earnings in the jurisdictions in which we operate, historical earnings, taxable income in prior years, if carryback is permitted under the law, carry-forward periods, and prudent and feasible tax planning strategies. In the event we were to determine that not all or part of our net deferred tax assets are not more likely than not to be realized in the future, an adjustment to the deferred tax assets valuation allowance would be charged to earnings in the period in which we make such a determination, or goodwill would be adjusted if the valuation allowance related to deferred tax assets acquired in a business combination and the adjustment is within the measurement period. If we later determine that it is more likely than not that the deferred tax assets would be realized, we would reverse the previously provided valuation allowance as an adjustment to earnings at such time.
Based on an evaluation of the above factors, we recorded a valuation allowance to reflect uncertainties about whether we will be able to utilize certain California research credit carryforwards. While we have considered future taxable income in assessing the need for a valuation allowance, we could in the future be required to increase the valuation allowance to take into account additional deferred tax assets that we may be unable to realize. An increase in the valuation allowance would have an adverse impact, which could be material, on our income tax provision and net income in the period in which we record the increase.
The amount of income tax we pay is subject to ongoing audits by federal, state and foreign tax authorities, which often result in proposed assessments. Our estimate of the potential outcome for any uncertain tax issue is highly judgmental. We recognize and measure benefits for uncertain tax positions using a two-step approach. The first step is to evaluate the tax position taken or expected to be taken in a tax return by determining if the weight of available evidence indicates that it is more likely than not that the tax position will be sustained upon audit, including resolution of any related appeals or litigation processes. For tax positions that are more likely than not of being sustained upon audit, the second step is to measure the tax benefit as the largest amount that is more than 50% likely of being realized upon settlement. Significant judgment is required to evaluate uncertain tax positions. We evaluate our uncertain tax positions on a quarterly basis. Our evaluations are based upon a number of factors, including changes in facts or circumstances, changes in tax law, correspondence with tax authorities during the course of audits and effective settlement of audit issues. Changes in the recognition or measurement of uncertain tax positions could result in material increases or decreases in our income tax expense in the period in which we make the change, which could have a material impact on our effective tax rate and operating results.
Recent Accounting Pronouncements
Refer to Recent Accounting Pronouncements, under Note 1, The Company and its Significant Accounting Policies, of the Notes to Consolidated Financial Statements for recent accounting pronouncements that could have an effect on us.
AnnualR
eport

49
Results of Operations
The following table presents our historical operating results as a percentage of total revenue for the periods indicated:
Years ended July 31, 2013 2012 2011
Revenue:Product 82.7 % 84.1 % 84.5 %Professional services and support 17.3 % 15.9 % 15.5 %
Total revenue 100.0 % 100.0 % 100.0 %Cost of revenue:
Product 24.8 % 25.2 % 27.2 %Professional services and support 4.6 % 4.1 % 3.7 %
Total cost of revenue 29.4 % 29.3 % 30.9 %Gross margin 70.6 % 70.7 % 69.1 %
Operating expenses:Research and development 23.3 % 21.2 % 21.4 %Sales and marketing 38.5 % 38.4 % 38.9 %General and administrative 8.5 % 9.0 % 10.0 %Legal settlement 2.3 % — % — %
Total operating expenses 72.6 % 68.6 % 70.3 %Operating margin (2.0)% 2.1 % (1.2)%
Other income, netInterest income 0.2 % 0.2 % 0.2 %Other income, net 0.1 % 0.3 % 0.7 %
Income (loss) before provision for (benefit from) income taxes (1.7)% 2.6 % (0.3)%Provision for (benefit from) income taxes 3.6 % 4.3 % (18.1)%Net income (loss) (5.3)% (1.7)% 17.8 %

50
Revenue
Years ended July 31, 2013 2012 2011 (in thousands)
Total revenue $ 600,044 $ 516,769 $ 396,514Type of revenue:
Product $ 496,343 $ 434,733 $ 334,860Professional services and support 103,701 82,036 61,654
Total revenue $ 600,044 $ 516,769 $ 396,514% revenue by type:
Product 82.7% 84.1% 84.5%Professional services and support 17.3% 15.9% 15.5%
Revenue by geography:United States $ 379,447 $ 323,331 $ 250,995Europe, the Middle East and Africa 106,427 89,540 62,595Asia Pacific and Japan 94,361 89,677 70,171Rest of World 19,809 14,221 12,753
Total revenue $ 600,044 $ 516,769 $ 396,514% revenue by geography:
United States 63.2% 62.6% 63.3%Europe, the Middle East and Africa 17.7% 17.3% 15.8%Asia Pacific and Japan 15.7% 17.5% 17.8%Rest of World 3.3% 2.8% 3.2%
Total revenue by sales channel:Indirect $ 560,313 $ 477,974 $ 368,945Direct 39,731 38,795 27,569
Total revenue $ 600,044 $ 516,769 $ 396,514% revenue by sales channel:
Indirect 93.4% 92.5% 93.0%Direct 6.6% 7.5% 7.0%
Fiscal 2013 revenue compared to fiscal 2012 revenue
For our fiscal year ended July 31, 2013, total revenue increased $83.3 million, or 16.1%, over fiscal 2012, primarily due to an increase in product revenue.
Product revenue increased $61.6 million, or 14.2% during fiscal 2013 compared to fiscal 2012. Our increased product revenue was primarily driven by higher sales of Access Point and Controller hardware, as well as related software solutions. We also saw higher switching revenue in fiscal 2013 compared to 2012.
Professional services and support revenue increased $21.7 million, or 26.4%, during fiscal 2013 compared to fiscal 2012. This increase is primarily a result of increased initial sales and renewals of post-contract support agreements resulting from higher product sales and a larger customer install base, as well as higher professional service revenue. These increases were partially offset by lower royalty revenue.
Revenue from our indirect sales channel increased $82.3 million during fiscal 2013 compared to fiscal 2012 and increased slightly as a percentage of revenue from 92.5% to 93.4%. Going forward, we expect to continue to derive a significant majority of our total revenue from indirect channels as we continue to focus on improving the efficiency of marketing and selling our products through these channels.
Revenue from shipments to locations outside the U.S. increased $27.2 million, or 14.0%, during fiscal 2013 compared to fiscal 2012 due to solid demand across all of our geographies. As a percentage of total revenue, U.S. revenue was slightly up during fiscal 2013 compared to 2012 from 62.6% to 63.2%.
AnnualR
eport

51
Ratable product and related professional services and support revenue and the related cost of revenue in fiscal 2012 and 2011 have been reclassified to professional services and support revenue and related cost of revenue, both of which are recorded in the revenue and cost of revenue sections of the Consolidated Statements of Operations, respectively. We believe the ratable product and related professional services and support revenue and related cost of revenue are not material to total revenue and cost of revenue, and the nature of these amounts are consistent with professional services and support revenue and related cost of revenue. The amounts for the prior periods have been reclassified to conform with the current year presentation.
Fiscal 2012 revenue compared to fiscal 2011 revenue
For our fiscal year ended July 31, 2012, total revenue increased $120.3 million, or 30.3%, over fiscal 2011, primarily due to an increase in product revenue.
Product revenue increased $99.9 million, or 29.8%, during fiscal 2012 compared to fiscal 2011. The rapid proliferation of Wi-Fi enabled mobile devices, the adoption of BYOD policies by various enterprises, the increase in demand for multimedia-rich mobility applications drove the increase in demand for our products. Our MOVE architecture continued to gain momentum as companies move toward a new architecture in which wireless becomes the primary access network, resulting in significant growth in the sales of our Access Point products, and an increase in both hardware and software product sales.
Professional services and support revenue increased $20.4 million or 33.1% during fiscal 2012 compared to fiscal 2011. This increase is primarily a result of increased initial sales and renewals of post-contract support agreements resulting from higher product sales and a larger customer install base.
Revenue from our indirect sales channel increased $109.0 million during fiscal 2012 compared to fiscal 2011 and decreased slightly as a percentage of revenue from 93.0% to 92.5%.
Revenue from shipments to locations outside the U.S. increased $47.9 million, or 32.9% during fiscal 2012 compared to fiscal 2011 due to strong demand across all of our geographies. As a percentage of total revenue, U.S. revenue was slightly down during fiscal 2012 compared to 2011 from 63.3% to 62.6%.
Cost of Revenue and Gross Margin
Years ended July 31, 2013 2012 2011 (in thousands)
Total revenue $ 600,044 $ 516,769 $ 396,514Cost of product revenue $ 149,113 $ 130,446 $ 107,820Cost of professional services and support revenue 27,366 20,992 14,883
Total cost of revenue 176,479 151,438 122,703Gross profit $ 423,565 $ 365,331 $ 273,811
Gross margin 70.6% 70.7% 69.1%
Fiscal 2013 cost of revenue and margin compared to fiscal 2012 cost of revenue and margin
For our fiscal year ended July 31, 2013, our total cost of revenue increased $25.0 million, or 16.5%, as compared to fiscal 2012. This increase was primarily due to the corresponding increase in our product revenue. The substantial majority of our cost of product revenue consisted of payments to Sercomm, Wistron NeWeb Corp. and Flextronics, our largest contract manufacturers. For fiscal 2013, payments to Sercomm, WNC and Flextronics constituted approximately 35%, 28% and 12%, respectively, of our cost of product revenue. Additionally, cost of revenue was impacted by an increase of $1.3 million in freight costs due to increased material flows and new product introductions and stock-based compensation which increased by $1.2 million during fiscal 2013 compared to fiscal 2012.
Our cost of professional services and support revenue increased $6.4 million, or 30.4%, during fiscal 2013 as compared to fiscal 2012. This increase was primarily due to the corresponding increase in our service revenue, as well as increased outside services as we expanded our customer support call centers and increased costs associated with our initiative to increase professional services delivery capabilities.

52
Our gross margin decreased 10 basis points to 70.6% for fiscal 2013 as compared to 70.7% for fiscal 2012, primarily due to changes in our product and geographical mix, as well as decreased gross margins on services revenue. As we expand internationally, we will likely incur additional costs to conform our products to comply with local laws or local product specifications. In addition, we plan to continue to hire additional personnel to support our growing international customer base, which would increase our cost of professional services and support.
Fiscal 2012 cost of revenue and margin compared to fiscal 2011 cost of revenue and margin
For our fiscal year ended July 31, 2012 total cost of revenue increased $28.7 million, or 23.4% as compared to fiscal 2011 primarily due to the corresponding increase in our product revenue. The substantial majority of our cost of product revenue consisted of payments to Sercomm and Flextronics. For fiscal 2012, payments to Sercomm constituted approximately 31% of our cost of product revenue and payments to Flextronics and Flextronics-related costs constituted approximately 23% of our cost of product revenue.
Our cost of professional services and support revenue increased $6.1 million, or 41.0%, during fiscal 2012 as compared to fiscal 2011. These increases were primarily due to an increase in headcount in our support and professional services organization to meet the growing demand for these services, including personnel who joined Aruba as a result of the acquisition of Avenda in November 2011.
Our gross margin increased 160 basis points during fiscal 2012 to 70.7% as compared to our gross margin of 69.1% in fiscal 2011. This increase was due to favorable product and geographical mix as well as our continued technology differentiation and competitive position.
Research and Development Expenses
Years ended July 31, 2013 2012 2011 (in thousands)
Research and development expenses $ 139,746 $ 109,448 $ 84,890Percent of total revenue 23.3% 21.2% 21.4%
For our fiscal year ended July 31, 2013, our research and development expenses increased, $30.3 million, or 27.7%, compared to fiscal 2012. As the result of the increase in headcount, personnel and related costs increased $18.5 million, including an increase in stock-based compensation of $5.2 million, as we refreshed our ArubaOS and upgraded our hardware platforms. Depreciation expenses increased $3.8 million as we invested in additional lab equipment to support our research and development efforts. Facilities and IT-related expenses related to our worldwide research and development efforts also increased $5.2 million as we supported the increase in personnel during fiscal 2013.
For our fiscal year ended July 31, 2012, our research and development expenses increased $24.6 million, or 28.9%, compared to fiscal 2011, primarily due to an increase of $11.4 million in personnel and related costs as we expanded our research and development team, including through our acquisitions. Stock-based compensation expense also increased by $8.1 million. Expenses for consulting and outside agencies increased $1.9 million primarily due to costs associated with our product development efforts. Facilities and IT-related expenses related to our worldwide research and development efforts, including depreciation expense, increased $2.8 million, of which $2.7 million is due to increased allocations which were previously classified in General and Administrative expenses.
Sales and Marketing Expenses
Years ended July 31, 2013 2012 2011 (in thousands)
Sales and marketing expenses $ 230,805 $ 198,373 $ 154,239Percent of total revenue 38.5% 38.4% 38.9%
For our fiscal year ended July 31, 2013, our sales and marketing expenses increased $32.4 million, or 16.3%, compared to fiscal 2012. As the result of the increase in headcount, personnel and related costs increased $25.3 million, including an increase in stock-based compensation of $3.1 million. Marketing expenses increased $2.1 million due to field marketing efforts and product launches. Trade shows, travel and entertainment expenses increased $2.1 million primarily due to increased
AnnualR
eport

53
participation in trade shows to introduce and promote our new products. Facilities and IT-related expenses related to our sales and marketing efforts also increased $4.4 million, due to increased spending to support business growth.
For our fiscal year ended July 31, 2012, our sales and marketing expenses increased $44.1 million, or 28.6%, compared to fiscal 2011. Personnel and related costs increased $25.6 million and stock-based compensation expense increased $10.1 million due to a 23.0% increase in headcount. The increase in personnel and related costs included commission expense, which increased $7.3 million due to higher revenue in fiscal 2012 compared to fiscal 2011. Marketing expenses increased $3.6 million to support product demand generation and pipeline building. Pre-sales and training expenses also increased by $1.6 million due to increase in activity. Facilities and IT-related expenses related to our worldwide sales and marketing efforts also increased $2.3 million, of which $2.0 million is due to increased allocated costs which were previously classified in General and Administrative expenses.
General and administrative expenses
Years ended July 31, 2013 2012 2011 (in thousands)
General and administrative expenses $ 51,030 $ 46,775 $ 39,431Percent of total revenue 8.5% 9.0% 10.0%
For our fiscal year ended July 31, 2013, our general and administrative expenses increased $4.3 million, or 9.1%, compared to fiscal 2012. The increase was primarily driven by an increase in personnel and related costs of $4.4 million. Of the $4.4 million increase in personnel and related costs $2.8 million is due to an increase in stock-based compensation expense. We also incurred higher costs in IT and facilities. These increases in personnel and related expense, as well as IT and facilities were partially offset by lower spending on outside legal services.
For our fiscal year ended July 31, 2012, general and administrative expenses increased $7.3 million, or 18.7%, compared to fiscal 2011, primarily due to an increase of $4.4 million in personnel expenses as our headcount increased to support the growth of the business, as well as an increase in professional services fees of $4.1 million primarily due to legal, accounting and other services related to activities such as acquisitions and IT investment. These increases were partially offset by a net decrease of $1.5 million due to certain expenses related to facilities and IT being allocated out from G&A to other functional departments.
Legal Settlement
In the fourth quarter of fiscal 2013, we recorded a legal settlement of $14.0 million, the terms of which are confidential. Although the settlement did have a material impact to our Consolidated Statements of Operations and Comprehensive Income (Loss), it did not have a material adverse effect on our consolidated financial position or cash flows for fiscal 2013.
Other Income, net
Years ended July 31, 2013 2012 2011 (in thousands)
Interest income $ 1,138 $ 1,194 $ 1,018Other income, net 653 1,631 2,784
Total other income, net $ 1,791 $ 2,825 $ 3,802
Fiscal 2013 other income, net compared to fiscal 2012 other income, net
For our fiscal year ended July 31, 2013, our interest income was slightly down as compared to fiscal 2012. The decrease in interest income in fiscal 2013 is primarily due to lower investment returns as compared than fiscal 2012, partially offset by higher invested balances. The primary source of our interest income is our cash and investment balances in interest-earning accounts. Our average interest-earning cash and investment balance for fiscal 2013 was $251.9 million compared to $220.4 million for the same period in fiscal 2012.
For our fiscal year ended July 31, 2013, our other income, net decreased compared to fiscal 2012 primarily as a result of

54
the change in the valuation of our contingent rights liability related to the acquisition of Azalea. The contingent rights liability related to Azalea expired in December 2012 resulting in a gain of $1.3 million in fiscal 2013. This gain was partially offset by losses due to changes in foreign exchange rates. See Note 2, Business Combinations of the Notes to Consolidated Financial Statements for further discussion of the Azalea contingent rights liability.
Fiscal 2012 other income, net compared to fiscal 2011 other income, net
For our fiscal year ended July 31, 2012, our interest income increased 17.3% from fiscal 2011, primarily due to higher cash and investment balances in interest-earning accounts. Our average interest-earning cash and investment balance for fiscal 2012 was $220.4 million compared to $152.0 million for fiscal 2011.
For our fiscal year ended July 31, 2012, our other income, net decreased 41.4% compared to fiscal 2011 primarily as a result of the change in the fair value of our contingent rights liability related to the acquisition of Azalea Networks. See Note 2, Business Combinations of the Notes to Consolidated Financial Statements for further discussion of the Azalea contingent rights liability.
Provision for Income Taxes
Years ended July 31, 2013 2012 2011 (in thousands)
Income (loss) before income taxes $ (10,225) $ 13,560 $ (947)Provision for (benefit from) income taxes 21,383 22,411 (71,635)
Net income (loss) $ (31,608) $ (8,851) $ 70,688
Effective tax rate 209.1% 165.3% (7,564.4)%
Our effective tax rate in all periods is the result of the mix of income earned in various tax jurisdictions that apply a broad range of income tax rates. The provision for income taxes differs from the tax computed at the U.S. federal statutory income tax rate due primarily to fixed amortization of tax capitalized in connection with an international restructuring in fiscal 2012, state taxes, nondeductible stock based compensation, research and development tax credits, difference between foreign tax rates and US tax rate, and an increase in valuation allowance for deferred tax assets. Future effective tax rates could be adversely affected if earnings are lower than anticipated in countries where we have lower statutory tax rates or by unfavorable changes in tax laws and regulations or their interpretation.
Our effective tax rate for fiscal 2013 differed from the effective tax rate for fiscal 2012 primarily due to an increase in non-deductible stock-based compensation, an increase in our valuation allowance for deferred tax assets and a change in the mix of our earnings or loss to jurisdictions with different tax rates, partially offset by an increase in our federal research credit benefit of approximately $1.9 million recorded in fiscal 2013 due to the retroactive extension of the credit to fiscal 2012.
Our effective tax rate for fiscal 2012 differed from the effective tax rate for fiscal 2011 primarily due to the release of a deferred tax asset valuation allowance in fiscal 2011.
In fiscal 2012, we implemented a new structure of our corporate organization to more closely align our corporate organization with the international nature of our business activities and to reduce our overall effective tax rate through changes in how we develop and use our intellectual property and the structure of our international procurement and sales, including transfer-price arrangements for intercompany transactions.
We recorded a deferred charge during the first quarter of fiscal 2012 related to the deferral of income tax expense on intercompany profits that resulted from the sale of our intellectual property rights outside of North and South America to our Irish subsidiary. The deferred charge is included in prepaid and other assets and other non-current assets on the Consolidated Balance Sheets. As of July 31, 2013, the balance in prepaid and other assets was $7.7 million, and $1.5 million in other non-current assets. The deferred charge is amortized on a straight-line basis as a component of income tax expense over three to five years, based on the economic life of the intellectual property and will increase our effective tax rate during the amortization period. The deferred charge resulted in a 74.8 point increase to our effective tax rate for the year ending July 31, 2013 from 134.3% to 209.1%. While we have yet to realize any tax savings to date, we expect to realize a reduction in our effective tax rate as a result of our corporate reorganization after the deferred charges have been fully amortized.
See Note 1, The Company and its Significant Accounting Policies, of the Notes to Consolidated Financial Statements for
AnnualR
eport

55
a discussion of an immaterial prior period tax adjustment affecting fiscal 2013 and 2012.
For further information, refer to Note 10, Income Taxes, of the Notes to Consolidated Financial Statements.
Quarterly Fluctuations in Operating Results
The following table sets forth our unaudited quarterly Consolidated Statement of Operations data for each of the eight quarters ended July 31, 2013. In management’s opinion, the data has been prepared on the same basis as the audited Consolidated Financial Statements included in this report, and reflects all necessary adjustments, consisting only of normal recurring adjustments, necessary for a fair statement of this data.
Our operating results may fluctuate due to a variety of factors, many of which are outside of our control. As a result, comparing our operating results on a period-to-period basis may not be meaningful. Users of the financial statements should not rely on our past results as an indication of our future performance. Net income (loss) per share for the four quarters of each fiscal year may not sum to the total for the fiscal year because of the different number of shares outstanding during each period.
For the three months endedFY 2013 July 31, 2013 April 30, 2013 January 31, 2013 October 31, 2012 (in thousands, except per share data)
RevenueProduct $ 125,025 $ 121,195 $ 130,901 $ 119,222Professional services and support 28,039 25,941 24,461 25,260
Total revenue 153,064 147,136 155,362 144,482Cost of revenue
Product 38,505 36,782 37,665 36,161Professional services and support 7,228 7,190 6,991 5,957
Total cost of revenue 45,733 43,972 44,656 42,118Gross profit 107,331 103,164 110,706 102,364
Operating expensesResearch and development 38,112 34,983 34,688 31,963Sales and marketing 62,289 57,199 57,398 53,919General and administrative 13,275 13,405 12,399 11,951Legal settlement 14,000 — — —
Total operating expenses 127,676 105,587 104,485 97,833Operating income (loss) (20,345) (2,423) 6,221 4,531
Other income (expense), netInterest income 263 266 293 316Other income (expense), net (487) (114) 978 276
Total other income (expense), net (224) 152 1,271 592Income before provision for (benefit from) income taxes (20,569) (2,271) 7,492 5,123Provision for (benefit from) income taxes (4,988) 17,920 2,502 5,949Net income (loss) $ (15,581) $ (20,191) $ 4,990 $ (826)Shares used in computing net income (loss) per commonshare, basic 114,202 114,411 112,584 111,976Net income (loss) per common share, basic $ (0.14) $ (0.18) $ 0.04 $ (0.01)Shares used in computing net income (loss) per commonshare, diluted 114,202 114,411 123,270 111,976Net income (loss) per common share, diluted $ (0.14) $ (0.18) $ 0.04 $ (0.01)

56
Prior Period Adjustment
In the three months ended October 31, 2012, we recorded an out-of-period adjustment to correct an error that increases the provision for income taxes by $1.8 million which related to the three months ended July 31, 2012. The impact of this correction would have resulted in an increase in net loss of $1.8 million for the three months and fiscal year ended July 31, 2012. We have assessed the impact of this adjustment on previously reported financial statements and for the year ended July 31, 2013 and concluded that the adjustment is not material, either individually or in the aggregate to previously reported consolidated financial statements. On that basis, we have recorded the adjustment in the three months ended October 31, 2012.
For the three months endedFY 2012 July 31, 2012 April 30, 2012 January 31, 2012 October 31, 2011 (in thousands, except per share data)
RevenueProduct $ 117,101 $ 110,531 $ 105,970 $ 101,131Professional services and support 22,148 21,363 20,305 18,220
Total revenue 139,249 131,894 126,275 119,351Cost of revenue
Product 33,912 34,014 30,452 32,068Professional services and support 5,919 5,497 5,030 4,546
Total cost of revenue 39,831 39,511 35,482 36,614Gross profit 99,418 92,383 90,793 82,737
Operating expensesResearch and development 29,671 27,383 27,926 24,468Sales and marketing 53,064 49,974 49,720 45,615General and administrative 11,254 11,723 12,698 11,100
Total operating expenses 93,989 89,080 90,344 81,183Operating income 5,429 3,303 449 1,554
Other income (expense), netInterest income 318 301 299 276Other income (expense), net (1,252) (675) 2,731 827
Total other income (expense), net (934) (374) 3,030 1,103Income before provision for income taxes 4,495 2,929 3,479 2,657Provision for (benefit from) income taxes 7,525 (3,099) 14,861 3,124Net income (loss) $ (3,030) $ 6,028 $ (11,382) $ (467)Shares used in computing net income (loss) per commonshare, basic 111,419 110,236 108,084 105,937Net income (loss) per common share, basic $ (0.03) $ 0.05 $ (0.11) $ —Shares used in computing net income (loss) per commonshare, diluted 111,419 121,895 108,084 105,937Net income (loss) per common share, diluted $ (0.03) $ 0.05 $ (0.11) $ —
Prior Period Adjustments
In the three months ended July 31, 2012, we recorded adjustments to increase the vacation accrual by $0.5 million and recorded additional deferred cost of revenue of $0.3 million. In the three months ended April 30, 2012, we recorded adjustments to reduce tax expense of $0.8 million and recorded additional stock-based compensation expense of $0.5 million, related to the fiscal quarters ended October 31, 2011 and January 31, 2012, respectively. The impact of the adjustments made in fiscal quarters ended July 31, 2012 and April 30, 2012 would have resulted in a decrease in net loss of $0.1 million for the years ended July 31, 2010 and 2011, and a decrease in the net loss of $0.9 million for the year ended July 31, 2012. On a quarterly basis for fiscal 2012, the impact would be to decrease the net loss by $0.1 million, $0.3 million and $0.1 million in the three months ended October 31, 2011, January 31, 2012 and July 31, 2012, respectively, and to increase net income by $0.4 million for the three months ended April 30, 2012. We have assessed the impact of these adjustments on the Consolidated Balance Sheets and Consolidated Statements of Operations and Comprehensive Income (Loss) as of and for the periods ended July 31,
AnnualR
eport

57
2012, 2011, and 2010, and we have concluded that the adjustments are not material, either individually, or in the aggregate, to the previously reported consolidated financial statements. On that basis, we have recorded the adjustments in the three months ended April 30, 2012 and July 31, 2012.
Reclassifications
The ratable product and related professional services and support revenue and the related cost of revenue in fiscal 2012 and 2011 have been reclassified to professional services and support revenue and related cost of revenue, both of which are recorded in the revenue and cost of revenue sections of the Consolidated Statements of Operations and Comprehensive Income (Loss), respectively. We believe the ratable product and related professional services and support revenue and related cost of revenue are not material to total revenue and cost of revenue, and the nature of these amounts are consistent with professional services and support revenue and related cost of revenue. The amounts for the prior periods have been reclassified to conform with the current year presentation.
Liquidity and Capital Resources
July 312013
July 312012
(in thousands)
Working capital $ 368,760 $ 355,930Cash and cash equivalents $ 144,919 $ 133,629Short-term investments $ 269,882 $ 212,601
Years ended July 31, 2013 2012 2011 (in thousands)
Cash provided by operating activities $ 153,213 $ 112,861 $ 57,990Cash used in investing activities $ (98,831) $ (96,327) $ (44,916)Cash provided by (used in) financing activities $ (43,111) $ 36,467 $ 36,446
As of July 31, 2013, our principal sources of liquidity were our cash, cash equivalents and short-term investments. Cash and cash equivalents are comprised of cash, sweep funds and money market funds with an original maturity of 90 days or less at the time of purchase. Short-term investments include corporate bonds, U.S. government agency securities, U.S. treasury bills, commercial paper, and certificates of deposit. Cash, cash equivalents and short-term investments increased $68.6 million during fiscal 2013 from $346.2 million in cash, cash equivalents and short term investments as of July 31, 2012 to $414.8 million as of July 31, 2013. As of July 31, 2013, we had $35.0 million of cash and cash equivalents held outside the United States, the significant majority of which can be repatriated without adverse tax consequences. Historically, we have required capital principally to fund our working capital needs and acquisition activities. It is our investment policy to invest excess cash in a manner that preserves capital, provides liquidity and maintains appropriate diversification and optimizes current income within our policy’s framework. We are averse to principal loss and attempt to ensure the safety and preservation of our invested funds by limiting default risk, market risk and reinvestment risk. Our investment policy is designed to prevent fluctuations in market value which materially affect our financial results.
Cash Flows from Operating Activities
Our cash flows from operating activities will continue to be affected principally by our profitability, working capital requirements, the extent to which we increase spending on personnel and the continued growth in revenue and cash collections. The timing of hiring sales personnel in particular affects cash flows as there is a lag between the hiring of sales personnel and the generation of revenue and cash flows from sales personnel. In the future, we anticipate achieving cash tax savings and a reduction in our overall tax rate as a result of the new structure of our corporate organization implemented in fiscal 2012 offset by increases in our cash tax obligations after our tax loss and credit carryforwards have been utilized. Our largest source of operating cash flows is cash collections from our customers. Our primary uses of cash from operating activities are for personnel related expenditures, purchases of inventory, and rent payments.
During fiscal 2013, net cash provided by operating activities increased $40.4 million compared to fiscal 2012. The additional cash flows generated from operating activities was primarily due to an increase in cash flows of $16.5 million from operations after adjusting for non-cash items, including depreciation and amortization, and stock-based compensation, and an

58
increase of $46.6 million from the change in operating assets and liabilities. These additional cash flows were partially offset by an increase in our net loss of $22.8 million. The $46.6 million change in operating assets and liabilities was primarily driven by an increase in other current and non-current accrued liabilities.
During fiscal 2012, net cash provided by operating activities increased $54.9 million compared to fiscal 2011. The additional cash flow generated from operating activities was primarily due to an increase in cash flow of $93.0 million from operations after adjusting for non-cash items, including depreciation and amortization, and stock-based compensation, and an increase of $41.4 million from the change in operating assets and liabilities. These additional cash flows were partially offset by a decrease in net income of $79.5 million in fiscal 2012 compared to 2011. The $41.4 million change in operating assets and liabilities was primarily driven by an increase in deferred revenue and income taxes payable.
Cash Flows from Investing Activities
Cash used in investing activities increased $2.5 million during fiscal 2013 compared to fiscal 2012. We purchased $98.0 million more short-term investments during fiscal 2013 compared to fiscal 2012 as we reinvested cash flow from operations. Purchases of property and equipment in fiscal 2013 increased $7.6 million compared to fiscal 2012 due to an increase in investments in our research and development infrastructure. The higher level of direct research and development investment was offset by lower acquisition expenditures. We completed one acquisition during fiscal 2013 for a total cash purchase price consideration of $16.8 million, net of cash received, compared to two acquisitions in fiscal 2012 totaling $22.5 million, net of cash received. See Note 2, Business Combinations, of the Notes to Consolidated Financial Statements.
Cash used in investing activities increased $51.4 million during fiscal 2012 compared to fiscal 2011. We purchased $44.7 million more short-term investments during fiscal 2012 compared to fiscal 2011 as we reinvested cash flow from operations. Purchases of property and equipment in fiscal 2012 increased $3.1 million compared to fiscal 2011 due to an increase in headcount. Further, we completed two acquisitions during fiscal 2012 for a total of $22.5 million of cash used, net of cash received, compared to two acquisitions in fiscal 2011 totaling $4.3 million, net of cash received. See Note 2, Business Combinations, of the Notes to Consolidated Financial Statements.
Cash Flows from Financing Activities
Cash provided by (used in) financing activities changed by $79.6 million during fiscal 2013 compared to fiscal 2012 and primarily consisted of the increase of cash used in our stock repurchase program of $66.3 million compared to fiscal 2012, combined with a change in the excess tax benefit associated with stock-based compensation of $11.7 million and by a decrease from cash provided from issuance of common stock of $1.6 million.
Cash provided by financing activities was essentially flat in fiscal 2012 compared to fiscal 2011 and primarily consisted of the cash proceeds of $34.8 million we received from the issuance of common stock in conjunction with our equity plans. In addition, during fiscal 2012, we started receiving tax benefits associated with stock-based compensation of $21.6 million. This tax benefit was slightly offset by $19.9 million of cash used to repurchase our common stock.
Based on our current cash, cash equivalents and short-term investments we expect that we will have sufficient resources to fund our operations for the next 12 months. However, we may, in the future, need to raise additional capital or incur indebtedness to fund our operations or support acquisition activity. Our future capital requirements will depend on many factors, including our rate of revenue growth, the expansion of our sales and marketing activities, the timing and extent of expansion into new territories, the timing of introductions of new products and enhancements to existing products, the continuing market acceptance of our products and potential future business acquisitions.
Contractual Obligations & Commitments
Operating leases and purchase obligations
The following is a summary of our contractual obligations:
TotalLess Than
1 Year1 — 3Years
3 — 5Years
MoreThan
5 Years (In thousands)
Operating leases $ 24,740 $ 7,059 $ 13,741 $ 3,940 $ —Purchase obligations (1) 40,031 29,494 8,272 564 1,701
Total contractual obligations $ 64,771 $ 36,553 $ 22,013 $ 4,504 $ 1,701
AnnualR
eport

59
(1) Purchase obligations represent contractual amounts that will be due to purchase goods and services to be used in our
operations and exclude contractual amounts that are cancelable without penalty. These contractual amounts are related principally to inventory, information technology and marketing related purchase agreements.
Uncertain tax positions
Other long term liabilities on our balance sheet include $7.6 million of long-term income taxes payable for uncertain tax positions. We are unable to reliably estimate the timing of future payments related to uncertain tax positions and therefore have excluded them from the preceding table.
Off-Balance Sheet Arrangements
In the ordinary course of business, we have investments in privately held companies, which we review annually to determine if they should be accounted for as variable interest entities. For the year ended July 31, 2013, we evaluated our investments in these privately held companies and concluded that we are not the primary beneficiary of any variable interest from investment entities. As a result, we account for these investments on a cost basis and do not consolidate the activity of these investee entities. Certain events can require a reassessment of our investments in privately held companies to determine if they meet the criteria for variable interest entities and to determine which stakeholders in such entities will be the primary beneficiary. In the event of a reassessment, we may be required to make additional disclosures or consolidate these entities in future periods. As of July 31, 2013, we had no off-balance sheet arrangements.
ITEM 7A. QUANTITATIVE AND QUALITATIVE DISCLOSURES ABOUT MARKET RISK
Foreign Currency Risk
As of July 31, 2013, foreign currency cash accounts totaled $16.1 million, primarily in euros, British Pounds, and Indian Rupees.
Nearly all of our sales contracts are denominated in U.S. Dollars, and therefore, our revenue is not subject to significant foreign currency risk. Our operating expenses and cash flows are subject to fluctuations due to changes in foreign currency exchange rates, particularly changes in the British Pound, euro, Indian Rupee, and Chinese Yuan. To date, we have not entered into any hedging contracts because expenses in foreign currencies have been insignificant, and exchange rate fluctuations have had little impact on our operating results and cash flows.
We assessed the risk of loss in fair values from the impact of hypothetical changes in foreign currency exchange rates. For foreign currency exchange rate risk, a 10% increase or decrease of foreign currency exchange rates against the U.S. dollar with all other variables held constant would have resulted in a $1.6 million change in the value of our foreign currency cash accounts.
Interest Rate Sensitivity
We had cash, cash equivalents and short-term investments totaling $414.8 million and $346.2 million as of July 31, 2013, and July 31, 2012, respectively. The cash, cash equivalents and short-term investments are held for working capital purposes. We do not use derivative financial instruments in our investment portfolio. We have an investment portfolio of fixed income securities that are classified as “available-for-sale securities.” These securities, like all fixed income instruments, are subject to interest rate risk and will fall in value if market interest rates increase. We attempt to limit this exposure by investing primarily in short-term securities. Due to the short duration and conservative nature of our investment portfolio, a movement of 10% in market interest rates would not have a material impact on our operating results and the total value of the portfolio over the next fiscal year. If overall interest rates had fallen by 10% during fiscal 2013, our interest income on cash, cash equivalents and short-term investments would have declined by $0.1 million assuming consistent investment levels.

60
ITEM 8. CONSOLIDATED FINANCIAL STATEMENTS AND SUPPLEMENTARY DATA
Index to Consolidated Financial Statements
Page
Management’s Report on Internal Control Over Financial Reporting 61Report of Independent Registered Public Accounting Firm 62Consolidated Balance Sheets 63Consolidated Statements of Operations and Comprehensive Income (Loss) 64Consolidated Statements of Stockholders’ Equity 65Consolidated Statements of Cash Flows 66Notes to Consolidated Financial Statements 67
AnnualR
eport

61
MANAGEMENT’S REPORT ONINTERNAL CONTROL OVER FINANCIAL REPORTING
Management of our Company is responsible for establishing and maintaining adequate internal control over financial reporting as defined in Rules 13a-15(f) and 15(d)-15(f) under the Securities Exchange Act of 1934. Our internal control over financial reporting is designed to provide reasonable assurance regarding the reliability of financial reporting and the preparation of financial statements for external purposes in accordance with generally accepted accounting principles. Internal control over financial reporting includes those policies and procedures that:
• pertain to the maintenance of records that, in reasonable detail, accurately and fairly reflect the transactions and dispositions of the assets of our Company;
• provide reasonable assurance that transactions are recorded as necessary to permit preparation of financial statements in accordance with generally accepted accounting principles, and that receipts and expenditures of the Company are being made only in accordance with authorizations of management and directors of our Company; and
• provide reasonable assurance regarding prevention or timely detection of unauthorized acquisition, use or disposition of our Company’s assets that could have a material effect on the financial statements.
Because of its inherent limitations, internal control over financial reporting may not prevent or detect misstatements. Also, projections of any evaluation of effectiveness to future periods are subject to the risk that controls may become inadequate because of changes in conditions and that the degree of compliance with the policies or procedures may change over time.
Management assessed the effectiveness of our internal control over financial reporting as of July 31, 2013. In making this assessment, our management used the criteria set forth in Internal Control-Integrated Framework (1992) issued by the Committee of Sponsoring Organizations of the Treadway Commission (“COSO”). Based upon this assessment, management has concluded that, as of July 31, 2013, our internal control over financial reporting was effective to provide reasonable assurance regarding the reliability of financial reporting and the preparation of financial statements for external purposes in accordance with generally accepted accounting principles.
The effectiveness of the Company’s internal control over financial reporting as of July 31, 2013 has been audited by PricewaterhouseCoopers LLP, an independent registered public accounting firm, as stated in their report which appears on the following page.
/s/ Dominic P. Orr /s/ Michael M. Galvin
Dominic P. OrrPresident, Chief Executive Officer andChairman of the Board of DirectorsSeptember 24, 2013
Michael M. GalvinChief Financial OfficerSeptember 24, 2013

62
REPORT OF INDEPENDENT REGISTERED PUBLIC ACCOUNTING FIRM
To the Board of Directors and Stockholders ofAruba Networks, Inc.:
In our opinion, the accompanying consolidated balance sheets and the related consolidated statements of operations and comprehensive income (loss), stockholders’ equity, and cash flows present fairly, in all material respects, the financial position of Aruba Networks, Inc. and its subsidiaries at July 31, 2013 and July 31, 2012, and the results of their operations and their cash flows for each of the three years in the period ended July 31, 2013 in conformity with accounting principles generally accepted in the United States of America. In addition, in our opinion, the financial statement schedule listed in the index appearing under Item 15(a)(2) presents fairly, in all material respects, the information set forth therein when read in conjunction with the related consolidated financial statements. Also in our opinion, the Company maintained, in all material respects, effective internal control over financial reporting as of July 31, 2013, based on criteria established in Internal Control — Integrated Framework (1992) issued by the Committee of Sponsoring Organizations of the Treadway Commission (COSO). The Company’s management is responsible for these financial statements and financial statement schedule, for maintaining effective internal control over financial reporting and for its assessment of the effectiveness of internal control over financial reporting, included in the accompanying Management’s Report on Internal Control over Financial Reporting. Our responsibility is to express opinions on these financial statements, on the financial statement schedule, and on the Company’s internal control over financial reporting based on our integrated audits. We conducted our audits in accordance with the standards of the Public Company Accounting Oversight Board (United States). Those standards require that we plan and perform the audits to obtain reasonable assurance about whether the financial statements are free of material misstatement and whether effective internal control over financial reporting was maintained in all material respects. Our audits of the financial statements included examining, on a test basis, evidence supporting the amounts and disclosures in the financial statements, assessing the accounting principles used and significant estimates made by management, and evaluating the overall financial statement presentation. Our audit of internal control over financial reporting included obtaining an understanding of internal control over financial reporting, assessing the risk that a material weakness exists, and testing and evaluating the design and operating effectiveness of internal control based on the assessed risk. Our audits also included performing such other procedures as we considered necessary in the circumstances. We believe that our audits provide a reasonable basis for our opinions.
A company’s internal control over financial reporting is a process designed to provide reasonable assurance regarding the reliability of financial reporting and the preparation of financial statements for external purposes in accordance with generally accepted accounting principles. A company’s internal control over financial reporting includes those policies and procedures that (i) pertain to the maintenance of records that, in reasonable detail, accurately and fairly reflect the transactions and dispositions of the assets of the company; (ii) provide reasonable assurance that transactions are recorded as necessary to permit preparation of financial statements in accordance with generally accepted accounting principles, and that receipts and expenditures of the company are being made only in accordance with authorizations of management and directors of the company; and (iii) provide reasonable assurance regarding prevention or timely detection of unauthorized acquisition, use, or disposition of the company’s assets that could have a material effect on the financial statements.
Because of its inherent limitations, internal control over financial reporting may not prevent or detect misstatements. Also, projections of any evaluation of effectiveness to future periods are subject to the risk that controls may become inadequate because of changes in conditions, or that the degree of compliance with the policies or procedures may deteriorate.
/s/ PricewaterhouseCoopers LLPSan Jose, CaliforniaSeptember 24, 2013
AnnualR
eport

63
ARUBA NETWORKS, INC.
CONSOLIDATED BALANCE SHEETS
July 31,2013
July 31,2012
(in thousands, except per share data)ASSETSCurrent assets
Cash and cash equivalents $ 144,919 $ 133,629Short-term investments 269,882 212,601Accounts receivable, net of allowance for doubtful accounts of $805 and $276 as of
July 31, 2013 and 2012, respectively 93,191 80,190Inventory, net 28,895 22,202Deferred cost of revenue 12,657 11,241Prepaids and other current assets 20,090 18,996Deferred income tax assets, current 29,076 34,584
Total current assets 598,710 513,443Property and equipment, net 27,536 19,901Goodwill 67,242 56,947Intangible assets, net 26,937 27,036Deferred income tax assets, non-current 19,788 20,664Other non-current assets 6,530 10,905
Total assets $ 746,743 $ 648,896LIABILITIES AND STOCKHOLDERS’ EQUITY
Current liabilitiesAccounts payable $ 24,891 $ 22,504Accrued liabilities 94,632 52,375Income taxes payable, current 662 2,032Deferred revenue, current 109,765 80,602
Total current liabilities 229,950 157,513Deferred revenue, non-current 31,578 22,375Other non-current liabilities 8,990 2,118
Total liabilities 270,518 182,006Commitments and contingencies (Note 13)Stockholders’ equity
Common stock: $0.0001 par value; 350,000 shares authorized at July 31, 2013 and2012; 113,409 and 111,529 shares issued and outstanding at July 31, 2013 and 2012,respectively 11 11
Additional paid-in capital 623,155 582,077Accumulated other comprehensive loss (1,540) (1,405)Accumulated deficit (145,401) (113,793)
Total stockholders’ equity 476,225 466,890Total liabilities and stockholders’ equity $ 746,743 $ 648,896
The accompanying notes are an integral part of the Consolidated Financial Statements.

64
ARUBA NETWORKS, INC.
CONSOLIDATED STATEMENTS OF OPERATIONS AND COMPREHENSIVE INCOME (LOSS)
Years ended July 31, 2013 2012 2011 (in thousands, except per share data)
RevenueProduct $ 496,343 $ 434,733 $ 334,860Professional services and support 103,701 82,036 61,654
Total revenue 600,044 516,769 396,514Cost of revenue
Product 149,113 130,446 107,820Professional services and support 27,366 20,992 14,883
Total cost of revenue 176,479 151,438 122,703Gross profit 423,565 365,331 273,811
Operating expensesResearch and development 139,746 109,448 84,890Sales and marketing 230,805 198,373 154,239General and administrative 51,030 46,775 39,431Legal settlement 14,000 — —
Total operating expenses 435,581 354,596 278,560Operating income (loss) (12,016) 10,735 (4,749)
Other income, netInterest income 1,138 1,194 1,018Other income, net 653 1,631 2,784
Total other income, net 1,791 2,825 3,802Income (loss) before income taxes (10,225) 13,560 (947)Provision for (benefit from) income taxes 21,383 22,411 (71,635)Net income (loss) $ (31,608) $ (8,851) $ 70,688Other comprehensive income (loss):
Foreign currency translation adjustments — (1,552) —Unrealized gain (loss) on short-term investments, net of tax (135) 20 29
Comprehensive income (loss) $ (31,743) $ (10,383) $ 70,717Shares used in computing net income (loss) per common share, basic 113,284 108,774 100,299Net income (loss) per common share, basic $ (0.28) $ (0.08) $ 0.70Shares used in computing net income (loss) per common share, diluted 113,284 108,774 117,117Net income (loss) per common share, diluted $ (0.28) $ (0.08) $ 0.60Stock-based compensation expense included in above:
Cost of revenue $ 6,559 $ 5,318 $ 3,464Research and development 36,366 31,203 23,026Sales and marketing 37,782 34,653 24,399General and administrative 15,519 12,738 12,861
The accompanying notes are an integral part of the Consolidated Financial Statements.
AnnualR
eport

65
ARUBA NETWORKS, INC.CONSOLIDATED STATEMENTS OF STOCKHOLDERS’ EQUITY
Common Stock AdditionalPaid-inCapital
AccumulatedOther
ComprehensiveIncome (Loss)
AccumulatedDeficit
Shares Amount Total
(in thousands)Balance at July 31, 2010 93,606 $ 9 $ 326,178 $ 98 $ (175,630) $ 150,655Fair value of shares issued to non-employees 149 — 3,952 — — 3,952Exercise of common stock options 6,413 1 29,751 — — 29,752Shares purchased under employee stock
purchase plan 2,048 — 6,889 — — 6,889Repurchase of common stock — — 1 — — 1Stock-based compensation expense related to
stock options and awards issued toemployees 1,164 — 54,879 — — 54,879
Excess tax benefit associated with stock-basedcompensation — — (194) — — (194)
Common stock issued in purchase acquisition 1,525 — 28,691 — — 28,691Unrealized gain on short-term investments, net
of taxes — — — 29 — 29Net income — — — — 70,688 70,688Balance at July 31, 2011 104,905 $ 10 $ 450,147 $ 127 $ (104,942) $ 345,342Fair value of shares issued to non-employees 36 — 1,453 — — 1,453Exercise of common stock options 3,745 1 21,434 — — 21,435Shares purchased under employee stock
purchase plan 853 — 13,344 — — 13,344Repurchase of common stock (1,409) — (19,884) — — (19,884)Stock-based compensation expense related to
stock options and awards issued toemployees 2,778 — 85,293 — — 85,293
Excess tax benefit associated with stock-basedcompensation — — 19,768 — — 19,768
Common stock issued in purchase acquisition 621 — 10,522 — — 10,522Unrealized gain on short-term investments, net
of taxes — — — 20 — 20Foreign currency translation adjustments, net
of taxes — — — (1,552) — (1,552)Net loss — — — — (8,851) (8,851)Balance at July 31, 2012 111,529 $ 11 $ 582,077 $ (1,405) $ (113,793) $ 466,890Fair value of shares issued to non-employees 71 — 623 — — 623Exercise of common stock options 2,860 — 19,196 — — 19,196Shares purchased under employee stock
purchase plan 838 — 13,998 — — 13,998Repurchase of common stock (5,311) — (86,211) — — (86,211)Stock-based compensation expense related to
stock options and awards issued toemployees 3,422 — 93,187 — — 93,187
Excess tax benefit associated with stock-basedcompensation — — 285 — — 285
Unrealized loss on short-term investments, net of taxes — — — (135) — (135)
Net loss — — — — (31,608) (31,608)Balance at July 31, 2013 113,409 $ 11 $ 623,155 $ (1,540) $ (145,401) $ 476,225
The accompanying notes are an integral part of the Consolidated Financial Statements.

66
ARUBA NETWORKS, INC.
CONSOLIDATED STATEMENTS OF CASH FLOWS
Years ended July 31, 2013 2012 2011 (in thousands)Cash flows from operating activitiesNet income (loss) $ (31,608) $ (8,851) $ 70,688Adjustments to reconcile net income (loss) to net cash provided by
operating activities:Depreciation and amortization 23,701 19,123 15,042Provision for doubtful accounts 797 125 17Write-downs for excess and obsolete inventory 5,597 4,113 2,647Stock-based compensation expense 96,226 83,912 63,750Accretion of purchase discounts on short-term investments, net 1,413 1,142 1,290Loss (gain) on disposal of fixed assets 269 544 (3)Change in carrying value of contingent rights liability (1,665) (2,319) (3,598)Deferred income taxes (237) 15,369 (72,638)Recovery of escrow funds — (702) —Excess tax benefit associated with stock-based compensation (9,906) (21,572) 194
Changes in operating assets and liabilities, net of effects of acquisitions:Accounts receivable (13,524) (11,374) (24,821)Inventory (15,970) 1,615 (16,900)Prepaids and other current assets (356) (14,594) (1,658)Deferred costs of revenue (1,417) (4,658) (1,548)Other current and non-current assets 6,119 (8,131) (240)Accounts payable 2,906 (4,694) (167)Deferred revenue 38,282 34,522 12,713Other current and non-current liabilities 40,950 9,150 13,331Income taxes payable 11,636 20,141 (109)
Net cash provided by operating activities 153,213 112,861 57,990Cash flows from investing activitiesPurchases of short-term investments (287,183) (189,218) (144,512)Proceeds from sales of short-term investments 75,806 55,790 28,927Proceeds from maturities of short-term investments 151,718 72,650 84,870Purchases of property and equipment (20,655) (13,044) (9,909)Proceeds from sale of property and equipment — — 11Investments in privately-held companies (1,750) — —Cash paid in acquisitions, net of cash acquired (16,767) (22,505) (4,303)
Net cash used in investing activities (98,831) (96,327) (44,916)Cash flows from financing activitiesProceeds from issuance of common stock 33,194 34,779 36,640Repurchases of common stock under stock repurchase program (86,211) (19,884) —Excess tax benefit associated with stock-based compensation 9,906 21,572 (194)
Net cash provided by (used in) financing activities (43,111) 36,467 36,446Effect of exchange rate changes on cash and cash equivalents 19 (145) (1)Net increase in cash and cash equivalents 11,290 52,856 49,519Cash and cash equivalents, beginning of period 133,629 80,773 31,254Cash and cash equivalents, end of period $ 144,919 $ 133,629 $ 80,773Supplemental disclosure of cash flow informationIncome taxes paid $ 3,344 $ 5,587 $ 1,152Supplemental disclosure of non-cash investing and financing activitiesCommon stock issued for acquisitions $ — $ 12,000 $ 28,691Contingent rights issued for purchase acquisition $ — $ — $ 9,486
The accompanying notes are an integral part of the Consolidated Financial Statements.
AnnualR
eport

67
ARUBA NETWORKS, INC.
NOTES TO CONSOLIDATED FINANCIAL STATEMENTS
1. The Company and its Significant Accounting Policies
The Company
Aruba Networks, Inc. (the “Company”), incorporated in the state of Delaware on February 11, 2002, is a leading global provider of enterprise mobility solutions. The Company's Mobile Virtual Enterprise (“MOVE”) architecture leverages its diverse products (including its ArubaOS operating system, controllers, wireless access points, switches, application software modules, access management solution, and multi-vendor management solution software) to unify wired and wireless network infrastructures into one seamless access solution for its customers, enabling them to provide network access to traveling business professionals, remote workers and employees and guests of branch offices and corporate headquarters. The Company derives its revenue from sales of its ArubaOS operating system, controllers, wireless access points, switches, application software modules, access management solution, multi-vendor management solution software, and professional services and support. The Company has offices in the Americas, Europe, the Middle East and the Asia Pacific and Japan regions and employs staff around the world.
Significant Accounting Policies
Principles of Consolidation
The accompanying Consolidated Financial Statements include the accounts of the Company and its wholly-owned subsidiaries. All intercompany accounts and transactions have been eliminated.
Use of Estimates
The preparation of these financial statements in conformity with generally accepted accounting principles in the United States of America requires that the Company make estimates and judgments that affect the reported amounts of assets, liabilities, revenue and expenses as presented in the consolidated financial statements and accompanying notes. The Company’s critical accounting policies are those that affect the Company’s financial statements materially and involve difficult, subjective or complex judgments by management and include revenue recognition, stock-based compensation, inventory valuation, allowances for doubtful accounts, fair value measurements, impairment of goodwill and intangible assets, and accounting for income taxes. The Company bases its estimates on historical experience and on various other assumptions that are believed to be reasonable under the circumstances, the results of which form the basis for making judgments about the carrying values of assets and liabilities that are not readily apparent from other sources. Although these estimates are based on management’s best knowledge of current events and actions that may impact the Company in the future, actual results differ from the estimates made by management with respect to these and other items.
Prior Period Adjustment
In the three months ended October 31, 2012, the Company recorded an out-of-period adjustment to correct an error that increases the provision for income taxes by $1.8 million which related to the three months ended July 31, 2012. The impact of this correction would have resulted in an increase in net loss of $1.8 million for the three months and fiscal year ended July 31, 2012. The Company has assessed the impact of this adjustment on previously reported financial statements and for the year ended July 31, 2013 and concluded that the adjustment is not material, either individually or in the aggregate to previously reported consolidated financial statements. On that basis, the Company has recorded the adjustment in the three months ended October 31, 2012.
Reclassifications
Certain prior year amounts have been reclassified to conform to the current year presentation. As of July 31, 2012 accrued trade payables of $14.7 million has been reclassified from accrued liabilities to accounts payable in order to provide improved disclosure relating to invoices that have been received as of the reporting period-ends but have not yet been processed.

ARUBA NETWORKS, INC.NOTES TO CONSOLIDATED FINANCIAL STATEMENTS
Continued
68
The following table discloses the amounts as previously filed and the amounts after the reclassification.
As of July 31, 2012
As Previously
FiledReclassified
AmountAs
Reclassified
(in thousands)
Current liabilitiesAccounts payable $ 7,807 $ 14,697 $ 22,504Accrued liabilities 67,072 (14,697) 52,375
In addition, the ratable product and related professional services and support revenue and the related cost of revenue in fiscal 2012 and 2011 have been reclassified to professional services and support revenue and related cost of revenue, both of which are recorded in the revenue and cost of revenue sections of the Consolidated Statements of Operations and Comprehensive Income (Loss), respectively. The Company believes the ratable product and related professional services and support revenue and related cost of revenue are not material to total revenue and cost of revenue, and the nature of these amounts are consistent with professional services and support revenue and related cost of revenue. The amounts for the prior periods have been reclassified to conform with the current year presentation.
Foreign Currency Transactions
The functional currency of the Company's foreign subsidiaries is the U.S. dollar. Accordingly, the Company's monetary assets and liabilities of the foreign subsidiaries are re-measured into U.S. dollars at the exchange rates in effect at the reporting date, non-monetary assets and liabilities are translated at historical rates, and revenue and expenses are translated at average exchange rates in effect during each reporting period. The transaction gains and losses are included as a component of other income, net in the accompanying Consolidated Statements of Operations and Comprehensive Income (Loss).
Previously, the Company's Irish subsidiary used the euro as its functional currency. Consequently, all assets and liabilities were translated to U.S. dollars using exchange rates in effect at the balance sheet dates. Translation adjustments were included in stockholders' equity in the accompanying consolidated balance sheets as a component of accumulated other comprehensive loss. As of May 1, 2012, the Company changed its operational strategy and determined that the Irish subsidiary will buy and sell in U.S. dollars. Consequently, the Company changed its functional currency designation for the subsidiary from the euro to U.S. dollars as of May 1, 2012. The cumulative translation adjustment of $1.5 million for the year ending July 31, 2013 is considered to be the basis in the assets of the Irish subsidiary and will remain as a component of accumulated other comprehensive loss until such time as the Irish subsidiary is liquidated.
Risks and Uncertainties
The Company is subject to all of the risks inherent in operating in the networking and communications industry. These risks include, but are not limited to, new and rapidly evolving markets, a lengthy sales cycle, dependence on the development of new products and services, unfavorable economic and market conditions, customer acceptance of new products, competition from larger and more established companies, limited management resources, dependence on a limited number of contract manufacturers and suppliers, and the changing nature of the networking and communications industry. Failure by the Company to anticipate or to respond adequately to technological developments in its industry, changes in customer or supplier requirements, changes in regulatory requirements or industry standards, or any significant delays in the development or introduction of products and services, would have a material adverse effect on the Company's business, operating results and financial position.
Fair Value of Financial Instruments
The Company measures its financial instruments at fair value or amounts that approximate fair value. The Company maximizes the use of observable inputs and minimizes the use of unobservable inputs when developing fair value measurements. When available, the Company uses quoted market prices to measure fair value. If market prices are not available, fair value measurement is based upon models that use primarily market-based or independently-sourced market parameters. If market observable inputs for model-based valuation techniques are not available, the Company makes judgments about assumptions market participants would use in estimating the fair value of the financial instrument. Carrying values of cash equivalents, short-term investments, accounts receivable, accounts payable, and accrued liabilities approximate their fair values due to the short-term nature and liquidity of these financial instruments.
AnnualR
eport

ARUBA NETWORKS, INC.NOTES TO CONSOLIDATED FINANCIAL STATEMENTS
Continued
69
Cash and Cash Equivalents
The Company considers all highly liquid marketable securities purchased with an original maturity of 90 days or less at the time of purchase to be cash equivalents. Cash and cash equivalents are comprised of cash, sweep funds and money market funds. Due to the short-term nature and liquidity of these financial instruments, the carrying value of these assets approximates fair value.
Short-Term Investments
Short-term investments comprise marketable securities that consist primarily of corporate bonds, U.S. government agency securities, U.S. treasury bills, commercial paper, certificates of deposit, municipal notes, and bonds with original maturities beyond 90 days. As the Company views all securities as representing the investment of funds available for current operations, and management has the ability and intent, if necessary, to liquidate any of these investments in order to meet the Company’s liquidity needs within the next 12 months, the short-term investments are classified as available-for-sale. The Company’s policy is to protect the value of its investment portfolio and minimize principal risk by earning returns based on current interest rates.
The Company reviews the individual securities in its portfolio to determine whether a decline in a security’s fair value below the amortized cost basis is other-than-temporary. If other-than-temporary impairment (“OTTI”) has been incurred, and it is more likely than not that the Company will not sell the investment security before the recovery of its amortized cost basis, then the OTTI is separated into (a) the amount representing the credit loss and (b) the amount related to all other factors. The amount of the total OTTI related to the credit loss is recognized in earnings. The amount of the total OTTI related to other factors is recognized in accumulated other comprehensive income (loss). The Company determined that there were no investments in its portfolio that were other-than-temporarily impaired as of July 31, 2013 and 2012.
Concentrations of Credit Risk
Financial instruments that potentially subject the Company to a concentration of credit risk include cash, cash equivalents, short-term investments and accounts receivable. The Company maintains its cash, cash equivalents and short-term investments with high credit quality financial institutions and has not experienced any losses on its deposits of its cash and cash equivalents and its short-term investments due to concentration of credit risk. The Company’s accounts receivable are derived from revenue earned from customers located in the Americas, Europe, the Middle East, Africa, Asia Pacific and Japan. The Company performs ongoing credit evaluations of its customers’ financial conditions and generally requires no collateral from its customers. The Company maintains an allowance for doubtful accounts based upon the expected collectability of accounts receivable, and to date such losses have been within management’s expectations. See Note 12 in these Notes to Consolidated Financial Statements for more details on significant customers.
Allowance for Doubtful Accounts
The Company records an allowance for doubtful accounts based on historical experience and a detailed assessment of the collectability of its accounts receivable. In estimating the allowance for doubtful accounts, management considers, among other factors, (i) the aging of the accounts receivable, including trends within and ratios involving the age of the accounts receivable, (ii) the Company’s historical write-offs, (iii) the credit-worthiness of each customer, (iv) the economic conditions of the customer’s industry, and (v) general economic conditions. In cases where the Company is aware of circumstances that may impair a specific customer’s ability to meet its financial obligations, the Company records a specific allowance against amounts due from the customer, and thereby reduces the net recognized receivable to the amount it reasonably believes will be collected.
Charges to operations relating to allowance for doubtful accounts were $0.7 million and $0.1 million for the fiscal years ended July 31, 2013 and 2012. The charge was less than $0.1 million for the fiscal year ended July 31, 2011.
Inventory, net
Inventory consists of hardware and related component parts and is stated at the lower of cost or market, which approximates actual cost, on a first-in, first-out basis. The Company records inventory write-downs for potentially excess inventory based on forecasted demand, economic trends and technological obsolescence of its products and transition of inventory-related to new product releases. At the point of loss recognition, a new, lower-cost basis for that inventory is established, and subsequent changes in facts and circumstances do not result in the restoration or increase in that newly established cost basis. Inventory write-downs are reflected as cost of product revenue and amounted to approximately $5.6 million, $4.1 million, and $2.6 million, for the fiscal years ended July 31, 2013, 2012, and 2011, respectively.

ARUBA NETWORKS, INC.NOTES TO CONSOLIDATED FINANCIAL STATEMENTS
Continued
70
Deferred Costs of Revenue
When the Company’s products have been delivered, but the product revenue associated with the arrangement has been deferred as a result of not meeting the revenue recognition criteria, the Company also defers the related inventory costs for the delivered items.
Property and Equipment, net
Property and equipment, net are stated at historical cost net of accumulated depreciation. Property and equipment, excluding leasehold improvements, are depreciated using the straight-line method over the estimated useful lives of the respective assets, generally ranging from two to five years. Leasehold improvements are amortized using the straight-line method over the shorter of the estimated useful lives of the respective assets, or the lease term. Leasehold improvements are recorded at cost with any reimbursements from the landlord being accounted for as a reduction of of rent expense using the straight-line method over the lease term.
Upon retirement or sale, the cost of assets disposed of and the related accumulated depreciation are removed from the accounts and any resulting gain or loss is credited or charged to the statement of operations, under other income, net. Disposals resulted in a loss of $0.3 million and $0.5 million for the fiscal years ended July 31, 2013 and 2012, respectively. Disposals resulted in a gain of less than $0.1 million for the fiscal year ended July 31, 2011.
Expenditures for maintenance and repairs are expensed as incurred and significant improvements and betterments that substantially enhance the life of an asset are capitalized.
Software Development Costs
The Company capitalizes certain costs incurred to develop software for internal use and amortizes the capitalized costs on a straight-line basis over the estimated useful life, generally three years. Such capitalized costs include external direct costs utilized in developing or obtaining the applications and payroll and payroll-related expenses for employees who are directly associated with the applications. Capitalization of such costs begins when the internal-use software system has reached the application development stage and ceases when the project is substantially complete and ready for its intended purpose. Capitalized internal-use software is included in the computer software category within property and equipment, net, in the Company's Consolidated Balance Sheets. For the year ended July 31, 2013, the Company capitalized costs associated with internal-use software totaling $3.5 million. Unamortized balance of capitalized internal-use software at July 31, 2013 was $3.3 million and related amortization expense for the year ended July31, 2013 was $0.2 million. There were no capitalized costs for internal-use software in the year ended July 31, 2012.
The Company expenses costs to develop software products or the software component of products to be marketed to external users, before technological feasibility of such products is reached. After technological feasibility is established, material software development costs are capitalized. To date, the period between achieving technological feasibility, which the Company has defined as the establishment of a working model, which typically occurs when beta testing commences, and the general availability of such software has been short and software development costs qualifying for capitalization have been insignificant. Accordingly, the Company has not capitalized any related software development costs for the years ended July 31, 2013 and 2012.
Intangible Assets, net
Intangible assets with finite lives are carried at cost, less accumulated amortization. Amortization is computed using the straight-line method over the estimated economic lives of the assets, which range from one to eleven years.
Impairment of Long-lived Assets and Indefinite-lived Intangibles
Long-lived assets, including intangible assets with finite lives, are reviewed for impairment whenever events or changes in circumstances indicate that the carrying amount of such assets may not be recoverable. Determination of recoverability is based on an estimate of undiscounted future cash flows resulting from the use of the asset and its eventual disposition. Measurement of an impairment loss for long-lived assets that management expects to hold and use is based on the fair value of the asset. If such assets are considered to be impaired, the impairment to be recognized is measured by the amount by which the carrying amount of the assets exceeds their fair value, which is typically calculated using discounted expected future cash flows. The Company did not recognize impairment charges in any of the periods presented.
AnnualR
eport

ARUBA NETWORKS, INC.NOTES TO CONSOLIDATED FINANCIAL STATEMENTS
Continued
71
Indefinite-lived intangible assets, such as in-process research and development intangibles, are intangible assets that are not subject to amortization and are tested for impairment annually, or more frequently if events or changes in circumstances indicate that the asset might be impaired. The impairment test consists of a comparison of the fair value of an indefinite-lived intangible asset with its carrying amount. If the carrying amount of an indefinite-lived intangible asset exceeds its fair value, an impairment loss shall be recognized in an amount equal to that excess. Once the research and development efforts are completed or abandoned, the Company shall determine the useful life of the assets and is required to perform an impairment test of the asset.
Goodwill
Goodwill represents the excess cost of a business acquisition over the fair value of the net assets acquired. The Company performs impairment testing on its goodwill at least annually, as of June 30th, and more frequently if indicators of impairment exist at the reporting unit level. The Company performs its impairment testing by first assessing qualitative factors to determine whether the existence of events or circumstances leads to a determination that it is more likely than not that the fair value of its reporting unit is less than its carrying amount. If, after assessing the totality of events or circumstances, the Company determines it is more likely than not that the fair value of a reporting unit is less than its carrying amount, the Company performs a two-step impairment test. The first step requires the identification of the reporting units and comparison of the fair value of a reporting unit with its carrying amount, including goodwill. If the fair value of the reporting unit is less than its carrying value, an indication of goodwill impairment exists for the reporting unit and the second step of the impairment test is performed to compute the amount of the impairment. Under the second step, an impairment loss is recognized for any excess of the carrying amount of the reporting unit’s goodwill over the implied fair value of that goodwill. The Company has determined that it has only one reporting unit. There have been no impairments to goodwill recorded in any of the periods presented.
Revenue Recognition
Total revenue is derived primarily from the sale of products and services, including professional services and support. The following revenue recognition policies define the manner in which the Company accounts for its sales transactions.
The Company recognizes revenue when all of the following have occurred: (1) the Company has entered into a legally binding arrangement with a customer; (2) delivery has occurred or the title and risk of loss has passed; (3) customer payment is deemed fixed or determinable and free of contingencies and significant uncertainties; and (4) collection is reasonably assured.
The Company’s fees are typically considered to be fixed or determinable at the inception of an arrangement, generally based on specific products and quantities to be delivered. Substantially all of the Company’s contracts do not include rights of return or acceptance provisions. To the extent that the Company’s agreements contain such terms, the Company recognizes revenue once the customer has accepted, or once the acceptance provisions or right of return lapses. Payment terms to customers generally range from net 30 to 90 days. In the event payment terms are provided that differ from the Company’s standard business practices, the fees are deemed to not be fixed or determinable and revenue is recognized when the payments are received, provided the remaining criteria for revenue recognition have been met.
The Company assesses the ability to collect from its customers based on a number of factors, including credit worthiness of the customer and past transaction history of the customer. If the customer is not deemed credit worthy, the Company defers revenue from the arrangement until payment is received and all other revenue recognition criteria have been met. The Company records estimated sales returns as a reduction to revenue upon shipment based on its contractual obligations and historical returns experience. In cases where the Company is aware of circumstances that will likely result in a specific customer’s request to return purchased equipment, the Company records a specific sales returns reserve.
The Company’s revenue recognition policies provide that, when a sales arrangement contains multiple elements, such as hardware and software products, licenses and/or services, the Company allocates revenue to each element based on a selling price hierarchy. The selling price for a deliverable is based on its vendor specific objective evidence (“VSOE”) of selling price if available, third party evidence (“TPE”) of selling price, if VSOE is not available, or best estimated selling price (“BESP”) if neither VSOE nor TPE is available. In multiple element arrangements where non-essential software deliverables are included, revenue for these multiple-element arrangements is allocated to the software deliverable and the non-software deliverables based on the relative selling prices of all of the deliverables in the arrangement using the hierarchy in the applicable accounting guidance. The Company limits the amount of revenue recognition for delivered elements to the amount that is not contingent on the future delivery of products or services, future performance obligations or subject to customer-specified return or refund privileges.

ARUBA NETWORKS, INC.NOTES TO CONSOLIDATED FINANCIAL STATEMENTS
Continued
72
The Company establishes VSOE of selling price using the price charged for a deliverable based upon the normal pricing and discounting practices when sold separately. VSOE for support services is measured by the stand-alone renewal rate offered to the customer. In determining VSOE, the Company requires that a substantial majority of the selling prices for an element falls within a reasonably narrow pricing range, generally evidenced by a substantial majority of such historical stand-alone transactions falling within a reasonably narrow range of the median rates. In addition, the Company considers major service groups, geographies, customer classifications, and other variables in determining VSOE.
TPE of selling price is established by evaluating largely similar and interchangeable competitor products or services in standalone sales to similarly situated customers. The Company is typically not able to determine TPE for the Company’s products or services. Generally, the Company’s go-to-market strategy differs from that of the Company’s peers and the Company’s offerings contain a significant level of differentiation such that the comparable pricing of products with similar functionality cannot be obtained. Furthermore, the Company is unable to reliably determine selling prices of competitor products and services on a stand-alone basis.
When the Company is unable to establish the selling price of its non-software elements using VSOE or TPE, the Company uses BESP in its allocation of arrangement consideration. The objective of BESP is to determine the price at which the Company would transact a sale if the product or service were sold on a stand-alone basis. The Company determines BESP for a product or service by considering multiple factors including, but not limited to, cost of products, gross margin objectives, pricing practices, geographies, customer classes and distribution channels.
The Company regularly reviews estimated selling price of the product offerings and maintains internal controls over the establishment and updates of these estimates. The Company currently does not expect a material impact in the near term from changes in estimated selling prices, including VSOE of selling price.
Products
Product revenue consists of revenue from sales of the Company’s hardware appliances and perpetual software licenses. The majority of the Company’s products are hardware appliances containing software components that function together to provide the essential functionality of the product. Therefore, the Company’s hardware appliances are considered non-software elements and are not subject to the industry-specific software revenue recognition guidance. For these appliances, delivery occurs upon transfer of title and risk of loss, which is generally upon shipment. It is the Company’s practice to ensure an end-user has been identified by the channel partner prior to shipment to a channel partner. For end-users and channel partners, the Company generally has no significant obligations for future performance such as rights of return or pricing credits.
For sales to direct end-users and certain channel partners, including value-added resellers (“VARs”), and original equipment manufacturers (“OEMs”), the Company recognizes product revenue upon delivery, assuming all other revenue recognition criteria are met. The Company also sells through value-added distributors (“VADs”). A significant portion of the Company’s sales are made through VADs under agreements allowing for stocking of the Company’s products in their inventory, pricing credits and limited rights of return for stock rotation. Product revenue on sales made through these VADs is initially deferred and revenue is recognized upon sell-through as reported by the VADs to the Company. The Company’s product revenue also includes revenue from the sale of stand-alone software products. Stand-alone software products may operate on the Company’s hardware appliance but are not considered essential to the functionality of the hardware. Sales of stand-alone software generally include a perpetual license to the Company’s software. For sales of stand-alone software, the Company recognizes revenue based on software revenue recognition guidance. Under the software revenue recognition guidance, the Company uses the residual method to recognize revenue when a product agreement includes one or more elements to be delivered at a future date and VSOE of the fair value of all undelivered elements exists. In the majority of the Company’s contracts, the only element that remains undelivered at the time of delivery of the product is support services. Under the residual method, the fair value of the undelivered elements is deferred and the remaining portion of the contract fee is recognized as product revenue. If evidence of the fair value of one or more undelivered elements does not exist, all revenue is generally deferred and recognized when delivery of those elements occurs or when fair value can be established. When only the undelivered element for which the Company does not have VSOE of selling price is support, revenue for the entire arrangement is bundled and recognized ratably over the support period.
Services
Service revenue consists of revenue from support agreements, professional services, and training. Support services include repair and replacement of defective hardware appliances, software updates and access to technical support personnel. Software updates provide customers with rights to unspecified software product upgrades and to maintenance releases and patches released during the term of the support period. Revenue for support services is recognized on a straight-line basis over
AnnualR
eport

ARUBA NETWORKS, INC.NOTES TO CONSOLIDATED FINANCIAL STATEMENTS
Continued
73
the service contract term, which is typically one to five years. Revenue for professional services is recognized upon delivery or completion of performance. Professional service arrangements are typically short-term in nature and are largely completed within 90 days from the start of service. Revenue for training services is recognized upon delivery of the training. Costs associated with these service offerings are expensed as incurred.
Post-contractual services (“PCS”) that the Company provides to its channel partners differ from PCS that it provides to its end customers in that the Company is only obligated to provide support services to the channel partner directly, while the channel partner is obligated to provide support services directly to the end customer. The channel partner is obligated to provide to the end customer first level troubleshooting assistance as well as second level support for high-level technical and product diagnosis which might include returned merchandise fulfillment. The Company’s obligations are only to provide software upgrades and, in the unusual scenario in which the channel partner is unable to provide the technical support that the end customer requires, a third level technical diagnosis and support.
Services revenue also includes certain revenue arrangements prior to the second quarter of fiscal 2006 and those acquired through business combinations where the Company was not able to establish VSOE on prior services and support offerings are recognized ratably over the support period. As discussed above under Reclassifications, ratable product and related professional services and support revenue and the related cost of revenue in fiscal 2012 and 2011 have been reclassified to professional services and support revenue and related cost of revenue.
Shipping and Handling
Shipping charges billed to customers are included in product revenue and the related shipping costs are included in cost of product revenue.
Research and Development Expenses
Research and development costs, primarily consisting of salaries and employee benefits, including stock-based compensation costs, as well as, administrative costs, other than capitalized software development costs, are charged to operations as incurred.
Stock-Based Compensation
The Company measures and recognizes compensation expense for all stock-based awards made to employees and non-employees under the fair value method. The Company’s stock-based awards include stock options, restricted stock units and awards, employee stock purchase plan, and performance-based awards. The Company calculates the fair value of restricted stock and performance-based awards which are paid in restricted stock, based on the fair market value of its common stock on the date of grant. The Company calculates the fair value of stock options and employee stock purchase plan shares on the date of grant using the Black-Scholes option-pricing model. This methodology requires the use of subjective assumptions such as expected stock price volatility over the term of the awards, actual and projected employee stock option exercise behaviors, risk-free interest rates and expected dividends. This fair value is then amortized on a straight-line basis over the requisite service periods of the awards, which is generally the vesting period. The Company determines the amount of stock-based compensation expense based on awards that it ultimately expects to vest, reduced for estimated forfeitures. In addition, compensation expense includes the effects of awards modified, repurchased or cancelled.
Income Taxes
The Company estimates its income taxes based on the various jurisdictions where it conducts business. Significant judgment is required in determining its worldwide income tax provision. Deferred income taxes are recorded for the expected tax consequences of temporary differences between the tax bases of assets and liabilities for financial reporting purposes and amounts recognized for income tax purposes. The Company records a valuation allowance to reduce its deferred tax assets to the amount of future tax benefit that is more likely than not to be realized.
Foreign earnings that are considered to be permanently reinvested outside of the United States are excluded from U.S. tax provision.
A two-step approach is applied for the recognition and measurement of uncertain tax positions taken or expected to be taken in a tax return. The first step is to determine if the weight of available evidence indicates that it is more likely than not that the tax position will be sustained in an audit, including resolution of any related appeals or litigation processes. The second step is to measure the tax benefit as the largest amount that is more than 50% likely to be realized upon ultimate settlement. The

ARUBA NETWORKS, INC.NOTES TO CONSOLIDATED FINANCIAL STATEMENTS
Continued
74
Company recognizes interest and penalties related to uncertain tax positions in our provision for income taxes line of our Consolidated Statements of Operations and Comprehensive Income (Loss).
In computing the tax benefit of stock-based compensation, the Company uses the direct method and the with-and-without method for utilization of tax attributes.
Comprehensive Income (Loss)
Comprehensive income (loss) consists of other comprehensive income (loss) and net income (loss). Other comprehensive income (loss) refers to revenue, expenses, gains and losses that under generally accepted accounting principles are recorded as an element of stockholders’ equity but are excluded from net income (loss). Other comprehensive income (loss) consists of foreign currency translation adjustments and unrealized investment gains and losses from available-for-sale securities, net of tax.
Recent Accounting Pronouncements
In July 2012, the Financial Accounting Standards Board ("FASB") issued revised guidance on how an entity tests indefinite-lived intangible assets for impairment. Under the new guidance, an entity is no longer required to calculate the fair value of the indefinite-lived intangible assets and perform the quantitative impairment test unless the entity determines, based on a qualitative assessment, that it is more likely than not that the fair value of an indefinite-lived intangible asset is less than its carrying amount. This revised guidance is effective for the Company beginning August 1, 2013. The adoption of this guidance is not expected to have a material impact on the Company’s consolidated financial statements.
In February 2013, the FASB issued guidance on disclosure requirements for items reclassified out of Accumulated Other Comprehensive Income (“AOCI”.) This new guidance requires entities to present (either on the face of the income statement or in the notes) the effects on the line items of the income statement for amounts reclassified out of AOCI. The new guidance will be effective for the Company beginning August 1, 2013. The adoption of this guidance is not expected to have a material impact on the Company’s consolidated financial statements other than requiring additional disclosures.
In March 2013, the FASB issued guidance that resolves the diversity in practice regarding the release into net income of the cumulative translation adjustment (“CTA”) upon derecognition of a subsidiary or group of assets within a foreign entity. Under this guidance, the entire amount of the CTA associated with the foreign entity would be released when there has been a sale of a subsidiary or group of net assets within a foreign entity and the sale represents the substantially complete liquidation of the investment in the foreign entity and loss of a controlling financial interest in an investment in a foreign entity. The guidance will be effective for the Company beginning August 1, 2014. Early adoption is permitted. The adoption of this guidance is not expected to have a material impact on the Company's consolidated financial statements.
In June 2013, the FASB issued guidance on the financial statement presentation of an unrecognized tax benefit when a net operating loss carryforward, a similar tax loss, or a tax credit carryforward exists, with the purpose of reducing diversity in practice. This new standard requires the netting of unrecognized tax benefits ("UTBs") against a deferred tax asset for a loss or other carryforward that would apply in settlement of the uncertain tax positions. ASU 2013-11 is required for our fiscal year beginning August 1, 2014. Early adoption is permitted. The Company is evaluating whether to adopt ASU 2013-11 for our fiscal year beginning August 1, 2013. The Company expects that the impact of ASU 2013-11 will be to reduce its long-term tax liability for UTBs and reduce its deferred tax assets and/or increase its additional paid-in capital shown in the consolidated balance sheets.
2. Business Combinations
Meridian Apps
On May 13, 2013, the Company acquired Meridian Apps, Inc. (“Meridian”), a privately-held mobile-software company providing software for visitor engagement through indoor way-finding and targeted location-based messaging. As a result of the acquisition, Meridian became a wholly owned subsidiary of the Company. The purchase price was $16.8 million, all of which was paid in cash. In addition, the Company is obligated to pay additional cash compensation of up to $10.2 million to certain former Meridian employees who became the Company's employees, which will be made over a period of approximately three years from the closing date, subject to certain continued employment restrictions. For the year ended July 31, 2013, the Company recorded compensation costs of $0.8 million in general and administrative expenses associated with this additional cash compensation.
AnnualR
eport

ARUBA NETWORKS, INC.NOTES TO CONSOLIDATED FINANCIAL STATEMENTS
Continued
75
As a result of this acquisition, the Company expects to offer new indoor location-based services by combining its unique, network-based contextual information about users, devices and applications with Meridian's Wi-Fi based visitor engagement solution for smart phones and tablets.
In connection with this acquisition, the Company retained the services of a third-party firm to complete a valuation of the assets acquired in order to allocate the purchase price consideration. The total purchase price consideration was allocated to the net tangible and identified intangible assets based upon the fair values as of May 13, 2013, as determined by management with assistance of the external third-party valuation firm. The excess purchase price over the value of the net tangible and identifiable intangible assets was recorded as goodwill, which is not expected to be deductible for income tax purposes. There are a number of factors contributing to the amount of goodwill, including Meridian workforce and the expectation that the acquisition of Meridian will create synergies, which will provide future value to the Company.
The purchase price consideration in the transaction was allocated as follows (in thousands, except years):
Cash and cash equivalents $ 10Accounts receivable and other assets acquired 281
Total tangible assets acquired 291Estimated
Useful Lives
Identifiable intangible assets:Existing technology 5,000 3 yearsPatent 2,000 11 yearsCustomer contracts 300 4 yearsTrade name and trademarks 400 4 years
Goodwill 10,295Total assets acquired 18,286
Liabilities assumed (180)Deferred tax liability (1,329)
Total purchase price consideration $ 16,777
In the year ended July 31, 2013, the Company expensed $0.1 million of acquisition-related costs incurred as general and administrative expenses in the Consolidated Statements of Operations and Comprehensive Income (Loss).
Avenda Systems
On November 30, 2011, the Company acquired Avenda Systems (“Avenda”), a leading developer of network security solutions. The results of Avenda’s operations have been included in the Consolidated Financial Statements since the acquisition date. The tangible and intangible assets acquired and liabilities assumed were recorded at fair value on the acquisition date.
The purchase price consideration in the transaction consisted of cash and stock as follows (in thousands, except share and per share data):
Cash $ 23,475Stock (526,996 shares at $22.77 per share) 12,000Total purchase price consideration $ 35,475
In addition, the Company agreed to incremental cash payments of up to approximately $6.0 million to Avenda’s former employees who became the Company’s employees, which will be made over a period of up to two years from the closing date, subject to certain continued employment restrictions. Approximately $3.0 million of the incremental payments was paid immediately after the acquisition date and was included in the purchase price allocation. The remaining balance of approximately $3.0 million was excluded from the purchase price allocation and is being recorded as compensation expense over the service period through November 2013.
The purchase price was allocated to the assets acquired and liabilities assumed based on management's estimates of their fair values on the acquisition date. The excess of the purchase consideration over the fair value of the net assets acquired was

ARUBA NETWORKS, INC.NOTES TO CONSOLIDATED FINANCIAL STATEMENTS
Continued
76
allocated to goodwill. In part, goodwill reflected the benefits the Company expected to realize from the enhancement of Avenda's solutions to its MOVE architecture, making it simpler and more secure for enterprises to transition to mobile computing and cloud-based applications.
The purchase price consideration in the transaction was allocated as follows (in thousands):
Cash and cash equivalents $ 2,389Other assets 275
Total tangible assets acquired 2,664
Estimated
Useful Lives
Amortizable intangible assets:Existing technology 12,800 4 to 7 yearsCustomer contracts 300 5 years
Goodwill 23,604Total assets acquired 39,368
Liabilities assumed (1,784)Deferred tax liability (2,109)
Total purchase price consideration $ 35,475
The Company expensed $0.1 million of acquisition-related costs incurred as general and administrative expenses in the Consolidated Statements of Operations and Comprehensive Income (Loss) in the year ended July 31, 2012.
Other Acquisition
On May 23, 2012, the Company acquired a software development company to accelerate the Company’s ClearPass portfolio. Pursuant to the terms of the purchase agreement, the total purchase price was approximately $1.4 million in cash, of which $0.3 million was placed in escrow to secure the Company’s indemnification rights under the Agreement.
The purchase price consideration in the transaction was allocated as follows (in thousands, except years):
EstimatedUseful Lives
Amortizable intangible assets:Non-compete agreement $ 100 4 years
In-process research and development 1,200Goodwill 200
Total assets acquired 1,500Liabilities assumed (81)
Total purchase price consideration $ 1,419
A portion of the purchase price was allocated to in-process research and development (“IPR&D”). The in-process technology represents software that will accelerate the Company’s ClearPass portfolio. The IPR&D was identified and valued through an analysis of data provided by the wireless technology company concerning existing technologies, in-process technologies and future technologies. . In addition, the Company agreed to an incremental cash payment and stock awards totaling approximately $4.0 million, subject to certain vesting conditions and continued employment restrictions. The incremental cash payment and stock awards are being recorded as compensation expense over the service period through November 2013.
Azalea Networks
On September 2, 2010, the Company completed its acquisition of Azalea Networks (“Azalea”) for a total purchase price of $42.0 million. Azalea is a leading supplier of outdoor mesh networks and includes an operations center in Beijing, China which complemented the Company’s existing research and development centers.
AnnualR
eport

ARUBA NETWORKS, INC.NOTES TO CONSOLIDATED FINANCIAL STATEMENTS
Continued
77
As part of the purchase consideration for each share of the Company received by the Azalea shareholders, each Azalea shareholder also received a right ("Contingent Rights") to receive an amount of cash equal to the shortfall generated if a share was sold below the target value within the payment period, as specified in the arrangement. For shares not held in escrow, the payment period began August 1, 2011 and ended on December 31, 2011. The Contingent Rights related to these shares were settled in cash of $1.9 million in January 2012. For shares held in escrow, the payment period began on the later of January 2, 2012 or the date such shares are released from escrow to the Azalea shareholders, if at all, and ending on the earlier of thirty calendar days following such release date or December 31, 2012. The rights related to the escrow shares are subject to forfeiture in certain circumstances.
For shares held in escrow, the Company made claims against all of the escrow shares prior to the claim period expiration, which was April 1, 2012. Currently the escrow shares remain in escrow pending the resolution of the Company’s claims.
During the year ended July 31, 2013, the Company released the contingent rights liability as a result of the payment period expiring on December 31, 2012, resulting in a $1.3 million gain recorded in other income, net. For the year ended July 31, 2013, the Company recorded other income, net, of $1.7 million consisting of a $0.4 million gain from revaluation of the contingent rights liability and a $1.3 million gain relating to the expiration of the payment period for the Contingent Rights. For the year ended July 31, 2012, the Company recorded other income, net of $2.3 million as a result of the revaluation of the contingent rights liability.
The results of Azalea’s operations have been included in the Consolidated Financial Statements since the acquisition date. The tangible and intangible assets acquired and liabilities assumed were recorded at fair value on the acquisition date.
The purchase price consideration in the transaction consisted of stock, cash, contingent rights and advance on purchase price as follows (in thousands, except share and per share data):
Stock (1,524,517 shares at $18.82 per share) $ 28,691Cash 1,808Contingent rights 9,486Advance on purchase price 2,000
Total purchase price consideration $ 41,985
The purchase price consideration in the transaction was allocated as follows (in thousands, except years):
Cash and cash equivalents $ 550Accounts receivable 2,525Inventory 1,794Prepaids and other assets 331Property and equipment 265
Total tangible assets acquired $ 5,465

ARUBA NETWORKS, INC.NOTES TO CONSOLIDATED FINANCIAL STATEMENTS
Continued
78
EstimatedUseful Lives
Amortizable intangible assets:Existing technology $ 11,800 5 yearsPatents/core technology 2,300 6 yearsCustomer contracts 1,800 6 yearsTradenames/trademarks 100 1 yearNon-compete agreements 100 2 years
In-process research and development 900Goodwill 24,842
Total assets acquired 47,307Liabilities (5,322)
Total liabilities assumed (5,322)Total purchase price consideration $ 41,985
A portion of the purchase price was allocated to developed product technology and in-process research and development (“IPR&D”). They were identified and valued through an analysis of data provided by Azalea concerning developmental products, their stage of development, the time and resources needed to complete them, target markets, their expected income generating ability and associated risks. The Income Approach, which is based on the premise that the value of an asset is the present value of its future earning capacity, was the primary valuation technique employed. A discount rate of 16% was applied to developed product technology and IPR&D. The Company recognizes IPR&D at fair value as of the acquisition date, and subsequently accounts for it as an indefinite-lived intangible asset until completion or abandonment of the associated research and development efforts. IPR&D is tested annually for impairment unless a triggering event indicates a possible impairment.
Developed product technology, which includes products that are already technologically feasible, is primarily comprised of a portfolio of outdoor mesh routers. Developmental projects that had not reached technological feasibility are recognized as identifiable intangible assets. The principal project at the acquisition date relates to developing multi-radio outdoor mesh routers for the core network for even the largest enterprises. This technology would enable faster internet access for higher throughput performance, covering greater distances for both mesh and video networks. The Company substantially completed the work by the end of fiscal 2012.
The Company expensed $0.7 million of acquisition-related costs incurred as general and administrative expenses in the Consolidated Statements of Operations and Comprehensive Income (Loss) in the year ended July 31, 2011.
Amigopod
On November 19, 2010, the Company entered into an agreement with Amigopod, pursuant to which Aruba acquired substantially all of the assets of Amigopod. The acquisition was completed on December 3, 2010. The total consideration was $3.0 million and resulted in additional goodwill of $0.6 million.
3. Goodwill and Intangible Assets
The following table presents details of the Company’s goodwill:
Amount (in thousands)As of July 31, 2011 $ 33,143Goodwill acquired in acquisitions 23,804As of July 31, 2012 $ 56,947Goodwill acquired in acquisition of Meridian 10,295As of July 31, 2013 $ 67,242
AnnualR
eport

ARUBA NETWORKS, INC.NOTES TO CONSOLIDATED FINANCIAL STATEMENTS
Continued
79
The following table presents details of the Company’s intangible assets:
EstimatedUseful Lives
GrossValue
AccumulatedAmortization
NetValue
(in thousands, except estimated useful lives)As of July 31, 2013Existing technology 3 to 7 years $ 41,383 $ (21,269) $ 20,114Patents/core technology 4 to 11 years 9,046 (4,784) 4,262Customer contracts 4 to 7 years 7,533 (5,537) 1,996Support agreements 5 to 6 years 2,917 (2,805) 112Trade names/trademarks 1 to 5 years 1,150 (767) 383Non-compete agreements 2 to 4 years 912 (842) 70
Total $ 62,941 $ (36,004) $ 26,937
Estimated
Useful LivesGross Value
Accumulated Amortization
Net Value
(in thousands, except estimated useful lives)As of July 31, 2012Existing technology 2 to 7 years $ 35,183 $ (15,931) $ 19,252Patents/core technology 4 to 6 years 6,806 (4,041) 2,765Customer contracts 6 to 7 years 7,233 (4,321) 2,912Support agreements 5 to 6 years 2,917 (2,425) 492Trade names/trademarks 1 to 5 years 750 (673) 77Non-compete agreements 2 years 912 (814) 98
Sub-total $ 53,801 $ (28,205) $ 25,596In-process research and development 1,440 — 1,440
Total $ 55,241 $ (28,205) $ 27,036
In-Process research and development is accounted for as an indefinite-lived intangible asset until completion or abandonment of the associated research and development efforts. During fiscal 2013, the Company completed the development projects and transferred $1.4 million in-process research and development costs to the existing technology category. The Company did not have outstanding in-process research and development as of July 31, 2013.
Amortization expense is recorded in the Consolidated Statements of Operations and Comprehensive Income (Loss) under the following:
Years ended July 31, 2013 2012 2011 (in thousands)
Cost of product revenues $ 6,080 $ 5,875 $ 5,852Cost of professional services and support revenues 284 540 540Sales and marketing 1,410 1,812 1,432Research & development 25 — —
Total amortization expense $ 7,799 $ 8,227 $ 7,824

ARUBA NETWORKS, INC.NOTES TO CONSOLIDATED FINANCIAL STATEMENTS
Continued
80
The following table presents the estimated future amortization expense of intangible assets as of July 31, 2013:
Amount (in thousands)
Years ending July 31,2014 $ 9,2372015 8,4852016 4,6462017 1,8352018 1,307Thereafter 1,427
Total $ 26,937
4. Net Income (Loss) Per Common Share
Basic net income (loss) per common share is calculated by dividing net income (loss) by the weighted average number of common shares outstanding during the period. Diluted net income (loss) per common share is calculated by giving effect to all potentially dilutive common shares, including stock options and awards, unless the result is anti-dilutive. The following tables set forth the computation of net income (loss) per share:
Years ended July 31, 2013 2012 2011
(in thousands, except per share data)
Net income (loss) $ (31,608) $ (8,851) $ 70,688Weighted-average common shares outstanding, basic 113,284 108,774 100,299Dilutive effect of potential common shares — — 16,818Weighted-average common shares outstanding, diluted 113,284 108,774 117,117Net income (loss) per share, basic $ (0.28) $ (0.08) $ 0.70Net income (loss) per share, diluted $ (0.28) $ (0.08) $ 0.60
The following outstanding stock options and awards were excluded from the computation of diluted net income (loss) per common share for the periods presented because including them would have had an anti-dilutive effect.
Years ended July 31, 2013 2012 2011 (in thousands)
Options to purchase common stock 10,048 13,264 1,279Restricted stock awards 10,788 8,423 227Contingently issuable shares 680 591 —Employee stock purchase plan 180 — —
AnnualR
eport

ARUBA NETWORKS, INC.NOTES TO CONSOLIDATED FINANCIAL STATEMENTS
Continued
81
5. Short-Term Investments
Short-term investments consist of the following:
Cost Basis
GrossUnrealized
Gains
GrossUnrealized
Losses Fair Value (in thousands)As of July 31, 2013Corporate bonds $ 79,493 $ 29 $ (97) $ 79,425U.S. government agency securities 133,794 43 (11) 133,826U.S. treasury bills 36,317 39 — 36,356Commercial paper 13,672 3 — 13,675Certificates of deposit 5,000 10 — 5,010Municipal notes and bonds 1,590 — — 1,590
Total short-term investments $ 269,866 $ 124 $ (108) $ 269,882
Cost Basis
GrossUnrealized
Gains
GrossUnrealized
Losses Fair Value (in thousands)As of July 31, 2012Corporate bonds $ 47,011 $ 118 $ (1) $ 47,128U.S. government agency securities 105,358 79 (8) 105,429U.S. treasury bills 43,896 34 — 43,930Commercial paper 7,280 2 — 7,282Certificates of deposit 8,805 27 — 8,832
Total short-term investments $ 212,350 $ 260 $ (9) $ 212,601
The cost basis and fair value of the short-term investments by contractual maturity are presented below:
CostBasis
FairValue
(in thousands)As of July 31, 2013One year or less $ 165,614 $ 165,682Over one year and less than two years 104,252 104,200
Total short-term investments $ 269,866 $ 269,882
CostBasis
FairValue
(in thousands)As of July 31, 2012One year or less $ 102,675 $ 102,794Over one year and less than two years 109,675 109,807
Total short-term investments $ 212,350 $ 212,601
The Company reviews the individual securities in its portfolio to determine whether a decline in a security’s fair value below the amortized cost basis is other-than-temporary. The Company determined that as of July 31, 2013 and 2012 there were no investments in its portfolio that were other-than-temporarily impaired.

ARUBA NETWORKS, INC.NOTES TO CONSOLIDATED FINANCIAL STATEMENTS
Continued
82
The following table summarizes the fair value and gross unrealized losses of the Company’s investments with unrealized losses aggregated by type of investment instrument and the length of time that individual securities have been in a continuous unrealized loss position:
Less than 12 Months
Fair
ValueUnrealized
Loss (in thousands)As of July 31, 2013Corporate bonds $ 51,850 $ (97)U.S. government agency securities 26,611 (11)
$ 78,461 $ (108)
Less than 12 Months
Fair
ValueUnrealized
Loss (in thousands)As of July 31, 2012Corporate bonds $ 3,922 $ (1)U.S. government agency securities 44,026 (8)
$ 47,948 $ (9)
As of July 31, 2013 and 2012, no securities were in a continuous unrealized loss position for more than twelve months.
6. Fair Value of Financial Instruments
Fair value is defined as the price that would be received upon the sale of an asset or paid to transfer a liability between market participants at the measurement date. When determining the fair value measurements for assets and liabilities required or permitted to be either recorded or disclosed at fair value, the Company considers the principal or most advantageous market in which it would transact, and it also considers assumptions that market participants would use when pricing the asset or liability.
The Company determines the fair values of its financial instruments based on a three-level fair value hierarchy, which requires an entity to maximize the use of observable inputs and minimize the use of unobservable inputs when measuring fair value. The classification of a financial asset or liability within the hierarchy is based upon the lowest level input that is significant to the fair value measurement. The fair value hierarchy prioritizes the inputs into three levels that may be used to measure fair value:
Level 1 — Quoted prices in active markets for identical assets or liabilities.
Level 2 — Inputs other than Level 1 that are observable, either directly or indirectly, such as quoted prices for similar assets and liabilities in active markets or inputs that are observable for the asset or liability, either directly or indirectly through market corroboration, for substantially the full term of the financial instrument.
Level 3 — Unobservable inputs that are supported by little or no market activity and are significant to the fair value of the assets or liabilities. Such unobservable inputs include an estimated discount rate used in the Company's discounted present value analysis of future cash flows, which reflects the Company's estimate of debt with similar terms in the current credit markets. As there is currently minimal activity in such markets, the actual rate could be materially different.
Level 1 instruments are valued based on quoted market prices in active markets for identical instruments. Level 1 instruments consist primarily of bank deposits with third-party financial institutions and highly liquid money market securities with original maturities at date of purchase of 90 days or less and are stated at cost, which approximates fair value.
Level 2 securities are valued using quoted market prices for similar instruments, non-binding market prices that are corroborated by observable market data, or discounted cash flow techniques and include the Company’s investments in certain corporate bonds, U.S. government agency securities, U.S. treasury bills, commercial paper, municipal notes and bonds.
Level 3 instruments are valued based on unobservable inputs that are supported by little or no market activity and reflect the Company's own assumptions in measuring fair value. The Company classified its contingent rights liability as a Level 3
AnnualR
eport

ARUBA NETWORKS, INC.NOTES TO CONSOLIDATED FINANCIAL STATEMENTS
Continued
83
liability (see Note 2 - Business Combinations). This liability was estimated using a lattice model and was based on significant inputs not observable in the market and thus represented a Level 3 instrument. The inputs include stock price as of the valuation date, strike price of the contingent right, maximum payoff per share, number of shares held in escrow, exercise period, historical volatility of the Company's stock price based on weekly stock price returns, and risk-free interest rate interpolated from the Constant Maturity Treasury Rate.
Short-term investments are recorded at fair value, defined as the exit price in the principal market in which the Company would transact representing the amount that would be received to sell an asset or paid to transfer a liability in an orderly transaction between market participants.
The change in fair value from the acquisition date of Azalea on September 2, 2010 to December 31, 2012 (expiration date of payment period) was primarily driven by changes in the Company’s common stock price, the approaching settlement date and the claim activities that have taken place. Gains and losses on the re-measurement of the contingent rights liability are included in other income, net.
There were no transfers between levels during the years ended July 31, 2013 and 2012.
The fair value measurements of the Company’s cash, cash equivalents and short-term investments consisted of the following:
Level 1 Level 2 Level 3 Total (in thousands)
As of July 31, 2013Assets
Cash and cash equivalents:Cash deposits with third-party financial institutions $ 129,290 $ — $ — $ 129,290Money market funds 8,612 — — 8,612U.S. government agency securities 3,017 — — 3,017Commercial paper 4,000 — — 4,000
Short-term investments:Certificates of deposit 5,010 — — 5,010Corporate bonds — 79,424 — 79,424U.S. government agency securities — 133,827 — 133,827U.S. treasury bills — 36,355 — 36,355Commercial paper — 13,676 — 13,676Municipal notes and bonds — 1,590 — 1,590
Total assets measured and recorded at fair value $ 149,929 $ 264,872 $ — $ 414,801

ARUBA NETWORKS, INC.NOTES TO CONSOLIDATED FINANCIAL STATEMENTS
Continued
84
Level 1 Level 2 Level 3 Total (in thousands)
As of July 31, 2012Assets
Cash and cash equivalents:Cash deposits with third-party financial institutions $ 129,786 $ — $ — $ 129,786Money market funds 3,843 — — 3,843
Short-term investments:Certificates of deposit 8,832 — — 8,832Corporate bonds — 47,128 — 47,128U.S. government agency securities — 105,429 — 105,429U.S. treasury bills — 43,930 — 43,930Commercial paper — 7,282 — 7,282
Total assets measured and recorded at fair value $ 142,461 $ 203,769 $ — $ 346,230Liabilities
Contingent rights liability related to the Azaleaacquisition $ — $ — $ 1,665 $ 1,665
Total liabilities measured and recorded at fairvalue $ — $ — $ 1,665 $ 1,665
The following table represents the change in the contingent rights liability related to the Azalea acquisition (see Note 2 - Business Combinations):
Level 3 Amount (in thousands)As of July 31, 2011 $ 5,888Changes in fair value (2,318)Cash payments made (1,905)As of July 31, 2012 $ 1,665Changes in fair value (401)Release of liability upon expiration of the rights (1,264)As of July 31, 2013 $ —
The change in fair value from the acquisition date was primarily driven by changes in the Company's stock price, the settlement date, and the claim activities that have taken place. During the three months ended January 31, 2013, the Company released the contingent rights liability as a result of the payment period expiring on December 31, 2012, resulting in a $1.3 million gain recorded in other income, net. For the year ended July 31, 2013, the Company recorded other income, net, of $1.7 million consisting of a $0.4 million gain from revaluation of the contingent rights liability and a $1.3 million gain relating to the expiration of the payment period for the Contingent Rights. For the years ended July 31, 2013 and 2012, the Company recorded other income of $0.4 million and $2.3 million due to the revaluation of the contingent liability.
Other Investments
During the year ended July 31, 2013, the Company invested $0.3 million and $1.5 million in the form of a convertible security in two privately-held companies. These investments are recorded at cost and are adjusted to fair value only in the event that they become other-than-temporarily impaired.
AnnualR
eport

ARUBA NETWORKS, INC.NOTES TO CONSOLIDATED FINANCIAL STATEMENTS
Continued
85
7. Balance Sheet Components
The following tables provide details of selected balance sheet items:
July 31,2013
July 31,2012
(in thousands)
Inventory, netRaw materials $ 288 $ 269Finished goods 28,607 21,933
Total $ 28,895 $ 22,202
July 31,
2013July 31,
2012 (in thousands)
Accrued LiabilitiesCompensation and benefits $ 25,214 $ 20,054Marketing 41,014 15,191Litigation reserves 14,125 —Contingent rights — 1,665Other 14,279 15,465
Total $ 94,632 $ 52,375
8. Property and Equipment, net
Property and equipment, net consists of the following:
EstimatedUseful Lives
July 31,2013
July 31,2012
(in thousands, except estimated useful lives)
Computer equipment 2 to 3 years $ 23,109 $ 16,893Computer software 2 to 5 years 13,525 7,560Machinery and equipment 2 years 29,009 19,965Furniture and fixtures 5 years 4,304 3,952Leasehold improvements 1 to 6 years 5,892 4,847
Total property and equipment, gross 75,839 53,217Less: accumulated depreciation and amortization (48,303) (33,316)
Total property and equipment, net $ 27,536 $ 19,901
Depreciation and amortization expense for property and equipment, net was $15.9 million, $10.9 million, and $7.2 million for the fiscal years ended July 31, 2013, 2012, and 2011, respectively.

ARUBA NETWORKS, INC.NOTES TO CONSOLIDATED FINANCIAL STATEMENTS
Continued
86
9. Deferred Revenue
Deferred revenue consists of the following:
July 31,2013
July 31,2012
(in thousands)
Product $ 38,974 $ 28,215Professional services and support 70,791 52,387
Total deferred revenue, current 109,765 80,602Professional services and support, non-current 31,578 22,375
Total deferred revenue, non-current 31,578 22,375Total deferred revenue $ 141,343 $ 102,977
Deferred product revenue relates to arrangements where not all revenue recognition criteria have been met. Deferred professional services and support revenue primarily represents customer payments made in advance for support contracts. Support contracts are typically billed on an annual basis in advance and revenue is recognized ratably over the support period, typically one to five years. Deferred professional services and support revenue also consists of certain revenue arrangements entered prior to the second quarter of fiscal 2006, and certain legacy Azalea transactions shipped prior to the acquisition, where the Company was not able to establish VSOE on prior services and support offerings and had to recognize revenue ratably over the support period.
10. Income Taxes
Income (loss) before income tax provision consists of the following:
Years ended July 31, 2013 2012 2011 (in thousands)
Domestic $ (9,807) $ 54,116 $ 25International (418) (40,556) (972)
Income (loss) before provision for income taxes $ (10,225) $ 13,560 $ (947)
The provision for (benefit from) income taxes consisted of the following:
Years ended July 31, 2013 2012 2011 (in thousands)CurrentFederal $ 16,534 $ 2,499 $ (126)State 1,876 3,670 99Foreign 3,210 2,688 1,241
Total current provision for income taxes 21,620 8,857 1,214DeferredFederal (4,087) 17,508 (59,614)State 2,788 (3,563) (12,428)Foreign 1,062 (391) (807)
Total deferred provision for income taxes (237) 13,554 (72,849)Total provision for (benefit from) income taxes $ 21,383 $ 22,411 $ (71,635)
AnnualR
eport

ARUBA NETWORKS, INC.NOTES TO CONSOLIDATED FINANCIAL STATEMENTS
Continued
87
The differences between the provision for income taxes computed at the federal statutory rate and the provision for income taxes are as follows:
Years ended July 31, 2013 2012 2011
Federal statutory rate (35.0)% 35.0 % (35.0)%State taxes (benefit), net of federal benefit 14.0 % 3.4 % (3.3)%Non-deductible meals and entertainment 2.0 % 1.9 % 25.0 %Change in state effective rate (3.9)% (2.9)% (63.7)%IP structure charges, net of tax capitalized — % 75.9 % — %Amortization of deferred tax charge on IP restructuring 74.8 % 55.2 % — %Foreign income at other than U.S. rate 56.0 % (3.0)% 58.3 %Non-deductible stock-based compensation 104.8 % 33.6 % 448.5 %Non-deductible acquisition-related expenses 2.7 % 0.2 % 16.3 %Research and developments credits (53.5)% (33.0)% (900.1)%Change in valuation allowance 47.2 % (1.0)% (7,110.4)%
Effective tax rate 209.1 % 165.3 % (7,564.4)%
During the quarter ending January 31, 2013, Congress extended the U.S. research and development credit retroactively to January 1, 2012. The tax provision for fiscal 2013 includes a tax benefit for this credit of approximately $1.9 million relating to fiscal 2012.
IP structure charges consist primarily of non-recurring items of gain recognized in the United States related to the international restructuring of the Company's corporate organization during fiscal 2012, including the transfer of certain intellectual property and inventory overseas. The “Amortization of deferred tax charge on IP restructuring” consists of taxes paid that result from intra-entity transfers and that are deferred, and amortized for financial reporting purposes under Accounting Standards Codification (“ASC”) 740-10-25-3(e) (Income Taxes) and ASC 810-10-45-8 (Consolidation). For fiscal 2013 and fiscal 2012, the corporate reorganization resulted in an increase to the effective tax rate due to the non-recurring items of gain triggered in the United States related to the reorganization as described above. While the Company has yet to realize any tax savings to date, the Company expects to realize a reduction in the effective tax rate as a result of the corporate reorganization after the deferred charges have been fully amortized.
Excess tax benefits associated with stock-based compensation deductions are credited to stockholders' equity. The reduction of income taxes payable resulting from stock-based compensation deductions that were credited to stockholders' equity were approximately $9.9 million for the twelve months ended July 31, 2013, $21.6 million for the twelve months ended July 31, 2012, and zero for the twelve months ended July 31, 2011. Related amounts shown in the Consolidated Statements of Stockholders' Equity include the tax effect of any adjustments in the Company's deferred tax asset for stock based compensation when the tax benefit realized is less than the deferred tax asset.

ARUBA NETWORKS, INC.NOTES TO CONSOLIDATED FINANCIAL STATEMENTS
Continued
88
Deferred income taxes reflect the net tax effects of temporary differences between the carrying amounts of assets and liabilities for financial reporting purposes and the amounts for income tax purposes. Significant components of the Company's deferred tax assets and liabilities were as follows:
As of July 31, 2013 2012 (in thousands)Deferred tax assetsCurrentNet operating loss carryforwards $ 1,187 $ 5,557Capital loss carryforwards — 69Research and development credits 615 —Stock-based compensation 10,271 14,213Accruals and reserves 17,131 14,832
Total deferred tax assets, current 29,204 34,671Valuation allowance (128) (87)
Net deferred tax assets, current 29,076 34,584Non-currentNet operating loss carryforwards 2,848 1,572Research and development credits 12,378 11,120Depreciation and amortization — 11,116Stock-based compensation 9,423 —Accruals and reserves 3,030 —
Total deferred tax assets 27,679 23,808Valuation allowance (4,599) —Net deferred tax assets, non-current 23,080 23,808Net deferred tax assets 52,156 58,392
Deferred tax liabilitiesNon-currentDepreciation and amortization (3,292) (3,136)Book tax basis in acquired assets — (8)
Total deferred tax liabilities (3,292) (3,144)Net deferred tax asset $ 48,864 $ 55,248
As of July 31, 2013, the valuation allowance relates to the benefits of California tax research credit carryforwards that the Company believes are not more likely than not to be realized. During the year ending July 31, 2013, the valuation allowance for state tax research credit carryforwards increased by $4.7 million, of which $1.9 million relate to credits earned during the year ending July 31, 2013 and $2.8 million relate to credit carryforwards as of July 31, 2012. It is reasonably possible that a material increase in the valuation allowance could occur within one year depending on changes, if any, in the mix of earnings in the jurisdictions in which the Company operates, the percentage of revenue from California customers, the Company's evaluation of prudent and feasible tax planning strategies, the Company's expectation of exercising elections available under the applicable tax laws, and the Company's projections of the future growth and forecasted earnings. An increase to the valuation allowance would have the effect of increasing the income tax provision in the Consolidated Statements of Operations and Comprehensive Income (Loss) in the period that the valuation allowance is increased.
As of July 31, 2013, the Company's federal and state net operating loss carryforwards for income tax purposes were approximately $149 million and $133 million, respectively. The loss carryforwards expire at various dates primarily beginning in year 2030 through year 2032. Utilization of a portion of the net operating losses is subject to annual limitation. The annual limitation may result in the expiration of a portion of the net operating losses before utilization. If these net operating loss carryforwards are realized, approximately $55 million tax benefit will be recorded to paid in capital.
AnnualR
eport

ARUBA NETWORKS, INC.NOTES TO CONSOLIDATED FINANCIAL STATEMENTS
Continued
89
As of July 31, 2013, the Company's federal and state research credit carryforwards for income tax purposes were approximately $22 million and $25 million, respectively. The federal credits expire at various dates beginning in year 2023 through year 2033. The state credits can be carried forward indefinitely.
As of July 31, 2013, approximately $14 million of undistributed earnings from the Company's foreign subsidiaries have been excluded from U.S. tax provision and U.S. deferred tax liability as the Company intends to permanently reinvest these earnings outside the United States. If these earnings were distributed to the United States in the form of dividends or otherwise, the Company would be subject to additional U.S. income taxes (subject to an adjustment for foreign tax credits) and foreign withholding taxes. Determination of the amount of unrecognized deferred tax liability relating to these earnings is not practicable.
The aggregate changes in the balance of gross unrecognized tax benefits were as follows:
Years ended July 31, 2013 2012 2011
Beginning gross unrecognized tax benefits $ 12,077 $ 10,868 $ 6,320Additions for tax positions related to current year 5,523 7,444 4,478Additions for tax positions related to prior year — — 199Reductions for tax positions related to prior year (166) (6,235) (129)
Ending gross unrecognized tax benefits $ 17,434 $ 12,077 $ 10,868
At July 31, 2013, the Company had $17.4 million of unrecognized tax benefits, which if recognized would affect the Company's income tax expense. The Company recognizes interest and penalties related to income tax matters as part of the provision for income taxes. To date, these charges have been immaterial.
The Company believes that it is reasonably possible that unrecognized tax benefits will not increase or decrease significantly over the next 12 months. The Company files income tax returns in the U.S. federal jurisdiction, various U.S. state and local jurisdictions, and in various foreign jurisdictions. Due to the Company's net operating loss and credit carryforwards, substantially all years are subject to examination.
11. Equity Incentive Plans and Benefit Plans
In April 2002, the Company’s board of directors approved the Company’s 2002 Stock Plan (the “2002 Plan”). In December 2006, the Company’s board of directors approved the 2007 Equity Incentive Plan (the “2007 Plan”) and the Employee Stock Purchase Plan (“ESPP"). Upon the closing of the IPO, all of the remaining shares reserved for issuance under the 2002 Plan were transferred to the 2007 Plan.
The 2007 Plan provides for annual increases in the number of shares available for issuance equal to the lesser of:• 5% of the outstanding shares of the Company’s common stock on the last day of the immediately preceding fiscal
year; or• 15,000,000 shares.
In December 2009, the Compensation Committee of the Board of Directors approved the Executive Officer Bonus Plan and the Corporate Bonus Plan, which have subsequently been amended in fiscal 2011 and fiscal 2012 (the “Bonus Plans”). The Bonus Plans offer the Company’s executive officers and employees (the “participants”) the opportunity to earn stock bonuses, or cash for employees in certain countries, based on certain performance criteria set forth in the Bonus Plans associated with revenue and operating income over the respective 6-month performance periods. Based on the probability assessment at each of the period-ends, the bonus accrual is classified as a liability until the number of shares is determined on the date the awards are granted, at which time the Company classifies the awards into equity. The Company recorded stock-based compensation expense related to the Bonus Plans of $13.1 million, $8.1 million, and $9.4 million in fiscal years 2013, 2012, and 2011 respectively.

ARUBA NETWORKS, INC.NOTES TO CONSOLIDATED FINANCIAL STATEMENTS
Continued
90
Stock Option Activity
The following table summarizes the information about shares available for grant and outstanding stock option activity (in thousands, except for share and share data):
Options Outstanding
SharesAvailable for
GrantNumber of
Shares
WeightedAverageExercise
Priceper Share
WeightedAverage
Fair Valueper Share
WeightedAverage
RemainingContractualTerm (Years)
AggregateIntrinsicValue (1)
As of July 31, 2010 635,877 23,640,524 $ 5.00 5.9 $ 283,286Shares reserved for issuance 4,680,314 —Restricted stock awards granted (4,460,081) —Restricted stock awards forfeited 355,781 —Options granted (1,853,890) 1,853,890 21.88 $ 11.70Options exercised — (6,413,368) 4.64 137,156Options cancelled 916,102 (916,102) 10.11As of July 31, 2011 274,103 18,164,944 $ 6.59 5.0 $ 297,688Shares reserved for issuance 5,245,243 —Restricted stock awards granted (7,713,936) —Restricted stock awards forfeited 1,579,751 —Options granted (177,568) 177,568 23.71 $ 13.08Options exercised — (3,753,478) 5.71 $ 56,579Options cancelled 1,325,003 (1,325,003) 10.87As of July 31, 2012 532,596 13,264,031 $ 6.63 3.9 $ 112,868Shares reserved for issuance 5,576,433 —Restricted stock awards granted (7,252,248) —Restricted stock awards forfeited 1,393,834 —Options exercised — (2,860,592) 6.71 $ 38,697Options cancelled 306,970 (355,870) 14.94As of July 31, 2013 557,585 10,047,569 $ 6.29 2.9 $ 121,227Options vested and expected to vestas of July 31, 2013 (2) 10,007,571 $ 6.23 2.9 $ 121,192Options exercisable as of July 31,2013 9,351,024 $ 5.35 2.8 $ 119,696
(1) The aggregate intrinsic value is calculated as the difference between the exercise price of the underlying stock option awards and the fair value of the Company’s common stock on the date of each option exercise.
(2) Options expected to vest are the result of applying the pre-vesting forfeiture rate assumption to total outstanding options.
Incentive and nonstatutory stock options issued under the 2007 Plan are issued with an exercise price equal to the market value of the Company’s company common stock on the date of grant. Options generally vest over a four-year period and generally expire in seven years, but no later than ten years. Upon exercise, new shares are issued.
As of July 31, 2013, $6.3 million of total unrecognized compensation cost, net of forfeitures, related to non-vested stock options is expected to be recognized over a weighted-average period of 1.1 years.
AnnualR
eport

ARUBA NETWORKS, INC.NOTES TO CONSOLIDATED FINANCIAL STATEMENTS
Continued
91
Restricted Stock Award Activity
The following table summarizes the non-vested restricted stock awards and units:
Shares
Weighted AverageGrant DateFair Valueper Share
As of July 31, 2010 2,215,932 $ 9.74Awards granted 4,460,081 24.46Awards vested (1,226,393) 14.70Awards forfeited (355,781) 16.24As of July 31, 2011 5,093,839 $ 20.98Awards granted 7,713,936 19.34Awards vested (2,805,343) 20.29Awards forfeited (1,579,751) 22.15As of July 31, 2012 8,422,681 $ 19.49Awards granted 7,252,248 18.76Awards vested (3,493,341) 19.51Awards forfeited (1,393,834) 20.44As of July 31, 2013 10,787,754 $ 18.87
Restricted stock units and awards are granted under the 2007 Plan. Restricted stock awards are shares of common stock that vest and restricted stock units are awards that will result in a payment if performance goals are achieved or the awards otherwise vest. The terms and conditions of these awards are established by the plan administrator.
The estimated fair value of restricted stock awards is based on the market price of the Company’s common stock on the grant date. The total fair value of the awards granted during the fiscal years ended July 31, 2013, 2012, and 2011 was $136.1 million, $149.2 million, and $109.1 million, respectively. As of July 31, 2013, $145.3 million of total unrecognized compensation cost, net of forfeitures, related to non-vested restricted stock awards is expected to be recognized over a weighted-average period of 2.8 years.
Employee Stock Purchase Plan
Under the Employee Stock Purchase Plan, the Company can grant stock purchase rights to all eligible employees during a two-year offering period with purchase dates at the end of each six-month purchase periods. Shares are purchased through employees’ payroll deductions, up to a maximum of 15% of employees’ compensation for each purchase period, at purchase prices equal to 85% of the lesser of the fair market value of the Company’s common stock at the first trading day of the applicable offering period or the purchase date. No participant may purchase more than $25,000 worth of common stock or 3,000 shares of common stock in any one calendar year period. The ESPP is compensatory and results in compensation expense. A total of 4,689,800 shares of common stock have been reserved for future issuance under the ESPP as of July 31, 2013.

ARUBA NETWORKS, INC.NOTES TO CONSOLIDATED FINANCIAL STATEMENTS
Continued
92
The following table shows for each purchase date, the shares issued and the weighted average purchase price per share:
Purchase date September 1, 2011Shares issued 409,920Weighted average purchase price per share $ 14.88Purchase date March 1, 2012Shares issued 442,758Weighted average purchase price per share $ 16.37Purchase date September 1, 2012Shares issued 348,520Weighted average purchase price per share $ 16.65Purchase date March 1, 2013Shares issued 489,587Weighted average purchase price per share $ 16.74
Fair Value Disclosures
There were no stock options granted during the fiscal year ended July 31, 2013. The Company granted 177,568 stock options during the fiscal year ended July 31, 2012.
The total fair value of options and share awards vested in each of the fiscal years ended July 31, 2013, 2012, and 2011, was $78.6 million, $75.9 million, and $35.8 million, respectively. The fair value of each option grant is estimated on the date of grant using the Black-Scholes model with the following weighted average assumptions:
Employee Stock Options
There were no options granted in fiscal year 2013. For fiscal years 2012 and 2011, the fair value of each option grant is estimated on the date of grant using the Black-Scholes model with the following weighted average assumptions:
Years ended July 31, 2012 2011
Risk-free interest rate 1.2% 1.6%Expected term (in years) 4.0 4.0Dividend yield —% —%Volatility 74% 70%
Employee Stock Purchase Plan
The fair value of the purchase right for the Employee Stock Purchase Plan is estimated on the date of grant using the Black-Scholes model with the following weighted average assumptions:
Years ended July 31, 2013 2012 2011
Risk-free interest rates 0.1% to 0.3% 0.1% to 0.3% 0.2% to 0.7%Expected term (in years) 0.5 to 2.0 0.5 to 2.0 0.5 to 2.0Dividend yield —% —% —%Volatility 54% to 63% 56% to 77% 41% to 69%
The expected term of the stock-based awards represents the period of time that the Company expects such stock-based awards to be outstanding, giving consideration to the contractual term of the awards, vesting schedules and expectations of future employee behavior. The Company gave consideration to its historical exercises, the vesting term of its stock options, the post vesting cancellation history of its stock options and the stock options’ contractual terms. Prior to the third quarter of fiscal 2011, the Company computed expected volatility based on its historical volatility and the historical volatility of comparable companies. Beginning in March 2011, the Company computes expected volatility solely based on its own historical volatility.
AnnualR
eport

ARUBA NETWORKS, INC.NOTES TO CONSOLIDATED FINANCIAL STATEMENTS
Continued
93
The Company made an estimate of expected forfeitures based on historical experience of forfeitures upon vest, and is recognizing stock-based compensation only for those equity awards that it expects to vest. The risk-free interest rate for the expected term of the option is based on the U.S. Treasury Constant Maturity rate as of the date of grant.
Stock-based Compensation Expense
The following table presents stock-based compensation expense by award-type:
Years ended July 31, 2013 2012 2011 (in thousands)
Stock options $ 9,648 $ 16,879 $ 19,323Stock awards 77,064 58,877 38,636Employee stock purchase plan 9,514 8,156 5,791
Total $ 96,226 $ 83,912 $ 63,750
The amount of capitalized stock-based compensation during the fiscal year ended July 31, 2013, 2012, and 2011 was immaterial.
401(k) Defined Contribution Plan
The Company sponsors a 401(k) defined contribution plan covering all employees. Matching contributions to the plan are at the discretion of the Company. To date, there have been no employer contributions under this plan.
Stock Repurchase Program
On June 13, 2012, the Company announced a stock repurchase program for up to $100.0 million of its common stock, which the Company fully utilized and then was increased by an additional $100.0 million on July 15, 2013. The Company is authorized to make repurchases in the market until the Board of Directors' terminates the program or until expenditures reach the authorized amount, whichever occurs first. Any repurchases under the program will be funded from available working capital. The number of shares repurchased and the timing of purchases are based on the price of the Company’s common stock, general business and market conditions and other investment considerations. Shares are retired upon repurchase and it is the Company’s policy to charge any excess of cost over par value entirely to additional paid-in capital. During the fiscal years ended July 31, 2013 and 2012, the Company repurchased a total of 5,311,332 shares and 1,408,504 shares, respectively for a total of purchase price of $86.2 million and $19.9 million, respectively. At July 31, 2013, $93.9 million remains authorized for repurchase under the stock repurchase program.
12. Segment Information and Significant Customers
The Company operates as one reportable and operating segment—selling its ArubaOS operating system, controllers, wireless access points, switches, application software modules, access management solution, multi-vendor management solution software, and professional services and support.
A reportable segment is defined as a component of an enterprise for which separate financial information is available and is evaluated regularly by the chief operating decision maker, or decision making group, for resource allocation and for assessing performance. The Company’s chief operating decision maker is its chief executive officer (“CEO”), who reviews financial information presented on a consolidated basis for purposes of allocating resources and evaluating financial performance. The Company operates as a single reportable and operating segment and the CEO evaluates performance based primarily on revenue in the geographic locations in which the Company operates. Revenue is attributed by geographic location based on the ship-to location of the Company’s customers. The Company’s assets are primarily located in the U.S. and not allocated to any specific region.

ARUBA NETWORKS, INC.NOTES TO CONSOLIDATED FINANCIAL STATEMENTS
Continued
94
The following presents total revenue by geographic region:
Years ended July 31, 2013 2012 2011 (in thousands)
United States $ 379,447 $ 323,331 $ 250,995Europe, Middle East and Africa 106,427 89,540 62,595Asia Pacific and Japan 94,361 89,677 70,171Rest of World 19,809 14,221 12,753
Total $ 600,044 $ 516,769 $ 396,514
The Company’s product revenue was $496.3 million, $434.7 million and $334.9 million for the fiscal years July 31, 2013, 2012 and 2011, respectively. Professional services and support revenue was $103.7 million, $82.0 million and $61.7 million in the same periods.
The following table presents significant channel partners contributing revenue in excess of 10% of total revenue:
Years ended July 31, 2013 2012 2011
ScanSource, Inc. (“Catalyst”) 20.8% 21.4% 19.4%Synnex Corp. 11.6% * *Avnet Logistics U.S. LP * 14.1% 17.1%Alcatel-Lucent * * 13.9%
(*) Indicates less than 10%.
The following table presents significant channel partners as a percentage of total gross accounts receivable:
July 31,2013
July 31,2012
ScanSource, Inc. (“Catalyst”) 21.4% 15.7%Synnex Corp. 12.1% *Avnet Logistics U.S. LP 13.1% 19.0%
(*) Indicates less than 10%.
The following table sets forth the Company's long-lived assets (property, plant, and equipment) by geographic region based on the location of the asset:
July 31,
2013July 31,
2012
(in thousands)United States $ 19,291 $ 14,500All other countries 8,245 5,401
Total $ 27,536 $ 19,901
13. Commitments and Contingencies
Legal Matters
The Company is involved in disputes, claims, litigation, investigations, proceedings and other legal actions, consisting of intellectual property, commercial, securities, and employment matters from time to time that arise in the ordinary course of business, including the legal matters identified below.
AnnualR
eport

ARUBA NETWORKS, INC.NOTES TO CONSOLIDATED FINANCIAL STATEMENTS
Continued
95
U.S. Federal Court Class Action Litigation. On May 23, 2013, a purported stockholder class action lawsuit captioned Mazzafero v. Aruba Networks, Inc., et al., was filed in the United States District Court for the Northern District of California against the Company and certain of its officers. The purported class action alleges claims for violations of the federal securities laws, and seeks unspecified compensatory damages and other relief. The Company believes that it has meritorious defenses to these claims and intends to defend the litigation vigorously. Based on information currently available, the Company has determined that the amount of any possible loss or range of possible loss is not reasonably estimable.
Nomadix, Inc v. Hewlett Packard Company et al. In November 2009, Nomadix, Inc. filed a lawsuit against multiple defendants including Aruba Networks. The suit was filed in the United States District Court for the Central District of California. The plaintiff claims that the defendants infringe several of their patents; however, only one patent was asserted against Aruba, U.S. Patent No. 6,636,894. On July 30, 2013, the Company and Nomadix reached a settlement. As part of the settlement, the Company agreed to pay Nomadix an amount in consideration for a perpetual non-exclusive license for Nomadix' alleged patent, among other things. The Company determined there would be no material benefit from the acquired patent, thus the settlement was recorded as an operating expense in in the fourth quarter of fiscal 2013. The terms of the settlement are confidential. Although the settlement did have a material impact to the Company's Consolidated Statements of Operations and Comprehensive Income (Loss), it did not have a material adverse effect on the Company's consolidated financial position or cash flows for fiscal 2013.
The Company reviews all legal matters at least quarterly and assesses whether an accrual for loss contingencies needs to be recorded. The assessment reflects the impact of negotiations, settlements, rulings, advice of legal counsel, and other information and events pertaining to a particular case. The Company records an accrual for loss contingencies when management believes that it is both probable that a liability has been incurred and the amount of the loss can be reasonably estimated. Legal matters are subject to uncertainties and are inherently unpredictable; however, the Company believes that it has valid defenses with respect to its pending legal matters. Actual liability in any such matters may be materially different from the Company's estimates, which could result in the need to adjust the liability and record additional expenses. If an unfavorable resolution were to occur, there exists the possibility of a material adverse impact on the Company's consolidated financial condition, results of operations or cash flows of the period in which the resolution occurs or on future periods.
For the fiscal year 2013, the Company accrued loss contingencies for certain legal matters totaling $14.1 million. For fiscal years 2012 and 2011, accrued loss contingencies were not material to the Company's consolidated financial statements.
In addition, these actions or other third-party claims against the Company may cause the Company to incur costly litigation and/or substantial settlement charges. Furthermore, the resolution of any patent related litigation may require the Company to make royalty payments, which could adversely affect gross margins in future periods. If any of those events were to occur, the Company's business, financial condition, results of operations, and cash flows could be adversely affected in any particular period by an unfavorable resolution of one or more of these contingencies.
Lease Obligations
The Company leases office spaces under non-cancelable operating leases with various expiration dates through June 2018. The terms of certain operating leases provide for rental payments on a graduated scale. The Company recognizes rent expense on a straight-line basis over the respective lease periods and has accrued for rent expense incurred but not paid. Rent expense for the fiscal years ended July 31, 2013, 2012, and 2011 was $7.2 million, $5.6 million and $4.5 million, respectively.
Future minimum lease payments under non-cancelable operating leases are as follows:
Operating
Leases (in thousands)
Years ending July 31,2014 $ 7,0592015 6,8152016 6,9262017 2,5992018 1,341
Total minimum payments $ 24,740

ARUBA NETWORKS, INC.NOTES TO CONSOLIDATED FINANCIAL STATEMENTS
Continued
96
Employee Agreements
The Company has signed various employment agreements with certain executives pursuant to which if their employment is terminated without cause, the executives are entitled to receive certain benefits, including, but not limited to, accelerated stock option vesting.
Non-cancelable Purchase Commitments
The Company outsources the production of its hardware to third-party contract manufacturers, and enters into various inventory-related purchase commitments with these contract manufacturers and other suppliers. In addition, from time to time, the Company also enters into significant information technology and marketing agreements with its vendors, which are non-cancelable. The Company had $40.0 million and $46.1 million in non-cancelable purchase commitments as of July 31, 2013 and 2012, respectively. The Company expects to sell all products that it has committed to purchase from its third-party contract manufacturers and other suppliers.
Warranties
The Company provides for future warranty costs upon product delivery. The specific terms and conditions of those warranties vary depending upon the product sold and country in which the Company does business. In the case of hardware, the warranties are generally for one year and for certain products a lifetime warranty from the date of purchase. Beginning in the fourth quarter of fiscal year 2009, the Company announced a lifetime warranty program on certain access points, in which customers are entitled to a lifetime warranty on certain access points purchased subsequent to the announcement of the program.
The Company warrants that any media on which its software products are recorded will be free from defects in materials and workmanship under normal use for a period of 90 days from the date the products are delivered to the end customer. In addition, the Company warrants that its hardware products will substantially conform to the Company’s published specifications. Historically, the Company has not experienced material warranty costs. Factors that affect the Company’s warranty liability include the number of installed units, historical experience and management’s judgment regarding anticipated rates of warranty claims and cost per claim. The Company assesses the adequacy of its recorded warranty liabilities every period and makes adjustments to the liability as necessary.
The warranty liability is included as a component of accrued liabilities on the consolidated balance sheets. Changes in the warranty liability are as follows:
WarrantyAmount
(in thousands)As of July 31, 2010 $ 210Provision 462Obligations fulfilled during period (268)As of July 31, 2011 404Provision 956Obligations fulfilled during period (542)As of July 31, 2012 818Provision 703Obligations fulfilled during period (744)As of July 31, 2013 $ 777
Indemnification
In its sales agreements, the Company may agree to indemnify its indirect sales channels and end user customers for certain expenses or liabilities resulting from claimed infringements of patents, trademarks or copyrights of third parties. The terms of these indemnification provisions are generally perpetual any time after execution of the agreement. The agreements generally limit the scope of the available remedies in a variety of industry-standard methods, including, but not limited to, product usage and geography-based limitations, a right to control the defense or settlement of any claim, and a right to replace or modify the infringing products to make them non-infringing. In certain circumstances, the Company may be subject to
AnnualR
eport

ARUBA NETWORKS, INC.NOTES TO CONSOLIDATED FINANCIAL STATEMENTS
Continued
97
uncapped indemnity obligations. To date the Company has not paid any amounts to settle claims or defend lawsuits pursuant to such indemnification provisions. The Company believes the likelihood of such claims is remote and is unable to reasonably estimate the maximum amount that could be payable under these provisions because these obligations are not capped but are conditional to the unique facts and circumstances involved. Accordingly, the Company has no liabilities recorded for these agreements as of July 31, 2013 and 2012. In addition, the Company indemnifies its officers, directors, and certain key employees while they are serving in good faith in their company capacities.
14. Quarterly Financial Information (unaudited)
The following table presents unaudited quarterly financial information for each of our most recent eight fiscal quarters:
Fiscal Quarters EndedJuly 31, April 30, January 31, October 31, July 31, April 30, January 31, October 31,
2013 2013 2013 2012 2012 2012 2012 2011 (in thousands, except per share amounts)
Revenue $ 153,064 $ 147,136 $ 155,362 $ 144,482 $ 139,249 $ 131,894 $ 126,275 $ 119,351Gross profit 107,331 103,164 110,706 102,364 99,418 92,383 90,793 82,737Operating income (loss) (20,345) (2,423) 6,221 4,531 5,429 3,303 449 1,554Net income (loss) (15,581) (20,191) 4,990 (826) (3,030) 6,028 (11,382) (467)Net income (loss) percommon share, basic $ (0.14) $ (0.18) $ 0.04 $ (0.01) $ (0.03) $ 0.05 $ (0.11) $ —Net income (loss) percommon share, diluted $ (0.14) $ (0.18) $ 0.04 $ (0.01) $ (0.03) $ 0.05 $ (0.11) $ —

98
ITEM 9. CHANGES IN AND DISAGREEMENTS WITH ACCOUNTANTS ON ACCOUNTING AND FINANCIAL DISCLOSURE
None.
ITEM 9A. CONTROLS AND PROCEDURES
Evaluation of Disclosure Controls and Procedures
Our management, with the participation of our chief executive officer and chief financial officer, evaluated the effectiveness of our disclosure controls and procedures pursuant to Rule 13a-15 under the Securities Exchange Act of 1934 as amended (the “Exchange Act”). In designing and evaluating the disclosure controls and procedures, management recognizes that any controls and procedures, no matter how well designed and operated, can provide only reasonable assurance of achieving the desired control objectives. In addition, the design of disclosure controls and procedures must reflect the fact that there are resource constraints and that management is required to apply its judgment in evaluating the benefits of possible controls and procedures relative to their costs.
Based on our evaluation, our chief executive officer and chief financial officer concluded that, as of July 31, 2013, our disclosure controls and procedures are designed at a reasonable assurance level and are effective to provide reasonable assurance that information we are required to disclose in reports that we file or submit under the Exchange Act is recorded, processed, summarized and reported within the time periods specified in Securities and Exchange Commission rules and forms, and that such information is accumulated and communicated to our management, including our chief executive officer and chief financial officer, as appropriate, to allow timely decisions regarding required disclosure.
Management’s Report on Internal Control Over Financial Reporting
See Management’s Report of Internal Control Over Financial Reporting on page 61. The effectiveness of our internal control over financial reporting as of July 31, 2013 has been audited by PricewaterhouseCoopers LLP, an independent registered public accounting firm, as stated in their report which is included in Item 8 of this report.
Changes in Internal Control Over Financial Reporting
There were no changes in our internal control over financial reporting that occurred during the fourth quarter of fiscal 2013 that have materially affected, or are reasonably likely to materially affect, our internal control over financial reporting. Internal control over financial reporting means a process designed to provide reasonable assurance regarding the reliability of financial reporting and the preparation of financial statements for external purposes in accordance with generally accepted accounting principles.
ITEM 9B. OTHER INFORMATION
None.
PART III
ITEM 10. DIRECTORS, EXECUTIVE OFFICERS AND CORPORATE GOVERNANCE
The information required by this item is incorporated by reference to our Proxy Statement for our 2013 Annual Meeting of Stockholders to be filed with the SEC within 120 days after the end of the fiscal year ended July 31, 2013.
ITEM 11. EXECUTIVE COMPENSATION
The information required by this item is incorporated by reference to our Proxy Statement for our 2013 Annual Meeting of Stockholders to be filed with the SEC within 120 days after the end of the fiscal year ended July 31, 2013.
ITEM 12. SECURITY OWNERSHIP OF CERTAIN BENEFICIAL OWNERS AND MANAGEMENT AND RELATED STOCKHOLDER MATTERS
The information required by this item is incorporated by reference to our Proxy Statement for our 2013 Annual Meeting of Stockholders to be filed with the SEC within 120 days after the end of the fiscal year ended July 31, 2013.
AnnualR
eport

99
ITEM 13. CERTAIN RELATIONSHIPS AND RELATED TRANSACTIONS, AND DIRECTOR INDEPENDENCE
The information required by this item is incorporated by reference to our Proxy Statement for our 2013 Annual Meeting of Stockholders to be filed with the SEC within 120 days after the end of the fiscal year ended July 31, 2013.
ITEM 14. PRINCIPAL ACCOUNTANT FEES AND SERVICES
The information required by this item is incorporated by reference to our Proxy Statement for our 2013 Annual Meeting of Stockholders to be filed with the SEC within 120 days after the end of the fiscal year ended July 31, 2013.
PART IV
ITEM 15. EXHIBITS AND FINANCIAL STATEMENT SCHEDULE
(a)(1) Financial Statements: See Index to Consolidated Financial Statements in Item 8 of this report
(2) Financial Schedules: Schedule II Valuation and Qualifying Accounts appears below and should be read in conjunction with the Consolidated Financial Statements included in this report.
Balance atBeginning
of Year Additions Deductions
Balance atEnd ofYear
(in thousands)Fiscal year ended July 31, 2011
Allowance for doubtful accounts $ 462 $ 17 $ (173) $ 306Sales returns $ 225 $ 458 $ (397) $ 286Valuation allowance on deferred tax assets $ 67,572 $ — $ (67,337) $ 235
Fiscal year ended July 31, 2012Allowance for doubtful accounts $ 306 $ 125 $ (155) $ 276Sales returns $ 286 $ 1,051 $ (690) $ 647Valuation allowance on deferred tax assets $ 235 $ — $ (148) $ 87
Fiscal year ended July 31, 2013Allowance for doubtful accounts $ 276 $ 737 $ (208) $ 805Sales returns $ 647 $ 994 $ (328) $ 1,313Valuation allowance on deferred tax assets $ 87 $ 4,727 $ (87) $ 4,727
Schedules not listed above have been omitted because the information required to be set forth therein is not applicable or is shown in the financial statements or notes thereto.
(b) Exhibits. The exhibits listed on the Exhibit Index (following the Signatures section of this report) are included, or incorporated by reference, in this report.

100
SIGNATURES
Pursuant to the requirements of Section 13 or 15(d) of the Securities Exchange Act of 1934, the Registrant has duly caused this report to be signed on its behalf by the undersigned, thereunto duly authorized, on the 24th day of September 2013.
ARUBA NETWORKS, INC.
/s/ Dominic P. OrrDominic P. OrrPresident and Chief Executive OfficerChairman of the Board of Directors
POWER OF ATTORNEY
KNOW ALL PERSONS BY THESE PRESENTS, that each person whose signature appears below constitutes and appoints Dominic P. Orr and Michael M. Galvin, and each of them, his attorneys-in-fact, each with the power of substitution, for him in any and all capacities, to sign any and all amendments to this Annual Report on Form 10-K and to file the same, with exhibits thereto and other documents in connection therewith, with the Securities and Exchange Commission, hereby ratifying and confirming all that each of said attorneys-in-fact, or his substitute or substitutes, may do or cause to be done by virtue hereof.
Pursuant to the requirements of the Securities Exchange Act of 1934, this report has been signed below by the following persons on behalf of the registrant and in the capacities and on the dates indicated:
Signature Title Date
/s/ Dominic P. Orr President, Chief Executive Officer, and Chairman of theBoard of Directors (Principal Executive Officer)
September 24, 2013Dominic P. Orr
/s/ Michael M. Galvin Chief Financial Officer (Principal Accounting andFinancial Officer)
September 24, 2013Michael M. Galvin
/s/ Keerti Melkote Co-Founder, Chief Technology Officer and Director September 24, 2013Keerti Melkote
/s/ Bernard Guidon Director September 24, 2013Bernard Guidon
/s/ Emmanuel Hernandez Director September 24, 2013Emmanuel Hernandez
/s/ Michael R. Kourey Director September 24, 2013Michael R. Kourey
/s/ Willem P. Roelandts Director September 24, 2013Willem P. Roelandts
/s/ Juergen Rottler Director September 24, 2013Juergen Rottler
/s/ Daniel Warmenhoven Director September 24, 2013Daniel Warmenhoven
AnnualR
eport

101
EXHIBIT INDEX
ExhibitNumber
Incorporated by Reference HereinDescription Form File No. Exhibit Filing Date
2.1 Arrangement Agreement dated May 7, 2010 by and amongRegistrant, Azalea Networks, Felix Zhao, Frank Wang, FangWu, Hans Tai and Samuel Chen, as Principal Shareholders,and with respect to Articles VII, VIII and IX only, Hans Taias Shareholder Representative and U.S. Bank NationalAssociation as Escrow Agent
8-K 001-33347 2.1 5/10/2010
2.2 Scheme of Arrangement between Azalea Networks,Registrant, the Scheme Shareholders (as defined therein) andthe Bridge Noteholders (as defined therein)
8-K 001-33347 2.2 9/3/2010
3.1 Restated Certificate of Incorporation of Registrant 8-K 001-33347 3.1 4/5/20073.2 Amended and Restated Bylaws of Registrant 8-K 001-33347 3.1 2/17/20094.1 Specimen common stock certificate S-1 333-139419 4.1 3/7/200710.1 Form of Indemnification Agreement between Registrant and
its directors and executive officers8-K 001-33347 10.1 5/20/2011
10.2‡ AirWave Wireless, Inc. 2000 Stock Plan S-8 333-149945 99.1 3/28/200810.3‡ 2002 Stock Plan of Registrant, as amended S-1 333-139419 10.2A 1/24/200710.4‡ Forms of Stock Option Agreements under the 2002 Stock
PlanS-1 333-139419 10.2B 12/15/2006
10.5‡ 2007 Equity Incentive Plan of Registrant, as amended 10-K 001-33347 10.5 9/27/201110.6‡ Forms of Stock Option Agreements under the 2007 Equity
Incentive PlanS-1 333-139419 10.3B 1/24/2007
10.7‡ Form of Stock Option Agreement for Participants Outside theU.S. under the 2007 Equity Incentive Plan
10-K 001-33347 10.7 9/24/2010
10.8‡ Form of Restricted Stock Unit Agreement under the 2007Equity Incentive Plan
10-Q 001-33347 10.2 12/10/2008
10.9‡ Form of Restricted Stock Unit Agreement for RecipientsOutside the U.S. under the 2007 Equity Incentive Plan
10-K 001-33347 10.9 9/24/2010
10.10‡ Employee Stock Purchase Plan, as amended 10-Q 001-33347 10.4 3/3/201010.11‡ Form of Subscription Agreement under the Employee Stock
Purchase PlanS-1 333-139419 10.4B 1/24/2007
10.12‡ Executive Officer Bonus Plan, as amended 8-K 001-33347 10.1 12/23/201010.13‡ Outside Director Compensation Policy 10-K 001-33347 10.13 9/27/201110.14‡ Change of Control Severance Policy for Officers and
Directors10-K 001-33347 10.14 9/27/2011
10.15‡ Executive Employment Agreement, dated April 4, 2006,between Registrant and Dominic Orr
S-1 333-139419 10.5 12/15/2006
10.16‡ Amendment to Executive Employment Agreement, datedDecember 2008, between Registrant and Dominic Orr
10-K 001-33347 10.7 10/6/2009
10.17‡ Employment offer letter, dated April 12, 2002, betweenRegistrant and Keerti Melkote
S-1 333-139419 10.6 12/15/2006
10.18‡ Employment Offer Letter, dated August 26, 2004, betweenRegistrant and Michael Kirby
10-K 001-33347 10.19 10/11/2012
10.19‡ Offer Letter, dated September 22, 2011, between Registrantand Michael Galvin
10-K 001-33347 10.21 9/27/2011
10.20‡ Description of amendments to change of controlarrangements with certain executive officers
8-K 001-33347 Item 5.02 3/9/2010
10.21 Standard Office Lease, dated as of November 30, 2007, for1344 Crossman Ave., Sunnyvale, California
8-K 001-33347 10.1 12/6/2007

102
10.22 First Amendment to Lease, dated as of August 12, 2009, for1344 Crossman Ave., Sunnyvale, California
10-K 001-33347 10.15 10/6/2009
10.23 Lease Agreement dated as of September 22, 2009, for 1322Crossman Ave., Sunnyvale, California
10-K 001-33347 10.17 10/6/2009
10.24 Flextronics Manufacturing Services Agreement, datedJanuary 1, 2005, between Registrant and Flextronics Sales &Marketing North Asia (L) Ltd. (the “FlextronicsManufacturing Services Agreement”)
S-1 333-139419 10.15 1/24/2007
10.25 Amendment 1 to the Flextronics Manufacturing ServicesAgreement, dated as of May 5, 2007, between Registrant andFlextronics Sales & Marketing North Asia (L) Ltd.
10-K 001-33347 10.28 9/27/2011
10.26 Amendment 2 to the Flextronics Manufacturing ServicesAgreement, dated as of April 22, 2010, between Registrantand Flextronics Sales & Marketing North Asia (L) Ltd.
10-K 001-33347 10.29 9/27/2011
10.27 Amendment 3 to the Flextronics Manufacturing ServicesAgreement, dated as of September 30, 2011, betweenRegistrant and Flextronics Sales & MarketingNorth Asia (L) Ltd.
10-Q 001-33347 10.4 12/7/2011
10.28 Technology License Agreement, dated October 20, 2005,between Registrant and Atheros Communications, Inc.
S-1 333-139419 10.16 3/20/2007
10.29 Amendment No. 1 to Technology License Agreement, datedas of March 4, 2011, between Registrant and AtherosCommunications, Inc.
10-K 001-33347 10.31 9/27/2011
10.30 Software License Agreement, dated as of January 11, 2006,between Registrant and Broadcom Corporation
S-1 333-139419 10.17 1/24/2007
10.31† OEM Supply Agreement, dated March 18, 2005, betweenRegistrant and Alcatel Internetworking, Inc.
S-1 333-139419 10.18 3/26/2007
10.32† Amendment #1 to OEM Supply Agreement, dated August 31,2006, between Registrant and Alcatel Internetworking, Inc.
S-1 333-139419 10.19 3/26/2007
10.33† Amendment #2 to OEM Supply Agreement, datedFebruary 22, 2007, between Registrant and Alcatel USASourcing, Inc. (fka Alcatel Internetworking, Inc.)
10-Q 001-33347 10.2 12/4/2009
10.34† Amendment #4 to OEM Supply Agreement, dated as ofDecember 31, 2010, between Registrant and Alcatel-LucentUSA Inc. (fka Alcatel Internetworking, Inc.)
10-Q 001-33347 10.8 3/11/2011
10.35 Master Purchase Agreement, dated as of January 16, 2006,between Registrant and Raza Microelectronics, Inc.
10-Q 001-33347 10.3 3/12/2009
10.36 First Amendment to Master Purchase Agreement, dated as ofFebruary 26, 2007, between Registrant and RazaMicroelectronics, Inc.
10-Q 001-33347 10.4 3/12/2009
10.37† Distribution Agreement, dated as of June 4, 2007, betweenRegistrant and ScanSource, Inc. (the “ScanSourceDistribution Agreement”)
10-Q 001-33347 10.2 3/11/2011
10.38† Amendment 1 to the ScanSource Distribution Agreement,dated as of March 17, 2008, between Registrant andScanSource, Inc.
10-K 001-33347 10.40 9/27/2011
10.39† Amendment 2 to the ScanSource Distribution Agreement,dated as of May 27, 2009, between Registrant andScanSource, Inc.
10-K 001-33347 10.41 9/27/2011
10.40† Distributor Agreement, dated as of June 15, 2007, betweenRegistrant and Avnet Logistics U.S., LP (the “AvnetDistributor Agreement”)
10-Q 001-33347 10.3 3/11/2011
10.41† Amendment 1 to the Avnet Distributor Agreement, dated asof February 19, 2009, between Registrant and AvnetLogistics U.S., LP
10-Q 001-33347 10.4 3/11/2011
10.42† Amendment 2 to the Avnet Distributor Agreement, dated asof June 15, 2009, between Registrant and Avnet LogisticsU.S., LP
10-Q 001-33347 10.5 3/11/2011
AnnualR
eport

103
10.43 Amendment 3 to the Avnet Distributor Agreement, effectiveas of November 30, 2009, between Registrant and Avnet, Inc.
10-Q 001-33347 10.6 3/11/2011
10.44† Amendment 4 to the Avnet Distributor Agreement, effectiveas of February 17, 2012, between Registrant and Avnet, Inc.
10-Q 001-33347 10.3 6/7/2012
10.45†* Amendment 5 to the Avnet Distributor Agreement, effectiveas of February 1, 2013, between Registrant and Avnet, Inc.
10.46† Manufacturing Agreement, dated as of November 1, 2008,between Registrant and SerComm Corporation
10-Q 001-33347 10.7 3/11/2011
10.47 Addendum to Manufacturing Agreement, effective as ofJanuary 16, 2012, between Registrant and SerCommCorporation
10-Q 001-33347 10.2 6/7/2012
10.48† Volume Purchase Agreement, effective as of February 28,2011, between Registrant and Atheros Technology Ltd.
10-K/A 001-33347 10.47 2/8/2012
10.49 Patent Cross License and Settlement Agreement datedNovember 4, 2009
8-K 001-33347 10.1 11/6/2009
10.50 Letter Agreement dated November 4, 2009 8-K 001-33347 10.2 11/6/200921.1* List of subsidiaries of Registrant23.1* Consent of PricewaterhouseCoopers LLP, Independent
Registered Public Accounting Firm24.1 Power of Attorney (included on the signature page of this
Annual Report on Form 10-K)31.1* Certification of Chief Executive Officer pursuant to
Exchange Act Rules 13a-14(a) and 15d-14(a), as adoptedpursuant to Section 302 of the Sarbanes-Oxley Act
31.2* Certification of Chief Financial Officer pursuant to ExchangeAct Rules 13a-14(a) and 15d-14(a), as adopted pursuant toSection 302 of the Sarbanes-Oxley Act
32.1** Certifications of Chief Executive Officer and Chief FinancialOfficer pursuant to 18 U.S.C. Section 1350, as adoptedpursuant to Section 906 of the Sarbanes-Oxley Act
101.INS+ XBRL Instance Document101.SCH+ XBRL Taxonomy Extension Schema Document101.CAL+ XBRL Taxonomy Extension Calculation Linkbase Document101.DEF+ XBRL Taxonomy Extension Definition Linkbase Document101.LAB+ XBRL Taxonomy Extension Label Linkbase Document101.PRE+ XBRL Taxonomy Extension Presentation Linkbase
Document
* Filed herewith.** Furnished herewith.† Confidential treatment has been requested for portions of this exhibit.‡ Indicates management contract or compensatory plan or arrangement.+ Furnished herewith. In accordance with Rule 406T of Regulation S-T, the information in these exhibits shall not be
deemed to be “filed” for purposes of Section 18 of the Securities Exchange Act of 1934, as amended, or otherwisesubject to liability under that section, and shall not be incorporated by reference into any registration statement or otherdocument filed under the Securities Act of 1933, as amended, except as expressly set forth by specific reference in suchfiling.

[THIS PAGE INTENTIONALLY LEFT BLANK]

[THIS PAGE INTENTIONALLY LEFT BLANK]

BOARD OF DIRECTORS CORPORATE HEADQUARTERS
Dominic P. Orr 1344 Crossman Avenue President and Chief Executive Officer Sunnyvale, California 94089 T: 408-227-4500 Keerti Melkote F: 408-752-0626 Co-Founder and Chief Technology Officer www.arubanetworks.com Bernard Guidon Executive Management Consultant REGISTRAR AND TRANSFER AGENT Emmanuel Hernandez For questions regarding misplaced Chairman of the Board, SunPower Corporation share certificates, changes of address or the consolidation of accounts, Michael R. Kourey please contact the Company’s transfer Partner, Khosla Ventures agent: Willem P. Roelandts Computershare Consultant 250 Royall Street Canton, MA 02021 Juergen Rottler T: 866-265-8969 Founder and Chief Executive Officer, TDD for hearing impaired: 800-822-2794 Global Impakt Foreign Stockholders: 201-680-6995 TDD Foreign Stockholders: 312-588-4110 Daniel Warmenhoven www.cpushareownerservices.com Executive Chairman, NetApp, Inc. LEGAL COUNSEL CORPORATE EXECUTIVES Wilson, Sonsini, Goodrich & Rosati, PC Dominic P. Orr Palo Alto, California President and Chief Executive Officer INDEPENDENT AUDITORS Michael M. Galvin Chief Financial Officer PricewaterhouseCoopers LLP San Jose, California Keerti Melkote Co-Founder, Chief Technology Officer INVESTOR RELATIONS Tonya Chin Michael Kirby Senior Director, Investor Relations Executive Vice President, Worldwide Sales E: [email protected] T: 408-598-4924
© 2013 Aruba Networks, Inc. Aruba Networks’ trademarks include the design mark for AirWave, Aruba Networks®, Aruba Wireless Networks®, the registered Aruba the Mobile Edge Company logo, the registered AirWave logo, Aruba Mobility Management System®, Mobile Edge Architecture®, People Move. Networks Must Follow®, RFProtect®, Green Island®. All rights reserved. All other trademarks are the property of their respective owners.
