article product quality during the storage of foods with
TRANSCRIPT
Foods 2020, 9, 791; doi:10.3390/foods9060791 www.mdpi.com/journal/foods
Article
Product Quality during the Storage of Foods
with Insects as an Ingredient: Impact of Particle Size,
Antioxidant, Oil Content and Salt Content
Karin Wendin 1,2,*, Lennart Mårtensson 1, Henric Djerf 1 and Maud Langton 3
1 Faculty of Natural Sciences, Kristianstad University, SE-291 88 Kristianstad, Sweden;
[email protected] (L.M.); [email protected] (H.D.) 2 Department of Food Science, University of Copenhagen, DK-1958 Frederiksberg C, Denmark 3 Department of Molecular Sciences, SLU, Swedish University of Agricultural Sciences,
SE-750 07 Uppsala, Sweden; [email protected]
* Correspondence: [email protected]
Received: 08 May 2020; Accepted: 13 June 2020; Published: 16 June 2020
Abstract: To increase the acceptability of insects as food in Western culture, it is essential to develop
attractive, high-quality food products. Higher acceptability of insect-based food has been shown if
the insects are “invisible”. Mincing or chopping the insect material could be a first processing step
to reduce the visibility of the insects. In this work, we processed yellow mealworms by using
traditional food techniques: chopping, mixing and heat treatment in a retort. The results show that
all factors in the experimental design (particle size, oil content, salt content and antioxidant)
influenced the products to a larger extent than the storage time. The results, measured by sensory
analysis, TBAR values (Thiobarbituric acid reactive substances), colourimetry and viscosity, show
clearly that the food products packaged in TRC (Tetra recart cartons) 200 packages and processed
in a retort stayed stable during a storage time of 6 months at room temperature.
Keywords: yellow mealworm; Tenebrio molitor; insects; sensory; processed; model system; shelf life
1. Introduction
Globally, insects are popular as human food in many countries [1,2]. Edible insects, such as
yellow mealworms, may be a sustainable source of protein and fat since they are efficient feed
converters with a high nutritional value [1,2]. Yellow mealworms have been shown to contain many
of the essential amino acids, such as histidine, isoleucine, leucine, lysine, methionine + cysteine,
phenylalanine + tyrosine, threonine and valine [3]. There are numerous studies on insects as human
food, however very few focus on their taste and flavour or show their potential to become tasty foods
[4].
The development of attractive, high-quality food products is essential if the consumption of
insect-based food products is to increase in Western culture. Tan et al. [5] pointed out that insect-
based food products are unlikely to be accepted if they do not meet the consumers’ expectations. The
use of “insect-flour” containing non-visible insects had a significantly higher acceptance than the use
of whole and visible insects in studies in both Sweden [6] and Denmark [7]. Mincing or chopping the
insect material could be a first processing step to reduce the visibility of the insects. Another way of
reducing visibility is to use insects as an ingredient; for example, Azzollini et al. [8] added ground
yellow mealworm larvae blended with wheat flour to produce extruded cereal snacks. Extraction of
the insect proteins may also be an alternative to the use of whole insects [9].
Foods 2020, 9, 791 2 of 16
There is a need to understand the mechanisms affecting the sensory properties and oxidation
stability of insects when used as food. The primary attributes of the sensory quality of a food product
depend on the product type and may be due to appearance (colour, size, shape), odour, flavour, taste
and texture [10]. In a previous study, it was shown that the salt content and particle size had a high
impact on the sensory attributes of mealworm samples in a model food system [11]. Salt level and
particle size are therefore important factors to evaluate in the development of food products based
on insects. Salt usually affects protein aggregation, solubility and rheological properties [12]. Soy
protein isolate was found to form a gel upon heating, which is common for many proteins. Chen et
al. [12] also found that adding salt increased the storage modulus of soy protein isolate gels. However,
in a previous study where extracted mealworm protein gels were analysed, the addition of 1.0% NaCl
was found to affect the storage modulus G’, which decreased. This was explained by the change in
solubility [3]. In contrast to many other proteins, the storage modulus G’ decreased during heating
in extracted mealworm protein [3]. Thus, mealworm protein could exhibit different behaviours
compared to many other proteins. The addition of an antioxidant agent, extract of rosemary, seemed
to affect the colour, rancidity and separation; however, further studies are needed [11]. For this
purpose, sensory characteristics can by evaluated by a trained sensory panel and results can then be
related to instrumental analysis of viscosity and colour. Rancidity is often measured using
measurements of Thiobarbituric acid reactive substances (TBAR), i.e., the degradation products of
lipids, which can be detected through the use of a reagent consisting of thiobarbituric acid [13,14]
Another common way to measure TBAR values is through the use of a commercially available Lipid
Peroxidation (Malondialdehyde (MDA)) Assay Kit [15].
Food products need to be processed and packaged in order to maintain sensory characteristics
and safety, and to increase the shelf life of the food. Dobermann [16] suggests that clear processing
and storage methodologies should be established for insects as food. Heat treatment is often used to
prevent microbial growth and to produce safe products. A retort is commonly used for the
preservation of many food products [17]. The packaging is also of importance and must include
barriers to oxygen and light to prevent the development of rancidity during storage [18].
Product browning occurs in minced mealworm, possibly due to enzymes, according to
Tonneijck-Srpová et al. [19]. They showed that inactivation of the enzymes responsible for browning
could be achieved by blanching and/or high-pressure processing at 400 and 500 MPa. Nevertheless,
this also resulted in a decrease in the texturizing properties of the minced mealworms, such as lower
values for fracture stress and Young’s modulus, particularly when blanching was used.
In this study, a food model system was produced according to an experimental design [20]. In
order to create model food products similar to real food, oil, water, salt and antioxidant were added
to finely grated or coarsely chopped mealworms. These additions can affect the mealworm products
during storage due to stability problems that may occur. The model products can be compared to
food products such as paté or purée, or Swedish meatballs. Patés typically have a fat content around
25% but may vary between 10% and 30% [21] and Swedish meatballs also vary between 10% and
30%, with commercial products containing 17% [22]. We used sunflower oil in the model products.
Both yellow mealworms and sunflower oil contain unsaturated fatty acids, which make the products
susceptible to oxidation and a rancid off-flavour can therefore occur during storage. Rosemary extract
was used as an antioxidant and combined with packaging with highly protective barriers, which was
used to prevent oxidation and increase the shelf life of the model products based on insects.
2. Aim
Food model products based on yellow mealworms were put into packages and processed in a
retort to evaluate the impact of particle size, oil/water ratio, salt content and amount of antioxidant
on the sensory properties, viscosity, rancidity and colour during storage, compared to freshly
produced products.
Foods 2020, 9, 791 3 of 16
3. Materials and Methods
3.1. Material
The fresh Yellow Mealworms (Tenebrio molitor) were reared on a small scale in Sweden. The
breeding of the mealworms took place in plastic boxes, about 300 mm ×300 mm × 100 mm in size and
kept at an ambient temperature (approximately 22 °C). Humidity was approximately 50%. The time
from egg to mealworm was 12 weeks. The mealworms were fed on oat bran and carrot. Sunflower
oil (Farm, Swedish Fine Rice and Food AB, Huddinge, Sweden), salt (NaCl, Nordfalks, Sweden) and
an antioxidant based on rosemary (Duralox Oxidation Management Blend NM-45, HT, NS, product
code: 62-103-03) were also used. The products were packaged in 200 mL Tetra Recart cartons (TRC
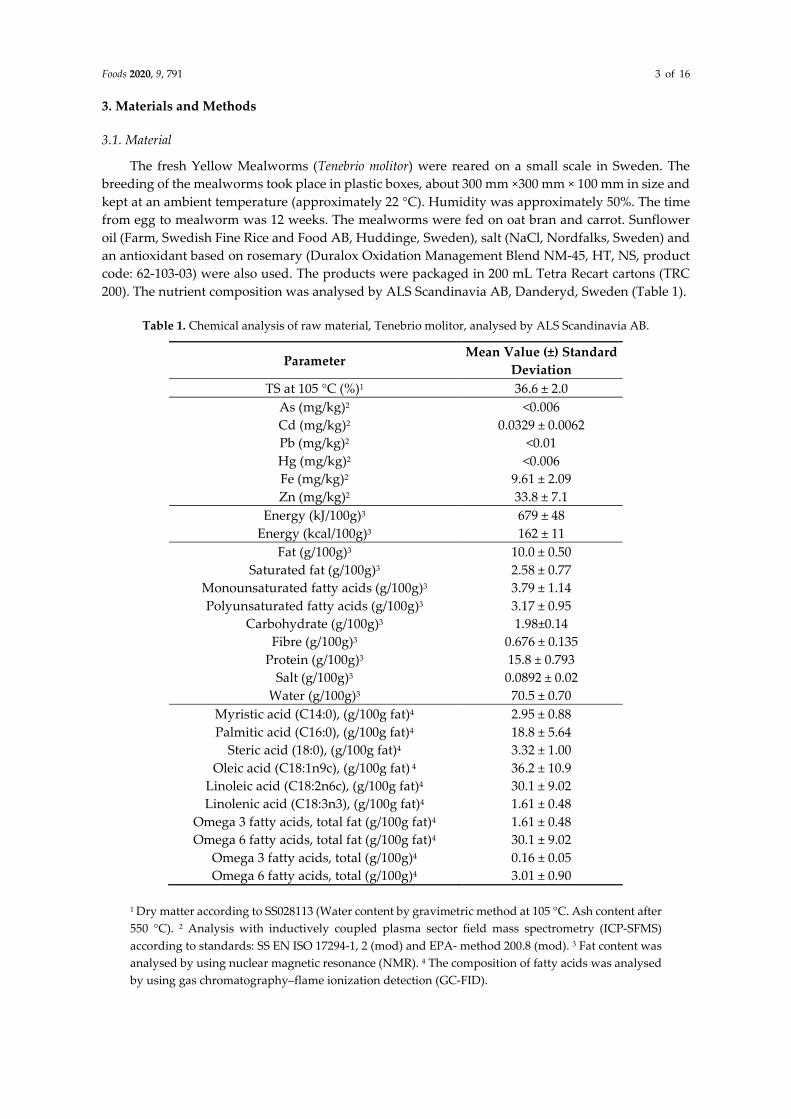
200). The nutrient composition was analysed by ALS Scandinavia AB, Danderyd, Sweden (Table 1).
Table 1. Chemical analysis of raw material, Tenebrio molitor, analysed by ALS Scandinavia AB.
Parameter Mean Value (±) Standard
Deviation
TS at 105 °C (%)1 36.6 ± 2.0
As (mg/kg)2 <0.006
Cd (mg/kg)2 0.0329 ± 0.0062
Pb (mg/kg)2 <0.01
Hg (mg/kg)2 <0.006
Fe (mg/kg)2 9.61 ± 2.09
Zn (mg/kg)2 33.8 ± 7.1
Energy (kJ/100g)3 679 ± 48
Energy (kcal/100g)3 162 ± 11
Fat (g/100g)3 10.0 ± 0.50
Saturated fat (g/100g)3 2.58 ± 0.77
Monounsaturated fatty acids (g/100g)3 3.79 ± 1.14
Polyunsaturated fatty acids (g/100g)3 3.17 ± 0.95
Carbohydrate (g/100g)3 1.98±0.14
Fibre (g/100g)3 0.676 ± 0.135
Protein (g/100g)3 15.8 ± 0.793
Salt (g/100g)3 0.0892 ± 0.02
Water (g/100g)3 70.5 ± 0.70
Myristic acid (C14:0), (g/100g fat)4 2.95 ± 0.88
Palmitic acid (C16:0), (g/100g fat)4 18.8 ± 5.64
Steric acid (18:0), (g/100g fat)4 3.32 ± 1.00
Oleic acid (C18:1n9c), (g/100g fat) 4 36.2 ± 10.9
Linoleic acid (C18:2n6c), (g/100g fat)4 30.1 ± 9.02
Linolenic acid (C18:3n3), (g/100g fat)4 1.61 ± 0.48
Omega 3 fatty acids, total fat (g/100g fat)4 1.61 ± 0.48
Omega 6 fatty acids, total fat (g/100g fat)4 30.1 ± 9.02
Omega 3 fatty acids, total (g/100g)4 0.16 ± 0.05
Omega 6 fatty acids, total (g/100g)4 3.01 ± 0.90
1 Dry matter according to SS028113 (Water content by gravimetric method at 105 °C. Ash content after
550 °C). 2 Analysis with inductively coupled plasma sector field mass spectrometry (ICP-SFMS)
according to standards: SS EN ISO 17294-1, 2 (mod) and EPA- method 200.8 (mod). 3 Fat content was
analysed by using nuclear magnetic resonance (NMR). 4 The composition of fatty acids was analysed
by using gas chromatography–flame ionization detection (GC-FID).

Foods 2020, 9, 791 4 of 16
The composition of the mealworm is such that it could provide a useful contribution to the
intakes of zinc and iron, especially zinc, since the zinc content of mealworm is high at 34 mg/kg. Thus,
the intake of this type of food could be a useful addition to the daily intake. The recommended daily
intakes of zinc and iron are both around 10 mg, depending on age and gender [23,24]. The product
also contains omega 3 and omega 6 fatty acids, with high levels of omega 6, and therefore could
contribute to the intake of this essential fatty acid. The level of cadmium is low (Table 1) and therefore
only a high consumption of the product would exceed the toxic level.
3.2. Experimental Design
Four different samples were produced according to a factorial design (Figure 1). The recipes for
each of the samples were the following:
1. 4 kg meal worm, 1 kg oil, 3 kg water, 80 g salt, 0.36 g rosemary extract, resulting in an oil
content around 12.5%.
2. 4 kg meal worm, 3 kg oil, 1 kg water, 80 g salt, 11.2 g rosemary extract, resulting in an oil
content around 37.5%.
3. 4 kg mealworm, 1 kg water, 3 kg oil, 20 g salt, 0.36 g rosemary extract, resulting in an oil
content around 37.5%.
4. 4 kg mealworm, 3 kg water, 1 kg oil, 20 g salt, 11.2 g rosemary extract, resulting in an oil
content around 12.5%.
Sample
No
Meal
Worm
o/w
ratio
(%)
Salt
(%)
Rosemary
(%)
1 Finely
grated
(<1 mm)
25/75 1 0.0045
2 Finely
grated
(<1 mm)
75/25 1 0.14
3 Coarsely
chopped
(<5 mm)
75/25 0.25 0.0045
4 Coarsely
chopped
(<5 mm)
25/75 0.25 0.14
Figure 1. Illustration of the experimental design. To the left an overview of the design and to the right
an illustration of the design oil content ~12.5% or ~37.5%, NaCl content ~0.25% or ~1%, and rosemary
content ~0.0045% or ~0.14%.
3.3. Production
A total of 16 kg of mealworms were provided, allowing a maximum of 45 packages of each
recipe to be prepared. The manufacturing process for the products will now be described.
Frozen mealworms were blanched for 2–3 min and then chopped by hand or grated using a
kitchen blender before the packages were filled. The ingredients for the liquid were mixed and then
added to the chopped or grated mealworms. Each package was filled to the top manually before
sealing.
A standard sterilisation process was selected for the heat treatment of the products at 122 °C
while monitoring the F-value of the product. The four samples were processed in a JBT Retort: AR092-
T JBT Mobile Test Unit (Belgium). Production, packaging and processing took place at Tetra Pak,
Lund Sweden.

Foods 2020, 9, 791 5 of 16
The four different products were run 2 by 2 in the retort, thus allowing all products to be
processed on the same day. Samples with a similar oil content were put into the same retort since
differences had been found when monitoring product-specific F-values during a pre-trial. Recipes 1
and 4 were therefore run together, as were recipes 2 and 3. Data from the heating process are
presented in Table 2. Each package was labelled with a date of withdrawal for shelf life analysis,
which was 6 months after production day. All sample batches were tested using microbiological
analysis: 5 packages incubated at 30 °C for 7 days and 4 packages incubated at 55 °C for 7 days. The
food products were evaluated on Plate Count Agar after package incubation. Results for all samples
were <1 Colony Forming Unit (CFU)/10 microlitre. After microbiological approval, the samples were
released for use in the project.
Table 2. Retort process.
Process Data Sample 1 Sample 4 Sample 2 Sample 3
Come-Up Time (min) 21 21
Holding Time (min) 48 55
Cooling Time (min) 49 52
Total Process Time (min) 118 128
F-value before cooling * 20 49 30 30
F-value Total * 31 56 40 40
Initial Temperature (°C) 23 23
End Temperature (°C) 30 30
* The F-value or the thermal death time is used for comparing heat sterilization procedures. It
represents the total time–temperature combination received by the food, thus the time required to
achieve a specified reduction in microbial numbers at a given temperature [25].
3.4. Storage
Packaged samples were stored at an ambient temperature of approximately 21 °C. The samples
were retrieved 7 times, first directly after preparation and then each month for 6 months, and then
put into a freezer (Vestfrost solutions VTS 098, Esbjerg, Denmark) and kept at −80 °C until analysis.
All samples were thawed before analysis and analysed at the same time. The samples were labelled
as shown in Table 3.
Table 3. Sample code for all four samples during 6 months of storage.
Storage Sample 1 Sample 2 Sample 3 Sample 4
Fresh 181106-1 181106-2 181106-3 181106-4
After 1 month 181206-1 181206-2 181206-3 181206-4
After 2 months 190107-1 190107-2 190107-3 190107-4
After 3 months 190206-1 190206-2 190206-3 190206-4
After 4 months 190306-1 190306-2 190306-3 190306-4
After 5 months 190405-1 190405-2 190405-3 190405-4
After 6 months 190506-1 190506-2 190506-3 190506-4
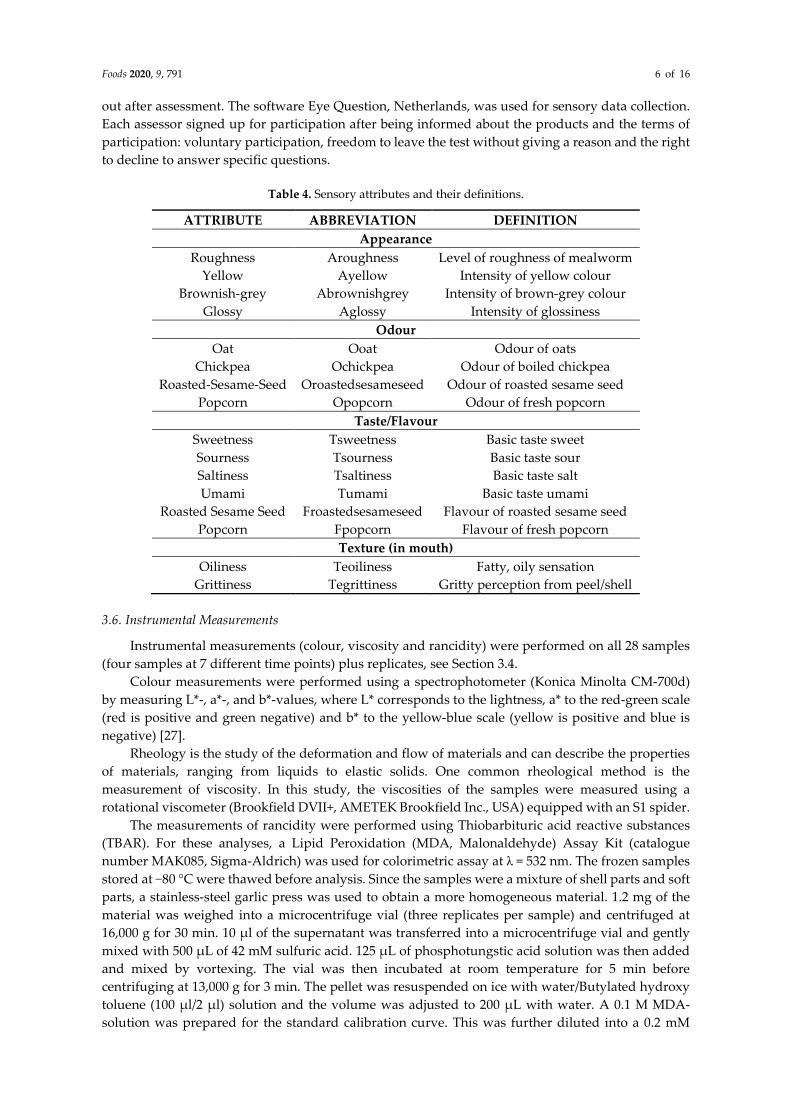
3.5. Sensory Analysis
The sensory panel was selected and trained according to ISO (International Standard
Organisation) standard 8586-2:2008 [26]. The panel consisted of eight assessors who were trained to
perform a quantitative descriptive analysis. During training, reference samples were presented, and
their sensory attributes were defined (Table 4). The panel was further trained in how to rate attribute
intensities on a numerical scale from 0 to 100. The assessments were then performed in triplicate, in
a randomised order. The panel was instructed to use water and neutral wafers to cleanse the palate
and neutralise the senses. The assessors were informed not to swallow the samples but to spit them
Foods 2020, 9, 791 6 of 16
out after assessment. The software Eye Question, Netherlands, was used for sensory data collection.
Each assessor signed up for participation after being informed about the products and the terms of
participation: voluntary participation, freedom to leave the test without giving a reason and the right
to decline to answer specific questions.
Table 4. Sensory attributes and their definitions.
ATTRIBUTE ABBREVIATION DEFINITION
Appearance
Roughness Aroughness Level of roughness of mealworm
Yellow Ayellow Intensity of yellow colour
Brownish-grey Abrownishgrey Intensity of brown-grey colour
Glossy Aglossy Intensity of glossiness
Odour
Oat Ooat Odour of oats
Chickpea Ochickpea Odour of boiled chickpea
Roasted-Sesame-Seed Oroastedsesameseed Odour of roasted sesame seed
Popcorn Opopcorn Odour of fresh popcorn
Taste/Flavour
Sweetness Tsweetness Basic taste sweet
Sourness Tsourness Basic taste sour
Saltiness Tsaltiness Basic taste salt
Umami Tumami Basic taste umami
Roasted Sesame Seed Froastedsesameseed Flavour of roasted sesame seed
Popcorn Fpopcorn Flavour of fresh popcorn
Texture (in mouth)
Oiliness Teoiliness Fatty, oily sensation
Grittiness Tegrittiness Gritty perception from peel/shell
3.6. Instrumental Measurements
Instrumental measurements (colour, viscosity and rancidity) were performed on all 28 samples
(four samples at 7 different time points) plus replicates, see Section 3.4.
Colour measurements were performed using a spectrophotometer (Konica Minolta CM-700d)
by measuring L*-, a*-, and b*-values, where L* corresponds to the lightness, a* to the red-green scale
(red is positive and green negative) and b* to the yellow-blue scale (yellow is positive and blue is
negative) [27].
Rheology is the study of the deformation and flow of materials and can describe the properties
of materials, ranging from liquids to elastic solids. One common rheological method is the
measurement of viscosity. In this study, the viscosities of the samples were measured using a
rotational viscometer (Brookfield DVII+, AMETEK Brookfield Inc., USA) equipped with an S1 spider.
The measurements of rancidity were performed using Thiobarbituric acid reactive substances
(TBAR). For these analyses, a Lipid Peroxidation (MDA, Malonaldehyde) Assay Kit (catalogue
number MAK085, Sigma-Aldrich) was used for colorimetric assay at λ = 532 nm. The frozen samples
stored at −80 °C were thawed before analysis. Since the samples were a mixture of shell parts and soft
parts, a stainless-steel garlic press was used to obtain a more homogeneous material. 1.2 mg of the
material was weighed into a microcentrifuge vial (three replicates per sample) and centrifuged at
16,000 g for 30 min. 10 μl of the supernatant was transferred into a microcentrifuge vial and gently
mixed with 500 μL of 42 mM sulfuric acid. 125 μL of phosphotungstic acid solution was then added
and mixed by vortexing. The vial was then incubated at room temperature for 5 min before
centrifuging at 13,000 g for 3 min. The pellet was resuspended on ice with water/Butylated hydroxy
toluene (100 μl/2 μl) solution and the volume was adjusted to 200 μL with water. A 0.1 M MDA-
solution was prepared for the standard calibration curve. This was further diluted into a 0.2 mM

Foods 2020, 9, 791 7 of 16
MDA standard solution and 0, 2, 4, 6, 8 and 10 μL of the 0.2 mM MDA standard solution were added
to separate microcentrifuge tubes. The volume in each vial was adjusted by the addition of water to
200 μL. This generated 0 (blank), 4, 8, 12, 16 and 20 nmole standards. To form the MBA-TBA adduct,
600 μL of a TBA solution was added to each vial containing standard and sample followed by
incubation at 95 °C for 60 min. After this, the vials were cooled in an ice bath for 10 min. 200 μL from
each vial was pipetted into 96-well plates for analysis in a plate reader for colorimetric assay at λ =
532 nm.
3.7. Statistical Analyses
Data were analysed by calculating mean values and standard deviations. The data were further
subjected to two-way analysis of variance (ANOVA) with samples and measurements as fixed effects.
Significant differences (p < 0.05) between samples were calculated via the Tukey’s Post Hoc pairwise
comparison test. Results were correlated by Pearson correlation. Regression analysis was performed
where the design variables were independent and the measurements were dependent factors (IBM
SPSS, version 26). Finally, principal component analysis (PCA; Panel Check V 1.4.2, Nofima, Norway)
was performed to give an overview of the results.
4. Results
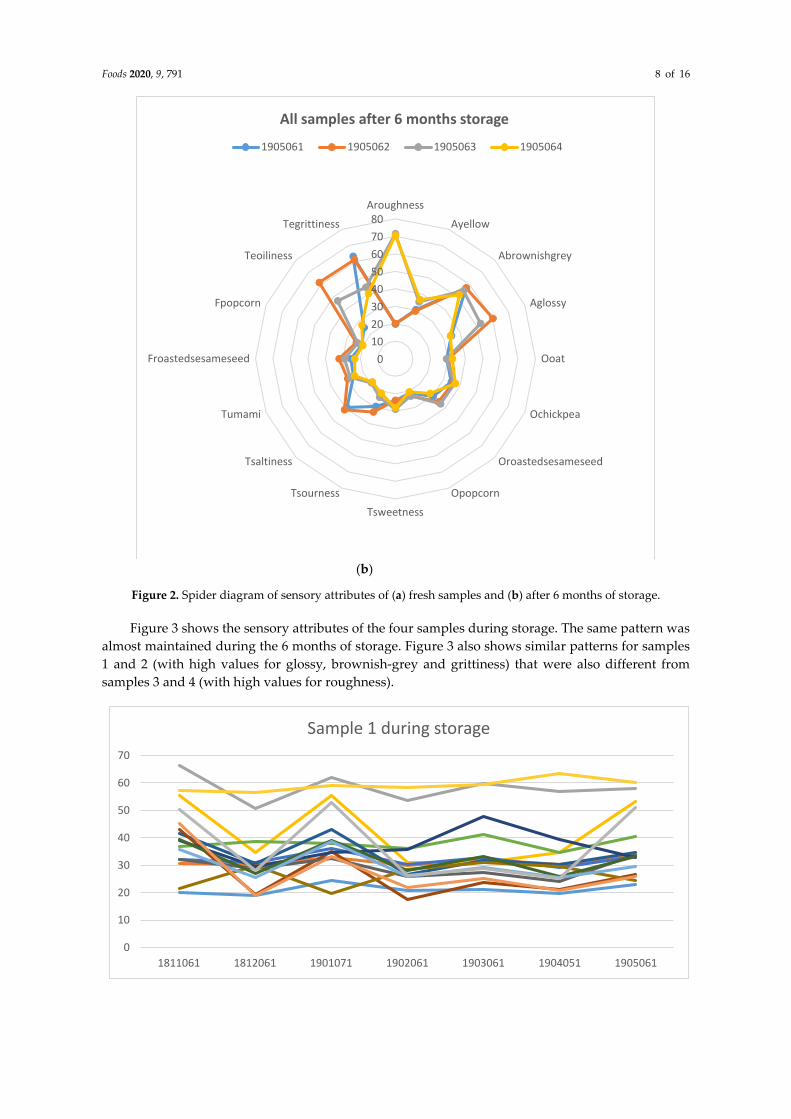
All the insect food samples were analysed during the same week. Figure 2 shows the sensory
attributes of (a) fresh samples and (b) after 6 months of storage. In both fresh and stored samples, the
particle size in the attribute “appearance of roughness” was detected, where samples 3 and 4 were
perceived as having a statistically significantly higher roughness and also contained the coarsely
chopped mealworms. The two samples with higher salt content, samples 1 and 2, were also perceived
as significantly saltier. Samples 2 and 3 were perceived as having a significantly higher degree of
oiliness, which became more apparent after 6 months of storage. These two samples had a higher oil
content. During storage, the odours and flavours of popcorn and roasted sesame seed decreased
significantly in all four samples. The decrease was largest at the beginning of the storage.
(a)
0
10
20
30
40
50
60
70
80Aroughness
Ayellow
Abrownishgrey
Aglossy
Ooat
Ochickpea
Oroastedsesameseed
Opopcorn
Tsweetness
Tsourness
Tsaltiness
Tumami
Froastedsesameseed
Fpopcorn
Teoiliness
Tegrittiness
All fresh samples
1811061 1811062 1811063 1811064
Foods 2020, 9, 791 8 of 16
(b)
Figure 2. Spider diagram of sensory attributes of (a) fresh samples and (b) after 6 months of storage.
Figure 3 shows the sensory attributes of the four samples during storage. The same pattern was
almost maintained during the 6 months of storage. Figure 3 also shows similar patterns for samples
1 and 2 (with high values for glossy, brownish-grey and grittiness) that were also different from
samples 3 and 4 (with high values for roughness).
0
10
20
30
40
50
60
70
80Aroughness
Ayellow
Abrownishgrey
Aglossy
Ooat
Ochickpea
Oroastedsesameseed
Opopcorn
Tsweetness
Tsourness
Tsaltiness
Tumami
Froastedsesameseed
Fpopcorn
Teoiliness
Tegrittiness
All samples after 6 months storage
1905061 1905062 1905063 1905064
0
10
20
30
40
50
60
70
1811061 1812061 1901071 1902061 1903061 1904051 1905061
Sample 1 during storage

Foods 2020, 9, 791 9 of 16
Figure 3. The perceived sensory attributes of all four samples when fresh and after 1, 2, 3, 4, 5 and 6
months of storage.
0
10
20
30
40
50
60
70
1811062 1812062 1901072 1902062 1903062 1904052 1905062
Sample 2 during storage
0
10
20
30
40
50
60
70
80
1811063 1812063 1901073 1902063 1903063 1904053 1905063
Sample 3 during storage
0
10
20
30
40
50
60
70
80
90
1811064 1812064 1901074 1902064 1903064 1904054 1905064
Sample 4 during storage

Foods 2020, 9, 791 10 of 16
Table 5 shows the mean values for viscosity, colour and TBAR for the samples when fresh and
during six months of storage. The values of viscosity can be seen as an indication of the samples being
very inhomogeneous. There were also very few significant differences. Colour measured by L-value
seems higher for smaller particles (samples 1 and 2) in Table 5, and all samples differed significantly
at the sample level. The difference between particle size was significant for b*-values. The yellow
appearance was significantly lower for two samples (1 and 2; Figure 2). Table 5 also shows that there
was very little change during storage for up to 6 months in the packages at room temperature, which
is supported by the low change in TBAR values over time.
Table 5. Mean values and standard deviations of viscosity, colour (L*, a* and b*) and TBAR.
Sample Colour TBAR μg/g
Viscosity (mPas) L* a* b*
181106-1 131.2 ± 25.7 51.1±0.4 4.1 ± 0.1 12.6 ± 0.2 5.08 ± 0.97
181206-1 88.0 ± 15.4 52.3 ± 0.8 3.9 ± 0.1 12.5 ± 0.4 6.81 ± 1.41
190107-1 56.8 ± 17.0 52.8 ± 1.3 3.8 ± 0.1 11.6 ± 0.3 6.13 ± 3.08
190206-1 226.4 ± 26.8 51.7 ± 0.3 4.3 ± 0.2 13.1 ± 0.9 6.29 ± 1.80
190306-1 359.2 ± 73.8 51.4 ± 1.1 4.1 ± 0.4 12.8 ± 0.7 7.53 ± 4.18
190405-1 27.2 ± 2.8 54.6 ± 0.3 3.8 ± 0.1 12.0 ± 0.2 6.25 ± 0.79
190506-1 108.0 ± 2.4 53.0 ± 0.4 3.8 ± 0.2 12.3 ± 0.5 6.17 ± 0.42
181106-2 531.2 ± 86.2 48.8 ± 0.5 4.7 ± 0.1 13.2 ± 0.5 3.48 ± 0.60
181206-2 453.6 ± 66.9 48.4 ± 0.2 4.7 ± 0.3 13.1 ± 0.7 5.04 ± 0.32
190107-2 429.6 ± 96.6 47.5 ± 1.0 4.7 ± 0.1 12.3 ± 0.5 4.12 ± 0.90
190206-2 479.2 ± 70.2 47.9 ± 0.6 5.4 ± 0.1 14.3 ± 0.5 3.44 ± 0.57
190306-2 392.8 ± 61.7 46.5 ± 0.2 4.5 ± 0.1 12.0 ± 0.4 3.96 ± 1.16
190405-2 403.2 ± 55.9 47.3 ± 0.1 4.9 ± 0.3 12.9 ± 0.7 3.48 ± 1.25
190506-2 435.2 ± 50.7 47.3 ± 0.5 4.6 ± 0.2 12.5 ± 0.4 4.40 ± 1.20
181106-3 468.0 ± 36.3 42.2 ± 1.1 5.2 ± 0.2 13.8 ± 1.0 2.32 ± 0.30
181206-3 560.8 ± 58.8 39.5 ± 1.9 4.3 ± 0.1 9.6 ± 1.0 3.20 ± 0.84
190107-3 562.4 ± 135.2 42.2 ± 0.5 5.1 ± 0.1 13.2 ± 0.5 3.80 ± 0.90
190206-3 407.2 ± 86.6 40.4 ± 0.1 5.3 ± 0.2 12.2 ± 0.3 3.44 ± 0.54
190306-3 567.2 ± 94.8 41.4 ± 0.1 4.4 ± 0.6 10.9 ± 1.3 6.09 ± 1.32
190405-3 552.8 ± 164.2 40.0 ± 1.7 4.7 ± 0.3 12.0 ± 1.6 4.88 ± 0.85
190506-3 504.0 ± 195.6 40.9 ± 0.2 4.7 ± 0.4 11.2 ± 0.7 4.60 ± 0.18
181106-4 558.4 ± 98.8 44.7 ± 1.4 4.4 ± 0.2 12.4 ± 0.9 2.76 ± 0.83
181206-4 585.6 ± 10.5 44.2 ± 0.2 4.2 ± 0.2 12.8 ± 1.4 4.56 ± 0.24
190107-4 557.6 ± 71.2 43.7 ± 0.4 3.9 ± 1.2 11.4 ± 2.2 4.48 ± 0.07
190206-4 111.2 ± 29.6 45.6 ± 1.2 4.4 ± 0.2 12.8 ± 0.4 4.24 ± 0.66
190306-4 370.4 ± 20.7 40.8 ± 0.5 4.7 ± 0.1 12.0 ± 0.6 2.64 ± 1.07
190405-4 607.2 ± 245.4 40.7 ± 1.6 4.2 ± 0.2 11.1 ± 1.4 3.76 ± 1.00
190506-4 89.6 ± 5.5 45.3 ± 0.4 4.3 ± 0.3 10.8 ± 0.8 4.84 ± 0.28
Figure 4 shows a PCA plot of the mean values over time for the four samples, showing 97.6% of
the variance in the resulting data. The four samples are well distributed in each of the four quadrants.
Along the first principal component, showing 75.0% of the variance, samples 3 and 4 (coarsely
chopped mealworm and low salt content) are plotted close to roughness and opposite samples 1 and
2 (finely grated mealworm and high salt content). The second principal component, representing
22.6% of the variance, was TBAR, with samples 1 and 4 (with low oil content) showing opposite
glossy appearance, oiliness and viscosity, which are instead close to samples 2 and 3 (with high oil
content). Overall, the results show that the design had a clear impact on the measured parameters.
The results from the PCA are supported by the regression analysis, which showed that all the
design parameters had a higher impact than storage time. Oil and salt contents had the largest impact
on most attributes, but particle size and rosemary also had significant impacts, mainly on the

Foods 2020, 9, 791 11 of 16
appearance attributes. The resulting sensorial, rheological, colour and TBAR values were influenced
by the design factors to a higher extent than storage time. The only parameters being significantly
influenced by the storage time were the odour and flavour attributes of oat, popcorn and roasted
sesame seed.
Figure 4. A Principal component analysis (PCA) plot of the four samples.
The Pearson correlations also support the PCA results. Table 6 shows that viscosity was
negatively correlated to TBAR values. Tsaltiness was positively correlated to Abrownish-grey and
Tsourness and negatively correlated to Tsweetness, Ayellow and Aroughness. Further, there was a
high correlation between the odour and flavour attributes of popcorn and roasted sesame seed.
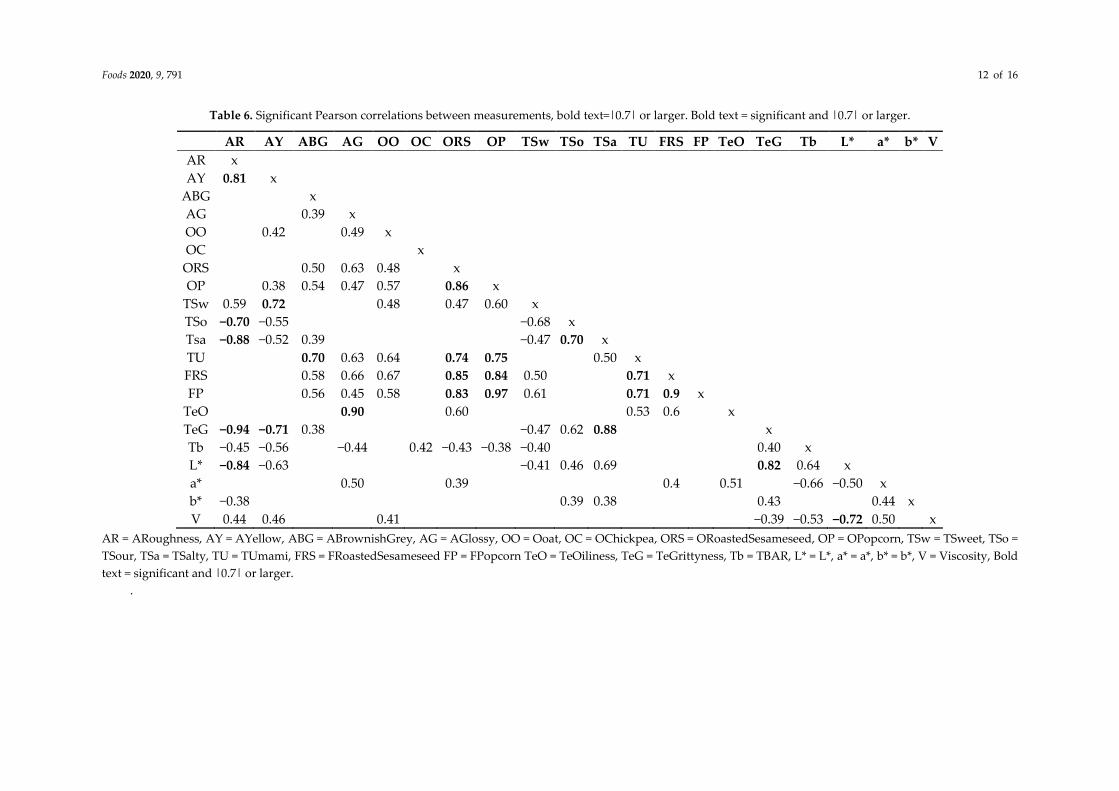
Foods 2020, 9, 791 12 of 16
Table 6. Significant Pearson correlations between measurements, bold text=|0.7| or larger. Bold text = significant and |0.7| or larger.
AR AY ABG AG OO OC ORS OP TSw TSo TSa TU FRS FP TeO TeG Tb L* a* b* V
AR x
AY 0.81 x
ABG x
AG 0.39 x
OO 0.42 0.49 x
OC x
ORS 0.50 0.63 0.48 x
OP 0.38 0.54 0.47 0.57 0.86 x
TSw 0.59 0.72 0.48 0.47 0.60 x
TSo −0.70 −0.55 −0.68 x
Tsa −0.88 −0.52 0.39 −0.47 0.70 x
TU 0.70 0.63 0.64 0.74 0.75 0.50 x
FRS 0.58 0.66 0.67 0.85 0.84 0.50 0.71 x
FP 0.56 0.45 0.58 0.83 0.97 0.61 0.71 0.9 x
TeO 0.90 0.60 0.53 0.6 x
TeG −0.94 −0.71 0.38 −0.47 0.62 0.88 x
Tb −0.45 −0.56 −0.44 0.42 −0.43 −0.38 −0.40 0.40 x
L* −0.84 −0.63 −0.41 0.46 0.69 0.82 0.64 x
a* 0.50 0.39 0.4 0.51 −0.66 −0.50 x
b* −0.38 0.39 0.38 0.43 0.44 x
V 0.44 0.46 0.41 −0.39 −0.53 −0.72 0.50 x
AR = ARoughness, AY = AYellow, ABG = ABrownishGrey, AG = AGlossy, OO = Ooat, OC = OChickpea, ORS = ORoastedSesameseed, OP = OPopcorn, TSw = TSweet, TSo =
TSour, TSa = TSalty, TU = TUmami, FRS = FRoastedSesameseed FP = FPopcorn TeO = TeOiliness, TeG = TeGrittyness, Tb = TBAR, L* = L*, a* = a*, b* = b*, V = Viscosity, Bold
text = significant and |0.7| or larger.
.

Foods 2020, 9, 791 13 of 16
5. Discussion
As early as 1975, Meyer-Rochow pointed out that insects could be used as a protein source for
humans [28], however even though insects seem to be a sustainable alternative compared to livestock
[29], this is not enough for consumers. Food products need to be made with appealing sensory
characteristics in order for consumers to buy and eat them; in addition, they must maintain their
quality during storage. Sensory determination of shelf life in food products is more or less routine in
product development [30]. In this work, we processed yellow mealworms by using traditional food
techniques such as chopping, mixing and heat treatment in a retort. The procedures were performed
in order to reduce the visibility of the mealworms and to create a model product advised by the
results of a focus group in a previous study [6]. The group suggested using ground insects as an
ingredient in meat dishes such as sausages and hamburgers. Sausages typically have a fat content
between 25% and 30%. Our products contained 12.5% or 37.5% fat, which can be regarded as levels
of fat that are commonly used in food products today. The ingredients were included in an
experimental design and varied according to input from the focus group. The number of product
samples had to be kept low since the total number of samples was large due to the analysis during
storage. The study included all 28 samples consisting of the four samples from the experimental
design being taken out for analysis at seven different time points during the storage time. A full
factorial design would give a larger number of samples from the experimental design [20,31];
however, the number of time points for analysis would then have to decrease.
It was clear from the regression analysis that all the factors in the experimental design influenced
the products to a larger extent than the storage time. The results show that the particle size has an
impact on the visual appearance of the product. We found that smaller particles, that is finely grated
mealworm in samples 1 and 2, had higher values of brownish-grey appearance independent of being
fresh or during storage time. However, the samples with larger particles, samples 3 and 4 (coarsely
ground mealworm), were perceived as having high values of roughness. The results in this study are,
with a few exceptions, in agreement with the results in a previous study [11], where particle size had
a large impact on the evaluated parameters, such as brownish-grey appearance. Our results show
that the brownish-grey colour was influenced by the particle size and did not change during storage.
This is in line with Tonneijick-Srpová et al. [19], who found that browning of minced mealworms
could be reduced by blanching in air-tight packaging.
The large change in oil content from 12.5% to 37.5% affected the glossy appearance and the
mouthfeel of oiliness. The samples with a higher oil content were perceived to be both more glossy
and more oily than the others.
The two samples with higher salt contents were perceived as saltier; here, we cannot detect the
effect of particle size as this coincides with the salt levels. Larger liquid volumes in the product could
result in a faster release of salt in the mouth, which we were not able to detect in this experiment.
Rosemary level had an impact, mainly on the appearance attributes. This was indicated in a pilot
study by Wendin et al. [11], where rosemary seemed to influence both colour and separation. The
rosemary extract was added as an antioxidant and was assumed to reduce possible oxidation [32,33].
Nevertheless, no rancidity was perceived by the panel, nor was it detected in the TBAR values. In our
previous work, we used the addition of 0%, 0.1% and 0.3% of rosemary extract, where rosemary had
a positive impact in preventing rancidity and, as already mentioned, changes in colour and phase
separation in samples stored in vacuum-sealed packages in the fridge (5 °C) for 15 days. All four
products in this study were very stable during the 6-month storage time, indicating an effective
process and well-functioning packaging material.
During storage there was, however, a significant decrease in some of the volatile odour
compounds. The sensory panel clearly detected a drop in the odours and flavours of popcorn, oat
and roasted sesame seed. This was supported by the regression analysis, which showed that storage
time had a significant influence on these sensory attributes. The decrease could probably be related
to changes in the chemical composition of volatiles during storage [34].

Foods 2020, 9, 791 14 of 16
The results, measured by sensory analysis, TBAR values, colourimetry and viscosity, clearly
show that the food products packaged in TRC 200 packages and processed in a retort stayed stable
during a storage time of 6 months at room temperature, with the exception of a decrease in the odour
and flavour attributes of popcorn and roasted sesame seed.
6. Conclusions
It can be concluded that the measured sensory properties of viscosity, rancidity and colour were
impacted mainly by the design parameters of salt and oil content, and to a smaller extent by particle
size and the addition of an antioxidant. Storage time of the processed and packaged insect products
influenced only the odour and flavour attributes of popcorn and roasted sesame seed. This means
that products based on insects are stable during storage when processed in a retort and packaged in
TRC packages.
Author Contributions: Conceptualization, K.W. and M.L.; Methodology, K.W., L.M. and H.D.; Validation, M.L.;
Formal Analysis, K.W.; Investigation, K.W.; Resources, K.W.; Data Curation, K.W. and M.L.; Writing—Original
Draft Preparation, M.L.; Writing—Review and Editing, K.W. and M.L.; Visualization, K.W. and M.L.; Project
Administration, K.W.; Funding Acquisition, K.W. All authors have read and agreed to the published version of
the manuscript.
Funding: This research was funded by The Knowledge Foundation (KK-stiftelsen) grant number 20170141*.
SLU—Swedish University of Agricultural Sciences faculty (to M.L.) is greatly acknowledged for financial
support.
Acknowledgments: Thanks to the project group members for discussion, analyses, raw materials, processing,
packaging and inspiration: Peter Andersson, Viktoria Olsson, Johan Berg, Karina Birch, Fanny Cedergaardh,
Fredrik Davidsson, Sarah Forsberg, Johanna Gerberich, Åsa Josell, Ingemar Jönsson, Susanne Rask, Sofia Stüffe
and Per Magnusson.
Conflicts of Interest: The authors declare no conflicts of interest. The funders had no role in the design of the
study; in the collection, analyses, or interpretation of data; in the writing of the manuscript, or in the decision to
publish the results.
References
1. van Huis, A. Potential of insects as food and feed in assuring food security. Annu. Rev. Entomol. 2013, 58,
563–583.
2. VanHuis, A.; Van Itterbeeck, J.; Klunder, H.; Mertens, E.; Halloran, A.; Muir, G.; Vantomme, P. Edible
Insects: Future Prospects for Food and Feed Security (No. 171); Food and Agriculture Organization of the United
Nations: Rome, Italy, 2013.
3. Zhao, X.; Vázquez-Gutiérrez, J.L.; Johansson, D.P.; Landberg, R.; Langton, M. Yellow mealworm protein
for food purposes-extraction and functional properties. PLoS ONE 2016, 11.
doi:10.1371/journal.pone.0147791.
4. Elhassan, M.; Wendin, K.; Olsson, V.; Langton, M. Quality Aspects of Insects as Food—Nutritional,
Sensory, and Related Concepts. Foods 2019, 8, 1–14.
5. Tan, H.S.G.; Fischer, A.R.; Tinchan, P.; Stieger, M.; Steenbekkers, L.P.A.; van Trijp, H.C. Insects as food:
Exploring cultural exposure and individual experience as determinants of acceptance. Food Qual. Prefer.
2015, 42, 78–89.
6. Wendin, K.; Norman, C.; Forsberg, S.; Langton, M.; Davidsson, F.; Josell, Å.; Prim, M.; Berg, J. Eat’em or
not? Insects as a culinary delicacy. In Proceedings of the 10th International Conference on Culinary Arts
and Sciences, Copenhagen, Denmark, 6–7 July 2017; Mikkelsen, B., Ofei, K.T., Olsen Tvedebrink, T.D.,
Quinto Romano, A., Sudzina, F., Eds.; Aalborg University: Copenhagen, Denmark, 2017; pp. 100–106; ISBN
978-87-970462-0-3.
7. Videbaek, P.N.; Grunert, K.G. Disgusting or delicious? Examining attitudinal ambivalence towards
entomophagy among Danish consumers. Food Qual. Prefer. 2020, 83, 103913.
8. Azzollini, D.; Derossi, A.; Fogliano, V.; Lakemond, C.M.M.; Severini, C. Effects of formulation and process
conditions on microstructure, texture and digestibility of extruded insect-riched snacks. Innov. Food Sci.
Emerg. Technol. 2018, 45, 344–353.
Foods 2020, 9, 791 15 of 16
9. Yi, L.; Lakemond, C.M.; Sagis, L.M.; Eisner-Schadler, V.; van Huis, A.; van Boekel, M.A. Extraction and
characterisation of protein fractions from five insect species. Food Chem. 2013, 141, 3341–3348.
10. Lawless, H.; Heymann, H. Sensory Evaluation of Food–Principles and Practices, 2nd ed.; Springer: New York,
NY, USA, 2010.
11. Wendin, K.; Olsson, V.; Langton, M. Mealworms as Food Ingredient—Sensory Investigation of a Model
System. Foods 2019, 8, 319. doi:10.3390/foods8080319.
12. Chen, N.; Zhao, M.; Chassenieux, C.; Nicolai, T. The effect of adding NaCl on thermal aggregation and
gelation of soy protein isolate. Food Hydrocoll. 2017,70, 88–95.
13. Zeb, A.; Ullah, F. A simple spectrophotometric method for the determination of thiobarbituric acid reactive
substances in fried fast foods. J. Anal. Methods Chem. 2016, 1–5. doi:10.1155/2016/9412767.
14. Khan, M.A.; Parrish, C.C.; Shahidi, F. Effects of mechanical handling, storage on ice and ascorbic acid
treatment on lipid oxidation in cultured Newfoundland blue mussel (Mytilus edulis). Food Chem. 2006, 99,
605–614.
15. Morato, P.N.; Rodrigues, J.B.; Moura, C.S.; Silva, F.G.D.; Esmerino, E.A.; Cruz, A.G.; Lollo, P.C.B. Omega-
3 enriched chocolate milk: A functional drink to improve health during exhaustive exercise. J. Funct. Foods
2015, 14, 676–683.
16. Dobermann, D.; Swift, J.A.; Field, L.M. Opportunities and hurdles of edible insects for food and feed. Nutr.
Bull. 2017, 42, 293–308.
17. Simpson, R.; Jiménez, D.; Almonacid, S.; Nuñez, H.; Pinto, M.; Ramírez, C.; Vega-Castro, O.; Fuentes, L.;
Angulo, A. Assessment and outlook of variable retort temperature profiles for the thermal processing of
packaged foods: Plant productivity, product quality, and energy consumption. J. Food Eng. 2020, 275,
109839.
18. Kõrge, K.; Laos, K. The influence of different packaging materials and atmospheric conditions on the
properties of pork rinds. J. Appl. Packag. Res. 2019, 11, 1.
19. Tonneijck-Srpová, L.; Venturini, E.; Humblet-Hua, K.N.P.; Bruins, M.E. Impact of processing on enzymatic
browning and texturization of yellow mealworms. J. Insects Food Feed 2019, 5, 267–276.
20. Naes, T.; Nyvold, T.E. Creative design—An efficient tool for product development. Food Qual. Prefer. 2004,
15, 97–104.
21. Teixeira, A.; Almeida, S.; Pereira, E.; Mangachaia, F.; Rodrigues, S. Physicochemical characteristics of sheep
and goat pâtés. differences between fat sources and proportions. Heliyon 2019, 5, e02119.
22. Available online: http://orklafoodsrs.se/147585/ (assessed on 3 June 2020).
23. Available online: https://ods.od.nih.gov/factsheets/Iron-HealthProfessional/ (accessed on 22 April 2020).
24. Available online: https://ods.od.nih.gov/factsheets/Zinc-HealthProfessional/ (accessed on 22 April 2020).
25. Food Processing Technology; Chapter 12 Heat sterilisation; Elsevier Ltd.: Amsterdam, The Netherlands, 2017.
doi:10.1016/B978-0-08-101907-8.00001-8.
26. ISO Standard 8586-2:2008. Sensory Analysis-General Guidance for the Selection, Training and Monitoring of
Assessors-Part 2: Expert Sensory Assessors; International Organization for Standardization: Genève,
Switzerland, 2008.
27. CIE. Technical Report: Colorimetry; CIE: Washington, DC, USA, 2004.
28. Meyer-Rochow, V.B. Can insects help to ease the problem of world food shortage. Search 1975, 6, 261–262.
29. Rumpold, B.A.; Schlüter, O.K. Potential and challenges of insects as an innovative source for food and feed
production. Innov. Food Sci. Emerg. Technol. 2013, 17, 1–11.
30. Freitas, M.A.; Costa, J.C. Shelf life determination using sensory evaluation scores: A general Weibull
modeling approach. Comput. Ind. Eng. 2006, 51, 652–670.
31. Box, G.E.P.; Hunter, W.G.; Hunter, J.S. Statistics for Experimenters, an Introduction to Design, Data Analysis,
and Model Building; John Wiley and Sons: New York, NY, USA, 1986.
32. Erkan, N.; Ayranci, G.; Ayranci, E. Antioxidant activities of rosemary (Rosmarinus officinalis L.) extract,
blackseed (Nigella sativa L.) essential oil, carnosic acid, rosmarinic acid and sesamol. Food Chem. 2008, 110,
76–82.

Foods 2020, 9, 791 16 of 16
33. Aruoma, O.I.; Halliwell, B.; Aeschbach, R.; Löligers, J. Antioxidant and pro-oxidant properties of active
rosemary constituents: Carnosol and carnosic acid. Xenobiotica 1992, 22, 257–268.
34. Jensen, S.; Oestdal, H.; Skibsted, L.H.; Larsen, E.; Thybo, A.K. Chemical changes in wheat pan bread during
storage and how it affects the sensory perception of aroma, flavour, and taste. J. Cereal Sci. 2011, 53, 259–
268.
© 2020 by the authors. Licensee MDPI, Basel, Switzerland. This article is an open access
article distributed under the terms and conditions of the Creative Commons Attribution
(CC BY) license (http://creativecommons.org/licenses/by/4.0/).