article predicting post stroke somatosensory function from
TRANSCRIPT

Brain Sci. 2021, 11, 1388. https://doi.org/10.3390/brainsci11111388 www.mdpi.com/journal/brainsci
Article
Predicting Post‐Stroke Somatosensory Function from
Resting‐State Functional Connectivity: A Feasibility Study
Xiaoyun Liang 1,2,*, Chia‐Lin Koh 1,3,4, Chun‐Hung Yeh 5,6,7, Peter Goodin 1, Gemma Lamp 1,8, Alan Connelly 5
and Leeanne M. Carey 1,3
1 Neurorehabilitation and Recovery, Florey Institute of Neuroscience and Mental Health, Heidelberg,
Melbourne, Vic 3084, Australia; [email protected] (C.‐L.K.); [email protected] (P.G.);
[email protected] (G.L.); [email protected] (L.M.C.) 2 Victorian Infant Brain Studies (VIBeS) Group, Murdoch Children’s Research Institute, Melbourne, Vic 3052,
Australia 3 Department of Occupational Therapy, Social Work and Social Policy, School of Allied Health Human
Services and Sport, La Trobe University, Melbourne, Vic 3086, Australia 4 Department of Occupational Therapy, College of Medicine, National Cheng Kung University, Tainan 701,
Taiwan 5 Imaging Division, Florey Institute of Neuroscience and Mental Health, Melbourne, Vic 3084, Australia;
[email protected] (C.‐H.Y.); [email protected] (A.C.) 6 Institute for Radiological Research, Chang Gung University and Chang Gung Memorial Hospital, Taoyuan
33302, Taiwan 7 Department of Psychiatry, Chang Gung Memorial Hospital, Linkou Medical Center, Taoyuan 33305,
Taiwan 8 Department of Psychology and Counselling, School of Psychology and Public Health, La Trobe University,
Melbourne, Vic 3086, Australia
* Correspondence: [email protected]
Abstract: Accumulating evidence shows that brain functional deficits may be impacted by damage
to remote brain regions. Recent advances in neuroimaging suggest that stroke impairment can be
better predicted based on disruption to brain networks rather than from lesion locations or volumes
only. Our aim was to explore the feasibility of predicting post‐stroke somatosensory function from
brain functional connectivity through the application of machine learning techniques. Somatosen‐
sory impairment was measured using the Tactile Discrimination Test. Functional connectivity was
employed to model the global brain function. Behavioral measures and MRI were collected at the
same timepoint. Two machine learning models (linear regression and support vector regression)
were chosen to predict somatosensory impairment from disrupted networks. Along with two fea‐
ture pools (i.e., low‐order and high‐order functional connectivity, or low‐order functional connec‐
tivity only) engineered, four predictive models were built and evaluated in the present study. Forty‐
three chronic stroke survivors participated this study. Results showed that the regression model
employing both low‐order and high‐order functional connectivity can predict outcomes based on
correlation coefficient of r = 0.54 (p = 0.0002). A machine learning predictive approach, involving
high‐ and low‐order modelling, is feasible for the prediction of residual somatosensory function in
stroke patients using functional brain networks.
Keywords: functional connectivity; machine learning; regression; predictive modelling; stroke;
somatosensory function
1. Introduction
Stroke is now the second largest cause of death and disability, with a lifetime risk of
1 in 4 [1]. There are more than 80 million people living with the consequences of stroke
worldwide [1]. A good recovery of brain function, and motor and somatosensory function
in particular, is crucial for regaining independence and quality of life for most people who
Citation: Liang, X.; Koh, C.‐L.;
Yeh, C.‐H.; Goodin, P.; Lamp, G.;
Connelly, A.; Carey, L.M. Predicting
Post‐Stroke Somatosensory Function
from Rest‐ing‐State Functional
Connectivity: A Feasibility Study.
Brain Sci. 2021, 11, 1388.
https://doi.org/10.3390/
brainsci11111388
Academic Editors: Xiaoping Hu and
Muthuraman Muthuraman
Received: 30 August 2021
Accepted: 07 October 2021
Published: 22 October 2021
Publisher’s Note: MDPI stays neu‐
tral with regard to jurisdictional
claims in published maps and institu‐
tional affiliations.
Copyright: © 2021 by the authors. Li‐
censee MDPI, Basel, Switzerland.
This article is an open access article
distributed under the terms and con‐
ditions of the Creative Commons At‐
tribution (CC BY) license (http://crea‐
tivecommons.org/licenses/by/4.0/).

Brain Sci. 2021, 11, 1388 2 of 14
have experienced a stroke [2–4]. However, there has been rare success in predicting pa‐
tient’s recovery and outcome using clinical assessment alone [4,5].
Intuitively, neurological impairment following stroke is caused by damage to brain
regions. Following this perspective, previous studies have mainly focused on the map‐
ping of symptoms to a focal lesion. However, accumulating evidence has demonstrated
that brain functional deficits can extend to remote connected brain areas [6,7]. This is con‐
sistent with recent evidence from us that structural connectivity remote from lesions cor‐
relates with somatosensory outcome post‐stroke [8].
Neuroimaging biomarkers have clinical significance for research translation as they
can provide clinically useful information when planning the personalized rehabilitation
of a patient. While the benefits of employing neuroimaging predictors of outcome and
recovery have been highlighted in a recent consensus statement, the relative lack of diag‐
nostic and predictive biomarkers for somatosensory outcomes was also identified [6].
Functional biomarkers, including task‐related activation and resting‐state functional con‐
nectivity were considered as a developmental priority [6]. Predictive modelling of the as‐
sociation between somatosensory outcome and functional brain networks is indicated.
Brain connectomics is a field studying the topological characteristics of the brain net‐
work or ‘connectome’—the comprehensive map of the neural elements (nodes) and their
inter‐connections (edges) that constitute the brain. At a macroscale, two types of connec‐
tomes are commonly used, i.e., the functional and structural connectome using functional
MRI (fMRI) and diffusion‐weighted MRI (dMRI), respectively [9]. Increasing evidence
supports that the brain should be modelled as an ensemble of functional networks rather
than focusing on local functional brain areas. Human imaging data show strong associa‐
tions between connectivity and outcome after stroke [8,10–13].
Resting‐state functional connectivity has been emerging as a powerful tool to map
the functional networks across the whole brain using either Blood‐oxygen‐level depend‐
ent (BOLD) fMRI [14] or arterial spin labelling perfusion fMRI [15,16]. Resting‐state func‐
tional connectivity provides a direct and simple measure of regional interaction without
any explicit task requirements, as is needed for task‐based fMRI. While resting‐state func‐
tional connectivity measures are mostly used at the group level, they could also provide
personalized information at the individual level, which provides the potential of using
single‐subject data for individual diagnosis and prognosis. Distributed brain networks are
shown to be involved in processing somatosensory information, including both hemi‐
spheres, primary and secondary somatosensory regions, and subcortical areas [17]. The
extent to which an individual may experience interruption to one or more regions within
this distributed brain network after stroke likely impacts the nature and severity of soma‐
tosensory deficits.
Certain brain subnetworks have been demonstrated to be compromised in stroke
survivors following cortical or subcortical lesions, with dysfunction manifested in behav‐
ioral impairment [18]. For example, in our previous studies using task‐related brain acti‐
vation in stroke survivors with impaired touch sensation, evaluated using the Tactile Dis‐
crimination Test (TDT) [19], we showed distinct differences in patterns of brain activation
between stroke survivors with varying lesion location [20] and in age‐matched healthy
controls [21] whilst performing a touch discrimination task in the scanner. We have also
applied univariate analyses to explore the relationship between performance on the TDT
and functional brain networks, using both resting‐state and seed‐based functional con‐
nectivity [13,22].
However, to date we have not been able to predict residual somatosensory function
from interruption to brain networks, partly because of the complex interactions between
brain regions and the limitations in the current methods interrogating these effects. Meth‐
odologically, these limitations could be attributed to the following reasons:
Firstly, conventional resting‐state functional connectivity is the most popular tech‐
nique for measuring functional connectivity; this is also referred to as low‐order func‐
tional connectivity (LOFC) because it simply measures the temporal correlation of the

Brain Sci. 2021, 11, 1388 3 of 14
resting‐state fMRI time courses between any pair of brain regions. More recently, the con‐
cept of ‘high‐order’ functional connectivity (HOFC) has been proposed to measure the
“correlation of the correlation” [23,24]. In LOFC, each row (column) of the connectome
encodes the correlation of BOLD time series between one area to all the other areas in the
brain in a pairwise manner; in HOFC, each row (column) encodes the correlation between
one row (column) to every other row (column) of the LOFC. In this way HOFC is designed
to capture the important interactions among all related brain regions (e.g., the correlations
among different edges in a network), essentially characterizing the high‐order relation‐
ships between brain regions and networks by including global anatomical information.
As demonstrated in Zhang and colleagues’ work [23,24], HOFC has been shown to be
useful in providing ‘high‐level’ information for brain disease studies and for building pre‐
dictive models. Simultaneous estimation of both LOFC and HOFC might also be of value
[25].
Second, whole‐brain connectomics (region‐based or voxel‐wise) involves high‐di‐
mensional data, which essentially requires multivariate analysis. However, univariate
analysis has been predominantly employed for such investigations in previous studies
[13,26]. Therefore, it is expected that new insights into stroke recovery can be obtained by
employing machine learning techniques due to their multivariate capabilities.
In the current study, we aim to investigate whether the residual somatosensory func‐
tion of stroke survivors, estimated by TDT scores, can be predicted from resting‐state
functional connectivity using multivariate predictive modelling techniques. Given the ob‐
servation that brain functional and structural disruptions can extend to remote connected
brain areas [6–8], we hypothesize an association between post‐stroke residual somatosen‐
sory function and functional brain connectivity based on predictive modelling using ma‐
chine learning techniques, and that the strength of the relationship will be enhanced when
high‐order relationships are included. Specifically, we seek to identify the functional con‐
nectivity pathways that are closely associated with somatosensory impairment. This pre‐
liminary work might provide new insights to disruption of functional brain networks as‐
sociated with impaired somatosensory function after stroke, thereby advancing the foun‐
dation for the development of biomarkers of somatosensory recovery and novel therapeu‐
tic interventions in the future.
2. Materials and Methods
2.1. Participants
Participants were recruited for the Connecting New Networks for Everyday Contact
through Touch (CoNNECT) study (https://anzctr.org.au/Trial/Registration/TrialRe‐
view.aspx?id=364147,accessed date: 20/10/2021). Inclusion criteria included: (1) at least three months post first episode of stroke (ischaemic or haemorrhagic); (2) experiencing
somatosensory impairment in the upper limb; (3) medically stable; (4) able to give in‐
formed consent; (5) able to comprehend simple instructions; (6) right‐hand dominant. Ex‐
clusion criteria included: (1) a brainstem infarct; (2) previous neurological dysfunction; (3)
history of impaired hand function; (4) peripheral neuropathy in upper limbs; (5) evidence
of neglect on standard neuropsychological tests; (6) not suitable for MRI scanning. In‐
formed consent was obtained from all participants and all protocols were approved by
hospital and university Institutional Review Boards.
A total of 43 participants with chronic stroke were recruited, of which 2 were ex‐
cluded due to excessive head motion and 1 removed due to significant signal dropout in
the anterior region of the brain caused by an implant. As a result, 40 stroke survivors were
included in the present study. Demographic and clinical details of participants are pro‐
vided in Table 1.

Brain Sci. 2021, 11, 1388 4 of 14
Table 1. Demographics of the participants.
Stroke (n = 40)
Sex, F/M 11/29
Mean age, years (SD) 51.8 (13.2)
Stroke type, I/H 32/8
Stroke chronicity, mean months (SD) 18.6 (22.1)
Side of lesion, L/R 20/20
Lesion location, C/S/M 19/12/9
Lesion size (c.c.) [Q1, Q3] [12.5, 70.1]
TDT contralesional affected hand, mean (SD) * 22.6 (23.2)
TDT ipsilesional hand, mean (SD) 65.9 (18.6)
I = ischemia; H = Haemorrhage; C = cortical lesion; S = subcortical lesion; M = mixed cortical and
subcortical lesion; TDT = the Tactile Discrimination Test [19]; n = number of subjects; SD = stand‐
ard deviation; Q1 = lower quartile; Q3 = upper quartile. * Criterion of abnormality for the TDT is
60.25 Area Under the Curve (AUC). A score (AUC) greater than 60.25 indicates intact tactile dis‐
criminative sensibility (relative to normative data). Impaired tactile discrimination is suggested if
the area under the curve score is less than or equal to 60.25.
2.2. Tactile Discrimination
The TDT test was performed within 48 h of the MRI scan and 2‐weeks earlier. The
average scores of the two baseline measures were used [19]. Participants are required to
discriminate differences in finely graded plastic texture surfaces using the method of con‐
stant stimuli and a three‐alternative forced‐choice design. Five texture differences are each
sampled across five test runs (i.e., twenty‐five trials of triplet‐textures in total). The area
under the curve (AUC) score is then calculated to determine texture discrimination, after
accounting for chance responses. The TDT has age‐appropriate normative standards, high
test‐retest reliability, and good discriminative properties [19].
2.3. MRI Data Acquisition
All of the MRI data were collected on a 3T Siemens Tim Trio (Siemens, Erlangen,
Germany) with a 12‐channel head coil. Resting‐state BOLD fMRI data were acquired with
a gradient‐echo echo‐planar imaging (EPI) sequence using the following parameters:
TR/TE= 3000/30 ms, voxel size = 3 mm isotropic, number of slices = 44, matrix size = 72 ×
72, number of time points = 140. Participants were instructed to keep eyes closed and stay
awake during the scan, which was further confirmed when scans were completed.
Anatomical images were acquired with a three‐dimensional Magnetization‐Pre‐
pared‐Rapid‐Gradient‐Echo (MPRAGE) sequence, using the following parameters:
TR/TE/TI = 1900/2.55/900 ms, flip‐angle = 9°, 1 mm isotropic resolution, field‐of‐view = 256
× 256 mm2, 160 partitions. Two‐dimensional T2‐weighted fluid attenuation inverse recov‐
ery sequence (T2 FLAIR) images were acquired axially for delineation of infarcts, with the
following parameters: TR/TE = 6000/388 ms, voxel size = 0.5 × 0.5 × 3 mm3.
2.4. Lesion Mask Creation
Lesion Masks were manually drawn on 2D Axial FLAIR images using MRIcron
(https://www.nitrc.org/projects/mricron) by a trained neuroimaging researcher. These le‐
sion masks were quality‐checked and modified as necessary by an experienced neurolo‐
gist to ensure accurate delineation of the infarct.
2.5. Data Analysis
All of the MR image pre‐processing was conducted using the SPM8 toolbox
(https://www.fil.ion.ucl.ac.uk/spm/software/spm8/, accessed date: 02/09/2020) with the
following pre‐processing steps: (1) realigning the BOLD data; (2) co‐registering the BOLD

Brain Sci. 2021, 11, 1388 5 of 14
data obtained in step (1) to T2 FLAIR space; (3) co‐registering the lesion mask to T1 ana‐
tomical space; (4) applying segmentation‐normalization to T1 and lesion mask obtained
in step (3) by using the clinical toolbox for SPM (https://www.nitrc.org/projects/clini‐
caltbx/, accessed date: 03/10/2021); (4) co‐registering the BOLD data obtained in step (2) to
T1 space; (5) normalizing the BOLD data obtained in step (4) to MNI template; (6) smooth‐
ing the BOLD data obtained in step (5) with smoothing kernel of FWHM = [6 6 6]. Inde‐
pendent component analysis was then applied to pre‐processed fMRI data using FSL’s
Melodic tool (https://fsl.fmrib.ox.ac.uk/fsl, accessed date: 05/08/2021). Artifact‐related in‐
dependent components were manually identified and removed by applying FSL’s fsl‐reg‐
filt command.
2.6. Construction of Functional Connectomes
Initially, the automated anatomical labelling (AAL) template was employed to par‐
cellate the entire brain into 116 regions [27]. Subsequently, the cerebellum was excluded
due to the potential issue of low fidelity of signal measurement with BOLD signal from
cerebellum [28], thus yielding the 90‐region AAL parcellation. Region‐wise time courses
were calculated by averaging voxel‐wise time courses across all brain regions, followed
by the computation of connection strength by using Pearson correlation, yielding a con‐
nectivity matrix of size 90 × 90 for each subject. Firstly, LOFCs were constructed to meas‐
ure the relationship between brain region pairs using Pearson correlation between any
pair of regions. In addition, HOFCs [23] were also computed to capture second‐level rela‐
tionships using inter‐regional similarity of the FC topographical profiles, i.e., measuring
the ‘correlation of the correlation’ described previously.
2.7. Regression Predictive Modelling
To predict residual somatosensory function (using the TDT scores as the indicator)
from participants who had experienced a stroke, functional connectomes were employed
as potential features. Specifically, the predictive modelling was conducted with two re‐
gression models: linear regression (LR), and support vector regression (SVR) with linear
kernels. The prediction framework is described as follows (see Figure 1 for flow chart of
the framework).
Figure 1. Flow chart of the framework.
Brain Sci. 2021, 11, 1388 6 of 14
2.7.1. Feature Engineering
Feature engineering aims to transform data into features that can optimally train the
predictive models, resulting in improved model accuracy on unseen data. Predictive out‐
comes could be largely affected by the obtained features. Importantly, the extraction of
more accurate features leads to higher flexibility in choosing models, or even simplifying
model selection. In this study, feature engineering employed the following two feature
pools: (1) LOFC; and (2) the combination of LOFC and HOFC (denoted as LOFC + HOFC
hereafter).
As for neuroimaging data, they often have a much larger dimension size than the
sample size, which are easily subject to overfitting. To address this issue, sparse feature
selection approaches are of particular interest, such as the Least Absolute Shrinkage and
Selection Operator (LASSO) approach [29]. Recently, a stability selection approach was
proposed to solve the notoriously difficult problem of variable selection. For high‐dimen‐
sional data, stability selection was demonstrated to be very useful in selecting sparse var‐
iables. The robustness of stability selection has been already demonstrated in estimating
sparse network edges from high‐dimensional brain connectome data [30,31]. Therefore,
the randomized LASSO with stability selection was conducted to select optimal and ro‐
bust features for predictive modelling using sklearn (scikit‐learn.org, accessed date:
20/10/2021).
2.7.2. Model Validation: Leave‐One‐Out Cross‐Validation
Given that a limited number of stroke participants (N = 40) were available for training
predictive models, a nested leave‐one‐out cross‐validation approach was employed, with
inner‐ and outer‐loop iterations. In each outer‐loop iteration, one participant is retained
as the test set, and the remaining N‐1 participants were considered as the training set;
feature selection was applied only to the training set ensuring blind test condition. The
inner‐loop leave‐one‐out cross‐validation included N‐1 subjects inputted from the outer‐
loop iterations, with N‐2 subjects as the training set and one participant retained as the
test set, with which hyperparameters tuning for support vector regression (C and gamma)
was conducted in the inner‐loop iteration. Optimal hyperparameters were not fully con‐
sistent across the N repetitions due to relatively low signal to noise ratio of fMRI data. As
such, a majority vote was employed to choose the final optimal hyperparameters, i.e., a
hyperparameter was designated as the final optimal one if it was estimated as the optimal
hyperparameter (i.e., achieving the highest correlation coefficient (r) between predicted
and true TDT scores) by the most folds. The trained predictive model on each training set
was then applied to the retained participant, predicting the TDT score of that participant.
With the nested leave‐one‐out cross‐validation conducted, the TDT score of each par‐
ticipant was predicted using a specific model and obtained features associated with the
training set. The predicted TDT scores were then correlated with true TDT scores, with a
higher correlation coefficient indicating better performance in predicting TDT scores. Fi‐
nally, the prediction outcomes were calculated and compared between the two regression
models, linear regression, and support vector regression, using either LOFC or LOFC +
HOFC as the potential feature pools.
2.7.3. Final Model Building
Ideally, selected features are expected to be consistent across all folds while conduct‐
ing leave‐one‐out cross‐validation. However, selected features are not necessarily the
same among all folds, in which case a final optimal feature set is needed for constructing
the final model. To achieve this goal, we empirically selected only those that were selected
as features from not less than half of the folds from the leave‐one‐out cross‐validation
implementation. The selected set of features were subject to further feature selection on
all stroke participants using randomized LASSO as described above. The final model was
trained on all available participants, producing the final model for future prediction.
Brain Sci. 2021, 11, 1388 7 of 14
3. Results
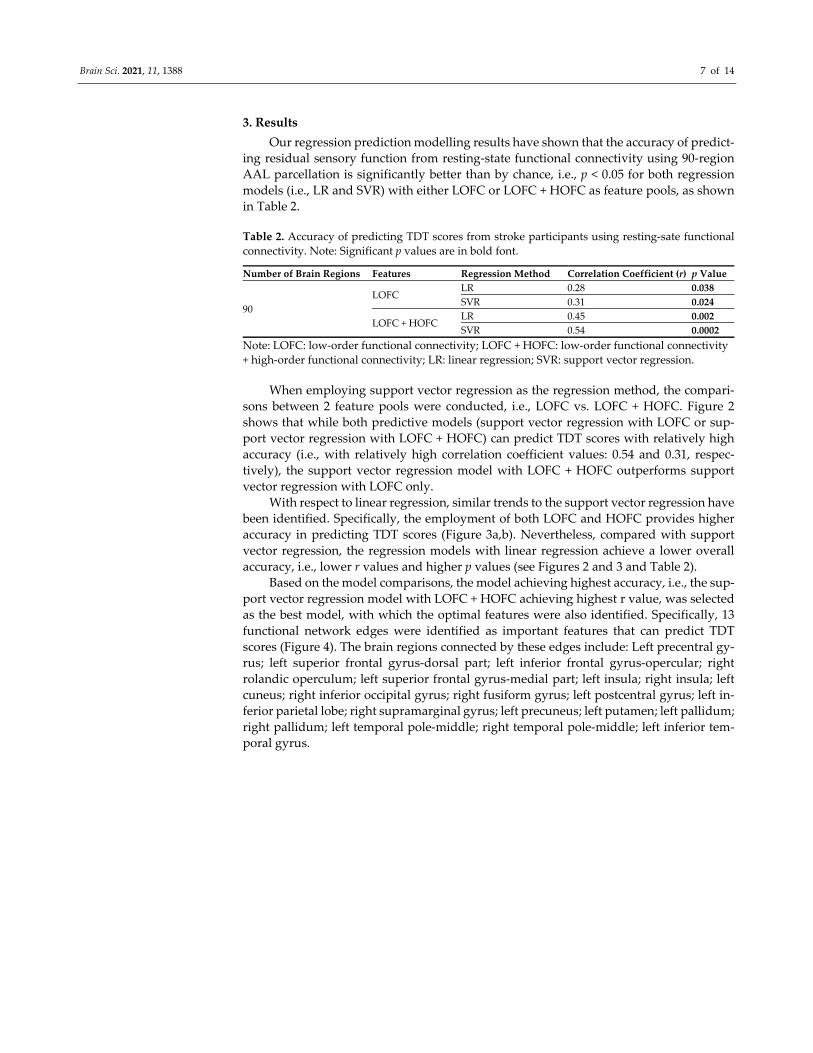
Our regression prediction modelling results have shown that the accuracy of predict‐
ing residual sensory function from resting‐state functional connectivity using 90‐region
AAL parcellation is significantly better than by chance, i.e., p < 0.05 for both regression
models (i.e., LR and SVR) with either LOFC or LOFC + HOFC as feature pools, as shown
in Table 2.
Table 2. Accuracy of predicting TDT scores from stroke participants using resting‐sate functional
connectivity. Note: Significant p values are in bold font.
Number of Brain Regions Features Regression Method Correlation Coefficient (r) p Value
90
LOFC LR 0.28 0.038
SVR 0.31 0.024
LOFC + HOFC LR 0.45 0.002
SVR 0.54 0.0002
Note: LOFC: low‐order functional connectivity; LOFC + HOFC: low‐order functional connectivity
+ high‐order functional connectivity; LR: linear regression; SVR: support vector regression.
When employing support vector regression as the regression method, the compari‐
sons between 2 feature pools were conducted, i.e., LOFC vs. LOFC + HOFC. Figure 2
shows that while both predictive models (support vector regression with LOFC or sup‐
port vector regression with LOFC + HOFC) can predict TDT scores with relatively high
accuracy (i.e., with relatively high correlation coefficient values: 0.54 and 0.31, respec‐
tively), the support vector regression model with LOFC + HOFC outperforms support
vector regression with LOFC only.
With respect to linear regression, similar trends to the support vector regression have
been identified. Specifically, the employment of both LOFC and HOFC provides higher
accuracy in predicting TDT scores (Figure 3a,b). Nevertheless, compared with support
vector regression, the regression models with linear regression achieve a lower overall
accuracy, i.e., lower r values and higher p values (see Figures 2 and 3 and Table 2).
Based on the model comparisons, the model achieving highest accuracy, i.e., the sup‐
port vector regression model with LOFC + HOFC achieving highest r value, was selected
as the best model, with which the optimal features were also identified. Specifically, 13
functional network edges were identified as important features that can predict TDT
scores (Figure 4). The brain regions connected by these edges include: Left precentral gy‐
rus; left superior frontal gyrus‐dorsal part; left inferior frontal gyrus‐opercular; right
rolandic operculum; left superior frontal gyrus‐medial part; left insula; right insula; left
cuneus; right inferior occipital gyrus; right fusiform gyrus; left postcentral gyrus; left in‐
ferior parietal lobe; right supramarginal gyrus; left precuneus; left putamen; left pallidum;
right pallidum; left temporal pole‐middle; right temporal pole‐middle; left inferior tem‐
poral gyrus.

Brain Sci. 2021, 11, 1388 8 of 14
Figure 2. Plots of predicted vs. true Tactile Discrimination Test (TDT) scores by employing support
vector regression (SVR) with either LOFC or LOFC + HOFC with feature pools (cerebellum ex‐
cluded). Correlation coefficients, r, between predicted and true TDT scores are 0.54 and 0.31 for
SVR_LOFC_HOFC_90AAL, SVR_LOFC_90AAL, respectively. Note: SVR_LOFC_HOFC_90AAL
represents the SVR model using both LOFC and HOFC features based on automated anatomical
labelling (AAL) atlas, while SVR_LOFC_90AAL represents the SVR model using LOFC features
only based on AAL atlas. LOFC = low‐order functional connectivity. HOFC = high‐order functional
connectivity.
Figure 3. Plots of predicted vs. true Tactile Discrimination Test (TDT) scores by employing linear
regression (LR) with either LOFC or LOFC + HOFC with feature pools (cerebellum excluded). Cor‐
relation coefficients, r, between predicted and true TDT scores are 0.45 and 0.28 for
LR_LOFC_HOFC_90AAL and LR_LOFC_90AAL, respectively. Note: LR_LOFC_HOFC_90AAL
represents the LR model using both LOFC and HOFC features based on automated anatomical la‐
belling (AAL) atlas, while LR_LOFC_90AAL represents the LR model using LOFC features only

Brain Sci. 2021, 11, 1388 9 of 14
based on AAL atlas. LOFC = low‐order functional connectivity. HOFC = high‐order functional con‐
nectivity.
Figure 4. Selected features (i.e., functional network edges) that have been employed to build final
models. Selected features are mapped onto automated anatomical labelling (AAL) atlas in: (a) axial
view and (b) coronal view. Note: Blue and yellow nodes are involved in LOFC and HOFC, respec‐
tively, whereas the brown node (e.g., SFGmed.L) is involved in both LOFC and HOFC; network
edges identified as features are classified into 3 categories: (1) An edge is identified as a feature from
LOFC only (black thin edges); (2) An edge is identified as a feature from HOFC only (blue edges);
(3) An edge is identified as a feature from both LOFC and HOFC (brown thick edges). LOFC = low‐
order functional connectivity. HOFC = high‐order functional connectivity. Names and correspond‐
ing abbreviations of the brain regions are presented in the Appendix A.
4. Discussion
In this preliminary study, we investigated the feasibility of applying a machine learn‐
ing approach to predict somatosensory impairment after stroke using resting‐state func‐
tional connectivity data. Specifically, texture discrimination of the hand was measured
using the TDT [19]. As the brain is organized into a set of distributed networks, focal
stroke lesions could affect functions in remote but connected regions [6–8], which suggests
that stroke impairment could be better understood by using a brain network model. As
such, stroke impairment may be modelled relative to the disruption of network edges (i.e.,
connection strength), in which important features (functional network edges) can be iden‐
tified with a proposed machine learning approach. Our results demonstrate the potential
of the proposed regression predictive approach for predicting residual somatosensory
function, i.e., tactile discrimination function of the hand, from participants with stroke
using a brain networks approach. These relationships are important to be established as a
foundation for biomarkers at a point in time (for diagnosis/classification), at future time
(for prediction), or in association with evidence of neuroplastic changes associated with
spontaneous and/or treatment‐facilitated recovery (biomarker of mechanisms underlying
recovery). Further, linking the underlying impairment with disruption to functional brain
networks provides new insights that can be used to inform the development of neurosci‐
ence‐based interventions. For example, knowledge that the behavioral TDT outcome is
better predicted with inclusion of high‐order relationships in the model suggests the po‐
tential explanatory value of interactions among not only brain regions, but also between

Brain Sci. 2021, 11, 1388 10 of 14
brain networks. It also identifies the specific regions and networks involved, highlighting
the value of global anatomical information rather than relying on focal lesion alone.
The main difficulty of utilizing brain networks in the predictive modelling of stroke
outcomes lies in the fact that there are a greater number of features (p ~ thousands of fea‐
tures) than the number of samples (n ~ tens to hundreds of subjects), i.e., p >> n, which
usually leads to overfitting issues. In addition, the reliability of potential features could
largely affect the performance of the predictive models. Yet, these are real and common
issues in clinical studies. Nevertheless, the combination of LOFC with HOFC achieved
higher performance of predictive modelling (r = 0.54 and 0.45) than that with LOFC only
(r = 0.31 and 0.28). Our findings suggest that feature engineering, i.e., the process of gen‐
erating features that can be employed to build predictive models, is a crucial step for suc‐
cessfully predicting stroke outcomes using the resting‐state functional connectivity data.
Given the common issue of p >> n for neuroimaging data, we attempted to reduce the
number of features, i.e., p, so that the overfitting issue could be alleviated. Firstly, to
achieve this goal, feature selection was explicitly implemented so that only a limited num‐
ber of the most important features were selected. Our results showed that the employment
of the stability selection approach can effectively extract a small number of important fea‐
tures, i.e., sparse networks were obtained, therefore alleviating the overfitting issue. Sec‐
ondly, with the consideration of the relatively small number of participants, we elected to
use simple models rather than complex models (random forest etc.), i.e., only linear re‐
gression (LR) and support vector regression (SVR) models were employed. Results have
demonstrated the outperformance of support vector regression with linear kernel (i.e., r =
0.54 and 0.31 for LOFC + HOFC vs. LOFC only) over linear regression (i.e., r = 0.45 and
0.28 for LOFC + HOFC vs. LOFC only). Such observed differences between support vector
regression and linear regression might be well explained by the “winner‐take‐all” prop‐
erty of linear regression, i.e., when two features are highly correlated, the weight assigned
to the second feature is close to 0, whereas the weights of both features should be similar.
Therefore, support vector regression is preferred over linear regression for brain func‐
tional connectivity studies, i.e., functional connections highly correlated should have sim‐
ilar weights.
As a final optimal model for predicting residual somatosensory function (TDT
scores), those 13 features identified are considered crucial in somatosensory information
transfer processing. Such connectivity roles are well supported by the comprehensive
functions of involved brain regions. Interestingly, those regions can be roughly classified
into three categories according to their respective roles in the literature: (i) brain regions
involving basic somatosensory and/or motor functions (low level sensory perception):
precentral gyrus and postcentral gyrus [32]; (ii) brain regions performing multisensory
information integration: inferior parietal lobule [33], insula [34], and precuneus [35]; (iii)
brain regions responsible for multisensory information processing (high‐order cognitive
processing): superior frontal gyrus—dorsal and medial parts [36], rolandic operculum
[37], cuneus [38], inferior occipital gyrus [39], fusiform gyrus [38], supramarginal gyrus
[40], putamen [41], pallidum [42], temporal pole—middle [43], and inferior temporal gy‐
rus [44]. Specifically, those brain regions in multisensory information integration (cate‐
gory ii) act as bridges and transfer information from regions involved in basic somatosen‐
sory and/or motor functions (category i) to regions in multisensory information pro‐
cessing (category iii).
To the best of our knowledge, this is the first attempt to employ multivariate model‐
ling techniques as a tool to reveal the relationship between somatosensory impairment
after stroke and brain networks. Compared with previous studies that commonly used
univariate analysis [13], our study employed a multivariate approach to identify the rela‐
tionship between whole‐brain connectome and stroke impairment in somatosensory func‐
tion. Further, we adopted both low‐order and high‐order FC as a feature pool. This ap‐
proach achieved higher correlation scores relative to the model that only employed low‐
order FC as a feature pool, which is consistent with the findings of previous studies

Brain Sci. 2021, 11, 1388 11 of 14
[23,24]. Furthermore, this multivariate approach provides a potential approach to identify
important network edges from the whole‐brain network that significantly affect the resid‐
ual somatosensory function. Knowledge that the behavioral TDT outcome is better pre‐
dicted with inclusion of high‐order relationships in the model suggests the potential ex‐
planatory value of including an index of anatomical edges. Further, evidence of the feasi‐
bility of establishing a relationship between brain regions and brain networks and touch
discrimination function at a single point in time can provide a foundation for future defi‐
nition of neuroimaging biomarkers for predicting stroke recovery and rehabilitation if
very large data sample size is available.
Limitations and Future Work
There are a few methodological limitations that need to be considered. Firstly, the
limitation of the current study is that only a limited number of participants were recruited
and analyzed, i.e., 40 in our final analysis, whereas machine learning typically requires a
large amount of data. This could lead to the following issues: (1) the effect of overfitting
is likely strong; (2) outliers might have much more adverse effect on prediction; (3) noise
becomes more of an issue. However, clinical neuroimaging data often have limited num‐
ber of participants, often in the magnitude of several tens [45]. In the future, multicenter
studies might be leveraged so that the potential of machine learning techniques can be
largely realized.
Secondly, the focus of the current study was a cohort of stroke survivors, in which
lesions are distributed across the brain. It remains an open question as to how to deal with
those lesioned brain regions. In this study, lesion masks were applied when normalizing
the brain using the Clinical Toolbox in SPM (https://github.com/neurolabusc/Clinical),
which accounted for the lesions during the preprocessing. We did not apply a lesion mask
when constructing connectomes. This is because we preferred not to exclude the potential
disrupted connections, which would otherwise be removed completely by applying a le‐
sion mask. We reasoned that while structural damage is likely to impact functional con‐
nectivity, the relationship between structure and function is not necessarily 1:1, and func‐
tional connectivity may spread over multiple anatomical paths [46]. To our best
knowledge, there is no consensus on how to address this issue optimally. Future studies
may be required to investigate the optimal way of dealing with the lesions.
While our results show that the accuracy of predicting TDT scores from brain con‐
nectomes using regression analysis is significantly better than by chance, the best predic‐
tive model with selected features can explain only ~30% variance, which likely indicates
that there might still be large room for improvement. Practically, given that only func‐
tional connectivity has been used as a tool to investigate the relationship among brain
networks and stroke impairment, structural connectivity (or connectomes from other im‐
aging modalities) could be included to further improve the predictive outcome, especially
as it is complementary to functional connectivity. Alternatively, as proposed in a previous
study [47], functional connectivity and structural connectivity could be combined into a
single image, which could provide predictive modelling with features that contain com‐
plementary information from both modalities. Our work in the future will focus on how
to improve the prediction outcomes via multi‐modal connectomes.
5. Conclusions
This preliminary study provides a multivariate approach for investigating the rela‐
tionship between stroke impairment and functional brain networks. Our findings demon‐
strate the feasibility of predicting post‐stroke residual somatosensory function using rest‐
ing‐state functional connectivity and predictive modelling. Specifically, by employing a
robust feature selection approach, i.e., randomized LASSO based on stability selection, a
small number of the most important features (brain network edges) are selected. Using
this approach, stroke impairment may be more directly related to brain networks when

Brain Sci. 2021, 11, 1388 12 of 14
employing machine learning techniques. The role of interconnected brain regions in‐
volved with basic somatosensory and/or motor functions, multisensory information inte‐
gration, and multisensory information processing were revealed in association with clin‐
ical somatosensory impairment. While our study focuses on somatosensory impairment,
this approach could be generalized to other stroke impairments as well. Thus, this study
develops a possible avenue for linking stroke impairment to functional brain networks.
However, the validity of the proposed approach needs to be evaluated with so‐called ‘big
data’, which is likely to facilitate the extraction of neuroimaging biomarkers, providing
clinically useful information when planning the personalized rehabilitation of a patient.
Author Contributions: formal analysis, X.L., C.‐L.K. and C.‐H.Y.; funding acquisition, L.M.C.; in‐
vestigation, X.L., C.‐L.K., C.‐H.Y., A.C. and L.M.C.; methodology, X.L., L.M.C., C.‐L.K. and C.‐H.Y.;
project administration, X.L. and L.M.C.; resources, X.L., C.‐L.K., C.‐H.Y., P.G., G.L., A.C. and L.M.C.;
software, X.L.; supervision, X.L. and L.M.C.; Validation, X.L.; visualization, X.L.; writing—original
draft, X.L.; writing—review & editing, X.L., C.‐L.K., C.‐H.Y., A.C. and L.M.C. All authors have read
and agreed to the published version of the manuscript.
Funding: This research was funded by the National Health and Medical Research Council of Aus‐
tralia, grant numbers 307902, 1022694, 1077898, 1113352, 1134495, and 2004443.
Institutional Review Board Statement: The study was conducted according to the guidelines of
the Declaration of Helsinki and approved by the Human Ethics Committees of Austin Health (pro‐
tocol code H2013/04915, approved 14/3/2013), La Trobe University and Northern Health.
Informed Consent Statement: Informed consent was obtained from all participants involved in the
study.
Data Availability Statement: Data are available upon reasonable request from the senior author
LMC.
Acknowledgments: We acknowledge support for conduct of the research from the National Health
and Medical Research Council of Australia and thank the people with stroke who participated in
the study.
Conflicts of Interest: The authors declare no conflict of interest.
Appendix A
Names and corresponding abbreviations of the brain regions involved in the selected
features.
Abbr. Brain Region Abbr. Brain Region
CUN Cuneus PreCG Precentral gyrus
FFG Fusiform gyrus PoCG Postcentral gyrus
IFGoperc Inferior frontal gyrus‐opercular PUT Putamen
INS Insula ROL Rolandic operculum
IOG Inferior occipital gyrus SFGdor Superior frontal gyrus‐dorsal part
IPL Inferior parietal lobule SFGmed Superior frontal gyrus‐medial part
ITG Inferior temporal gyrus SMG SupraMarginal gyrus
PAL Pallidum TPOmid Temporal pole‐middle
PCUN Precuneus
References
1. The GBD 2016 Lifetime Risk of Stroke Collaborators. Global, Regional, and Country‐Specific Lifetime Risks of Stroke, 1990 and
2016. N. Engl. J. Med. 2018, 379, 2429–2437.
2. Carey, L.M. Stroke Rehabilitation: Insights from Neuroscience and Imaging; Oxford University Press: New York, NY, USA, 2012.
3. Maranesi, E.; Riccardi, G.R.; Di Donna, V.; Di Rosa, M.; Fabbietti, P.; Luzi, R.; Pranno, L.; Lattanzio, F.; Bevilacqua, R.
Effectiveness of intervention based on end‐effector gait trainer in older patients with stroke: A systematic review. J. Am. Med.
Dir. Assoc. 2020, 21, 1036–1044.
4. van der Vliet, R.; Selles, R.W.; Andrianopoulou, E.R.; Nijland, R.; Ribbers, G.M.; Frens, M.A.; Meskers, C.; Kwakkel, G.
Predicting upper limb motor impairment recovery after stroke: A mixture model. Ann. Neurol. 2020, 87, 383–393.

Brain Sci. 2021, 11, 1388 13 of 14
5. Coupar, F.; Pollock, A.; Rowe, P.; Weir, C.; Langhorne, P. Predictors of upper limb recovery after stroke: A systematic review
and meta‐analysis. Clin. Rehabil. 2012, 26, 291–313.
6. Boyd, L.A.; Hayward, K.; Ward, N.; Stinear, C.M.; Rosso, C.; Fisher, R.; Carter, A.R.; Leff, A.; Copland, D.A.; Carey, L.M.; et al.
Biomarkers of stroke recovery: Consensus‐based core recommendations from the Stroke Recovery and Rehabilitation
Roundtable. Int. J. Stroke 2017, 12, 480–493.
7. Carey, L.M.; Seitz, R.J.; Parsons, M.; Levi, C.; Farquharson, S.; Tournier, J.‐D.; Palmer, S.; Connelly, A. Beyond the lesion:
Neuroimaging foundations for post‐stroke recovery. Future Neurol. 2013, 8, 507–527.
8. Koh, C.‐L.; Yeh, C.‐H.; Liang, X.; Vidyasagar, R.; Seitz, R.J.; Nilsson, M.; Connelly, A.; Carey, L.M. Structural connectivity remote
from lesions correlates with somatosensory outcome poststroke. Stroke 2021, 52, 2910–2920.
9. Yeh, C.H.; Jones, D.K.; Liang, X.; Descoteaux, M.; Connelly, A. Mapping structural connectivity using diffusion MRI: Challenges
and opportunities. J. Magn. Reson. Imaging 2021, 53, 1666–1682.
10. Carter, A.R.; Astafiev, S.V.; Lang, C.E.; Connor, L.T.; Rengachary, J.; Strube, M.J.; Pope, D.L.W.; Shulman, G.L.S.; Corbetta, M.
Resting interhemispheric functional magnetic resonance imaging connectivity predicts performance after stroke. Ann. Neurol.
2010, 67, 365–375.
11. Carter, A.R.; Shulman, G.L.; Corbetta, M. Why use a connectivity‐based approach to study stroke and recovery of function?
Neuroimage 2012, 62, 2271–2280.
12. Urbin, M.A.; Hong, X.; Lang, C.E.; Carter, A.R. Resting‐state functional connectivity and its association with multiple domains
of upper‐extremity function in chronic stroke. Neurorehabil. Neural Repair 2014, 28, 761–769.
13. Goodin, P.; Lamp, G.; Vidyasagar, R.; McArdle, D.; Seitz, R.J.; Carey, L.M. Altered functional connectivity differs in stroke
survivors with impaired touch sensation following left and right hemisphere lesions. Neuroimage‐Clin. 2018, 18, 342–355.
14. Lee, M.H.; Smyser, C.D.; Shimony, J.S. Resting‐state fMRI: A review of methods and clinical applications. AJNR Am. J.
Neuroradiol. 2013, 34, 1866–1872.
15. Liang, X.; Connelly, A.; Calamante, F. Graph analysis of resting‐state ASL perfusion MRI data: Nonlinear correlations among
CBF and network metrics. Neuroimage 2014, 87, 265–275.
16. Liang, X.; Connelly, A.; Calamante, F. Voxel‐wise functional connectomics using arterial spin labeling functional magnetic
resonance imaging: The role of denoising. Brain Connect. 2015, 5, 543–553.
17. Lamp, G.; Goodin, P.; Palmer, S.; Low, E.; Barutchu, A.; Carey, L.M. Activation of bilateral secondary somatosensory cortex
with right hand touch stimulation: A meta‐analysis of functional neuroimaging studies. Front. Neurol. 2018, 9, 1129.
18. Siegel, J.S.; Ramsey, L.; Snyder, A.Z.; Metcalf, N.V.; Chacko, R.V.; Weinberger, K.; Baldassarre, A.; Hacker, C.D.; Shulman, G.L.;
Corbetta, M. Disruptions of network connectivity predict impairment in multiple behavioral domains after stroke. Proc. Natl.
Acad. Sci. USA 2016, 113, E4367–E4376.
19. Carey, L.M.; Oke, L.E.; Matyas, T.A. Impaired touch discrimination after stroke: A quantitative test. J. Neurol. Rehabil. 1997, 11,
219–232.
20. Carey, L.M.; Abbott, D.F.; Harvey, M.R.; Puce, A.; Seitz, R.J.; Donnan, G.A. Relationship between touch impairment and brain
activation after lesions of subcortical and cortical somatosensory regions. Neurorehabil. Neural Repair 2011, 25, 443–457.
21. Carey, L.M.; Abbott, D.F.; Egan, G.F.; Donnan, G.A. Reproducible activation in BA2, 1 and 3b associated with texture
discrimination in healthy volunteers over time. Neuroimage 2008, 39, 40–51.
22. Bannister, L.C.; Crewther, S.G.; Gavrilescu, M.; Carey, L.M. Improvement in touch sensation after stroke is associated with
resting functional connectivity changes. Front. Neurol. 2015, 6, 165.
23. Zhang, H.; Chen, X.; Shi, F.; Li, G.; Kim, M.; Giannakopoulos, P.; Haller, S.; Shen, D. Topographical information‐based high‐
order functional connectivity and its application in abnormality detection for mild cognitive impairment. J. Alzheimers Dis. 2016,
54, 1095–1112.
24. Zhang, Y.; Zhang, H.; Chen, X.; Lee, S.W.; Shen, D. Hybrid high‐order functional connectivity networks using resting‐state
functional MRI for mild cognitive impairment diagnosis. Sci. Rep. 2017, 7, 6530.
25. Zhou, Y.; Qiao, L.; Li, W.; Zhang, L.; Shen, D. Simultaneous estimation of low‐ and high‐order functional connectivity for
identifying mild cognitive impairment. Front. Neuroinform. 2018, 12, 3.
26. Misic, B.; Sporns, O. From regions to connections and networks: New bridges between brain and behavior. Curr. Opin. Neurobiol.
2016, 40, 1–7.
27. Mazoyera, N.; Landeau, B.; Papathanassiou, D.; Crivello, F.; Etard, O.; Delcroix, N.; Tzourio‐Mazoyer, N.; Joliot, M. Automated
anatomical labeling of activations in SPM using a macroscopic anatomical parcellation of the MNI MRI single‐subject brain.
Neuroimage 2002, 15, 273–289.
28. Marek, S.; Siegel, J.S.; Gordon, E.M.; Raut, R.; Gratton, C.; Newbold, D.J.; Ortega, M.; Laumann, T.O.; Adeyemo, B.; Miller, D.B.;
et al. Spatial and temporal organization of the individual human cerebellum. Neuron 2018, 100, 977–993.e7.
29. Tibshirani, R. Regression shrinkage and selection via the lasso. J. R. Stat. Soc. B Methodol. 1996, 58, 267–288.
30. Liang, X.; Connelly, A.; Calamante, F. A novel joint sparse partial correlation method for estimating group functional networks.
Hum. Brain Mapp. 2016, 37, 1162–1177.
31. Liang, X.; Vaughan, D.N.; Connelly, A.; Calamante, F. A novel group‐fused sparse partial correlation method for simultaneous
estimation of functional networks in group comparison studies. Brain Topogr. 2018, 31, 364–379.
32. Fregnac, Y.; Bathellier, B. Cortical correlates of low‐level perception: From neural circuits to percepts. Neuron 2015, 88, 110–126.

Brain Sci. 2021, 11, 1388 14 of 14
33. Regenbogen, C.; Seubert, J.; Johansson, E.; Finkelmeyer, A.; Andersson, P.; Lundstrom, J.N. The intraparietal sulcus governs
multisensory integration of audiovisual information based on task difficulty. Hum. Brain Mapp. 2018, 39, 1313–1326.
34. Liberati, G.; Klöcker, A.; Safronova, M.M.; Santos, S.F.; Vaz, J.G.R.; Raftopoulos, C.; Mouraux, A. Nociceptive local field
potentials recorded from the human insula are not specific for nociception. PLoS Biol 2016, 14, e1002345.
35. Talsma, D. Predictive coding and multisensory integration: An attentional account of the multisensory mind. Front. Integr.
Neurosci. 2015, 9, 19.
36. du Boisgueheneuc, F.; Levy, R.; Volle, E.; Seassau, M.; Duffau, H.; Kinkingnehun, S.; Samson, Y.; Zhang, S.; Dubois, B. Functions
of the left superior frontal gyrus in humans: A lesion study. Brain 2006, 129 Pt 12, 3315–3328.
37. Bekrater‐Bodmann, R.; Foell, J.; Diers, M.; Kamping, S.; Rance, M.; Kirsch, P.; Trojan, J.; Fuchs, X.; Bach, F.; Cakmak, H.K.; et al.
The importance of synchrony and temporal order of visual and tactile input for illusory limb ownership experiences—An FMRI
study applying virtual reality. PLoS ONE 2014, 9, e87013.
38. Parise, M.; Kubo, T.T.; Doring, T.M.; Tukamoto, G.; Vincent, M.; Gasparetto, E.L. Cuneus and fusiform cortices thickness is
reduced in trigeminal neuralgia. J. Headache Pain 2014, 15, 17.
39. Williams, J.T.; Darcy, I.; Newman, S.D. Bimodal bilingualism as multisensory training?: Evidence for improved audiovisual
speech perception after sign language exposure. Brain Res. 2016, 1633, 101–110.
40. Kheradmand, A.; Lasker, A.; Zee, D.S. Transcranial magnetic stimulation (TMS) of the supramarginal gyrus: A window to
perception of upright. Cereb. Cortex 2015, 25, 765–771.
41. Sato, W.; Kubota, Y.; Kochiyama, T.; Uono, S.; Yoshimura, S.; Sawada, R.; Sakihama, M.; Toichi, M. Increased putamen volume
in adults with autism spectrum disorder. Front. Hum. Neurosci. 2014, 8, 957.
42. Smith, K.S.; Tindell, A.J.; Aldridge, J.W.; Berridge, K.C. Ventral pallidum roles in reward and motivation. Behav. Brain Res. 2009,
196, 155–167.
43. Kiefer, M.; Pulvermuller, F. Conceptual representations in mind and brain: Theoretical developments, current evidence and
future directions. Cortex 2012, 48, 805–825.
44. Mur, M.C. High‐Level Visual Object Representations in Inferior Temporal Cortex. Ph.D. Thesis, University Maastricht,
Maastricht, The Netherlands, 2011.
45. Derntl, A.; Plant, C. Clustering techniques for neuroimaging applications. Wires Data Min. Knowl. 2016, 6, 22–36.
46. Wodeyar, A.; Cassidy, J.M.; Cramer, S.C.; Srinivasan, R. Damage to the structural connectome reflected in resting‐state fMRI
functional connectivity. Netw. Neurosci. 2020, 4, 1197–1218.
47. Calamante, F.; Smith, R.E.; Liang, X.; Zalesky, A.; Connelly, A. Track‐weighted dynamic functional connectivity (TW‐dFC): A
new method to study time‐resolved functional connectivity. Brain Struct. Funct. 2017, 222, 3761–3774.