article in press - lsu geology & geophysics proof article in press 1 geodynamics of continental...
TRANSCRIPT

ARTICLE IN PRESS
1
2
3
4
567
8
9
101112131415161718192021
22
232425
26
27
28
29
30
31
www.elsevier.com/locate/tecto
Tectonophysics xx (2004) xxx–xxx
OFGeodynamics of continental plate collision during late tertiary
foreland basin evolution in the Timor Sea: constraints from
foreland sequences, elastic flexure and normal faulting
John Londono*, Juan M. Lorenzo
Department of Geology and Geophysics, Louisiana State University, E235 Howe-Russell Complex, Baton Rouge, LA 70803, USA
Available online
OCTED PRAbstract
Tectonic subsidence of the Australian lithosphere during the Late Tertiary propagates from the southwest to the northeast in
the Timor Sea, as a consequence of the oblique collision between the Eurasian and Australian plates. We reconstruct the
asynchronous nature of deflection of the Australian plate created during the plate convergence by best-matching the geometry of
de-compacted foreland strata against the predictions of simple bending elastic beam models. We infer a maximum subsidence of
3500 m and a maximum width for the basin of f470 km. The effective elastic thickness of the Australian lithosphere (f80 to
100 km) does not change significantly during basin evolution. The low curvature imposed on the plate (f5.1�10� 8 m� 1)
during bending is too small to weaken the plate. Yet, abundant but small-slip, normal faulting related to bending implies some
degree of inelastic yielding. The polarity of fault propagation supports the oblique nature of the collision. Flexural models
indicate that at least 570 km of Australian plate (mostly areas of stretched continental crust) was flexed, primarily by the
tectonic loading of the Timor Island and that the total amount of subducted plate was at least 100 km during basin evolution.
D 2004 Published by Elsevier B.V.
32
RREKeywords: Geodynamics; Lithospheric flexure; Timor Sea; Eurasia–Australia collision
1. Introduction subsidence caused by the accumulation of vertical
33
34
35
36
37
38
39
NCOForeland basin subsidence is primarily related to
the vertical deflection of the lithosphere caused by
loading of orogenic belts, although subsurface loads,
and sediment and water bodies also play an important
role in the process. The distinctive wedge-like geom-
etry of foreland basins is a direct result of asymmetric
U 4041
42
43
44
0040-1951/$ - see front matter D 2004 Published by Elsevier B.V.
doi:10.1016/j.tecto.2004.04.007
* Corresponding author. Tel.: +1-225-578-2680; fax: +1-225-
578-2302.
E-mail address: [email protected] (J. Londono).
stresses toward the deeper end of the plate. The
stratigraphic record complies with the regional archi-
tecture and therefore represents the geometry of the
basin at depositional time (Beamont, 1981; Dorobek,
1995; Kruse and Royden, 1994; Turcotte and Schu-
bert, 1982; Yang and Dorobek, 1995). The timing,
amount of vertical force and total plate deflection may
be determined via flexural modeling, using the strati-
graphic record deposited during tectonic loading. The
basin-subsidence can be modeled as the flexural
response of an elastic plate to a vertical linear load
(Turcotte and Schubert, 1982). Changes in subsidence
TECTO-07158; No of Pages 18

UNCORRECTED PROOF
ARTICLE IN PRESS
Fig. 1. (A) Tectonic setting of the Timor Sea. A–AV cross-section in Fig. 2. (B) Seismic and well data. Line number as referred by AGSO.
Wells: (1) Ashmore Reef 1; (2) Delambre 1; (3) Buffon 1.
J. Londono, J.M. Lorenzo / Tectonophysics xx (2004) xxx–xxx2
ARTICLE IN PRESS
45
46
47
48
49
50
51
52
53
54
55
56
57
58
59
60
61
62
63
64
65
66
67
68
69
70
71
72
73
74
75
76
77
78
79
80
81
82
83
84
85
86
87
88
89
90
91
92
93
94
J. Londono, J.M. Lorenzo / Tectonophysics xx (2004) xxx–xxx 3
across the strike of the basin through time document
the amount (Cardozo and Jordan, 2001) and polarity
of loading, and the variation in lithospheric strength.
Normal faulting has been reported along the subduct-
ing plates as an effect of the flexing lithosphere
undergoing inelastic deformation (e.g. Bradley and
Kidd, 1991). Extensional faulting is expected to affect
areas of high curvature within the upper half of the
bending plate. Variations in the amount of tectonic
transport of the overridden plate trough time change
the amount of bending and the spatial distribution of
associated normal faults. The forebulge, a lithospheric
protuberance developed as an elastic effect of the
deflection on the landward end of the bending plate,
is expected to reach highs of up to hundreds of
meters and to extent over hundreds of km. It is
usually recognized by unconformities and sedimen-
tary pinch-outs on both of its flanks.
The Late Tertiary foreland basin that developed in
the Timor Sea (Fig. 1) during the latest episode of
collision between the Australian and Eurasian plates
(f6.5 to 1.6 Ma) provides an excellent example of a
peripheral foreland basin (Lorenzo et al., 1998; Miall,
1995; Tandon et al., 2000). The Timor Trough, a deep
depression, is created by the deflection of the Austra-
UNCORRECT
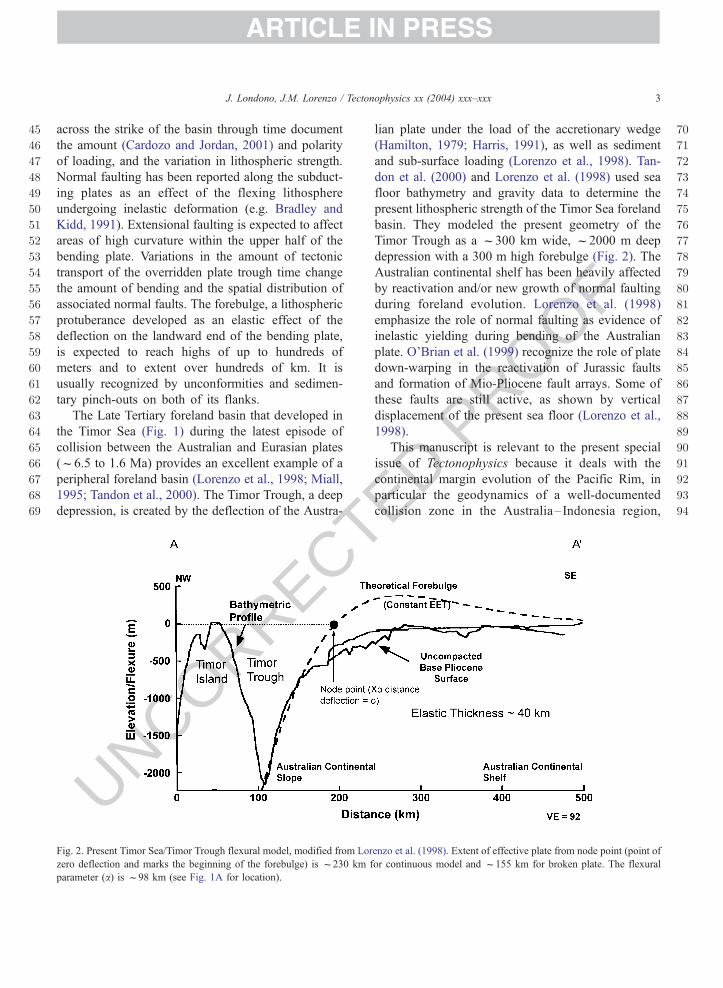
Fig. 2. Present Timor Sea/Timor Trough flexural model, modified from Lor
zero deflection and marks the beginning of the forebulge) is f230 km f
parameter (a) is f98 km (see Fig. 1A for location).
D PROOF
lian plate under the load of the accretionary wedge
(Hamilton, 1979; Harris, 1991), as well as sediment
and sub-surface loading (Lorenzo et al., 1998). Tan-
don et al. (2000) and Lorenzo et al. (1998) used sea
floor bathymetry and gravity data to determine the
present lithospheric strength of the Timor Sea foreland
basin. They modeled the present geometry of the
Timor Trough as a f300 km wide, f2000 m deep
depression with a 300 m high forebulge (Fig. 2). The
Australian continental shelf has been heavily affected
by reactivation and/or new growth of normal faulting
during foreland evolution. Lorenzo et al. (1998)
emphasize the role of normal faulting as evidence of
inelastic yielding during bending of the Australian
plate. O’Brian et al. (1999) recognize the role of plate
down-warping in the reactivation of Jurassic faults
and formation of Mio-Pliocene fault arrays. Some of
these faults are still active, as shown by vertical
displacement of the present sea floor (Lorenzo et al.,
1998).
This manuscript is relevant to the present special
issue of Tectonophysics because it deals with the
continental margin evolution of the Pacific Rim, in
particular the geodynamics of a well-documented
collision zone in the Australia– Indonesia region,
Eenzo et al. (1998). Extent of effective plate from node point (point of
or continuous model and f155 km for broken plate. The flexural

T
ARTICLE IN PRESS
95
96
97
98
99
100
101
102
103
104
105
106
107
108
109
110
111
112
113
114
115
116
117
118
119
120
121
122
123
124
125
126
127
128
129
130
131
132
133
134
135
136
137
138
139
140
141
142
143
144
145
146
147
148
149
150
151
152
153
154
155
156
157
158
159
160
161
162
163
164
165
166
167
168
169
170
171
172
J. Londono, J.M. Lorenzo / Tectonophysics xx (2004) xxx–xxx4
REC
along the Timor Sea foreland basin. This unique,
early-stage foreland basin has not been disrupted by
later tectonics. Therefore it can be used to study how
the Australian plate has reacted to vertical loading
trough time. We use flexural models representing the
bending plate to estimate the effective elastic thick-
ness during evolution of the basin. We calculate the
amount of loading, infer the nature of the collision
between the Eurasian and Australian plates and char-
acterize how the Australian lithosphere has responded
to the load of the Banda Orogen accretionary prism.
The position of the geodynamic elements of the
bending plate model during basin evolution provides
a tool to reconstruct the regional basin history in terms
of subsidence (deflection), tectonic transport (linear
load position) and the extent of the Australian litho-
sphere flexed by loading. We also evaluate the impact
of inelastic yielding and of the curvature caused by
vertical loading on plate strength. The timing of the
apparent displacement of new or reactivated faults
developed during the evolution of the foreland basin
is used as an indicator of the polarity of collision. Our
results, based mainly on extensive seismic data, indi-
cate that despite continuous deformation through time,
no significant change in lithospheric strength has
occurred during foreland development. We also rec-
ognize the NNE oblique nature of plate collision in
the Timor Sea. The amount of deflection and inelastic
deformation in the southwestern part of the Timor Sea
reveals that this area has undergone deformation and
has been heavily affected by tectonic loading since
Late Miocene time. In contrast, in the northeastern
region the effect of loading has been more substantial
since Late Pliocene time.
R 173174
175
176
177
178
179
180
181
182
183
184
185
186
UNCO2. Tectonic setting
The northwestern Australian continental plate is
presently at a steady-state collision with the Banda arc
and Timor Island (Hamilton, 1979; Fig. 1). The
colliding process began to affect the Australian North
West Shelf in the Timor Sea in Late Miocene times.
The N20E convergence of the Australian plate is
estimated at a rate of 71 mm/year (Tregoning et al.,
1994). However, GPS studies (Genrich et al., 1995)
indicate that the Australia–Timor convergence has
ceased and the Australia–Eurasia collision is accom-
ED PROOF
modated by back-thrusting north of Timor along the
Flores and Wetar thrusts. The Australian lithosphere
has been subducted under a 200 km wide zone of
Eurasian lithosphere (Richardson and Blundell, 1996),
including Timor Island, an accretionary prism (Aud-
ley-Charles, 1986) developed over part of the
stretched Australian continental crust. The Australian
North West Shelf in the Timor Sea has experienced
various tectonic episodes since Paleozoic times.
O’Brien et al. (1996) note that NE–SW trending
structures (Vulcan and Malita grabens, Fig. 1) reveal
Late Devonian–Early Carboniferous rifting events, in
contrast to the NW–SE trend of Jurassic rift-related
basins (Pretelt sub basin, Sahul Syncline, Fig. 1).
Hamilton (1979), using refraction velocities, reports
more than 4 km of sedimentary cover overlying
continental crust at the toe of the tectonic wedge.
Continental crust with decreasing thickness, from 35
km in Kimberly Highs to 26 km under the outer shelf
near the Timor Trough (Petkovic et al., 2000), under-
lies the Australian shelf. Petkovic et al. (2000) esti-
mate the attenuation of Precambrian basement rocks
from 35 to 13–14 km across the margin (b = 2.6).
2.1. Foreland stratigraphy
Since the Late Miocene, the North West Australian
Shelf in the Timor Sea has been a carbonate ramp
whose stratigraphic architecture has been driven prin-
cipally by sea level fluctuations of diverse origin, such
as tectonic subsidence and eustasy (Apthorpe, 1988).
Two unconformities have been identified in the fore-
land succession (Fig. 3). The oldest one, at the base,
interpreted from the juxtaposition of shallow and
deepwater facies, was identified in the commercial
wells Delambre 1 and Buffon 1 (Fig. 1; Apthorpe,
1988). This regional unconformity, at the top of
Middle Miocene limestones (planktonic forams of
Zone N10), is overlain by Late Miocene carbonate
sediments of deep water nature (Zone N15). The
second unconformity, reported by Veevers (1974) at
the ODP Leg 262, separates shallow water upper
Pliocene dolostones and calcarenites from folded
shallow-water lower Pliocene carbonates, at the axis
of the trough. Boheme (1996) also identifies this
unconformity along proprietary seismic profiles.
According to Hillis (1992), the hiatus represents a
short-term depositional break ( < 1 Ma) at Ashmore
NCORRECTED PROOF
ARTICLE IN PRESS
187
188
189
190
191
192
193
194
195
196
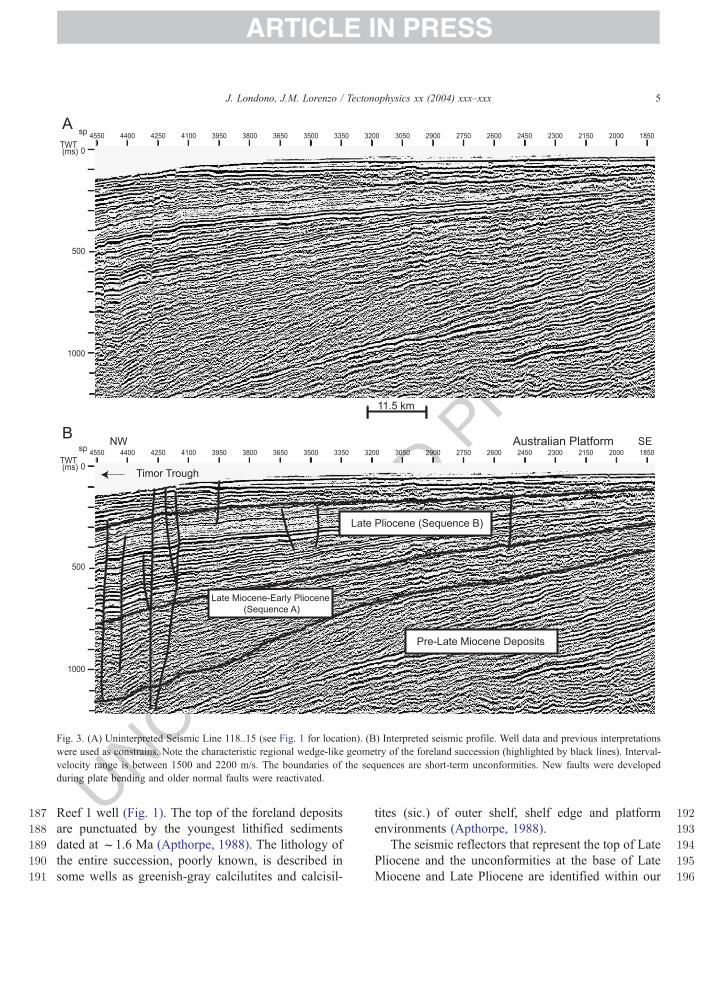
Fig. 3. (A) Uninterpreted Seismic Line 118_15 (see Fig. 1 for location). (B) Interpreted seismic profile. Well data and previous interpretations
were used as constrains. Note the characteristic regional wedge-like geometry of the foreland succession (highlighted by black lines). Interval-
velocity range is between 1500 and 2200 m/s. The boundaries of the sequences are short-term unconformities. New faults were developed
during plate bending and older normal faults were reactivated.
J. Londono, J.M. Lorenzo / Tectonophysics xx (2004) xxx–xxx 5
UReef 1 well (Fig. 1). The top of the foreland deposits
are punctuated by the youngest lithified sediments
dated at f1.6 Ma (Apthorpe, 1988). The lithology of
the entire succession, poorly known, is described in
some wells as greenish-gray calcilutites and calcisil-
tites (sic.) of outer shelf, shelf edge and platform
environments (Apthorpe, 1988).
The seismic reflectors that represent the top of Late
Pliocene and the unconformities at the base of Late
Miocene and Late Pliocene are identified within our
ARTICLE IN PRESS
197
198
199
200
201
202
203
204
205
206
207
208
209
210
211
212
213
214
215
216
217
218
219
220
221
222
223
224
225
226
227
228
229
230
231
232
233
234
235
236
237
238
239
240
241
242
243
244
245
246
247
248
249
250
J. Londono, J.M. Lorenzo / Tectonophysics xx (2004) xxx–xxx6
seismic data. The interpretation (Fig. 3) was carried
out by integration of well information (sequence
thickness and age) and previous reports (Ostby and
Johnstone, 1994; Woods, 1994; Wormald, 1988)
based on seismic data (reflector geometry, interval
time and thickness). Since our goal is to analyze the
temporal evolution of the foreland basin, we divide
the foredeep succession in two packages, as does
Boheme (1996). Using the regional unconformities
we named the oldest Sequence A (Late Miocene to
Early Pliocene) and the youngest Sequence B (Late
Pliocene). The present combined thickness of these
sequences varies between 20 and 800 m.
T
251
252
253
254
255
256
257
258
259
260
261
262
263
264
265
266
267
268
C
3. Data
Over 2000 km of two-dimensional seismic reflec-
tion data, 4 to 6 s recording, 48-fold coverage, from
192 channels with 50 m shot interval and 12.5 m
common-depth points (CDP’s) from the Australian
Geological Survey Organization (AGSO) 1996 seis-
mic program (Fig. 1) are used as the primary source of
data. Most shiptrack lines are parallel to the SSE
Miocene-to-Recent tectonic transport direction. Al-
though seismic profiles only sample the Australian
shelf and southern Timor Trough, they contain enough
information for flexural modeling. Additionally, well
log information and seismic data from the literature
allow us to tie biostratigraphic and lithological data to
the seismic record (Figs. 1 and 3).
E269270
271
272
273
274
275
276
277
278
279
280
281
282
283
284
285
UNCORR4. Methods
Sequence boundary unconformities are mapped
within the entire seismic data. Areas like the Cartier
Through, where the interpretation is ambiguous due to
high deformation, are omitted from subsequent flex-
ural analysis. The largest uncertainty in the recon-
struction of de-compacted thickness and flexure
profiles is associated with estimates of sequence
thickness calculated using interval velocities derived
from the seismic semblance analysis. According to
our seismic data, interval velocities between 1500 and
2500 m/s appear to be the most suitable for the
foreland deposits. These velocities agree with previ-
ous interpretations of proprietary data in the area. For
ED PROOF
this two-end member interval velocity range, the error
in thickness calculation might be 11% to 14%. The
results, where control is possible, match the thickness
range constraint by well information. Isopach maps
derived from our seismic interpretation (Fig. 4) show
local depocenter distribution within the general deep-
ening of the basin during foredeep sedimentation.
4.1. Flexural models
We assume that the accommodation space in the
evolving Timor Sea foreland basin is completely filled
with sediments throughout the two depositional peri-
ods we are analyzing. Unfortunately, there is not
enough data to constrain the water depth at any time.
Thus, we take the base of the sequence profile, at a
particular period, to represent the down-warping top
of the lithosphere and the top of the profile as a
horizontal surface. This, ideally flat surface, rarely
coincides with sea level; rather, it is an abstraction that
represents a horizontal datum of zero deflection and
marks the position of node point along the profile, as
well as the beginning of the forebulge (Fig. 2). These
profiles are used as the principal constraint to develop
models of plate deflection. The theoretical curves,
produced primarily by variation in effective elastic
thickness and in amount of loading, must match
adequately the geometry of the data (de-compacted
thickness profiles) and fit into the geological model of
the basin. We reproduce the theoretical profiles fol-
lowing the mechanical model of the two-dimensional
flexure of an elastic beam, of constant elastic thick-
ness, lying over a viscous substratum (Turcotte and
Schubert, 1982). Table 1 summarizes the parameters
used in these calculations. Seven seismic profiles were
chosen to carry out flexural modeling (Fig. 1). We
discard lines crossing areas deformed by salt-tectonics
and consider only seismic lines collected parallel to
the regional NW–SE tectonic load transport direction.
Foreland basin studies use both broken and con-
tinuous plate models. For example, Tandon et al.
(2000) use a broken plate for modeling the Australian
Shelf, whereas Kruse and Royden (1994) use a
continuous plate model for the Apennine and Dinaride
foreland basins in the Adriatic Sea. Using the present
bathymetric profile of the oceanic floor in the Timor
Sea (Fig. 2), we test both continuous and broken plate
models. In the first case, the point of maximum

UNCORRECTED PROOF
ARTICLE IN PRESS
Fig. 4. Isopach maps for Late Miocene–Early Pliocene (A) and Early Pliocene–Late Pliocene (B). Note the increasing thickness toward the
trench. Map A shows some regional tectonic structures like the Sahul Syncline and Vulcan Sub-basin. In Sequence B (map B) no structure is
clearly distinguishable from the isopach map.
J. Londono, J.M. Lorenzo / Tectonophysics xx (2004) xxx–xxx 7

T
ARTICLE IN PRESS
286
287
288
289
290
291
292
293
294
295
296
297
298
299
300
301
302
303
304
305
306
307
308
309
310
311
312
313
314
315
316
317
318
319
320
321
322
323
324
325
326
327
328
329
330
331
332
333
334
335
336
337
338
339
340
341
342
343
344
345
346
347
348
349
350
351
352
353
354
355
356
357
t1.1 Table 1
Geodynamic constantst1.2
Definition Symbol Value/unitst1.3
Density of water qw 1030 kg/m3t1.4Density of mantle qm 3300 kg/m3t1.5Flexural rigidity D Nmt1.6Effective elastic thickness Te kmt1.7Flexural parameter a mt1.8Maximum deflection Wo m (at point Xo)t1.9Gravitational acceleration g 9.8 m/s2t1.10Young modulus E 11�10 11 Pat1.11V Poisson Ratio 0.25t1.12Load (linear) Po N/mt1.13Bending moment M Nt1.14Curvature R 1/mt1.15
Summary of the mechanical parameters used in the models. The
governing equation for the bending plate is D(d4w/dx4)+
(qm� qw)gw= 0 (Turcotte and Schubert, 1982) assuming a linear
load, where D is flexural rigidity, w is the deflection, qm is the
density of the mantle, qw the density of water infill, g gravity
acceleration. Bending moment (M) is given by equation M =D(d2w/
dx2). Curvature is given by equation R =M/D (Turcotte and
Schubert, 1982).t1.16
J. Londono, J.M. Lorenzo / Tectonophysics xx (2004) xxx–xxx8
UNCORREC
deflection is located 231 km from the node point,
f100 km north of the western margin of Timor
Island. For a broken plate model the maximum extent
of the effective plate is 154 km, and the end of the
plate is located directly below Timor Island. Both
models match the data using an effective elastic
thickness of f40 km. However, we consider that
the assumption of a continuous plate gives more
reliable results. This assumption is based on tectonic
models (Karig et al., 1987) and seismic studies
(Hamilton, 1979; Veevers, 1974) showing the Austra-
lian plate going beyond the present position of the
Banda Arc.
It is important to consider the position of our data
within our modeled profiles at each particular time
(Figs. 1 and 2). Our study area undergoes NNW
displacement with respect to the Eurasian plate
during collision. The same well location, for exam-
ple, will over time occupy a point closer to the
trench. Consequently, within each profile the seismic
data partially records at least two independent flexed
stages of the plate. Sequence A contains sediments
deposited more distally from the trench axis, while
Sequence B contains sediments deposited at sites
more proximal to the trench axis. Today’s position of
the seismic data is assumed to be at the most
ED PROOF
proximal position to Timor Island (tectonic load).
Therefore the present distances between the point of
zero deflection (node point, Fig. 2) and the position
of the linear load (Point of maximum deflection Xo,
Table 1, Figs. 5 and 6) must be the minimum
acceptable value for our models.
4.2. De-compaction calculation
Sediment de-compaction is carried out to obtain the
thickness at the time of deposition. For this calculation
we assume a porosity–depth function / =/0e� cz
(Allen and Allen, 1990; Lerche, 1990), where / is
the estimated present-day porosity and z the present
depth below sea level. Values for c, the /-depth curve-slope coefficient (0.57 km� 1); and /0, initial porosity
(0.63), are taken from studies based on well-logs in the
Australian platform (Hillis, 1990).
Sediments are de-compacted following Steckler
and Watts (1980), using the function S = h(1�/)/(1�/0), where S is the thickness of the de-compacted
layer (sequence) and h the present-day thickness. We
assume that compaction is the product of decreasing
porosity due only to the mechanical non-reversible
process of expulsion of pore water.
From the thickness error introduced by interval
velocities inaccuracy, porosity can change up to
f3%. This in turn introduces an error in de-compacted
thickness up tof7%, which we consider an acceptable
value since the average thickness change isf28%.
4.3. Flexure-related normal faulting
Reactivated normal fault planes dip between 33jand 40j in the shallow section within post Cretaceous
sediments. In the deeper section, some faults are listric
and their traces die out in pre-Mesozoic strata, irre-
spective of fault vergence (Fig. 3). A regional detach-
ment zone is not easily distinguishable along the
seismic data; nonetheless, Paleozoic evaporite beds
are the most probable detachment level in the area.
O’Brien et al. (1993) report some of these faults
cutting basement at 15 to 20 km depths. Newer faults,
developed during foreland evolution, die within Cre-
taceous or younger strata and dip between 40j and
55j along the entire fault trace.
We assume that the fault slip measured along the
fault plane in the foreland basin deposits indicates a

ECTED PROOF
ARTICLE IN PRESS
358
359
360
361
362
363
364
365
366
367
368
369
370
371
372
373
374
375
376
377
378
379
380
381
382
383
384
Fig. 5. Flexural model for Sequence A time (f6.5–3.4 Ma). Gray line represents the seismic data (de-compacted thickness). Black line
represents the theoretical models. These figures represent the best match between both curves. EET is effective elastic thickness; Po is the
amount of load calculated for each model and is located in the most deflected end of the profiles. Note the extent of the deflection between 400
and 470 km.
J. Londono, J.M. Lorenzo / Tectonophysics xx (2004) xxx–xxx 9
UNCORRcomparative amount of deformation caused by exten-
sion due to flexure. Normal faults caused by plate
bending are expected to develop in areas of high
curvature. The more flexed the plate is, the higher
the curvature, where greater tensional stresses produce
brittle deformation (Bradley and Kidd, 1991).
To calculate the apparent displacement in the
section along the fault plane in both sequences,
vertical stratigraphic separation is measured in meters
and corrected by the angle of the fault. The apparent
slip separating the reflector representing the top of
Sequence A documents not only the displacement of
that particular period of deformation, but also subse-
quent movements. Since we are interested in the
apparent slip developed during Sequence A time, it
is necessary to subtract any slip up-dip of the fault
plane affecting younger deposits. We assume that the
fault slip is homogeneous along the entire segment
affecting foreland strata. We identify and measure
over 200 new or reactivated normal faults active
during plate deflection.
5. Results
5.1. Flexure models
Subsidence of the Late Tertiary foreland basin in
the Timor Sea is modeled by flexural deformation of
a homogeneous, elastic, continuous plate. During

ARTICLE IN PRESS
385
386
387
388
389
390
391
392
393
394
395
396
397
398
J. Londono, J.M. Lorenzo / Tectonophysics xx (2004) xxx–xxx10
Sequence A time (f6.6–f3,4 Ma) the maximum
de-compacted thickness is calculated as f1200 m
along seismic profile 116_04, and the minimum is
f400 m along profile 165_09 (Fig. 5). However,
these values are not a direct measure of the deflec-
tion of the plate. In order to do that it is necessary to
evaluate the position of our data and best fitting
UNCORRECT
Fig. 6. Flexural models for sequence B. Note th
models within the regional deflecting trend. A com-
parison between best fitting curves indicates that
during Sequence A time the western part of the
Timor Sea was undergoing remarkably more deflec-
tion at the end of the effective plate than the eastern
part under similar elastic thickness. In contrast,
during Sequence B time (f3.4–f1.6 Ma) a com-
ED PROOF
e homogeneous effective elastic thickness.

T
ARTICLE IN PRESS
399
400
401
402
403
404
405
406
407
408
409
410
411
412
413
414
415
416
417
418
419
420
421
422
423
424
425
426
427
428
429
430
431
432
433
434
435
436
437
438
439
440
441
442
443
444
445
446
447
448
449
450
451
452
453
454
455
456
457
458
t2.1t2.2
t2.3
t2.4t2.5t2.6t2.7t2.8t2.9t2.10t2.11t2.12t2.13t2.14
t2.15
J. Londono, J.M. Lorenzo / Tectonophysics xx (2004) xxx–xxx 11
EC
parison of flexural models indicates that the east
Timor Sea was undergoing more subsidence (flex-
ure) than the western part. The deposits are thicker
in the eastern part of seismic control (up to f979
m) along lines 118_15 and 118_02 (Fig. 6). During
this time the de-compacted thicknesses coincide with
predicted values of plate deflection.
A range of effective elastic thickness values (20 to
120 km) is tested, but only cases where values lie
between 80 and 100 km appear to match the de-
compacted stratigraphic data. For the base of Se-
quence A in the western-central part of the survey
(lines 165_09, 163_01_15, 116_04) effective elastic
thickness values between 80 and 100 km produce
acceptable fitting curves to the data. In the eastern-
most survey area, in turn, only an effective elastic
thickness of 100 km appears to fit the seismic data in
continuous plate models. Our analysis suggests a
maximum deflection of the Australian lithosphere of
about 3500 m in the west Timor Sea. Table 2
summarizes the results of the best fitting curves for
both sequence times.
5.2. Normal faulting
The tension in the upper-half plate caused by
deflection produced abundant normal faulting in the
Australian Platform (Figs. 3 and 7). A greater number
of faults with higher displacement are found in Late
Miocene to Early Pliocene than in Late Pliocene times
(Fig. 8a). The distribution of these faults suggests that
the stresses caused by vertical loading were probably
UNCORRTable 2
Flexural parameters
Sequence EET (km) D (Nm) a (km) Xo (km)
(A)
165_09 80 4.6e24 168 397
163_01_15 100 9.0e24 199 469
116_04 80 4.6e24 168 397
118_02 100 4.6e24 199 469
118_15 100 9.0e24 199 469
(B)
165_09 100 9.0e24 199 469
118_02 100 9.0e24 199 469
118_15 100 9.0e24 199 469
Variables as defined in Table 1. Xo is the distance between the linear load a
zero deflection. Xm is the position of the maximum bending moment alo
D PROOF
higher in the west than in the east Timor Sea, as also
shown by estimates of curvature (Table 2; Fig. 7). The
apparent fault slip measured along the deflected plate
shows that the mean displacement during the se-
quence A period was 40 m in the western area (lines
165_06, 165_09, and 161_03_15) and only f24 m in
the eastern area (lines 118_02, 118_15 and 118_06).
Therefore, the average slip is f66% higher in the
west than in the east. The maximum curvature for
this period, which occurred toward the west, is
f5.1�10� 8 m. During Sequence B time, normal
faulting displacement was also higher in the west
Timor Sea. The mean slip is 34 m in this area (lines
165_06, 165_09, and 161_03_15), whereas for the
east Timor Sea it is < 25 m (lines 118_02, 118_15 and
118_06). The average displacement of these faults is
up to 36% higher in the west than in the east (Fig. 8).
However, the maximum curvature during this period
(f3.4–1.6 Ma) occurs in the east Timor Sea (Table 2)
and it is estimated as f3.2� 10� 8 m. Individual
fault-slip measurements (Figs. 7 and 8) show that
the absolute amount of displacement is up to two
times higher in the west Timor Sea (120 m) than in the
east Timor Sea (maximum slip of 50 m).
E6. DiscussionVariations in the effective elastic thickness of the
Australian lithosphere in the Timor Sea are not
evident during development of the foreland basin.
McNutt (1984) shows that there is a correlation
Po (N/m) Wo (m) Xm (km) M (Nm) R (m)
2.7e13 3552 265 2.35e17 5.11e� 8
2.2e13 2400 313 2.28e17 2.52e� 8
1.3e13 1940 265 1.31e17 2.84e� 8
2.0e13 2226 313 1.23e17 2.65e� 8
8.5e12 928 313 8.8e16 9.7e� 9
1.0e13 655 313 6.21e16 6.87e� 9
2.0e13 2180 313 2.07e17 2.29e� 8
2.8e13 3000 313 2.9e17 3.21e� 8
t the position of maximum deflection and the node point or point of
ng the model.

CORRECTED PROOF
ARTICLE IN PRESS
459
460
461
462
463
464
465
466
467
468
469
470
471
472
Fig. 7. Normal flexural-related faulting for a section of (A) western line 163_01_15 and (B) eastern line 116_04. Note the Early–Late Pliocene
sequence almost unaffected in the western line (A).
J. Londono, J.M. Lorenzo / Tectonophysics xx (2004) xxx–xxx12
UNbetween thermal age and plate thickness: plates older
than 100 myr are expected to be strong (i.e. high
rigidity). By contrast, Watts (2001) notes that no
simple relation exists between thermal age and conti-
nental lithosphere rigidity. Rather, he favors the role
of the crust composition in the present-day geothermal
gradient as the key factor controlling the continental
effective elastic thickness. Since the last tectonic event
to affect the Australian plate prior to bending was
Triassic–Jurassic rifting (geothermal age), the Aus-
tralian continental lithosphere along the northwestern
shelf is expected to be strong. At the beginning of
continental plate collision, during Sequence A time,
models favor an effective elastic thickness ranging

UNCORRECT
ARTICLE IN PRESS
473
474
475
476
477
478
479
480
481
482
483
484
485
486
487
488
489
490
491
492
493
494
495
496
497
498
499
500
501
502
503
504
505
506
507
508
509
510
511
512
513
514
515
516
517
518
519
520
Fig. 8. (a) Fault slip frequency and temporal distribution. Note the
higher displacement during Sequence A time than during Sequence
B time. In (b) and (c) note the distribution of fault slip along the east
and west Timor Sea during foreland evolution.
J. Londono, J.M. Lorenzo / Tectonophysics xx (2004) xxx–xxx 13
ED PROOF
from 80 to 100 km. The Australian lithosphere in the
east Timor Sea appears consistently strong (100 km of
effective elastic thickness), while in the central area of
the survey (Line 116_04, Figs. 1 and 5) and in the
westernmost region of the seismic survey (line
165_09, Figs. 1 and 5) the crust appears weaker, with
an effective elastic thickness of 80 km. During Time
B, however, all models work with an effective elastic
thickness of 100 km (Fig. 6). Noticeably, one best-
fitting model, line 165_09, shows changes in effective
elastic thickness from 80 to 100 km, from one period
to the other, while another, line 118_15, keeps the
same elastic thickness of 100 km in both periods. Our
range of effective elastic thickness (80 to 100 km)
falls within the 25% of uncertainty of estimated
accuracy for similar data (Burov and Diament,
1995). These high values probably indicate an unal-
tered continental lithosphere (no de-coupling) after
being tectonically loaded (Burov and Diament, 1995).
The relatively constant effective elastic thickness
through time rules out any significant weakening of
the Australian plate, therefore, no relaxation and/or
visco-elastic rheology is necessary to model the basin.
Moreover, according to our results, loading appears
not to have any weakening effect on the elastic
thickness of the Australian plate. This is in agreement
with the elastic behavior of the lithosphere during
foreland time.
Lateral and spatial variation in crustal strength has
been previously reported in foreland basins. For the
Bermejo foreland basin in Argentina, Cardozo and
Jordan (2001) invoke inherited heterogeneities in pre-
bending lithosphere as the cause of these variations. In
the Timor Sea, Tandon et al. (2000) develop models of
laterally variable effective elastic thickness (25–75
km) due to changes in curvature. Spatial variation in
the amount of effective elastic thickness has two
probable causes. One could be the effect of an
inherited rheologically heterogeneous basement. The
central-eastern Timor Sea contains crystalline paleo-
highs, which may correspond to regions of higher
effective elastic thickness, while the west Timor Sea is
affected by ancient basement-grabens filled with pre-
Miocene sediments that may decrease lithospheric
strength prior to bending (Lavier and Steckler, 1997;
Fig. 1). The other probable cause could be lateral
variation in strain rate or in strain partitioning, along
the collision zone, (Harris, 1991) resulting in differ-
T
ARTICLE IN PRESS
521
522
523
524
525
526
527
528
529
530
531
532
533
534
535
536
537
538
539
540
541
542
543
544
545
546
547
548
549
550
551
552
553
554
555
556
557
558
559
560
561
562
563
564
565
566
567
568
569
570
571
572
573
574
575
576
577
578
579
580
581
582
583
584
585
586
587
588
589
590
591
592
593
594
595
596
597
598
599
600
601
602
603
604
605
606
607
608
609
610
611
612
613
614
615
616
J. Londono, J.M. Lorenzo / Tectonophysics xx (2004) xxx–xxx14
UNCORREC
ential bending and models of variable lithospheric
strength. The foreland sedimentary-cover appears
not to have a significant effect in the effective elastic
thickness. The Timor Sea foreland sediments do not
reach the 3 to 5 km in thickness that according to
Lavier and Steckler (1997) are the minimum values
necessary to decrease the effective elastic thickness in
areas of crust thinner than 35 km.
The change in the modeled deflection through time
shows that during Late Miocene–Early Pliocene time
the west Timor Sea undergoes greater deflection than
the east Timor Sea. The difference at the point of
maximum deflection (position of linear load) is about
1000 m (lines 165_09 vs. Line 118_02). However,
sediment thickness along the seismic survey shows
that foreland sediments in the east are thicker than in
the west. This apparent contradiction is resolved if we
consider that the two areas represent different lateral
positions within a flexural model. The western part of
the survey is located farther away from the linear load,
and appears thinner in spite of requiring greater
deflection. In contrast, the east Timor Sea appears
thicker in spite of less flexure at the position of the
linear load. During the Late Pliocene, the thickness of
the corresponding foreland sequence coincides with
the amount of flexure, as the eastern area appears
thicker and more deflected than the western part of the
survey (Figs. 5 and 6; Table 2). Although in our model
the physical causes of loading can be diverse, an end
shear vertical force emulates the tectonic (accretionary
wedge) and sediment loading. Different shear force
values are needed to match the data and are possibly
the cause of significant differences in deflection
between the eastern and western Timor Sea. It is
interesting to note that the amount of deflection (up
to f3500 m) is much larger than the expected
subsidence produced by the combination of sea level
changes (0–150 m, Haq et al., 1988) and sediment
loading. The difference in the modeled deflection
between east and west Timor Sea may be due to the
polarity of basin closure. Harris (1991) shows an
oblique southwestern and northeastern propagation
of the collision zone between the Eurasian and Aus-
tralian plates.
At the end of the Early Pliocene, the theoretical
flexure involves f470 km of Australian plate. The
point of maximum deflection and the position of the
linear load (Po in Fig. 9) are located northwestward of
ED PROOF
the present Timor Island (Fig. 9A). The forebulge is
between 269 and 310 km wide and f261 m high. Its
top is located in continental Australia, at a point which
coincides with today’s westernmost Kimberly High-
lands (Fig. 9A). By the end of the Late Pliocene
(f1.6 Ma), the position of the theoretical point of
maximum deflection and linear load (Po) had mi-
grated f120 km southeastward in the west Timor Sea
and f100 km in the central and east Timor Sea
(Fig. 9B). The remaining elements of the flexural
model, such as the flexural node (point of zero
deflection, Xo in Fig. 9) and the top of the forebulge
(Xb in Fig. 9) migrated in the same direction. The
displacement of the flexural elements (100 to 120 km)
is shorter, although of similar magnitude, than the
estimated amount of subducted plate under Eurasia
(150 to 200 km). The estimate rates of plate conver-
gence (Tregoning et al., 1994; Genrich et al., 1995)
suggest that convergence was not constant during
collision. According to our models, at least 570 km
of Australian plate have been flexed due to vertical
loading. Interestingly, the position of the youngest
landward boundary of the regional deflection (Fig.
9B) coincides with the basin-ward boundary of the
un-stretched continental crust, in the Kimberly Block
area (f35 km), as described in the models of Pet-
kovic et al. (2000). This indicates that only stretched
continental crust was flexed during collision in the
west Timor Sea.
According to our results, the upper lithosphere was
experiencing tension followed by normal faulting
coevally with thrusting in the accretionary prism and
flexure along the whole Australian shelf. The distri-
bution of normal faulting throughout the entire survey
and, according to many authors, along the entire
Timor Sea (Baxter et al., 1998; Lorenzo et al., 1998;
O’Brien et al., 1996; Woods, 1994), precludes any
transmission of large horizontal compressional
stresses.
Lorenzo et al. (1998) recognize that the present
curvature of the Timor Trough (10� 7 m� 1) appears
low compared with values reached by Kruse and
Royden (1994) for the Adriatic Sea (10� 6 m� 1).
Our models show an even lower maximum curva-
ture value (10� 8 m� 1). According to Watts (2001)
and Burov and Diament (1992) curvatures of
f10� 6 m� 1 may reduce the effective elastic thick-
ness up to 50%, while values up to 2� 10� 7 m� 1

UNCORRECTED PROOF
ARTICLE IN PRESS
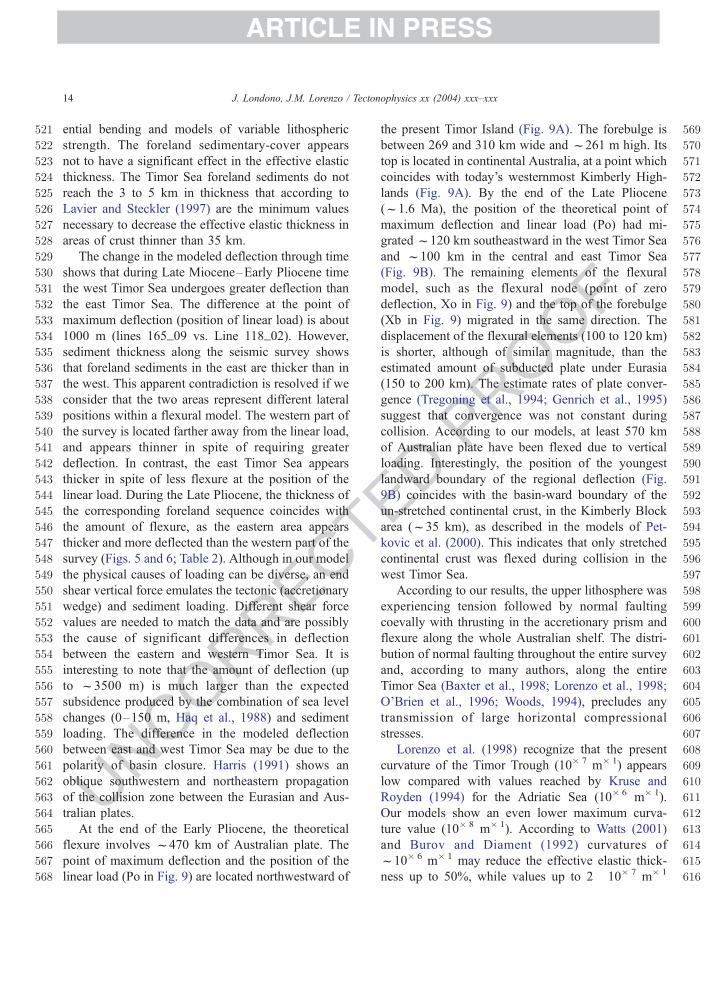
Fig. 9. Late Mioce–Early Pliocene (A) and Late Pliocene (B) geodynamic configuration of Timor Sea. The amount of subducted Australian
lithosphere is at least 100 km, according to this model. Effective elastic thickness (EET) is 80 to 100 km for both periods. Flexural variables as
defined in Tables 1 and 2. Po: Linear load, Xo: node point (0 deflection), Xb: position of the top of the forebulge.
J. Londono, J.M. Lorenzo / Tectonophysics xx (2004) xxx–xxx 15
T
ARTICLE IN PRESS
617
618
619
620
621
622
623
624
625
626
627
628
629
630
631
632
633
634
635
636
637
638
639
640
641
642
643
644
645
646
647
648
649
650
651
652
653
654
655
656
657
658
659
660
661
662
663
664
665
666
667
668
669
670
671
672
673
674
675
676
677
678
679
680
681
682
683
684
685
686
687
688
689
690
691
692
693
694
695
696
697
698
699
700
701
702
703
704
705
706
707
708
709
J. Londono, J.M. Lorenzo / Tectonophysics xx (2004) xxx–xxx16
UNCORREC
may reduce the effective elastic thickness up to
20%. Lower values do not represent a significant
change in effective elastic thickness. Therefore,
according to the values determined in the present
study for the periods of time represented by sequen-
ces A and B, the curvature should not significantly
decrease the effective elastic thickness of the Aus-
tralian plate during continental collision. This agrees
with the invariable effective elastic thickness derived
from flexural models.
Low curvature values also agree with the small
amount of displacement found in flexure-related nor-
mal faults. Although inelastic yielding exists, as
established by faulting, it is not enough to change
the regional rheology of the plate. Therefore the
elastic rheology is consistent with our models. Inter-
estingly, the position of maximum curvature in the
west Timor Sea coincides with the position of the
Cartier Trough, using 80 and 100 km of elastic
thickness for both periods (Figs. 1 and 9). Part of
the Cartier Trough deformation may be attributed to
high concentration of strain due to flexure.
Kruse and Royden (1994) invoke dynamic stresses,
phase changes and conductive heating as causes of
reduction in load in the Adriatic Sea through time.
However, in the Timor foreland basin the load reduc-
tion estimated along the western area is not easily
explained using these causes, since it is considered a
thermally stable zone. One plausible explanation for
the variation in amount of loading in our models is the
changing position of the point of maximum bending
that migrates towards Australia as the linear load
moves in the same direction. The evolution of accre-
tionary prisms conveys continuous development of
new faults and related folds, as well as across-the-
strike terminations and relays of these structures.
These could all be responsible for the adjustment in
the amount of loading affecting the plate through
time. Harris (1991) shows the change in geometry
of the tectonic wedge during the collision of the
Australian and Eurasian plates.
According to our models, the vertical shear stress is
commensurate in the west and east Timor Sea. How-
ever, the amount of deformation due to flexure,
implicitly inferred from fault displacement, indicates
that the west has supported more cumulative strain
than the east. The difference in fault displacement is
significant during the Late Miocene–Early Pliocene,
as the slip is up to 2.5 times greater in the west than in
the east. Increasing deformation in the east Timor Sea
during Late Pliocene time probably indicates an
increase in the amount of stress propagation in the
same direction. This polarity of fault activity in the
Australian plate corroborates the oblique nature of
plate collision suggested by our models of plate
deflection through time and supported by previous
works (Harris, 1991; Hamilton, 1979).
ED PROOF7. Summary
During foreland basin evolution (f6.5 to 1.6 Ma.),
the effective elastic thickness of the Australian litho-
sphere in the Timor Sea is between 80 and 100 km.
These elastic thickness values agree with the old
geothermal age of the Australian Plate. Spatial
changes in plate strength are due to heterogeneities
prior to bending or basement distribution. The east
Timor Sea displays thicker crystalline basement (pale-
ohighs) and appears to be stronger than the west
Timor Sea. The latter exhibits thicker pre-bending
sedimentary-cover filling wide graben structures.
However, the difference in effective elastic thickness
between both areas falls within the estimated error.
The effective elastic thickness does not appear to
change during foreland basin evolution (f6.5. to 1.6
Ma). Consequently, no visco-elastic relaxation can be
inferred from the flexure of the plate during loading.
Foreland sediment cover is too thin to cause any
lithospheric weakening. Curvature of the Australian
plate in the Timor Sea is low when compared to other
foreland basins. The small curvature was not enough
to weaken the lithosphere in the area. Accordingly,
normal faulting exhibits small apparent slip (up to 150
m). Moreover, inelastic yielding appears not to affect
the regional rheology of the Australian lithosphere.
According to our models, at least 570 km of the
Australian plate (mostly areas of stretched continental
crust) was flexed due to vertical loading during the
collision. However, the deflection at one particular
time involved only 400 to 470 km (most of the
Australian Platform). As the tectonic loading ad-
vanced towards continental Australia (100 to 110
km), an increasing portion of the Australian plate
became flexed. These figures correspond to the esti-
mated value of subducted plate. According to our
ARTICLE IN PRESS
710
711
712
713
714
715
716
717
718
719
720
721
722
723
724
725
726
727
728
729
730
731
732
733
734
735
736
737
738
739740741742743744745746747748749750751752753
754755756757758759760761762763764765766767768769770771772773774775776777
J. Londono, J.M. Lorenzo / Tectonophysics xx (2004) xxx–xxx 17
models, the point of maximum deflection was located
under today’s accretionary prism during the entire
period of foreland evolution. The top of the forebulge
was located in continental Australia, and is partially
represented by the Kimberly Highlands.
The deflection of the plate caused by tectonic
loading was at a maximum in the west Timor Sea
(up to 3500 m) at the beginning of the collision and at
a maximum in the east Timor Sea (up to 2300 m) by
the end of the convergence. This eastward propaga-
tion of the deflection indicates the oblique polarity of
the collision between the Eurasian and Australian
plates.
Flexure-related normal faulting corroborates the
oblique character of the collision. Faulting begins to
affect the plate in the west Timor Sea at the beginning
of convergence and propagates eastward in the same
direction as deflection. The west Timor Sea exhibits
higher accumulated deformation due to a longer time
of loading and coeval bending of the plate.
T
778779780781782783784785786787788789790
C
Acknowledgements
We thank Dr. Geoff O’Brian and the Australian
Geological Survey Organisation (AGSO) for allowing
us to use the seismic data. We also express gratitude to
Unavco-GMT for permission to use their programs
and data for preparing part of the maps. We are
grateful to Dr. Patricia Londono for her help with the
preparation of this manuscript.
E 791792793794795796797798799800801802803804805806807808809810UNCORRReferences
Allen, H., Allen, J., 1990. Basin Analysis. Blackwell, Oxford, UK,
pp. 262–281.
Apthorpe, M., 1988. Caionozoic depositional history of the North
West Shelf. In: Purcell, P., Purcell, R. (Eds.), The North West
Shelf of Australia. Petroleum Exploration Society of Australia,
Perth, Australia, pp. 55–84.
Audley-Charles, M., 1986. Timor–Tanimbar trough: the fore-
land basin of the evolving Banda orogen. In: Allen, P.A.,
Homewood, P. (Eds.), Foreland Basin. Blackwell, Oxford,
UK, pp. 91–102.
Baxter, K., Hill, K., Cooper, T., 1998. Quantitative modeling of the
Jurassic–Holocene subsidence history of the Vulcan Sub-basin,
North West Shelf: constraints on lithosphere evolution during
continental breakup. Australian Journal of Earth Sciences 45,
143–154.
ED PROOF
Beamont, C., 1981. Foreland basins. Geophysics Journal Research
of Astronomical Society 65, 471–498.
Boheme, R., 1996. Stratigraphic response to Neogene tectonism on
the Australian Northwestern Shelf. Masters Thesis, Louisiana
State University, Baton Rouge, USA.
Bradley, D., Kidd, W., 1991. Flexural extension of the upper con-
tinental crust in collisional foredeeps. Geological Society of
America Bulletin 103, 1416–1438.
Burov, E., Diament, M., 1992. Flexure of the continental litho-
sphere with multilayered rheology. Geophysical Journal 109,
449–468.
Burov, E., Diament, M., 1995. The effective elastic thickness (Te)
of continental lithosphere: what does it really mean? Journal of
Geophysical Research 100, 3905–3927.
Cardozo, N., Jordan, T., 2001. Causes of spatially variable tectonic
subsidence in the Miocene Bermejo foreland basin. Argentina
Basin Research 13, 335–358.
Dorobek, S., 1995. Synorogenic carbonate platforms and reefs in
foreland basin: controls in stratigraphic evolution and platform/
reef morphology. In: Dorobek, S., Ross, G. (Eds.), Stratigraphic
Evolution of Foreland Basins. SEPM Spec. Publ., vol. 52,
pp. 127–148.
Genrich, J., Bock, Y., McCaffrey, R., Calais, E., Stevens, C., Rais,
J., Subarya, C., Puntodewo, S., 1995. Kinematics of the eastern
Indonesia Island Arc estimated by global positioning system
measurements. EOS, Trans. AGU 75, 162.
Hamilton, W., 1979. Tectonics of the Indonesian Region. US Govt.
Printing office, Washington, USA.
Haq, B., Handerbol, J., Vail, P., 1988. Mesozoic and Cenozoic
chronostratigraphic and eustatic cycles. In: Wilgus, C., Hasting,
B., Kendal, C., Posamentier, H., Ross, Ch., Wagoner, V. (Eds.),
Sea Level Changes: An Integrated Approach. SEPM Spec.
Publ., vol. 42, pp. 71–108.
Harris, R., 1991. Temporal distribution of strain in the active Banda
orogen: a reconciliation of rival hypothesis. Journal of Southeast
Asian Science 6, 371–386.
Hillis, R., 1990. Post-Permian subsidence and tectonics, Vulcan
sub-basin, North West Shelf, Australia. Pacific Rim Congress.
Australian Institute of Mining and Metallurgy, Victoria, Aus-
tralia, pp. 203–211.
Hillis, R., 1992. Evidence of Pliocene erosion at Ashmore reef
(Timor Sea) from the sonic velocities of Neogene Limestone
formations. Exploration Geophysics 23, 489–495.
Karig, D., Barber, A., Charltan, T., Klemperer, S., Hussong, D.,
1987. Nature and distribution of deformation across the Banda
Arc–Australian Collision zone at Timor. Geological Society of
America Bulletin 98, 18–32.
Kruse, S., Royden, L., 1994. Bending and unbending of an elastic
lithosphere: the Cenozoic history of the Apennine and Dinaride
foredeep basins. Tectonics 13, 278–302.
Lavier, L., Steckler, M., 1997. The effect of sedimentary cover on
the flexural strength of continental lithosphere. Nature 389,
476–479.
Lerche, I., 1990. Philosophies and strategies of model building. In:
Cross, T. (Ed.), Quantitative Dynamic Stratigraphy, pp. 21–44.
Lorenzo, J., O’Brien, G., Stewart, J., Tandon, K., 1998. Inelastic
yielding and forebulge shape across a modern foreland basin:

T
ARTICLE IN PRESS
811812813814815816817818819820821822823824825826827828829830831832833834835836837838839840841842843
844845846847848849850851852853854855856857858859860861862863864865866867868869870871872873874875876
877
J. Londono, J.M. Lorenzo / Tectonophysics xx (2004) xxx–xxx18
North west shelf of Australia, Timor Sea. Geophysical Research
Letters 25, 1455–1458.
McNutt, M., 1984. Lithospheric flexure and thermal anomalies.
Journal of Geophysical Research 89, 11180–11194.
Miall, A., 1995. Collision-related foreland basins. In: Busby, C.,
Ingersoll, R. (Eds.), Tectonics of Sedimentary Basin. Blackwell,
Oxford, UK, pp. 393–424.
O’Brian, G., Lisk, M., Duddy, I., Hamilton, J., Woods, J., Cowley,
R., 1999. Plate convergence, foreland development and fault
reactivation: primary control on brine migration, thermal histo-
ries and trap breach in the Timor Sea, Australia. Marine and
Petroleum Geology 16, 533–560.
O’Brien, G., Etheridge, M., Willcox, J., Morse, M., Symonds, P.,
Norman, C., Needham, D., 1993. The structural architecture of
the Timor Sea, North western Australia: implications for basin
development and hydrocarbon exploration. APPEA Journal 34,
258–278.
O’Brien, G., Higgins, R., Symonds, P., Quaife, P., Colwell, J., Blevin,
J., 1996. Basement control on the development of extensional
systems in Australia’s Timor Sea: an example of hybrid hard
linked/soft linked faulting? APPEA Journal 36, 161–200.
Ostby, J., Johnstone, C., 1994. The role of regional seismic surveys
in the exploration of the North West Shelf. In: Purcell, P., Pur-
cell, R. (Eds.), The Sedimentary Basins of Western Australia.
Proceedings of the West Australian Basin Symposium, Perth,
Australia, pp. 211–222.
Petkovic, P., Collins, C., Finlayson, D., 2000. A crustal transect
between Precambrian Australia and the Timor Trough across
the Vulcan Sub-basin. Tectonophysics 329, 23–38.
Richardson, A., Blundell, D., 1996. Continental collision in the
Banda arc. In: Hall, R., Blundell, D. (Eds.), Tectonic Evolution
of South East Asia. Geological Society of London Special Pub-
lication, vol. 106, pp. 47–60.
UNCORREC
ED PROOF
Steckler, M., Watts, A., 1980. The Gulf of Lion: subsidence of a
young continental lithosphere. Nature 287, 135–139.
Tandon, K., Lorenzo, L., O’Brien, G., 2000. Effective elastic thick-
ness of the northern Australian continental lithosphere subduct-
ing beneath the Banda Orogen (Indonesia): inelastic failure at
the start of continental subduction. Tectonophysics 329, 39–60.
Tregoning, P., Brunner, F., Bock, Y., Puntodewo, S., McCaffrey, R.,
Genrich, J., Calais, E., Rias, J., Subarya, C., 1994. First geodetic
measurement of convergence across the Java Trench. Geophys-
ics Research Letters 21, 2135–2138.
Turcotte, D., Schubert, G., 1982. Geodynamics. Application of
Continuum Physics to Geological Problems. Wiley, New York,
USA.
Veevers, J., 1974. Sedimentary sequences of the Timor Trough,
Timor, and the Sahul Shelf. In: Veevers, J., Heirtzler, J., et al.,
(Eds.), Initial Reports of the Deep Sea Drilling Project, vol. 27,
pp. 567–569.
Watts, A., 2001. Isostasy and Flexure of the Lithosphere. Cam-
bridge Univ. Press, Cambridge UK.
Woods, E., 1994. A salt related detachment model of the devel-
opment of the Vulcan sub-basin. In: Purcell, P., Purcell, R.
(Eds.), The Sedimentary Basins of Western Australia. Proceed-
ings of the West Australian Basin Symposium, Perth, Australia,
pp. 259–274.
Wormald, G., 1988. The geology of the Challis–Oilfield–Timor
Sea, Australia. In: Purcell, P., Purcell, R. (Eds.), The North West
Shelf of Australia. Petroleum Exploration Society of Australia,
Perth, Australia, pp. 425–438.
Yang, K., Dorobek, S., 1995. The Permian basin of west Texas and
New Mexico: tectonic history of a composite foreland basin and
its effects on stratigraphic development. In: Dorobek, S.L.,
Ross, G.M. (Eds.), Stratigraphic Evolution of Foreland Basins.
SEPM Spec. Publ., vol. 52, pp. 149–174.