article doi: mexican-lineage low pathogenicity avian
TRANSCRIPT

Page 1 of 15
Article DOI: https://doi.org/10.3201/eid2612.200268
Mexican-Lineage Low Pathogenicity Avian Influenza (H5N2) Viruses, Dominican
Republic Appendix
Materials and Methods
We sequenced complete genomes of 19 low pathogenicity avian influenza viruses
(LPAIVs) identified in the Dominican Republic during 2007–2019, including 1 from 2007, 6
from 2017, 1 from 2018, and 11 from 2019. We extracted viral RNA by using the MagMAX
Viral RNA Isolation Kit (Ambion/ThermoFisher Scientific, https://www.thermofisher.com). All
8 segments of isolates were amplified by multi-segment reverse transcription-PCR (1) and
whole-genome sequencing was conducted by using the Miseq system (Illumina,
https://www.illumina.com). We used the Nextera XT DNA Sample Preparation Kit (Illumina) to
generate multiplexed paired-end sequencing libraries, according to the manufacturer’s
instructions. The dsDNA was fragmented and tagged with adapters by Nextera XT transposase
and 12-cycle PCR amplification. Fragments were purified on Agencourt AMpure XP beads
(Beckman Coulter, https://www.beckmancoulter.com) and analyzed on a High Sensitivity DNA
Chip on the Bioanalyzer (Agilent Technologies, https://www.agilent.com). The barcoded
multiplexed library sequencing was performed by using the 250 cycle MiSeq Reagent Kit v2
(Illumina). We performed de novo and directed assembly of genome sequences by using SeqMan
NGen version 4 (https://www.nihlibrary.nih.gov/resources/tools/seqman-ngen). We deposited
nucleotide sequences in GenBank (Appendix Table 3).
For phylogenetic analysis, we downloaded all sequences of H5N2 virus lineages from
Mexico were downloaded from the National Center for Biotechnology Information Influenza
Virus Resource database (https://www.ncbi.nlm.nih.gov) and added to sequence alignments in
September 2019. On the basis of BLAST (http://blast.ncbi.nlm.nih.gov/Blast.cgi) searches of HA
and NA genes, North American lineage avian influenza virus sequences that were collected
Page 2 of 15
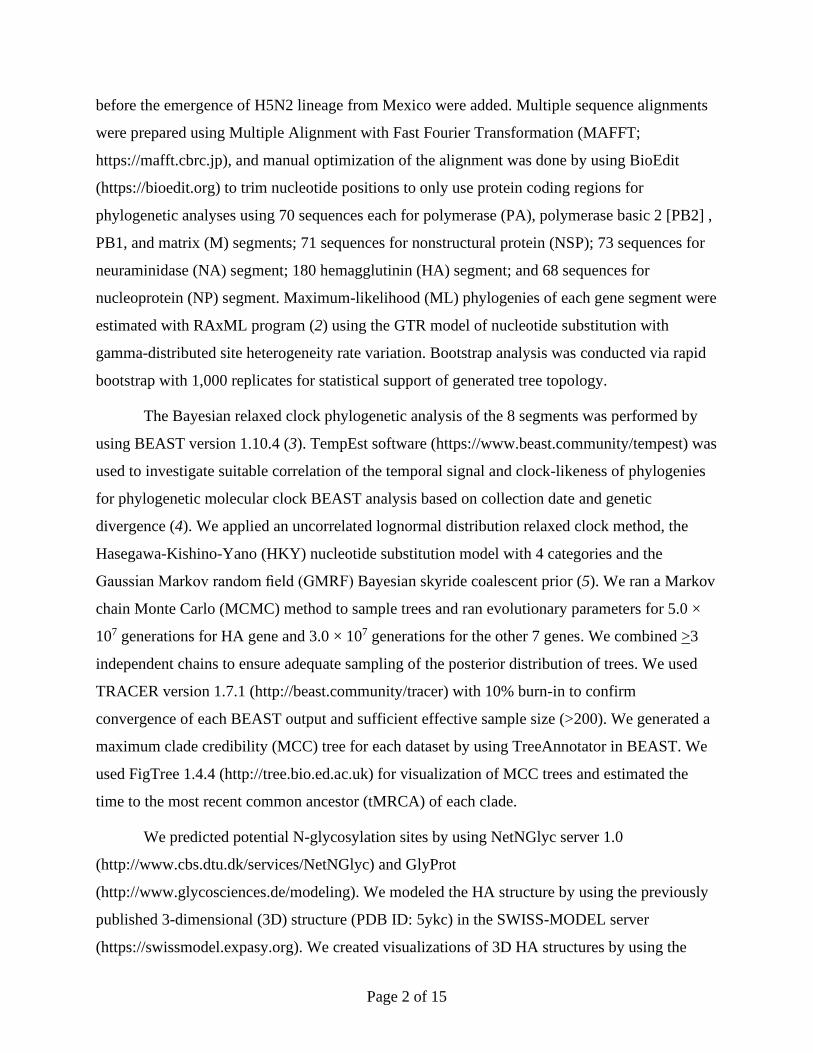
before the emergence of H5N2 lineage from Mexico were added. Multiple sequence alignments
were prepared using Multiple Alignment with Fast Fourier Transformation (MAFFT;
https://mafft.cbrc.jp), and manual optimization of the alignment was done by using BioEdit
(https://bioedit.org) to trim nucleotide positions to only use protein coding regions for
phylogenetic analyses using 70 sequences each for polymerase (PA), polymerase basic 2 [PB2] ,
PB1, and matrix (M) segments; 71 sequences for nonstructural protein (NSP); 73 sequences for
neuraminidase (NA) segment; 180 hemagglutinin (HA) segment; and 68 sequences for
nucleoprotein (NP) segment. Maximum-likelihood (ML) phylogenies of each gene segment were
estimated with RAxML program (2) using the GTR model of nucleotide substitution with
gamma-distributed site heterogeneity rate variation. Bootstrap analysis was conducted via rapid
bootstrap with 1,000 replicates for statistical support of generated tree topology.
The Bayesian relaxed clock phylogenetic analysis of the 8 segments was performed by
using BEAST version 1.10.4 (3). TempEst software (https://www.beast.community/tempest) was
used to investigate suitable correlation of the temporal signal and clock-likeness of phylogenies
for phylogenetic molecular clock BEAST analysis based on collection date and genetic
divergence (4). We applied an uncorrelated lognormal distribution relaxed clock method, the
Hasegawa-Kishino-Yano (HKY) nucleotide substitution model with 4 categories and the
Gaussian Markov random field (GMRF) Bayesian skyride coalescent prior (5). We ran a Markov
chain Monte Carlo (MCMC) method to sample trees and ran evolutionary parameters for 5.0 ×
107 generations for HA gene and 3.0 × 10⁷ generations for the other 7 genes. We combined >3
independent chains to ensure adequate sampling of the posterior distribution of trees. We used
TRACER version 1.7.1 (http://beast.community/tracer) with 10% burn-in to confirm
convergence of each BEAST output and sufficient effective sample size (>200). We generated a
maximum clade credibility (MCC) tree for each dataset by using TreeAnnotator in BEAST. We
used FigTree 1.4.4 (http://tree.bio.ed.ac.uk) for visualization of MCC trees and estimated the
time to the most recent common ancestor (tMRCA) of each clade.
We predicted potential N-glycosylation sites by using NetNGlyc server 1.0
(http://www.cbs.dtu.dk/services/NetNGlyc) and GlyProt
(http://www.glycosciences.de/modeling). We modeled the HA structure by using the previously
published 3-dimensional (3D) structure (PDB ID: 5ykc) in the SWISS-MODEL server
(https://swissmodel.expasy.org). We created visualizations of 3D HA structures by using the

Page 3 of 15
PyMOL Molecular Graphics System Version 2.0 (Schrödinger, LLC,
https://www.schrodinger.com).
For the intravenous pathogenicity index of viruses, 10 6-week-old specific pathogen free
chickens were inoculated intravenously with 0.1 ml of 1:10 dilutions of infectious allantoic
fluids. The intravenous pathogenicity index (IVPI) was calculated according to the World
Organization for Animal Health standard protocol (http://www.oie.int/international-standard-
setting/terrestrial-code). Isolates with an IVPI >1.2 were determined to be HPAI. The challenge
study and all experiments with live viruses were conducted in a Biosafety Level 3 facility.
References
1. Chrzastek K, Lee DH, Smith D, Sharma P, Suarez DL, Pantin-Jackwood M, et al. Use of Sequence-
Independent, Single-Primer-Amplification (SISPA) for rapid detection, identification, and
characterization of avian RNA viruses. Virology. 2017;509:159–66. PubMed
https://doi.org/10.1016/j.virol.2017.06.019
2. Stamatakis A. RAxML version 8: a tool for phylogenetic analysis and post-analysis of large
phylogenies. Bioinformatics. 2014;30:1312–3. PubMed
https://doi.org/10.1093/bioinformatics/btu033
3. Drummond AJ, Rambaut A. BEAST: Bayesian evolutionary analysis by sampling trees. BMC Evol
Biol. 2007;7:214. PubMed https://doi.org/10.1186/1471-2148-7-214
4. Rambaut A, Lam TT, Max Carvalho L, Pybus OG. Exploring the temporal structure of heterochronous
sequences using TempEst (formerly Path-O-Gen). Virus Evol. 2016;2:vew007. PubMed
https://doi.org/10.1093/ve/vew007
5. Minin VN, Bloomquist EW, Suchard MA. Smooth skyride through a rough skyline: Bayesian
coalescent-based inference of population dynamics. Mol Biol Evol. 2008;25:1459–71. PubMed
https://doi.org/10.1093/molbev/msn090

Page 4 of 15
Appendix Table 1. Summary of World Organization for Animal Health report on Mexican-lineage low pathogenicity avian influenza H5N2 virus outbreak, Dominican Republic, December 2017–February 2018
No. Date Region Unit No.
susceptible No.
cases No.
deaths
No. killed and
disposed No.
slaughtered Affected
population 1 2007 Dec 12 Higuey, La Otra Banda, La
Altagracia Village 15 1 0 0 15 –
2 2007 Dec 12 Traspatio, Santo Domingo, Distrito Nacional
Village 115 1 0 0 115 Live bird market
3 2007 Dec 21 San Pedro de Macoris, San Pedro de Macoris, San Pedro
De Macoris
Village 5 1 0 5 0 –
4 2008 Jan 4 La Vega, Bacuí, Barranca, La Vega
Village 26 1 0 26 0 Fighting cock from
Higuey 5 2008 Jan 10 Villa El Sombrero, El
Sombrero, Baní, Peravia Village 114 1 0 114 0 –
6 2008 Jan 11 La Otra Banda, Cruce del Isleño, La Otra Banda, La
Altagracia
Village 330 0 0 0 330 Fighting birds
7 2008 Jan 16 Santo Domingo Oeste, Hato Nuevo, Santo Domingo,
Distrito Nacional
Village 205 1 0 205 – Fighting cocks
8 2008 Jan 18 Batey Central, Barahona Village 30 0 0 0 30 Fighting cocks
9 2008 Jan 26 Corbano Sur, San Juan Village 5 0 0 0 5 Backyard birds
10 2008 Jan 28 Villa Gonzalez, La Delgada, Villa Gonzalez, Santiago
Village 22 0 0 0 22 Fighting cocks
11 2008 Feb 4 Pedernales, Pedernales Village 4 0 0 0 4 Fighting cocks
Total – – – 871 6 0 350 521 – Statistics Apparent morbidity rate, % Apparent mortality rate, % Apparent case fatality rate, % Proportion
susceptible animals lost, %
0.69 0.00 0.00 100.00

Page 5 of 15
Appendix Table 2. Summary of World Organization for Animal Health report on Mexican-lineage low pathogenicity avian influenza H5N2 virus outbreaks, Dominican Republic, September 2017–June 2019
No. Date Region Epidemiology
Unit
No. suscepti
ble No.
cases No.
deaths
No. killed and
disposed No.
slaughtered Affected
population 12 2017 Sep 30 Espaillat,
Guanabano, Moca, Espaillat
Farm 48,877 1,953 1,953 46,924 0 Population kept in a farm composed of 8 layer units
13 2017 Oct 10 San Juan, Sabana Alta, San Juan de la Maguana, San Juan
Farm 46,500 12,657 12,657 33,843 0 Broiler chickens in 3
sheds 14 2017 Oct 10 La Vega, Río Verde
Arriba, Arroyo Hondo, Rio Verde Arriba, La Vega
Farm 34,000 1,639 1,639 32,361 0 Layer hens in 5 sheds
15 2017 Oct 30 La Vega, Cutupú, Río Verde Arriba, La
Vega
Farm 27,410 1,257 1,257 26,153 0 Layer hens in 4 sheds
16 2017 Dec 11 La Vega, Cutupú, Cutupú, Rio Verde
Arriba, La Vega
Farm 35,000 43 43 34,957 0 Layer hens in production
17 2018 Jan 9 Salcedo/Hermanas Mirabal, Jayabo, Salcedo, Salcedo
Farm 11,500 785 785 10,715 0 Layer hens in 2 sheds
18 2018 Jan 9 Salcedo/Hermanas Mirabal, Jayabo, Salcedo, Salcedo
Farm 32,400 – 0 32,400 0 Layer hens in production
19 2018 Jan 10 La Vega, Rio Verde Arriba, Arroyo
Hondo, Rio Verde Arriba, La Vega
Farm 26 6 0 26 0 Backyard hens
20 2018 Mar 20 La Vega, Río Verde Arriba, Cutupú, Rio
Verde Arriba, La Vega
Farm 34,500 30 30 34,470 0 Layer hens distributed between 3
coops 21 2018 Apr 2 La Vega, Caguey,
Rio Verde Arriba, La Vega
Farm 22,965 46 46 22,919 0 Layer hens distributed between 4
coops 22 2018 Nov 2 Puerto Plata,
Cayacoa, Luperón, Puerto Plata
Backyard 1,126 773 745 136 217 Backyard birds (hens,
ducks, turkeys and guinea
fowls) 23 2018 Dec 30 Espaillat, El Corozo,
Moca, Espaillat Farm 1,800 30 – 0 0 Family farm
with Israeli chicks
24 2018 Dec 27 Puerto Plata, Cayacoa, Luperón,
Puerto Plata
Backyard 55 7 7 48 0 Laying hens
25 2019 Jan 8 Espaillat, Quebrada Honda, Moca,
Espaillat
Backyard 56,685 2,350 2,350 0 54,335 Family farm with heavy
birds 26 2019 Jan 8 Espaillat, El Corozo,
Moca, Espaillat Farm 3,000 27 – 0 0 Family farm
with Israeli chicks
27 2019 Jan 10 Espaillat, El Caminito de la Rosario, Moca,
Espaillat
Farm 45,000 535 530 0 0 Light layer birds
28 2019 Jan 14 Espaillat, Hincha, Moca, Espaillat
Farm 18,000 10 – 0 17,990 Light layer birds
29 2019 Jan 21 Espaillat, Las Lagunas, Moca,
Espaillat
Farm 59,097 21 – 0 0 Backyard poultry
30 2019 Jan 22 Espaillat, Monte de la Jagua, Moca,
Espaillat
Backyard 19 12 7 0 0 Backyard poultry

Page 6 of 15
No. Date Region Epidemiology
Unit
No. suscepti
ble No.
cases No.
deaths
No. killed and
disposed No.
slaughtered Affected
population 31 2019 Jan 24 Santo Domingo, Mal
Nombre, La Victoria, Distrito Nacional
Backyard 50 30 – 0 0 Fighting cocks
32 2019 Feb 5 Espaillat, Juan López, Moca,
Espaillat
Farm 14,170 2,330 2,330 0 10,050 Broilers
33 2019 Feb 5 Espaillat, Cuero Duro, San Victor,
Espaillat
Farm 3,500 550 550 0 2,950 Broilers
34 2019 Feb 10 Salcedo, La ceiba, Villa Tapa, Salcedo
Farm 96,963 9 6 0 0 Light layers
35 2019 Feb 21 La Vega, Monte Adentro, La Vega,
La Vega
Farm 3,500 10 5 0 3,490 Light layers
36 2019 Feb 23 San José de Ocoa, El Estrecho, Rancho Arriba, San Jose De
Ocoa
Farm 45,000 7,145 2,140 37,855 0 Heavy layers
37 2019 May 8 Santiago, Tamboril, Tamboril, Santiago
Farm 247,718 5 – 0 247,713 Broilers
38 2019 May 22 La Vega, Rio Verde, La Vega, La Vega
Farm 19,500 1 – 0 0 Light layers
39 2019 Jun 2 Espaillat, Las Barias, Moca, Espaillat
Farm 25,000 11 – 0 24,989 Israeli-bred hens
Total – – – 933,361 32,272 27,080 312,807 361,734 – Statistics Apparent morbidity rate, % Apparent mortality rate, % Apparent case fatality rate, % Proportion
susceptible animals lost, %
3.46 2.90 83.91 75.17
Page 7 of 15
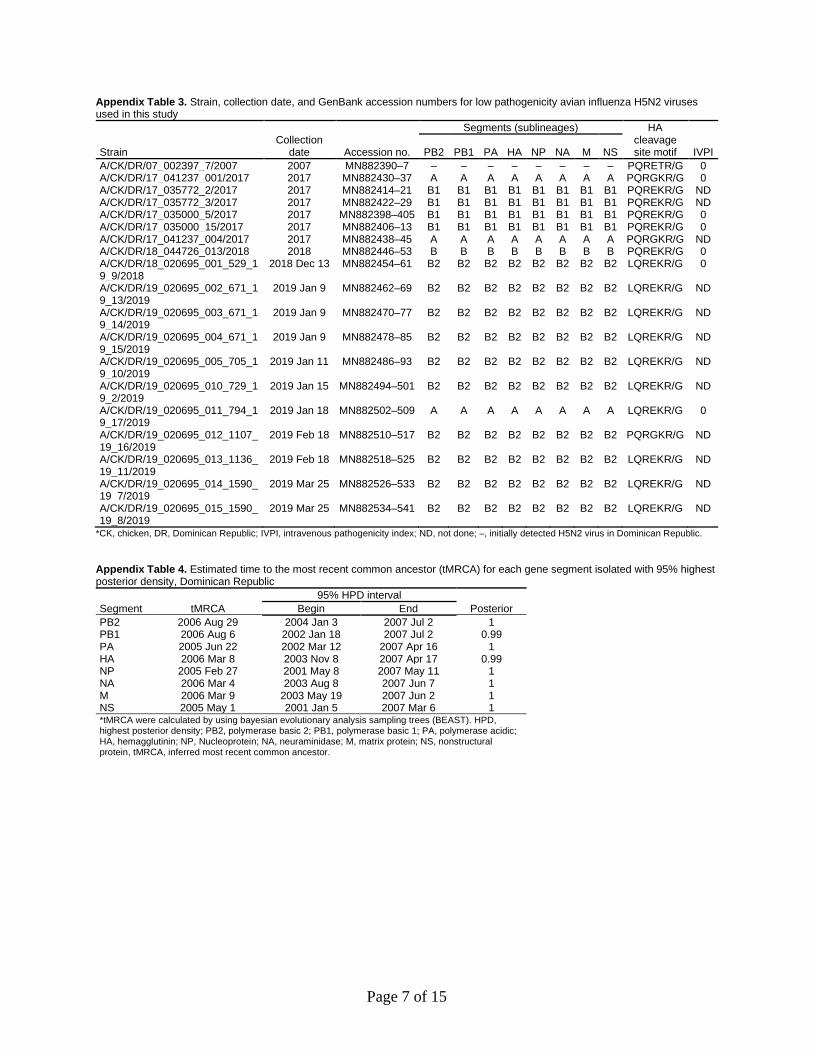
Appendix Table 3. Strain, collection date, and GenBank accession numbers for low pathogenicity avian influenza H5N2 viruses used in this study
Strain Collection
date Accession no.
Segments (sublineages) HA cleavage site motif IVPI PB2 PB1 PA HA NP NA M NS
A/CK/DR/07_002397_7/2007 2007 MN882390–7 – – – – – – – – PQRETR/G 0 A/CK/DR/17_041237_001/2017 2017 MN882430–37 A A A A A A A A PQRGKR/G 0 A/CK/DR/17_035772_2/2017 2017 MN882414–21 B1 B1 B1 B1 B1 B1 B1 B1 PQREKR/G ND A/CK/DR/17_035772_3/2017 2017 MN882422–29 B1 B1 B1 B1 B1 B1 B1 B1 PQREKR/G ND A/CK/DR/17_035000_5/2017 2017 MN882398–405 B1 B1 B1 B1 B1 B1 B1 B1 PQREKR/G 0 A/CK/DR/17_035000_15/2017 2017 MN882406–13 B1 B1 B1 B1 B1 B1 B1 B1 PQREKR/G 0 A/CK/DR/17_041237_004/2017 2017 MN882438–45 A A A A A A A A PQRGKR/G ND A/CK/DR/18_044726_013/2018 2018 MN882446–53 B B B B B B B B PQREKR/G 0 A/CK/DR/18_020695_001_529_19_9/2018
2018 Dec 13 MN882454–61 B2 B2 B2 B2 B2 B2 B2 B2 LQREKR/G 0
A/CK/DR/19_020695_002_671_19_13/2019
2019 Jan 9 MN882462–69 B2 B2 B2 B2 B2 B2 B2 B2 LQREKR/G ND
A/CK/DR/19_020695_003_671_19_14/2019
2019 Jan 9 MN882470–77 B2 B2 B2 B2 B2 B2 B2 B2 LQREKR/G ND
A/CK/DR/19_020695_004_671_19_15/2019
2019 Jan 9 MN882478–85 B2 B2 B2 B2 B2 B2 B2 B2 LQREKR/G ND
A/CK/DR/19_020695_005_705_19_10/2019
2019 Jan 11 MN882486–93 B2 B2 B2 B2 B2 B2 B2 B2 LQREKR/G ND
A/CK/DR/19_020695_010_729_19_2/2019
2019 Jan 15 MN882494–501 B2 B2 B2 B2 B2 B2 B2 B2 LQREKR/G ND
A/CK/DR/19_020695_011_794_19_17/2019
2019 Jan 18 MN882502–509 A A A A A A A A LQREKR/G 0
A/CK/DR/19_020695_012_1107_19_16/2019
2019 Feb 18 MN882510–517 B2 B2 B2 B2 B2 B2 B2 B2 PQRGKR/G ND
A/CK/DR/19_020695_013_1136_19_11/2019
2019 Feb 18 MN882518–525 B2 B2 B2 B2 B2 B2 B2 B2 LQREKR/G ND
A/CK/DR/19_020695_014_1590_19_7/2019
2019 Mar 25 MN882526–533 B2 B2 B2 B2 B2 B2 B2 B2 LQREKR/G ND
A/CK/DR/19_020695_015_1590_19_8/2019
2019 Mar 25 MN882534–541 B2 B2 B2 B2 B2 B2 B2 B2 LQREKR/G ND
*CK, chicken, DR, Dominican Republic; IVPI, intravenous pathogenicity index; ND, not done; –, initially detected H5N2 virus in Dominican Republic. Appendix Table 4. Estimated time to the most recent common ancestor (tMRCA) for each gene segment isolated with 95% highest posterior density, Dominican Republic
Segment tMRCA 95% HPD interval
Posterior Begin End PB2 2006 Aug 29 2004 Jan 3 2007 Jul 2 1 PB1 2006 Aug 6 2002 Jan 18 2007 Jul 2 0.99 PA 2005 Jun 22 2002 Mar 12 2007 Apr 16 1 HA 2006 Mar 8 2003 Nov 8 2007 Apr 17 0.99 NP 2005 Feb 27 2001 May 8 2007 May 11 1 NA 2006 Mar 4 2003 Aug 8 2007 Jun 7 1 M 2006 Mar 9 2003 May 19 2007 Jun 2 1 NS 2005 May 1 2001 Jan 5 2007 Mar 6 1 *tMRCA were calculated by using bayesian evolutionary analysis sampling trees (BEAST). HPD, highest posterior density; PB2, polymerase basic 2; PB1, polymerase basic 1; PA, polymerase acidic; HA, hemagglutinin; NP, Nucleoprotein; NA, neuraminidase; M, matrix protein; NS, nonstructural protein, tMRCA, inferred most recent common ancestor.

Page 8 of 15
Appendix Table 5. Predicted N-glycosylation sites in HA proteins of avian influenza H5N2/Dominican Republic Strains
Strain/genetic cluster Glycosylation site (H5 numbering)
27 39 142* 181* 252* 277 302 496 555 A/chicken/Dominican_Republic/07_002397_7/2007(H5N2)
NSTK NVTV
NNTN NDSI
NSSM NGTY NGSL
A/chicken/Dominican_Republic/17_041237_001/2017(H5N2) / A
NSTT NVTV NASA NNTN
NSSM NGTY NGSL
A/chicken/Dominican_Republic/17_041237_004/2017(H5N2) / A
NSTT NVTV NASA NNTN
NSSM NGTY NGSL
A/chicken/Dominican_Republic/19_020695_011_794_19_17/2019(H5N2) / A
NSTT NVTV NASA NNTN
NSSM NGTY NGSL
A/chicken/Dominican_Republic /18_044726_013/2018(H5N2) / B
NSTK NVTV NASA NNTN NSSL NGTY NGSL
A/chicken/Dominican_Republic/17_035772_2/2017(H5N2) / B1
NSTK NVTV NATA NNTN
NSSL NGTY
A/chicken/Dominican_Republic/17_035000_5/2017(H5N2) / B1
NSTK NVTV NATA NNTN
NSSL NGTY
A/chicken/Dominican_Republic/17_035000_15/2017(H5N2) / B1
NSTK NVTV NATA NNTN
NSSL NGTY
A/chicken/Dominican_Republic /17_035772_3/2017(H5N2) / B1
NSTK NVTV NATA NNTN
NSTI NSSL NGTY
A/chicken/Dominican_Republic /19_020695_010_729_19_2/2019(H5N2) / B2
NSTT NVTV NASA NNTN NDSI
NSSL NGTY NGSL
A/chicken/Dominican_Republic /19_020695_014_1590_19_7/2019(H5N2) / B2
NSTT NVTV NASA NNTN NDSI
NSSL NGTY NGSL
A/chicken/Dominican_Republic /19_020695_015_1590_19_8/2019(H5N2) / B2
NSTT NVTV NASA NNTN NDSI
NSSL NGTY NGSL
A/chicken/Dominican_Republic /19_020695_001_529_19_9/2019(H5N2) / B2
NSTT NVTV NASA NNTD NDSI
NSSL NGTY NGSL
A/chicken/Dominican_Republic /19_020695_005_705_19_10/2019(H5N2) / B2
NSTT NVTV NASA NNTN NDSI
NSSL NGTY NGSL
A/chicken/Dominican_Republic /19_020695_013_1136_19_11/2019(H5N2) / B2
NSTT NVTV NASA NNTN NDSI
NSSL NGTY NGSL
A/chicken/Dominican_Republic /19_020695_002_671_19_13/2019(H5N2) / B2
NSTT NVTV NASA NNTD NDSI
NSSL NGTY NGSL
A/chicken/Dominican_Republic /19_020695_003_671_19_14/2019(H5N2) / B2
NSTT NVTV NASA NNTN NDSI
NSSL NGTY NGSL
A/chicken/Dominican_Republic /19_020695_004_671_19_15/2019(H5N2) / B2
NSTT NVTV NASA NNTN NDSI
NSSL NGTY NGSL
A/chicken/Dominican_Republic /19_020695_012_1107_19_16/2019(H5N2) / B2
NSTT NVTV NASA
NDSI
NSSL NGTY NGSL
*Predicted N-glycosylation sites on antigenic site.

Page 9 of 15
Appendix Figure 1. Maximum-likelihood phylogeny for the PB2 genome segment sequences of low
pathogenicity avian influenza H5N2 viruses, Dominican Republic. Bootstrap values >70% are shown. The
scale bar indicates the number of nucleotide substitutions per site.
Appendix Figure 2. Maximum-likelihood phylogeny for the PB1 genome segment sequences of low
pathogenicity avian influenza H5N2 viruses, Dominican Republic. Bootstrap values >70% are shown. The
scale bar indicates the number of nucleotide substitutions per site.

Page 10 of 15
Appendix Figure 3. Maximum-likelihood phylogeny for the PA genome segment sequences of low
pathogenicity avian influenza H5N2 viruses, Dominican Republic. Bootstrap values >70% are shown. The
scale bar indicates the number of nucleotide substitutions per site.

Page 11 of 15
Appendix Figure 4. Maximum-likelihood phylogeny for the HA genome segment sequences of low
pathogenicity avian influenza H5N2 viruses, Dominican Republic. Bootstrap values >70% are shown. The
scale bar indicates the number of nucleotide substitutions per site.

Page 12 of 15
Appendix Figure 5. Maximum-likelihood phylogeny for the NP genome segment sequences of low
pathogenicity avian influenza H5N2 viruses, Dominican Republic. Bootstrap values >70% are shown. The
scale bar indicates the number of nucleotide substitutions per site.
Appendix Figure 6. Maximum-likelihood phylogeny for the NA genome segment sequences of low
pathogenicity avian influenza H5N2 viruses, Dominican Republic. Bootstrap values >70% are shown. The
scale bar indicates the number of nucleotide substitutions per site.

Page 13 of 15
Appendix Figure 7. Maximum-likelihood phylogeny for the M genome segment sequences of low
pathogenicity avian influenza H5N2 viruses, Dominican Republic. Bootstrap values >70% are shown. The
scale bar indicates the number of nucleotide substitutions per site.

Page 14 of 15
Appendix Figure 8. Maximum-likelihood phylogeny for the NS genome segment sequences of low
pathogenicity avian influenza H5N2 viruses, Dominican Republic. Bootstrap values >70% are shown. The
scale bar indicates the number of nucleotide substitutions per site.
Appendix Figure 9. In silico 3-dimensional (3D) structure prediction and comparison of hemagglutinin
protein of low pathogenicity avian influenza H5N2 virus, Dominican Republic. Only monomers are shown.
A) CK/DR/07-002397-7/2007; B) genetic cluster A/B/B1 2017–2019; C) genetic cluster B1

Page 15 of 15
CK/DR/035772-3/2017; D) genetic cluster B2, 2018–2019; E) genetic cluster B2 CK/DR/020695-012-
1107/2019. Predicted antigenic sites are yellow-orange, slate, green, cyan, and violet. Predicted N-
glycosylation sites located on antigenic sites are in orange and the others are represented with red. The
N-glycosylation site patterns different from A/CK/Dominican_Republic/07–002397–7/2007 strain are
indicated with red arrows for additions, blue crosses for deletions, and orange asterisks for predicted
conformational change at antigenic–glycosylation site.