article 17 national summary factsheet luxembourg
TRANSCRIPT

Article 17 National Summary Factsheet June 2020
Article 17 National Summary Factsheet –
Luxembourg
This factsheet provides statistics presenting the main results from the Member States’ Article 17 reports from the reporting period 2013 – 2018.

Article 17 National Summary Factsheet June 2020
2
Contents
1 General information on Natura 2000 network ........................................................................................... 3
1.1 Natura 2000 network and site designation - number and area of SCIs and SACs............................... 3
1.2 Natura 2000 sites (SACs) - Conservation measures and management plans. .................................... 3
2 General information on habitats and species reported ............................................................................. 4
2.1 Number of habitats and species/subspecies ....................................................................................... 4
3 Conservation status & trends ..................................................................................................................... 5
3.1 Overall assessment of conservation status ......................................................................................... 5
3.2 Overall trend in conservation status ................................................................................................... 5
3.3 Overall assessment of conservation status of habitats and species by biogeographical/marine region .. 6
3.4 Conservation status and trend in conservation status by habitat category/species group ................ 7
3.5 Genuine changes of conservation status and trend ............................................................................ 9
4 Condition of habitat: good / unknown / not good condition .................................................................. 11
5 Main pressures and threats ...................................................................................................................... 12
5.1 Frequency of main pressures and threats ......................................................................................... 12
6 Natura 2000 coverage .............................................................................................................................. 15
6.1 Coverage of habitat types and species by the Natura 2000 network ............................................... 15
6.2 Population trend and trend in habitat area with good condition within the Natura 2000 network in comparison to overall trends ........................................................................................................................ 16
7 Conservation measures ............................................................................................................................ 19
7.1 Information on the status of measures ............................................................................................. 19
7.2 Main purpose of the measures taken ............................................................................................... 19
7.3 Location of measures ........................................................................................................................ 19
7.4 Main conservation measures ............................................................................................................ 19
8 Information on Annex V species ............................................................................................................... 21
8.1 Exploitation of Annex V species ........................................................................................................ 21
9 Data quality and completeness ................................................................................................................ 22
9.1 Proportion of mandatory information that is missing or reported as unknown .............................. 22
9.2 Methods used to estimate values or trends in Member State reports............................................. 23
Appendix ............................................................................................................................................................ 25
1 Source of information ............................................................................................................................... 25
2 Online dashboards .................................................................................................................................... 25
3 General Methodology ............................................................................................................................... 25

Article 17 National Summary Factsheet June 2020
3
1 General information on Natura 2000 network
1.1 Natura 2000 network and site designation - number and area of SCIs and SACs
The table provides the total number and total area of sites proposed and designated under the Habitats Directive (proposed Sites of Community Importance, pSCIs Sites of Community Importance, SCIs & Special Areas of Conservation, SACs), terrestrial area of sites and number and area of marine sites (i.e. any site with a marine component).
1.2 Natura 2000 sites (SACs) - Conservation measures and management plans.
Information is provided below on the proportion of SACs for which necessary conservation measures have been established and are applied, in addition to the proportion of SACs for which conservation measures have been set out in either a comprehensive management plan or a similar instrument. The data are calculated as a proportion of the total number of SACs reported.

Article 17 National Summary Factsheet June 2020
4
2 General information on habitats and species reported
2.1 Number of habitats and species/subspecies
The below table gives the number of habitat types and species/subspecies in each Annex of the Habitats Directive by biogeographical and marine region in the Member State.
Additional information:
Not applicable for habitats

Article 17 National Summary Factsheet June 2020
5
3 Conservation status & trends
3.1 Overall assessment of conservation status
The figures show the percentage of biogeographical assessments in each category of conservation status for habitats and species for 2007-2012 and 2013-2018 reporting periods. The numbers of assessments in each category of conservation status on which these figures are based are presented in the table below.
The figures shown for 2007-2012 and 2013-2018 are not necessarily directly comparable because many changes in conservation status may be due to changes of methods or to better data rather than reflecting genuine changes.
3.2 Overall trend in conservation status
The figures show the proportion of unfavourable assessments (only U1 and U2) which are improving, deteriorating, stable or unknown. Grey bars represents proportions reported for the reporting period 2007-2012. The numbers of assessments in each category of conservation status trend on which these figures are based are presented in the table below.

Article 17 National Summary Factsheet June 2020
6
The figures shown for 2007-2012 and 2013-2018 are not necessarily directly comparable because many changes in conservation status trend may be due to changes of methods or to better data rather than reflecting genuine changes.
3.3 Overall assessment of conservation status of habitats and species by biogeographical/marine region
The figures show the percentage of assessments in categories of conservation status and conservation status trend (for unfavourable assessments only) by biogeographical and marine region. The numbers of assessments in each category of conservation status and conservation status trend on which these figures are based are presented in the table below.

Article 17 National Summary Factsheet June 2020
7
3.4 Conservation status and trend in conservation status by habitat category/species group
These figures show the percentage of assessments in categories of conservation status and conservation status trend (for unfavourable assessments only) by habitat/species taxonomic group. The numbers of assessments in each category of conservation status and conservation status trend on which these figures are based are presented in the table below.

Article 17 National Summary Factsheet June 2020
8

Article 17 National Summary Factsheet June 2020
9
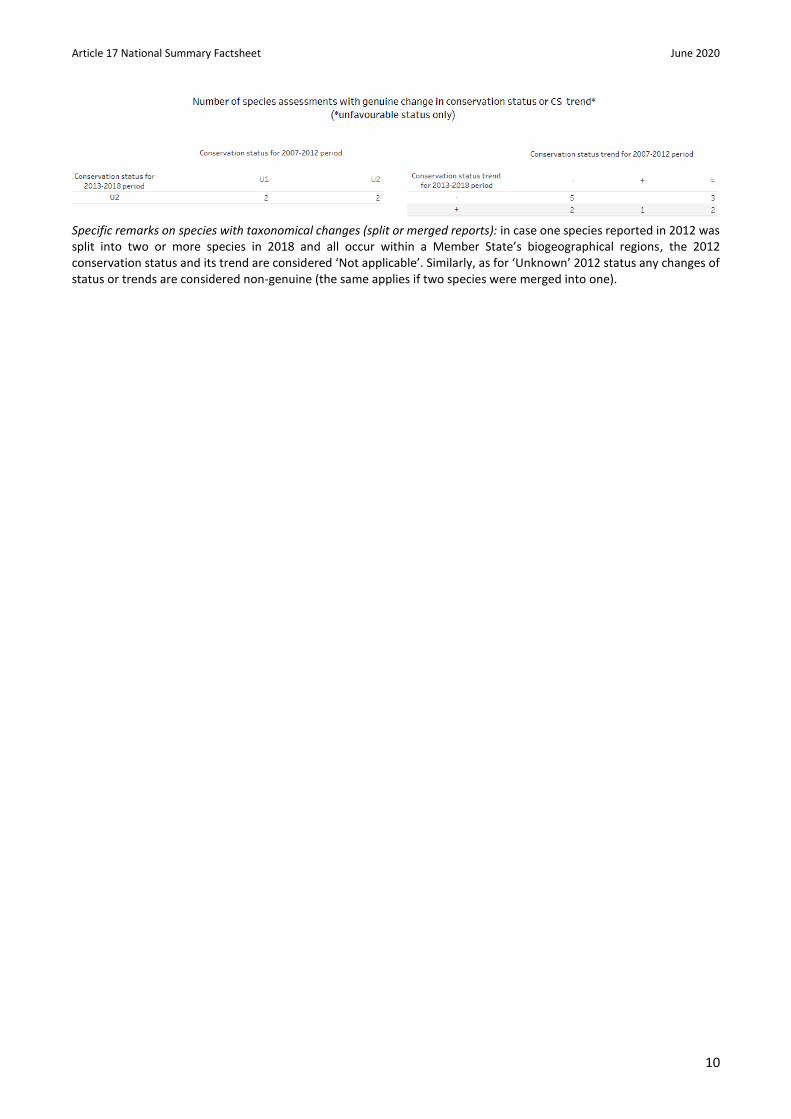
3.5 Genuine changes of conservation status and trend
The figures show the percentage of assessments for which conservation status and trend in conservation status changed; either improved or deteriorated. The numbers on which these figures are based are presented in the table below.
Article 17 National Summary Factsheet June 2020
10
Specific remarks on species with taxonomical changes (split or merged reports): in case one species reported in 2012 was split into two or more species in 2018 and all occur within a Member State’s biogeographical regions, the 2012 conservation status and its trend are considered ‘Not applicable’. Similarly, as for ‘Unknown’ 2012 status any changes of status or trends are considered non-genuine (the same applies if two species were merged into one).

Article 17 National Summary Factsheet June 2020
11
4 Condition of habitat: good / unknown / not good condition
The figure shows the percentage of the total habitat area of habitat types within a habitat group with good, unknown and not good condition of its structure & functions. The total habitat area with good, unknown and not good condition and total habitat area of habitats within a habitat group on which these figures are based are presented in the table below.

Article 17 National Summary Factsheet June 2020
12
5 Main pressures and threats
5.1 Frequency of main pressures and threats
The figures below show the percentage of the assessments reported as being affected by one or more pressures/threats (high & medium) under the pressure categories A-N. This information illustrates the relative importance of pressures: currently acting, and threats: expected in near future.

Article 17 National Summary Factsheet June 2020
13
Note: for a comparison of pressures and threats for either species or habitats, please see the online dashboard here. https://www.eea.europa.eu/themes/biodiversity/state-of-nature-in-the-eu/article-17-national-summary-dashboards/main-pressures-and-threats

Article 17 National Summary Factsheet June 2020
14

Article 17 National Summary Factsheet June 2020
15
6 Natura 2000 coverage
6.1 Coverage of habitat types and species by the Natura 2000 network
The figures show the percentage of habitats/species assessments by group in three classes based on their coverage by the Natura 2000 network. The numbers of assessments in three classes of coverage by Natura 2000 sites on which these figures are based are presented in the table below.

Article 17 National Summary Factsheet June 2020
16
6.2 Population trend and trend in habitat area with good condition within the Natura 2000 network in comparison to overall trends
The figures show the percentage of habitats/species assessments with increasing, stable, unknown and decreasing trends in classes based on coverage by Natura 2000 sites. Trends concern the habitat area with good condition/population trends within the Natura 2000 network and overall. The numbers of assessments on which these figures are based are presented in the table below.

Article 17 National Summary Factsheet June 2020
17

Article 17 National Summary Factsheet June 2020
18

Article 17 National Summary Factsheet June 2020
19
7 Conservation measures
7.1 Information on the status of measures
The table summarises the ‘status of measures’ category for each habitat and species report. The data are presented as whole numbers and a percentage of the total number of reports (per habitats or species).
7.2 Main purpose of the measures taken
The table shows the number and percentage of the assessments for each of the categories of ‘main purpose of measures taken’.
7.3 Location of measures
The table shows the number and percentage of the assessments with measures taken mainly inside or outside the Natura 2000 network or both.
7.4 Main conservation measures
The figures (separate figure for habitats and for species) show the percentages of the assessments with measure taken per measure category. The numbers of assessments on which these figures are based are presented in the table below the figures.

Article 17 National Summary Factsheet June 2020
20

Article 17 National Summary Factsheet June 2020
21
8 Information on Annex V species
8.1 Exploitation of Annex V species
The table provides the number of Annex V species in the Member State, number of Annex V species which are taken in the wild/exploited and number of species being taken/exploited which are in unfavourable status in at least one region.

Article 17 National Summary Factsheet June 2020
22
9 Data quality and completeness
9.1 Proportion of mandatory information that is missing or reported as unknown
The tables give percentages of assessments with unknown or missing information for components of conservation status for 2007-2012 and 2013-2018 periods. The aim of this section is to provide an overview of the evolution of completeness of the reports.

Article 17 National Summary Factsheet June 2020
23
9.2 Methods used to estimate values or trends in Member State reports
For some parameters and trends, the report format requires an indication of which of three methods have been used to estimate the values or trends. The tables provide the percentage of habitats/species assessments for which values were estimated by each of three methods.

Article 17 National Summary Factsheet June 2020
24

Article 17 National Summary Factsheet June 2020
25
Appendix
1 Source of information
Member State reported data on conservation status of habitat types and species (Article 17, Habitats Directive 92/43/EEC).
Member State reported data can be accessed here: http://cdr.eionet.europa.eu/ReportekEngine/searchdataflow?dataflow_uris=http%3A%2F%2Frod.eionet.europa.eu%2Fobligations%2F269&years%3Aint%3Aignore_empty=&partofyear=&reportingdate_start%3Adate%3Aignore_empty=2019%2F01%2F04&reportingdate_end%3Adate%3Aignore_empty=&country=&release_status=anystatus&sort_on=reportingdate&sort_order=reverse&batch_size=
2 Online dashboards
The online dashboards can be accessed here: https://www.eea.europa.eu/themes/biodiversity/state-of-nature-in-the-eu/article-17-national-summary-dashboards
The appearance of the online dashboards may differ slightly to this printed version but the data behind are the same.
3 General Methodology
General methods for Article 17 National Summaries
National Summaries include basic statistics and an overview of the main results from Member States’ Article 17 reports and are based on information reported by Member States in their national reports for the period 2013-2018.
The statistics for conservation status, overall trend in conservation status, pressures and threats, conservation measures and Natura 2000 are based on the reported information for the following habitats/species categories:
Species/habitat category1 Statistics on
conservation status and trends
Other statistics (on pressures and threats, conservation
measures and on Natura 2000 coverage and trends)
Habitats/species present regularly (PRE & TAX) included Counted as missing if no report provided
included
1 Following definition of categories provided in the ‘Explanatory notes and guidelines’
(https://circabc.europa.eu/d/a/workspace/SpacesStore/5b74d59f-c82e-424a-8070-bf190fdcf990/Reporting%20guidelines%20Article%2017%20final%20May%202017.docx0) under Occurrence categories used in the species checklist p. 100-103 and Occurrence categories used in the habitat checklist p. 151

Article 17 National Summary Factsheet June 2020
26
Species extinct after entry into force of the Habitats Directive (EXa) 2
included Counted as missing if no report provided
included if available
Species extinct prior to entry into force of the Habitats Directive (EXp) in case there is a restoration project or recent signs of recolonisation for species of particular interest)3
included if available NOT counted as missing if no report provided
included if available
Only the reports for habitats and species in the categories above will be later used to produce analyses and assessments feeding to e.g. EEA’s State of Nature Report or Commission’s Composite Report, and therefore only these will be included in the statistics in National Summaries.
The reports for habitats and species for which the guidelines do not request the assessment of conservation status will not be taken into account in the National Summaries statistics. This includes:
• marginal habitats and species (MAR);
• occasional (OCC) and newly arriving (ARR) species;
• reports for species regionally extinct before the Habitats Directive came into force (EXp) excluding the case of applied restoration projects and recent signs of recolonisation - see above;
• potential reports for habitats and species with uncertain occurrence (SCR, scientific reserve) that give only general information related to habitat/species without evaluation of the conservation status;
• any redundant reports e.g. provided for both marine and terrestrial regions for habitats and species for which only one, either terrestrial or marine report was expected;
• reports for individual species of Cladonia, Lycopodium, Sphagnum spp (or other optional reports) submitted in addition to mandatory genus level reports.
2 According to ‘Explanatory notes and guidelines’, the assessment of conservation status in Section 11 ‘Conclusions’ should be
provided for these species. The overall conservation status should be assessed as ‘unfavourable-bad’ 3 According to ‘Explanatory notes and guidelines’, a reporting is mandatory for these species and whenever possible the assessment
of conservation status in Section 11 ‘Conclusions’ should be provided.