arsenic in private wells - ysi library/documents/application notes/a614... · introduction arsenic...
TRANSCRIPT

Arsenic in Private WellsMONITORING ORP TO HELP DETERMINE ARSENIC IN PRIVATE DRINKING WELLS WITH THE YSI PROFESSIONAL PLUS
Application Note A614

INTRODUCTIONArsenic is one of the most common elements in the earth’s crust and is commonly found in many locations at varying concentrations. The Midwestern United States has locations that are heavily laden with arsenic because of certain geological settings and conditions. This naturally-occurring arsenic can leach into groundwater potentially causing elevated levels of arsenic in drinking water supplies. The primary pathway that exposes arsenic to humans is through drinking water (Thomas et. al., 2008).
Arsenic has a number of detrimental health effects when consumed at both short-term high doses and long-term low doses. Chronic, low dose exposure is the most common and may cause skin damage, digestive problems, cardiovascular, pulmonary, immunological, neurological, reproductive, and endocrine problems. Arsenic exposure is also linked to cancers of the bladder, lungs, skin, kidney, nasal passages, liver, and prostate. (USEPA, 2010)
Because of the detrimental health effects of arsenic the United States Environmental Protection Agency (USEPA) requires that public water systems provide water to consumers with a maximum contaminant level (MCL) of 10 ppb arsenic. Public water systems use either a ground water source or a surface water source, including ground water under the direct influence of surface water.
Private water systems are households and small businesses that serve fewer than 25 people per day 60 days out of the year. Private water systems are regulated by the Ohio Department of Health but there is no regulation related to arsenic in private water systems. Private well owners are responsible for ensuring their own water is safe for consumption.
MCD’S WATER RESOURCE MONITORING PROGRAMMCD is a conservancy district, a political subdivision of the State of Ohio, and works as a regional government agency throughout the 15-county Great Miami River Watershed. Formed in 1915, MCD provides flood protection, water resource monitoring and information, and recreational opportunities. MCD’s Aquifer Preservation Subdistrict was created in 1997 to develop and maintain an ongoing,
Figure 1 – Location of Sites and Reported Arsenic Concentration.
YSI Water Quality Sampling Systems
Application Note A614
Study of Arsenic Levels in Private Wells in the Great Miami River Watershed
Figure 2 – Arsenic Concentrations Reported for All Samples
watershed-wide program to support comprehensive protection and management of the Great Miami River Watershed’s groundwater resources. The Aquifer Preservation Subdistrict includes all, or portions of, nine counties including Butler, Clark, Greene, Hamilton, Miami, Montgomery, Preble, Shelby, and Warren counties.
Subdistrict conducts quality and quantity studies of the buried valley aquifer, provides assistance to communities to protect their drinking water sources, and helps citizens collect quality and quantity data on their own private wells. For more information on the current programs of MCD and the Aquifer Preservation Subdistrict, visit www.miamiconservancy.org.
PROBLEM STATEMENT & OBJECTIVE OF THE STUDYPrevious investigations of the occurrence of arsenic in groundwater in the Great Miami River Watershed focused on the geochemical conditions which allow for arsenic dissolution. These investigations are limited to collecting samples from just a few specific sites (Dumouchelle, 1998; Thomas et. al., 2008; Thomas, Schuman, and Pletsch, 2005). The number of samples analyzed and the geographic distribution of the sampling sites is insufficient to provide a characterization of baseline arsenic concentrations across the entire watershed.
MCD staff recognized that to have a better understanding of how frequently, and at what levels, arsenic occurs in private water systems in the Great Miami River Watershed more wells needed to be sampled.
The objective of this study is to collect baseline data that provides a better understanding of the number of private water systems that have elevated levels of arsenic in the Great Miami River Watershed.
METHODOLOGYThis study was designed to sample private water systems that represent the geographic boundaries of the Great Miami River Watershed. To locate wells for inclusion in the study, MCD staff recruited private water system owners who attended a local Test Your Well event. Test Your Well is a program developed by the Groundwater Foundation and locally sponsored by MCD. At the events, private water system owners were given the opportunity to sign up for arsenic testing. To ensure a broad geographic representation of the watershed, the locations of the wells were placed on a map. MCD’s well database was then searched for additional possible sampling locations and those private water system owners were also invited to participate. Sample collection dates and times were set up at the well owner’s convenience.The private water systems included in this study were located
in eleven counties, Hamilton, Butler, Warren, Montgomery, Preble, Miami, Shelby, Logan, Champaign, Clark and Greene, in the Great Miami River Watershed.Historical information on each well that was chosen for sampling was also gathered from the Ohio Department of Natural Resources’ Division of Water well logs if available. Well logs include information on construction and geology. Not every well in Ohio has a well log.
When the laboratory reported the sampling results to MCD staff, those results were collected in a database. Individual results were also reported back to the well owners. Well owners were given information about the health effects from consuming arsenic, treatment options, and who to contact for more information.
ARSENICMCD collected 154 water samples from March 2009 to October 2010 at 107 different private water systems. (See Figure 1, Location of Sites and Reported Arsenic Concentration). More than one sample was collected from 38 of the wells. Of those wells 33 were sampled multiple times to compare the results from water that was untreated and with water that was treated using a home water treatment system.
MCD staff visited each well location and collected the A614 | Application Note | Arsenic in Private Wells
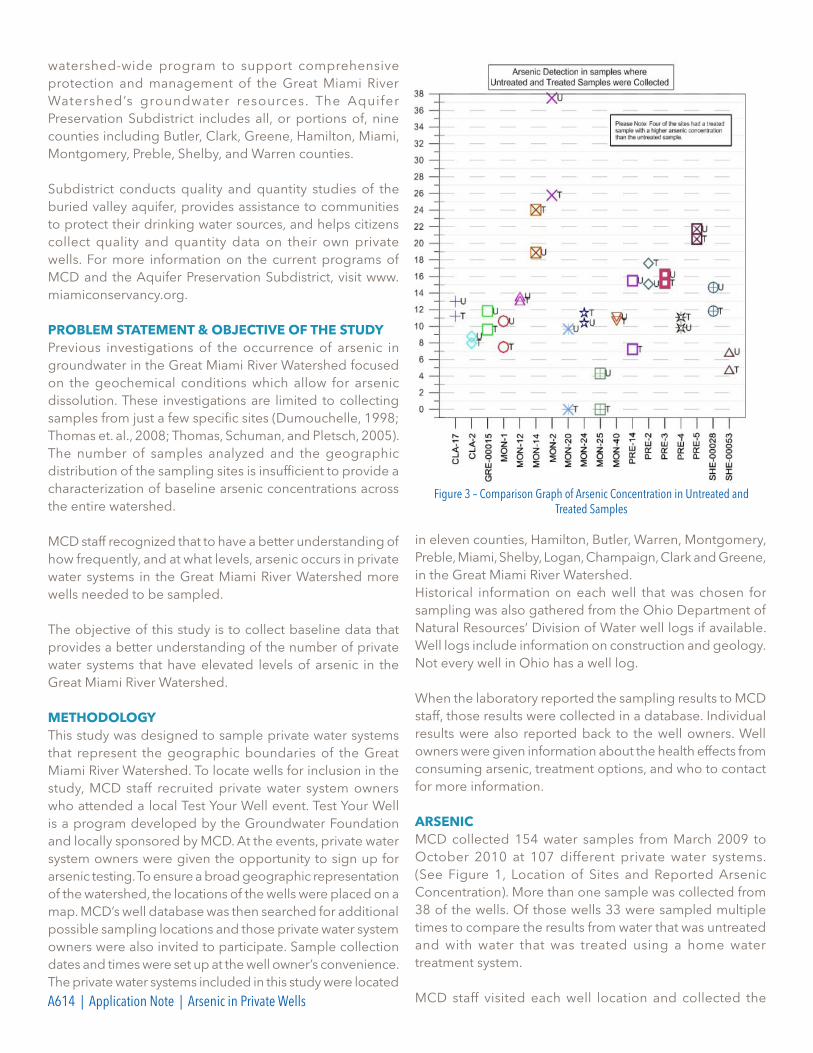
Figure 3 – Comparison Graph of Arsenic Concentration in Untreated and Treated Samples

samples. Primary samples were collected from the “point of use” (POU) faucet because that is where people have the most potential for exposure to arsenic. The point of use faucet is typically a low flow faucet used for potable water.
Before sample collection, the cold water was allowed to run for several minutes. The samples were collected in 250 mL plastic bottles pre-preserved with Nitric Acid (HNO3). Samples were delivered to a private certified laboratory for analysis. The laboratory followed the USEPA method for total arsenic analysis per SW6020A (USEPA, 2008). The lowest detectable limit by the laboratory for arsenic was 2 ppb. Samples below the detectable limit were reported as non-detects (ND).
At each well, MCD staff noted whether the water flowed through a home system treatment method before being collected for analysis. Home treatment systems included water softeners, iron filters, and reverse osmosis systems. Two samples (one treated and one untreated water sample) were collected at 33 locations for comparison. At two wells, duplicate samples were collected to conduct a QA/QC check of the laboratory.
OXIDATION REDUCTION POTENTIALFor glacial aquifer systems such as the Great Miami River Watershed, the release of arsenic into groundwater from soil particles occurs mainly as a result of reductive desorption (Thomas, 2007). Reductive desorption is part of a chemistry reaction known as “redox”, which is the abbreviation for reduction and oxidation. Redox is the gaining and losing of electrons between atoms. When the soil particles that have arsenic bonded to them are reduced, the arsenic is released into the groundwater. Redox is quantified by measuring the Oxidative Reduction Potential (ORP). ORP values are an indicator that the conditions are correct for the presence of arsenic in the groundwater.
ORP data was collected using a YSI 1002-S ORP Sensor installed on a YSI Professional Plus multiparameter handheld instrument. The ORP sensor was calibrated every other day using YSI Zobell solution according to manufacturer’s recommendations. To collect the ORP data, a bucket was allowed to overflow with water from the faucet to be sampled. The ORP sensor was placed in the bucket and left on until the numbers stabilized. ORP of untreated water was measured at the point of use faucet for 36 of the wells.
LIMITATIONSThis study has several limitations. First, water samples were collected by five different staff members during the length of the study. Although they were all trained on the sampling techniques and the QA/QC protocol, it is possible that
equipment was calibrated and operated differently. Second, some geographic areas of the Great Miami River Watershed were not well covered by the sampling site distribution. Third, spiked samples were not collected to check the QA/QC of the laboratory. Fourth, the water treatment systems were different in many of the homes and maintained on different schedules. Fifth, the geological setting was not known for all the well locations. These limitations could be addressed in future studies to increase the comparability and generalization of the data.
RESULTSOf the 107 different private water systems sampled for arsenic, 47 (44 percent) were found to have an arsenic concentration level above the laboratory’s detection limit of 2 ppb. 22 (20.5 percent) of the sites visited reported at
Figure 4 – Location of Wells with Detectable Concentrations of Arsenic and Measured ORP
A614 | Application Note | Arsenic in Private Wells

least one sample with an arsenic concentration greater than or equal to the EPA maximum contaminate level of 10ppb. The highest arsenic concentration detected in an untreated sample was 37.5 ppb and was collected in Montgomery County. The highest arsenic concentration detected in a treated sample was 30.5 ppb and was collected in Miami County.
Of the 154 samples collected and analyzed, 73 samples (47.4 percent of all samples) were found to have a detectable level of arsenic. 38 of the samples (24.7 percent of all samples) contained an arsenic concentration greater than or equal to the US EPA MCL of 10 ppb.
Figure 2, Arsenic Concentrations Reported for All Samples, shows a graph of all the arsenic concentrations for all the samples collected. Arsenic detections are broken down to display concentrations for treated, untreated, and reverse osmosis systems.
WELLS WITH A HOME WATER TREATMENT SYSTEMAt 33 of the private water systems a treated and an untreated water sample (98 samples total) was collected. See Figure 3, Comparison Graph of Arsenic Concentration in Untreated and Treated Samples for a results comparison graph. 18 (54.5 percent) of those systems reported a detectable level of arsenic.
Of the 98 samples collected from a well with some kind of water treatment system, 48 were found to have a detectable level of arsenic. 22 of these samples (22.4 percent) contained an arsenic concentration greater than or equal to the EPA MCL of 10 ppb.
At 14 of the private water systems with a detectable arsenic level, the water samples collected after the water was treated by a water softener or water softener and iron filter, had a reported lower arsenic level than the untreated sample. Water softener or water softener and iron filter systems removed 0.5 ppb to 11.7 ppb. At four private water systems, the treated water samples reported a higher arsenic concentration than the untreated water samples.
Reverse osmosis and a water softener unit was used as the treatment system at nine of the wells. Five of these nine locations were found to have an arsenic concentration above the lab’s detection limit of 2 ppb. Of those five, two wells were found to have an arsenic concentration greater than or equal to the EPA MCL of 10 ppb. Samples were again collected from both locations after the reverse osmosis systems were serviced. The professionally-installed and serviced system had an arsenic concentration of 12.3 ppb with the first sample collected prior to servicing and
was at a non-detect level of concentration when sampled after being serviced. From the homeowner-installed and serviced system, the first time it was sampled the arsenic was detected at 16.9 ppb and the second time it was sampled arsenic was detected at 13.1 ppb.
To look for a change in arsenic concentration over time, the untreated water was sampled twice at one well. The well was sampled in March 2009 and again in October 2010. The arsenic concentration increased from 10.6 ppb to 15.1 ppb during that time.
WELLS WITH NO HOME WATER TREATMENT SYSTEMAt 56 private water systems, water samples were collected from a faucet with no water treatment system. The untreated water samples collected at 26 private water systems reported detectable levels of arsenic. Of the 26 samples with detectable levels of arsenic, 16 contained an arsenic concentration greater than or equal to the EPA MCL of 10 ppb. Thus , the MCL exceedance rate for arsenic in private water systems with no treatment of drinking water was nearly 29 percent.
ORPORP was measured in untreated water at 36 private water systems. Water samples at 16 of those systems had a reported arsenic concentration above the laboratory’s detection limit of 2 ppb (see Figure 4, Location of Wells with Detectable Concentrations of Arsenic and Measured ORP). Samples with detectable concentrations of arsenic tended to have negative oxidative reduction potentials suggesting A614 | Application Note | Arsenic in Private Wells
Figure 5 – ORP vs. Arsenic Concentration for Samples with Detects and Measured ORP
anoxic conditions in the aquifer supplying the well.
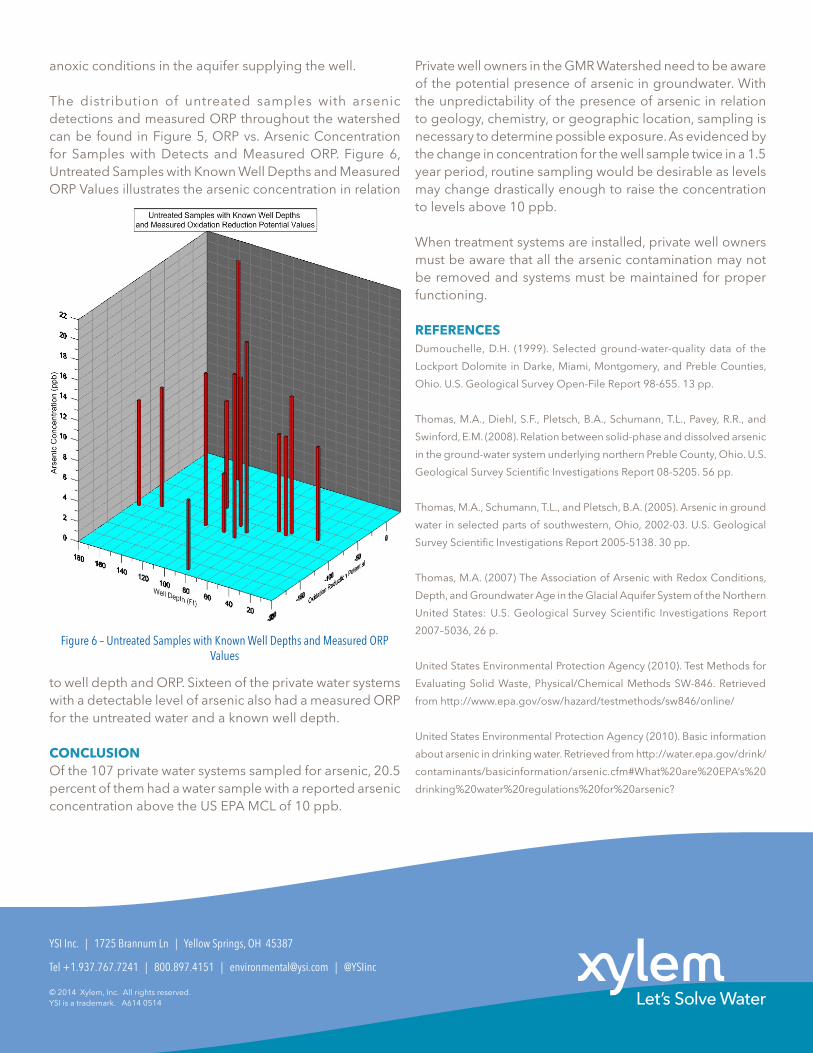
The distribution of untreated samples with arsenic detections and measured ORP throughout the watershed can be found in Figure 5, ORP vs. Arsenic Concentration for Samples with Detects and Measured ORP. Figure 6, Untreated Samples with Known Well Depths and Measured ORP Values illustrates the arsenic concentration in relation
to well depth and ORP. Sixteen of the private water systems with a detectable level of arsenic also had a measured ORP for the untreated water and a known well depth.
CONCLUSIONOf the 107 private water systems sampled for arsenic, 20.5 percent of them had a water sample with a reported arsenic concentration above the US EPA MCL of 10 ppb.
Private well owners in the GMR Watershed need to be aware of the potential presence of arsenic in groundwater. With the unpredictability of the presence of arsenic in relation to geology, chemistry, or geographic location, sampling is necessary to determine possible exposure. As evidenced by the change in concentration for the well sample twice in a 1.5 year period, routine sampling would be desirable as levels may change drastically enough to raise the concentration to levels above 10 ppb.
When treatment systems are installed, private well owners must be aware that all the arsenic contamination may not be removed and systems must be maintained for proper functioning.
REFERENCESDumouchelle, D.H. (1999). Selected ground-water-quality data of the
Lockport Dolomite in Darke, Miami, Montgomery, and Preble Counties,
Ohio. U.S. Geological Survey Open-File Report 98-655. 13 pp.
Thomas, M.A., Diehl, S.F., Pletsch, B.A., Schumann, T.L., Pavey, R.R., and
Swinford, E.M. (2008). Relation between solid-phase and dissolved arsenic
in the ground-water system underlying northern Preble County, Ohio. U.S.
Geological Survey Scientific Investigations Report 08-5205. 56 pp.
Thomas, M.A., Schumann, T.L., and Pletsch, B.A. (2005). Arsenic in ground
water in selected parts of southwestern, Ohio, 2002-03. U.S. Geological
Survey Scientific Investigations Report 2005-5138. 30 pp.
Thomas, M.A. (2007) The Association of Arsenic with Redox Conditions,
Depth, and Groundwater Age in the Glacial Aquifer System of the Northern
United States: U.S. Geological Survey Scientific Investigations Report
2007–5036, 26 p.
United States Environmental Protection Agency (2010). Test Methods for
Evaluating Solid Waste, Physical/Chemical Methods SW-846. Retrieved
from http://www.epa.gov/osw/hazard/testmethods/sw846/online/
United States Environmental Protection Agency (2010). Basic information
about arsenic in drinking water. Retrieved from http://water.epa.gov/drink/
contaminants/basicinformation/arsenic.cfm#What%20are%20EPA’s%20
drinking%20water%20regulations%20for%20arsenic?
Tel +1.937.767.7241 | 800.897.4151 | [email protected] | @YSIinc
YSI Inc. | 1725 Brannum Ln | Yellow Springs, OH 45387
© 2014 Xylem, Inc. All rights reserved. YSI is a trademark. A614 0514
Figure 6 – Untreated Samples with Known Well Depths and Measured ORP Values