ars.els-cdn.com · web viewafter the reaction was completed, the autoclave was cooled to room...
TRANSCRIPT

Supporting Information
Flexible All-Solid-State Asymmetric Supercapacitor Based on
Transition Metal Oxide NanorodsReduced Graphene Oxide Hybrid
Fibers with High Energy Density
Wujun Ma Shaohua Chen Shengyuan Yang Wenping Chen Wei Weng Yanhua Cheng
Meifang Zhu
State Key Laboratory for Modification of Chemical Fibers and Polymer Materials College of
Materials Science amp Engineering Donghua University 2999 North Renmin Road Shanghai 201620
China
Corresponding Author zhumfdhueducn (M F Zhu)
Experimental and Methods
Preparation of graphite oxide (GO)
GO was prepared by the oxidation of natural graphite powder (325 mesh Qingdao Hua tai
Lubricant Sealing SampT Co Ltd Qingdao China) according to modified Hummers method
In a typical process 350 mL H2SO4 was added to a mixture of 12 g graphite flakes and 6 g
NaNO3 then the mixture was cooled to 0 degC 60 g KMnO4 was added slowly in portions to
keep the reaction temperature below 20 degC The reaction was stirred for 2 h then heated to 35
degC and stirred for another 2 h then 550 mL water was added slowly The reaction was heated
to 98 degC and maintained for 10 min then the reaction was cooled to room temperature
Additional 1600 mL water and 50 mL 30 H2O2 were added The bright yellow colloid was
obtained The product was washed and centrifuged three times with 110 HCl solution
followed by three times with anhydrous ethanol then dried in a vacuum the GO was obtained
as brown flakes
Preparation of MoO3 nanorods
In a typical synthesis 60 mL H2O2 (30) was added dropwise into 478 g molybdenum powders in
an ice-water bath under magnetic stirring using a tiny injection pump then a clear yellow solution
was formed To remove the redundant H2O2 the formed solution was stirred for another 1 h 10 g
polyethylene glycol (PEG molecular weight MW = 6000 Da) was added into the obtained solution
and the mixture was stirred for 1 h then transferred into a 100 mL Teflon autoclave and kept at 150
oC for 12 h cooled down to room temperature The impressive phenomenon was that the MoO3 can
be well dispersed in distilled water with dark blue color (Fig S1a) The resultant product was filtered
and washed several times with distilled water and ethanol After being dried at 60 oC under vacuum
the MoO3 nanorods were obtained as shown in Fig S1b
Preparation of MnO2 nanorods
The MnO2 nanowires were prepared by a low temperature hydrothermal method Typically
0016 mol MnSO4H2O 0016 mol (NH4)2S2O8 003 mol (NH4)2SO4 and 01 g
polyvinylpyrrolidone (PVP) were added into 80 mL distilled water in a beaker under stirring
to form a homogeneous solution The solution was transferred into a Teflonlined stainless
steel autoclave then sealed and maintained at 120 degC for 12 h After the reaction was
completed the autoclave was cooled to room temperature and the resultant product was
filtered washed with distilled water and ethanol to remove residual salts and finally dried at
120 degC in air then the MnO2 nanorods were obtained as shown in Fig S4a
Fig S1 (a) Photograph of MoO3 dispersion (b) SEM image of the as-synthesized MoO3 nanorods (c) TEM image of a MoO3GO hybrid dispersion
Fig S2 (a) Adsorption- desorption isotherms and (b) the pore-size distribution of the MoO3rGO-60
fiber
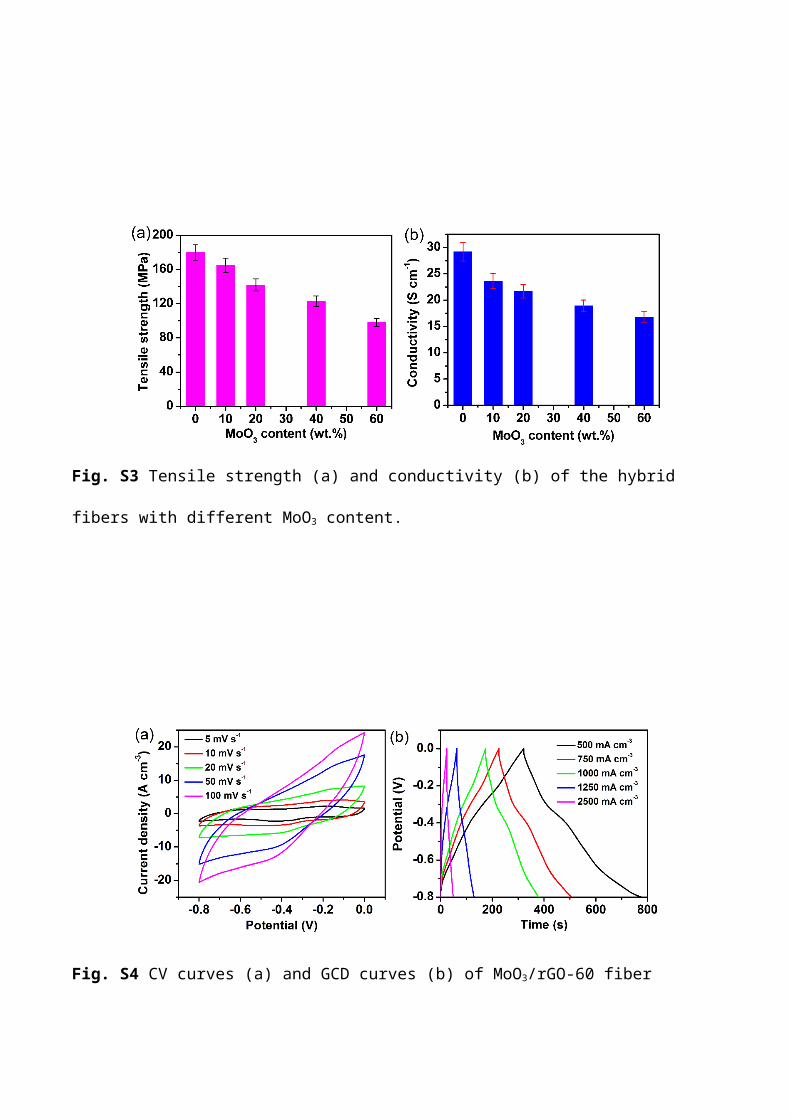
Fig S3 Tensile strength (a) and conductivity (b) of the hybrid fibers with different MoO3 content
Fig S4 CV curves (a) and GCD curves (b) of MoO3rGO-60 fiber electrode
Fig S5 (a) SEM image of the as-synthesized MnO2 nanorods (b) TEM image of a MnO2GO hybrid
dispersion (c-d) SEM images of the cross-section of the MnO2rGO hybrid fiber
Fig S6 (a) Raman spectra of rGO and MnO2rGO hybrid fiber (b) C 1s (c) O 1s and (d) Mn 2p
XPS core level spectra of MnO2rGO hybrid fiber
Fig S6a shows the Raman spectra of the rGO fiber and the MnO2rGO hybrid fiber The defect
induced D peak and G peak can be found at around 1335 cmminus1 and 1585 cmminus1 respectively for
both of these fibers As for the MnO2graphene hybrid fiber a new peak appeared at 641 cm -1
which can be attributed to the Mn-O stretching vibration in the basal plane of MnO 6 octahedra
indicating the presence of MnO2 in the hybrid fiber as well XPS was used to identify the
presence and oxidation state of the as prepared MnO2 nanowires in the hybrid fibers As shown
in Fig S6a the C 1s signal was deconvoluted into four peaks centered at 2844 2856 2881
2906 eV corresponding to C-CC=C C-N C=O O=C-O bonds The C-N bond may be
introduced during the reduction process by hydrazine The intensity of the peaks related to
oxygenate bonds are rather low indicating the successful reduction of GO As for the O 1s
signal (Fig S6c) two deconvoluted peaks centered at 5309 and 5323 eV were assigned to O-
Mn and O-C bond respectively The presence of MnO2 in the hybrid fiber was further confirmed
by the Mn 2p signal in Fig S6d The peaks of Mn 2p32 and Mn 2p12 are located at 6419 and
6536 eV respectively with an energy separation of 117 eV which exactly matches the
reported value of energy separation in MnO2
Fig S7 Length capacitance of MoO3rGO-60 and MnO2rGO fiber at different scan rates
Fig S8 GCD curves of the solid-state ASC device collected in different voltage windows
Fig S9 (a) GCD curves of the all-solid-state ASC device at different current densities (b) Specific
capacitance of the ASC device as a function of the current densities
Experimental and Methods
Preparation of graphite oxide (GO)
GO was prepared by the oxidation of natural graphite powder (325 mesh Qingdao Hua tai
Lubricant Sealing SampT Co Ltd Qingdao China) according to modified Hummers method
In a typical process 350 mL H2SO4 was added to a mixture of 12 g graphite flakes and 6 g
NaNO3 then the mixture was cooled to 0 degC 60 g KMnO4 was added slowly in portions to
keep the reaction temperature below 20 degC The reaction was stirred for 2 h then heated to 35
degC and stirred for another 2 h then 550 mL water was added slowly The reaction was heated
to 98 degC and maintained for 10 min then the reaction was cooled to room temperature
Additional 1600 mL water and 50 mL 30 H2O2 were added The bright yellow colloid was
obtained The product was washed and centrifuged three times with 110 HCl solution
followed by three times with anhydrous ethanol then dried in a vacuum the GO was obtained
as brown flakes
Preparation of MoO3 nanorods
In a typical synthesis 60 mL H2O2 (30) was added dropwise into 478 g molybdenum powders in
an ice-water bath under magnetic stirring using a tiny injection pump then a clear yellow solution
was formed To remove the redundant H2O2 the formed solution was stirred for another 1 h 10 g
polyethylene glycol (PEG molecular weight MW = 6000 Da) was added into the obtained solution
and the mixture was stirred for 1 h then transferred into a 100 mL Teflon autoclave and kept at 150
oC for 12 h cooled down to room temperature The impressive phenomenon was that the MoO3 can
be well dispersed in distilled water with dark blue color (Fig S1a) The resultant product was filtered
and washed several times with distilled water and ethanol After being dried at 60 oC under vacuum
the MoO3 nanorods were obtained as shown in Fig S1b
Preparation of MnO2 nanorods
The MnO2 nanowires were prepared by a low temperature hydrothermal method Typically
0016 mol MnSO4H2O 0016 mol (NH4)2S2O8 003 mol (NH4)2SO4 and 01 g
polyvinylpyrrolidone (PVP) were added into 80 mL distilled water in a beaker under stirring
to form a homogeneous solution The solution was transferred into a Teflonlined stainless
steel autoclave then sealed and maintained at 120 degC for 12 h After the reaction was
completed the autoclave was cooled to room temperature and the resultant product was
filtered washed with distilled water and ethanol to remove residual salts and finally dried at
120 degC in air then the MnO2 nanorods were obtained as shown in Fig S4a
Fig S1 (a) Photograph of MoO3 dispersion (b) SEM image of the as-synthesized MoO3 nanorods (c) TEM image of a MoO3GO hybrid dispersion
Fig S2 (a) Adsorption- desorption isotherms and (b) the pore-size distribution of the MoO3rGO-60
fiber
Fig S3 Tensile strength (a) and conductivity (b) of the hybrid fibers with different MoO3 content
Fig S4 CV curves (a) and GCD curves (b) of MoO3rGO-60 fiber electrode
Fig S5 (a) SEM image of the as-synthesized MnO2 nanorods (b) TEM image of a MnO2GO hybrid
dispersion (c-d) SEM images of the cross-section of the MnO2rGO hybrid fiber
Fig S6 (a) Raman spectra of rGO and MnO2rGO hybrid fiber (b) C 1s (c) O 1s and (d) Mn 2p
XPS core level spectra of MnO2rGO hybrid fiber
Fig S6a shows the Raman spectra of the rGO fiber and the MnO2rGO hybrid fiber The defect
induced D peak and G peak can be found at around 1335 cmminus1 and 1585 cmminus1 respectively for
both of these fibers As for the MnO2graphene hybrid fiber a new peak appeared at 641 cm -1
which can be attributed to the Mn-O stretching vibration in the basal plane of MnO 6 octahedra
indicating the presence of MnO2 in the hybrid fiber as well XPS was used to identify the
presence and oxidation state of the as prepared MnO2 nanowires in the hybrid fibers As shown
in Fig S6a the C 1s signal was deconvoluted into four peaks centered at 2844 2856 2881
2906 eV corresponding to C-CC=C C-N C=O O=C-O bonds The C-N bond may be
introduced during the reduction process by hydrazine The intensity of the peaks related to
oxygenate bonds are rather low indicating the successful reduction of GO As for the O 1s
signal (Fig S6c) two deconvoluted peaks centered at 5309 and 5323 eV were assigned to O-
Mn and O-C bond respectively The presence of MnO2 in the hybrid fiber was further confirmed
by the Mn 2p signal in Fig S6d The peaks of Mn 2p32 and Mn 2p12 are located at 6419 and
6536 eV respectively with an energy separation of 117 eV which exactly matches the
reported value of energy separation in MnO2
Fig S7 Length capacitance of MoO3rGO-60 and MnO2rGO fiber at different scan rates
Fig S8 GCD curves of the solid-state ASC device collected in different voltage windows
Fig S9 (a) GCD curves of the all-solid-state ASC device at different current densities (b) Specific
capacitance of the ASC device as a function of the current densities
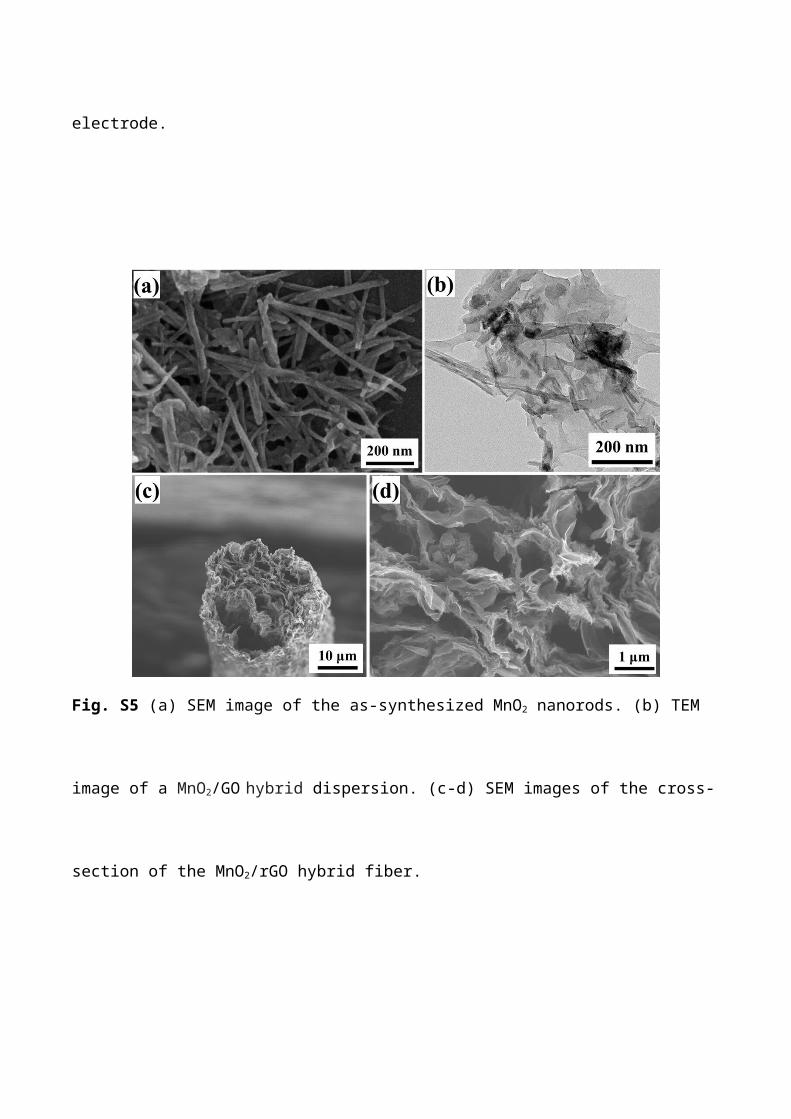
Fig S8 GCD curves of the solid-state ASC device collected in different voltage windows
Fig S9 (a) GCD curves of the all-solid-state ASC device at different current densities (b) Specific
capacitance of the ASC device as a function of the current densities