ars-gis based spatial analysis and assessment on the …. 22 issue6/version-11... · a rs-gis based...
TRANSCRIPT

IOSR Journal Of Humanities And Social Science (IOSR-JHSS)
Volume 22, Issue 6, Ver.11 (June. 2017) PP 103-123
e-ISSN: 2279-0837, p-ISSN: 2279-0845.
www.iosrjournals.org
DOI: 10.9790/0837-220611103123 www.iosrjournals.org 103 | Page
ARS-GIS based Spatial Analysis and Assessment on the Urban
Growth of Delhi National Capital Territory (NCT)
from 1977 to 2014
Rabin Das1 ([email protected]) & Goutam Das2 ([email protected]) 1Assistant Professor , Dept. of Geography and Environment Management, Bajkul Milani Mahavidyalaya,
Purba Medinipur, West Bengal, India 2Cartographer & Research Fellow, PG Dept. of Geography & Environment Management, Bajkul Milani
Mahavidyalaya, Purba Medinipur, West Bengal, India
Abstract: Introduction: Rapid urbanization and urban growth, particularly in the developing worlds, is continuing
to be one of the crucial issues of global change in affecting the physical dimensions of cities.
Case description with Methodology: This study proposes a technique to extract urban built-up land
features from, Multi Spectral Scanner System (MSS-1977), Landsat Thematic Mapper (1998, 2003, and 2014)
and Hyperion EO-1imagery of part of Delhi NCT in India as examples. The study selected two indices,
Normalized Difference Built-up Index (NDBI), Normalized and Normalized Different Vegetation Index
(NDVI) to represent three major urban land-use classes, built-up land and vegetation, respectively. The
relationship between land use/land cover (LU/ LC) change and population shift and their effects on the
spatiotemporal patterns of urban area were quantitatively examined using an integrated approach of remote
sensing, geographical information systems (GIS). Consequently, the seven bands of an original Landsat image
were reduced into three thematic-oriented bands derived from above indices. The three new bands were then
combined to compose a new image. As a result, the spectral signatures of the three urban land-use classes are
more distinguishable in the new composite image than in the original seven-band image as the spectral clusters
of the classes are well separated. Therefore, the technique is effective and reliable. In addition, the advantages of
over NDVI and over NDBI in the urban study are also discussed in this paper. Furthermore, in combination with
the detection of LU/ LC change, an analysis of the spatially differential growth rates for developed land area and
population size revealed an urban e sub-urban gradient pattern of population shifting, as evidenced by a sharp
increase in developed land area within the middle sub-zones at the urban fringe and the exurban sub-zones
beyond the outer traffic ring. As the result, changes in LU/ LC and population shifts resulted in significant
variation in the spatiotemporal patterns of the urban area due to the loss of water bodies and vegetated surfaces.
Discussion and Evaluation: Results indicate that the built-up area in the study area has increased by 290%;
from 165.52 km2 in 1977 to 645.3799 km
2 in 2014. The results of the multi-temporal change detection show that
the highest urban growth rates, 216% occurred between 2003 and 2014. In contrast, the growth rates were 10%
during 1977 - 1998 and 12% during the period 1998 -2003. This massive growth was mainly resulted from the
transformation of agricultural and barren land of the outskirt of core city. Peri-urban areas are often
characterized by valuable natural environment and resource bases to provide essential ecosystem functions for
urban residents. Observing land cover change over time can reveal the effects and impacts of urbanization in
peri-urban areas. Existing built-up areas have a greater influence on urban expansion outside urban planned
districts than in urban planned districts.
Conclusion: It is suggested that a guiding plan is required to integrate planning in both urban and non-urban
planned districts to overcome urban sprawl in peri-urban areas and to maintain the sustainable and balanced
urban growth here.
Keywords: Rapid urbanization and urban growth, Delhi NCT, NDVI, NDBI, urban land-use, Peri-urban areas,
urban sprawl and sustainable and balanced urban growth.
I INTRODUCTION Population growth is a major problem in much urban country like China, India, and Africa etc. Rapid
Urbanization causes disorganized and unplanned growth of town and cities. Urbanization has been a universal
and important social and economic phenomenon taking place all around the world. Urbanization could be the
most powerful and visible anthropogenic force that has brought about fundamental changes in land cover and
landscape pattern around the globe. Urbanization and urban growth, especially in the developing world, is
A RS-GIS based Spatial Analysis and Assessment on the Urban Growth of Delhi National Capital ..
DOI: 10.9790/0837-220611103123 www.iosrjournals.org 104 | Page
continuing to be one of the crucial issues of global change.Thrpugh the tremendous process of recent population
explosion, most of the developing and under developing countries are deeple affected by uncontrolled
population growth which has compelled the civilized man to do the uncivilized, illegal, haphazard and
unscientific activities for fulfilling the explosing demends of increasing anthroposphere. India may one typical
example of it where greeds rather than needs show the blusterous trend towards unplanned urbanization with
huge unethical, undeliberate, shortsighted and eco-blind anthropogenic activities. Delhi NCT reflects also such
type of scenario with its overwhelming urbanization and detonating population like the metropoliton behaviour
in any advanced developing country. Here lies the essence of this study as the spatio-temporal change analysis
and assessment of the urban growth over Delhi NCT during the period, 1977-2014.
II AIM OF THE STUDY: The present study aims to identify the spatio-temporal changes occurring over Delhi National Capital Territory
region using long term satellite data.
Objective of the study:
1. To estimate areas under different landuse and land cover classes using supervised image classification
technique.
2. To identify the spatio-temporal changes through change detection technique and detect the pace and
direction of urban growth using long term satellite data.
3. Mapping the socio-economic changes of the study area and analyzing the causes of such rapid urban growth
in Delhi.
III THE STUDY AREA Delhi is the capital of India. The state is spread over an area of 1473 square kilometer. According to the Indian
geography the state is located at the center of the Indian subcontinent, amidst the ranges of Himalaya and the
Ravalli.
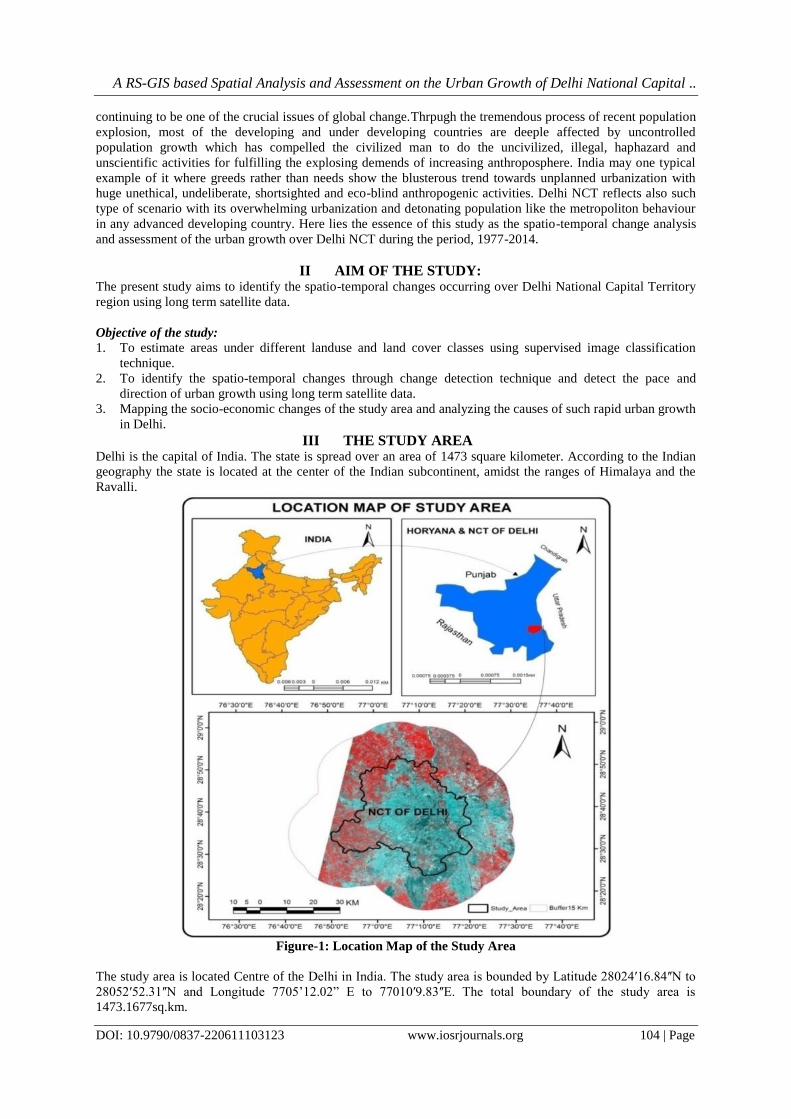
Figure-1: Location Map of the Study Area
The study area is located Centre of the Delhi in India. The study area is bounded by Latitude 28024ʹ16.84ʺN to
28052ʹ52.31ʺN and Longitude 7705’12.02” E to 77010ʹ9.83ʺE. The total boundary of the study area is
1473.1677sq.km.

A RS-GIS based Spatial Analysis and Assessment on the Urban Growth of Delhi National Capital ..
DOI: 10.9790/0837-220611103123 www.iosrjournals.org 105 | Page
IV TOPOGRAPHY
The entire topography of Delhi is divided into a ridge, the Yamuna Flood Plain, the Plain. It is
interesting to note here that each of these regions is marked by distinct type of vegetation. The ridge area of the
city offers the right factors that favor the growth of acacias and other cacti. However, during the monsoon,
herbaceous plants grow in abundance in the ridge. As far as the plain region of Delhi is concerned, it is
characterized by shisham trees.
V DRAINAGE Drainage pattern of an area is very important in terms of its groundwater potentiality. It is the source of
surface water and is affected by structural, lithological and geomorphological control of an area (Schumm,
1956). This may be due to more or less homogeneous lithology and structural controls. Yamuna River is the
main control of drainage system along the NCT of Delhi. Reverie type of vegetation grows along the plain of
Yamuna. National Capital Region in general, is a part of well integrated drainage system of the Ganga basin.
Drainage is an important element of physical infrastructure and constitutes removal and disposal of surplus
rain/irrigation water from the land.
VI VEGETATION
Vegetation cover in this area has been found to be predominantly--- According to report of 1977 total
vegetation cover is 367.425 sq. Km. 1998 total vegetation cover is 279.3114sq.Km.2003 total vegetation cover
is 404.3061sq. Km. 2014 total vegetation cover is 71.5851.Km.The Vegetation of Delhi varies with its varied
topography and comprises small and medium sized plants and shrubs.
VII CLIMATE Delhi Weather varies with the different climatic conditions that are faced by this city. Summer weather
condition of Delhi is characterized by scorching heat and unbearable temperature. Temperature reaches almost
450C in the summer months. On the contrary, winter, which lasts from December to January, is extremely cold.
Temperature falls to almost 50C during the winter months in Delhi. The rainy season in Delhi begins in June and
continues almost till October. Delhi receives most of its rain during this period from the Northwesterly winds.
Most of the precipitation occurs in the month of July.
VIII METHODOLOGY AND DATA COLLECTION Detection of Urban growth and identification land use change in Delhi using Landsat satellite image.
Used temperature mapping algorithm for detection urban growth and Land use & land cover classification have
been done using maximum likelihood classification technique. Different image processing & enhancement
technique used for identification the time-sequential changes in land use parents.
The data used for this dissertation consists of:
(1) Landsat7 MMS imagery, from band 1to band 4, on February, 1977.
(2) Landsat7 TM imagery, from band1 to band 7 on February, 1998, 2003.
(3) Landsat 8, 2014 imagery, from band1 to band 8 on February.
Here, Land sat TM, MSS, Landsat 8 images are used to fulfill this work and the using data was collected from
USGS web site. For the extraction of Built-up land I used the MidIR, NIR band. Spatial resolution of NIR band
of Landsat -TM & Landsat -MSS is 120m and 60m respectively and spectral resolution of visible, infrared &
middle infrared region of Land sat-TM &MSS is 30m & 60m. Due its moderate resolution spatial coverage,
Land use & land cover classification has been done for change detection analysis.
Instruments Used: Garmin GPS 12: GPS was used to obtain the geographical co-ordinates of the observed
filed location during the ground truth study for collecting Well distributed point, & land use/land cover
information.
Software’s used: Image Processing: ERDAS Imagine 9.0 & ENVI 5.0 Geographical Information System:
Arc GIS 10.1 Others: MS-Office-2010(MS-word, MS-Excel) for documentation and calculation.
Table-1: Details of the satellite data used in this study.
SL. No. Data Use Year Source
1 Landsat-7 TM 1998,2003,2014 Glovis
2 Landsat-7 MSS 1977 Glovis
3 Google Earth Image 2014 Google Earth
4 Hyperion EO-1 2003 Glovis
A RS-GIS based Spatial Analysis and Assessment on the Urban Growth of Delhi National Capital ..
DOI: 10.9790/0837-220611103123 www.iosrjournals.org 106 | Page
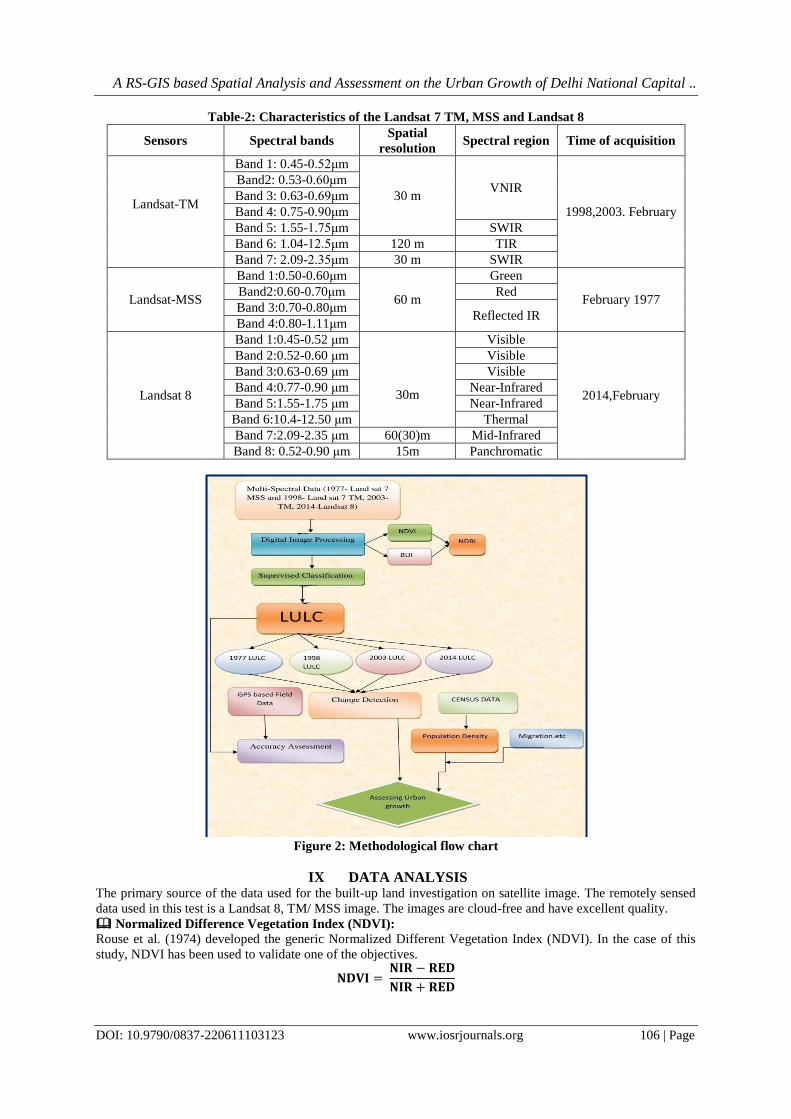
Table-2: Characteristics of the Landsat 7 TM, MSS and Landsat 8
Sensors Spectral bands Spatial
resolution Spectral region Time of acquisition
Landsat-TM
Band 1: 0.45-0.52μm
30 m VNIR
1998,2003. February
Band2: 0.53-0.60μm
Band 3: 0.63-0.69μm
Band 4: 0.75-0.90μm
Band 5: 1.55-1.75μm SWIR
Band 6: 1.04-12.5μm 120 m TIR
Band 7: 2.09-2.35μm 30 m SWIR
Landsat-MSS
Band 1:0.50-0.60μm
60 m
Green
February 1977 Band2:0.60-0.70μm Red
Band 3:0.70-0.80μm Reflected IR
Band 4:0.80-1.11μm
Landsat 8
Band 1:0.45-0.52 μm
30m
Visible
2014,February
Band 2:0.52-0.60 μm Visible
Band 3:0.63-0.69 μm Visible
Band 4:0.77-0.90 μm Near-Infrared
Band 5:1.55-1.75 μm Near-Infrared
Band 6:10.4-12.50 μm Thermal
Band 7:2.09-2.35 μm 60(30)m Mid-Infrared
Band 8: 0.52-0.90 μm 15m Panchromatic
Figure 2: Methodological flow chart
IX DATA ANALYSIS The primary source of the data used for the built-up land investigation on satellite image. The remotely sensed
data used in this test is a Landsat 8, TM/ MSS image. The images are cloud-free and have excellent quality.
Normalized Difference Vegetation Index (NDVI):
Rouse et al. (1974) developed the generic Normalized Different Vegetation Index (NDVI). In the case of this
study, NDVI has been used to validate one of the objectives.
A RS-GIS based Spatial Analysis and Assessment on the Urban Growth of Delhi National Capital ..
DOI: 10.9790/0837-220611103123 www.iosrjournals.org 107 | Page
A Normalized Difference Vegetation Index (NDVI) is an equation that takes into account the amount
of infrared reflected by plants. Live green plants absorb solar radiation, which they use as a source of energy in
the process of photosynthesis. The reason NDVI is related to vegetation is that healthy vegetation reflects very
well in the near-infrared part of the electromagnetic spectrum. Green leaves have a reflectance of 20% or less in
the 0.5 to 0.7 micron range (green to red) and about 60% in the 0.7 to 1.3 micron range (near-infrared).
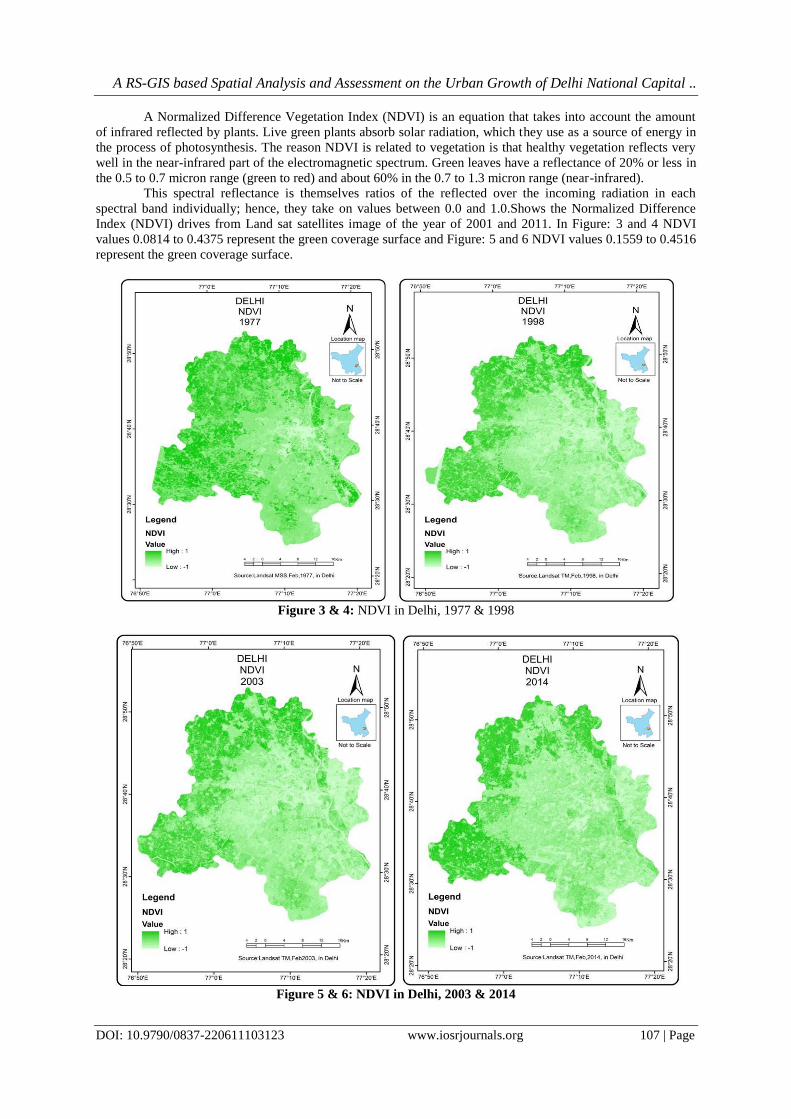
This spectral reflectance is themselves ratios of the reflected over the incoming radiation in each
spectral band individually; hence, they take on values between 0.0 and 1.0.Shows the Normalized Difference
Index (NDVI) drives from Land sat satellites image of the year of 2001 and 2011. In Figure: 3 and 4 NDVI
values 0.0814 to 0.4375 represent the green coverage surface and Figure: 5 and 6 NDVI values 0.1559 to 0.4516
represent the green coverage surface.
Figure 3 & 4: NDVI in Delhi, 1977 & 1998
Figure 5 & 6: NDVI in Delhi, 2003 & 2014
A RS-GIS based Spatial Analysis and Assessment on the Urban Growth of Delhi National Capital ..
DOI: 10.9790/0837-220611103123 www.iosrjournals.org 108 | Page
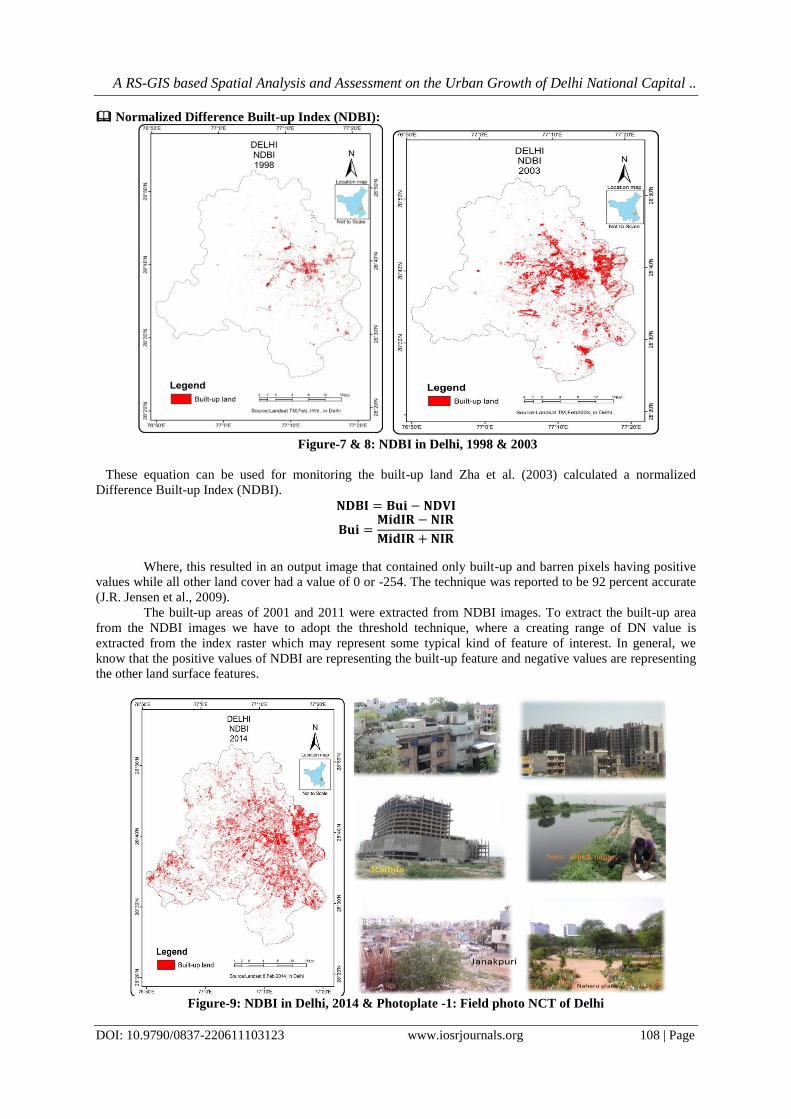
Normalized Difference Built-up Index (NDBI):
Figure-7 & 8: NDBI in Delhi, 1998 & 2003
These equation can be used for monitoring the built-up land Zha et al. (2003) calculated a normalized
Difference Built-up Index (NDBI).
Where, this resulted in an output image that contained only built-up and barren pixels having positive
values while all other land cover had a value of 0 or -254. The technique was reported to be 92 percent accurate
(J.R. Jensen et al., 2009).
The built-up areas of 2001 and 2011 were extracted from NDBI images. To extract the built-up area
from the NDBI images we have to adopt the threshold technique, where a creating range of DN value is
extracted from the index raster which may represent some typical kind of feature of interest. In general, we
know that the positive values of NDBI are representing the built-up feature and negative values are representing
the other land surface features.
Figure-9: NDBI in Delhi, 2014 & Photoplate -1: Field photo NCT of Delhi

A RS-GIS based Spatial Analysis and Assessment on the Urban Growth of Delhi National Capital ..
DOI: 10.9790/0837-220611103123 www.iosrjournals.org 109 | Page
Linmear Spectral Unmixing Techniques:
Spectral unmixing of satellite images is one of the most widely used methods for deriving information
from mixed pixels (Lu et al., 2003). The spectral unmixing method has been successfully used for assessing
forest thinning (Lunette, 1998) and for forest land cover/land use change detection (e.g. Lu et al., 2003; Souza et
al., 2003). The idea behind linear spectral mixture analysis is that every image pixel is a mixture of different
components (called end members) and the spectrum recorded by the sensor is a linear combination of end
member spectra (Tompkins et al., 1997). It has to be kept in mind that the assumption of linear mixing holds
only if multiple scattering between different land cover types is insignificant (Tompkins et al., 1997; Wu &
Murray, 2003). Therefore, in the case of linear spectral mixing the value of a pixel in an image for a band equals
the weighted sum of the radiance values for that band of all targets present in the pixel:
n
Ri=∑fkRik+ERi
K=1
Where i =1,…, m (number of spectral bands); k =1,…, n (number of end members);Ri is the value of a pixel
in band i; fk is the fraction of end member k in that pixel; Rik is the radiance of end member k in band i; and ERi
is the unmodelled residual in band i (Weng et al., 2004).
Usually the end member fractions in a pixel are constrained to sum to unity and each end member fraction itself
is expected not to have a negative value or be greater than 1 (Weng et al., 2004):
n
∑fk=1 and 0 ≤ fk ≤1
k=1
Figure 10: Linear spectral Unmixing map in Delhi, (Multi-spectral) 2014

A RS-GIS based Spatial Analysis and Assessment on the Urban Growth of Delhi National Capital ..
DOI: 10.9790/0837-220611103123 www.iosrjournals.org 110 | Page
Figure 11 & 12: Linear spectral Unmixing map in Delhi (Hypersexual)-2003
Figure: 10, 11 & 12, represent the fractional images derived from linear spectral unmixing method for both
multi-spectral and hyper-spectral imagery of 2003. The visual comparison between the fractional images of
various land use land cover features shows similar spatial pattern.
I. Land use & Land cover:
Land is one of the most important natural resource on which all human activities are based. Therefore,
knowledge on different type of lands as well as its spatial distribution in the form of map and statistical data is
vital for its geospatial planning and management for optimal use of the land resources. The information on land
use/ cover inventory that includes type, spatial distribution, aerial extent, location, rate and pattern of change of
each category is of paramount importance for assessing the impact of Urban growth on land use/ cover. The
present framework of land use/cover classification has been primarily based on the ‘Manual of Nationwide Land
Use/ Land Cover Mapping Using Satellite Imagery’ developed by National Remote Sensing Agency,
Hyderabad, Land use/vegetation cover map was prepared on the basis of image interpretation carried out based
on the satellite data for the year 1977, 1998, 2003 & 2014 through the help of Landsat-MMS, Land sat-TM &
landsat-8 satellite.
A RS-GIS based Spatial Analysis and Assessment on the Urban Growth of Delhi National Capital ..
DOI: 10.9790/0837-220611103123 www.iosrjournals.org 111 | Page
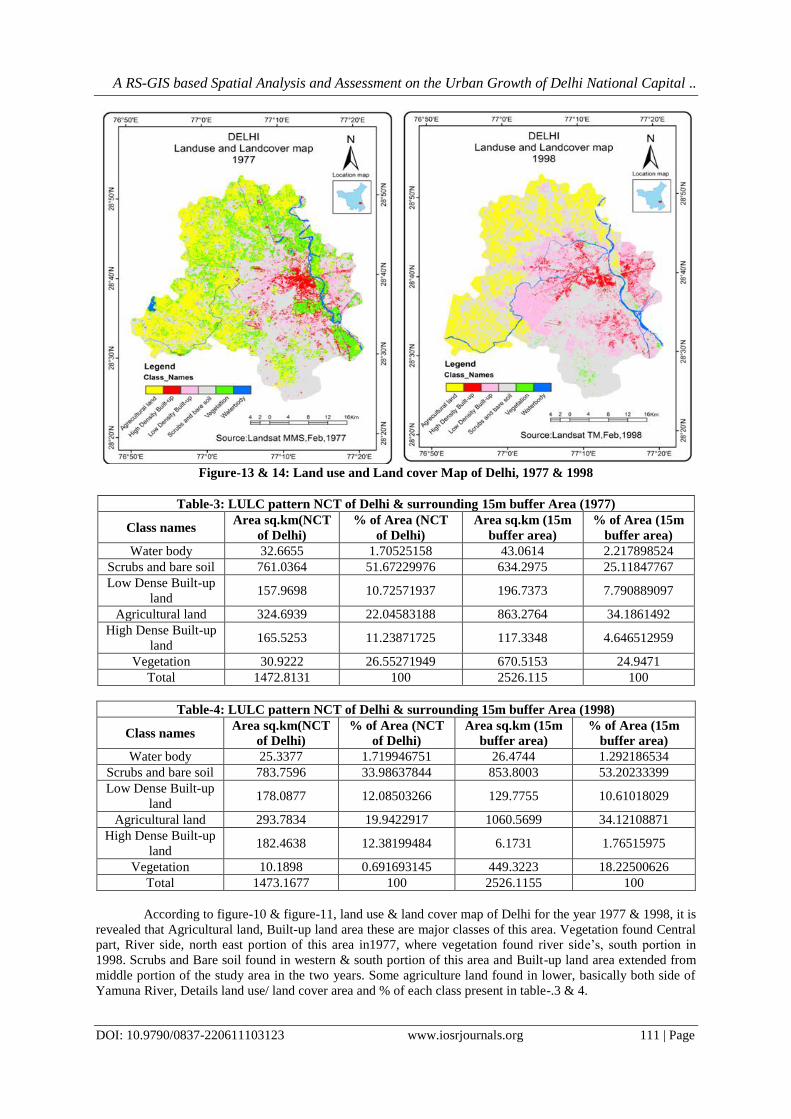
Figure-13 & 14: Land use and Land cover Map of Delhi, 1977 & 1998
Table-3: LULC pattern NCT of Delhi & surrounding 15m buffer Area (1977)
Class names Area sq.km(NCT
of Delhi)
% of Area (NCT
of Delhi)
Area sq.km (15m
buffer area)
% of Area (15m
buffer area)
Water body 32.6655 1.70525158 43.0614 2.217898524
Scrubs and bare soil 761.0364 51.67229976 634.2975 25.11847767
Low Dense Built-up
land 157.9698 10.72571937 196.7373 7.790889097
Agricultural land 324.6939 22.04583188 863.2764 34.1861492
High Dense Built-up
land 165.5253 11.23871725 117.3348 4.646512959
Vegetation 30.9222 26.55271949 670.5153 24.9471
Total 1472.8131 100 2526.115 100
Table-4: LULC pattern NCT of Delhi & surrounding 15m buffer Area (1998)
Class names Area sq.km(NCT
of Delhi)
% of Area (NCT
of Delhi)
Area sq.km (15m
buffer area)
% of Area (15m
buffer area)
Water body 25.3377 1.719946751 26.4744 1.292186534
Scrubs and bare soil 783.7596 33.98637844 853.8003 53.20233399
Low Dense Built-up
land 178.0877 12.08503266 129.7755 10.61018029
Agricultural land 293.7834 19.9422917 1060.5699 34.12108871
High Dense Built-up
land 182.4638 12.38199484 6.1731 1.76515975
Vegetation 10.1898 0.691693145 449.3223 18.22500626
Total 1473.1677 100 2526.1155 100
According to figure-10 & figure-11, land use & land cover map of Delhi for the year 1977 & 1998, it is
revealed that Agricultural land, Built-up land area these are major classes of this area. Vegetation found Central
part, River side, north east portion of this area in1977, where vegetation found river side’s, south portion in
1998. Scrubs and Bare soil found in western & south portion of this area and Built-up land area extended from
middle portion of the study area in the two years. Some agriculture land found in lower, basically both side of
Yamuna River, Details land use/ land cover area and % of each class present in table-.3 & 4.
A RS-GIS based Spatial Analysis and Assessment on the Urban Growth of Delhi National Capital ..
DOI: 10.9790/0837-220611103123 www.iosrjournals.org 112 | Page
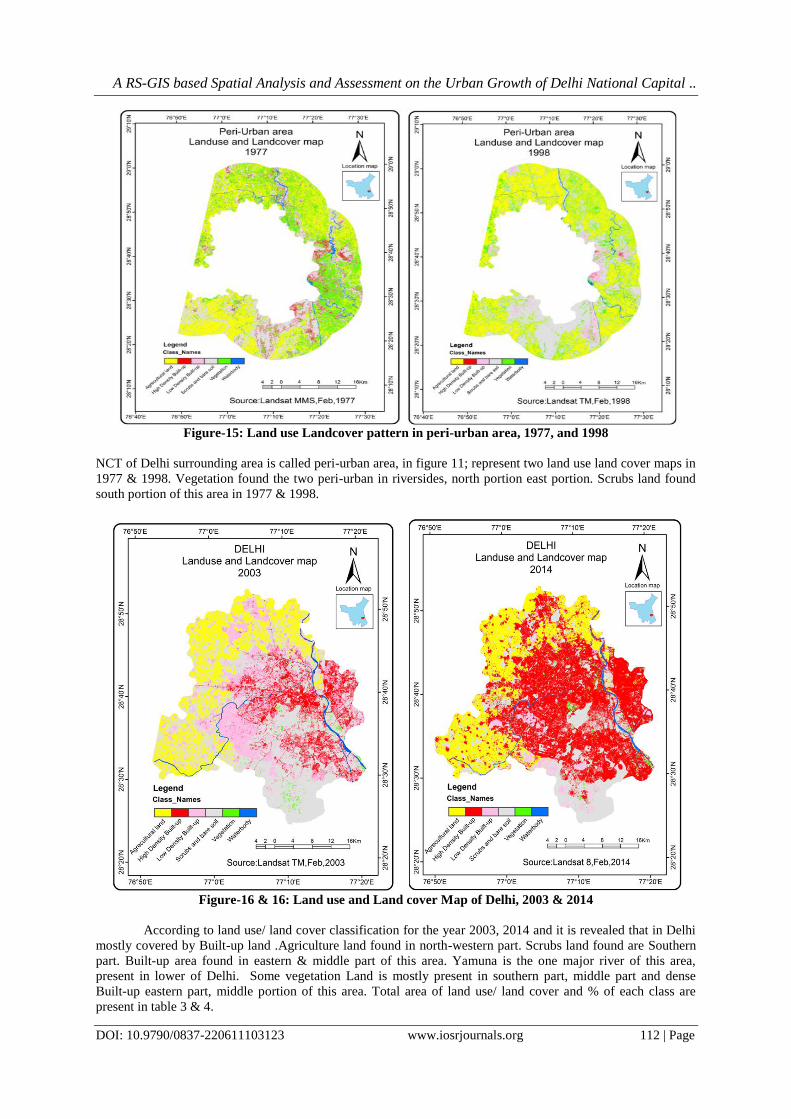
Figure-15: Land use Landcover pattern in peri-urban area, 1977, and 1998
NCT of Delhi surrounding area is called peri-urban area, in figure 11; represent two land use land cover maps in
1977 & 1998. Vegetation found the two peri-urban in riversides, north portion east portion. Scrubs land found
south portion of this area in 1977 & 1998.
Figure-16 & 16: Land use and Land cover Map of Delhi, 2003 & 2014
According to land use/ land cover classification for the year 2003, 2014 and it is revealed that in Delhi
mostly covered by Built-up land .Agriculture land found in north-western part. Scrubs land found are Southern
part. Built-up area found in eastern & middle part of this area. Yamuna is the one major river of this area,
present in lower of Delhi. Some vegetation Land is mostly present in southern part, middle part and dense
Built-up eastern part, middle portion of this area. Total area of land use/ land cover and % of each class are
present in table 3 & 4.

A RS-GIS based Spatial Analysis and Assessment on the Urban Growth of Delhi National Capital ..
DOI: 10.9790/0837-220611103123 www.iosrjournals.org 113 | Page
Table-5: LULC pattern NCT of Delhi & surrounding 15m buffer Area (2003)
Class names Area sq.km(NCT
of Delhi)
% of Area (NCT
of Delhi)
Area sq.km (15m
buffer area)
% of Area (15m
buffer area)
Water body 19.4184 1.318139 14.6484 0.579878473
Scrubs and bare soil 705.7818 47.90912 600.714 23.78014782
Low Dense Built-up
land 268.3953 18.21892 220.4442 8.726608106
Agricultural land 265.626 18.02971 1082.042 42.83422908
High Dense Built-up
land 204.121 13.85498 51.7437 2.048350521
Vegetation 9.9252 0.673731 556.5231 22.030786
Total 1473.167 100 2526.115 100
Table-6: LULC pattern NCT of Delhi & surrounding 15m buffer Area (2014)
Class names Area sq.km(NCT
of Delhi)
% of Area (NCT
of Delhi)
Area sq.km (15m
buffer area)
% of Area (15m
buffer area)
Water body 17.3727 1.179277 15.6699 0.565959783
Scrubs and bare soil 418.7628 28.42606611 661.0374 23.87510983
Low Dense Built-up
land 120.3767 8.171298961 15.0849 0.544830965
Agricultural land 262.5652 17.8232062 1273.8582 46.00874993
High Dense Built-up
land 645.3799 43.80907689 731.8332 26.43208694
Vegetation 8.7075 0.5910744 71.2467 2.573262553
Total 1473.1677 100 2526.1155 100
Figure-17: Land use Landcover pattern in peri-urban area, 2003 and 2014
Two peri-urban area in 2003 & 2014 ,high dense built-up land found east portion in 2014,where some
built-up land found east portion in 2003.Scrubs land to shows south portion in two years, but agricultural land
north, north-south and some south-west portion of this area.
Figure-16 represents relationship between landuse landcover pattern peri-urban area and NCT of Delhi
in 2003 & 2014. In table-5 & 6, Water body of peri-urban area was 2.21%where NCT of Delhi is 1.71%.Low
dense built-up and high dense built-up land was 10.61% and 1.76% in peri-urban area, where NCT of Delhi was
12.08% and 12.38% in 1977.Another 1998 we shows in table-4, waterbody and vegetation was 1.29%
&18.22%in peri-urban area, where water body and vegetation was 1.72% &0.69% in NCT of Delhi. But low
and high dense built-up was 10.61% & 1.76% in peri-urban area, where NCT of Delhi was 12.08% & 12.31%.

A RS-GIS based Spatial Analysis and Assessment on the Urban Growth of Delhi National Capital ..
DOI: 10.9790/0837-220611103123 www.iosrjournals.org 114 | Page
Figure-16 & 17: Relationship between peri-urban land and Delhi NCT in 1998 and 2003
In table-5, Water body and vegetation of peri-urban area was 0.57% & 22.03%.where NCT of Delhi
was 1.31% and 0.67% in 2003.Low dense built-up and high dense built-up land was 8.72% and 2.04% in peri-
urban area, where NCT of Delhi was 18.21% and 13.85%.Another 2014, we shows in table-6,waterbody and
vegetation was 0.56% &2.57%in peri-urban area, where water body and vegetation was 1.17% & 0.59% in NCT
of Delhi. But low and high dense built-up was 0.54% 26.43% in peri-urban area, where NCT of Delhi was 8.1%
& 43.50%.
Figure-18 & 19: Relationship between land use/ land cover of peri-urban land and Delhi NCT in 1977 and
2003

A RS-GIS based Spatial Analysis and Assessment on the Urban Growth of Delhi National Capital ..
DOI: 10.9790/0837-220611103123 www.iosrjournals.org 115 | Page
Figure-20, 21, 22 & 23: Pie Diagram of various LULC Delhi (1977-2014)
X RESULT & DISCUSSION: Built-up land has significantly impacted the forest cover, agriculture land, vegetation etc. In NCT of
Delhi Analysis of the LULC maps (shown in Fig.) generated for the four time periods show changes in
vegetation, scrubs and bare soil, agriculture land, Built-up land, water body etc.
Table-5 & table-6 represents area occupied by the 6 LULC classes from 1977 to 2014. Significant
changes in area of the vegetation, scrub and Bare soil, built-up land etc. was identified.Waterbody declined in
area from 32.67 sq.km in 1977 to 25.34 sq.km in 1998 & 19.42 sq.km in 2003, 17.37sq.km in 2014 respectively.
While percentage of water body was 2.217898524% in 1977 to 1.719% in 1998 & 1.32% in 2003 to 1.18% in
2014 of this area. Built-up area has significantly changes from 1977 to 1998 & 2003 to 2014.High dense Built-
up area was 204.121 sq.km and low dense built-up declined in area was 268.3953 sq.km in 1977 to high dense
built-up was 182.4638 sq.km and low dense built-up was 178.0877 sq.km in 1998 & 204.121 sq.km and
268.3953 sq.km in 2003, 645.3799 sq.km and 120.3767 sq.kim in 2014 respectively. While percentage area of
high dense and low dense built-up is 11.24% and 10.73% in 1977 to 12.38% and 12.09% in 1998,13.85% and
18.21% in 2003 to 43.81% and 8.17% in 2014 of this area. Scrubs and Bare soil is 761.04 sq km & 783.76 sq
km in 1977 and 1998, where percentage of scrubs land was 51.67% and 53.19% in 1977 and 1998.For
Vegetation was 30.92 sq km and 10.19 sq km in 1977 & 1998, 9.93 sq km, 8.71 sq km in 2003 and 2014,
percentage of vegetation was 2.10% and 0.69% in 1977, 1998.2003 and 2014 was 0.67%, 0.595%.
Table-7: Changing land use / land cover area in Delhi (1998 to 1977)
Class Name Area in %
Change of Area in % 1977 1998
Water body 2.217898524 1.719416513 -0.498482011
Scrubs and bare soil 51.67229976 53.18593235 1.513632585
Low Dense Built-up
land 10.72571937 12.08503266 1.359313288
Agricultural land 22.04583188 19.93614373 -2.109688152
High Dense Built-up
land 11.23871725 12.38199484 1.143277585
Vegetation 2.099533199 0.691479905 -1.408053295
100 100
Table-7 represents rate of change in area of different LULC classes in 1998 to 1977. Different types of
land use & land cover present, but some classes increase and some classes reduce. Increase low dense built-up,
high dense built-up and scrubs and bare soil of this area, but reduce water body, vegetation and agricultural land
respectively. Low dense built-up, high dense built-up and scrubs land 1.14%, 1.36% and 1.51%.reduse features’
is 1.41% water bodies, 2.11% agricultural land and 0.50% Vegetation represent 1977 to 1998. Heavy changes of
total vegetated land indicate deforestation and natural degradation. Agriculture lands have reduced and scrubs
land increase from 1977 to 1998. Total agriculture land change. Due to reduce water body, which effects on
agriculture land and reduce crop product. Finally reduce vegetation, increase low dense built-up land of 21 years
periods and its related high dense built-up change of Delhi.. Details change of various land use & land cover
classes present in below figures-20 and 21.
A RS-GIS based Spatial Analysis and Assessment on the Urban Growth of Delhi National Capital ..
DOI: 10.9790/0837-220611103123 www.iosrjournals.org 116 | Page
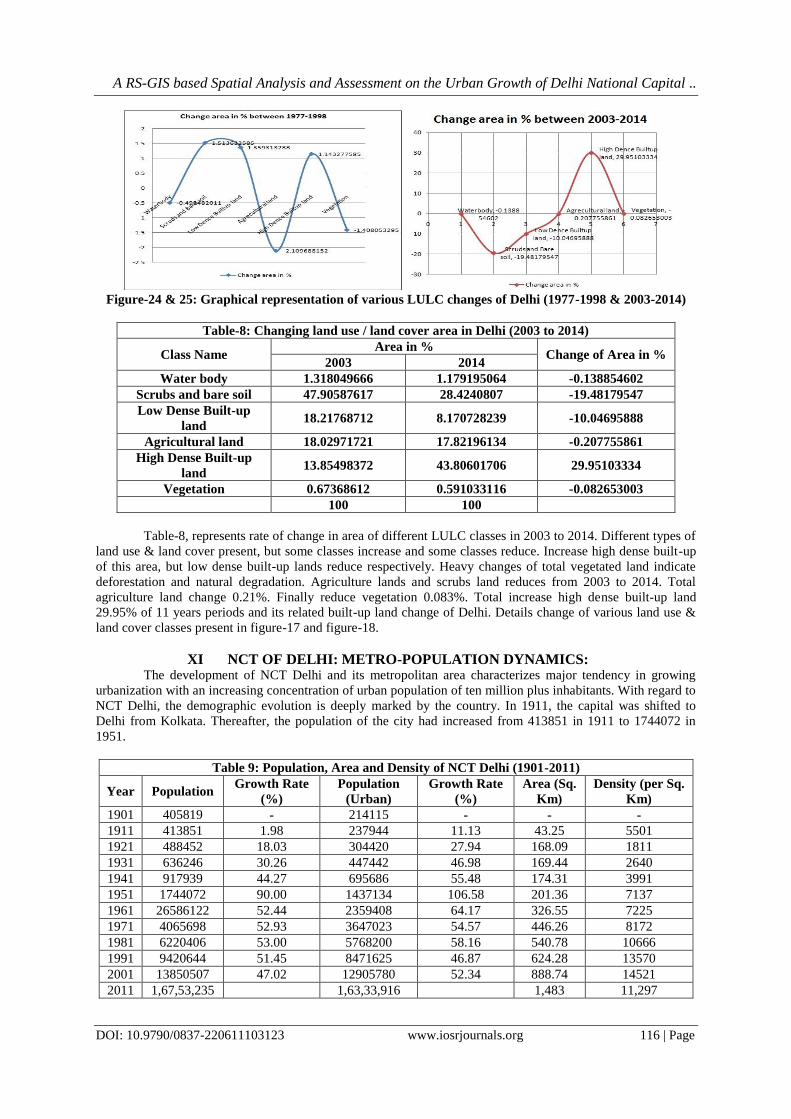
Figure-24 & 25: Graphical representation of various LULC changes of Delhi (1977-1998 & 2003-2014)
Table-8: Changing land use / land cover area in Delhi (2003 to 2014)
Class Name Area in %
Change of Area in % 2003 2014
Water body 1.318049666 1.179195064 -0.138854602
Scrubs and bare soil 47.90587617 28.4240807 -19.48179547
Low Dense Built-up
land 18.21768712 8.170728239 -10.04695888
Agricultural land 18.02971721 17.82196134 -0.207755861
High Dense Built-up
land 13.85498372 43.80601706 29.95103334
Vegetation 0.67368612 0.591033116 -0.082653003
100 100
Table-8, represents rate of change in area of different LULC classes in 2003 to 2014. Different types of
land use & land cover present, but some classes increase and some classes reduce. Increase high dense built-up
of this area, but low dense built-up lands reduce respectively. Heavy changes of total vegetated land indicate
deforestation and natural degradation. Agriculture lands and scrubs land reduces from 2003 to 2014. Total
agriculture land change 0.21%. Finally reduce vegetation 0.083%. Total increase high dense built-up land
29.95% of 11 years periods and its related built-up land change of Delhi. Details change of various land use &
land cover classes present in figure-17 and figure-18.
XI NCT OF DELHI: METRO-POPULATION DYNAMICS: The development of NCT Delhi and its metropolitan area characterizes major tendency in growing
urbanization with an increasing concentration of urban population of ten million plus inhabitants. With regard to
NCT Delhi, the demographic evolution is deeply marked by the country. In 1911, the capital was shifted to
Delhi from Kolkata. Thereafter, the population of the city had increased from 413851 in 1911 to 1744072 in
1951.
Table 9: Population, Area and Density of NCT Delhi (1901-2011)
Year Population Growth Rate
(%)
Population
(Urban)
Growth Rate
(%)
Area (Sq.
Km)
Density (per Sq.
Km)
1901 405819 - 214115 - - -
1911 413851 1.98 237944 11.13 43.25 5501
1921 488452 18.03 304420 27.94 168.09 1811
1931 636246 30.26 447442 46.98 169.44 2640
1941 917939 44.27 695686 55.48 174.31 3991
1951 1744072 90.00 1437134 106.58 201.36 7137
1961 26586122 52.44 2359408 64.17 326.55 7225
1971 4065698 52.93 3647023 54.57 446.26 8172
1981 6220406 53.00 5768200 58.16 540.78 10666
1991 9420644 51.45 8471625 46.87 624.28 13570
2001 13850507 47.02 12905780 52.34 888.74 14521
2011 1,67,53,235 1,63,33,916 1,483 11,297

A RS-GIS based Spatial Analysis and Assessment on the Urban Growth of Delhi National Capital ..
DOI: 10.9790/0837-220611103123 www.iosrjournals.org 117 | Page
Delhi In 1901, the urban population of Delhi was 214115. In 1912, the capital was shifted from
Calcutta to acquired land of 46 sq. kms south of the walled city called New. In 1951, the urban population more
than doubled to 1.43 million from 0.70 million in 1941 due to forced migration after partition. In 1956, a
contiguous landmass measuring 1483 sq. km was called the Union Territory of Delhi (UT). However, from
1992, it has been renamed as the National Capital Territory of Delhi (NCTD). As per the Regional Plan 2021, it
has been indicated that the built up area of NCT Delhi has increased from 580.14 sq. km (1986) to 701.62 sq.km
(1999) which is more than 47% of the total area of NCT Delhi. As also observed from the above table, it can be
stated that NCT Delhi has witnessed intense urbanization. The urban agglomeration area has increased from a
mere 43.25 sq km in 1901 to 888.74 sq km in 2001 whereas during the same period density increased from 5501
persons per sq km to 14521 persons per sq km. The spatial expanse of urban area and population growth has
been concurrent in all the directions including sub-cities of Rhine, Dwarka, and Narela and also in Trans-
Yamuna Area. The total area of NCT Delhi is 147300 hectares (1473 sq. km) in 2014.
Table 10: District wise population in NCTof Delhi, 1961-2011
Districts Census Years
Population Density/
Sq.km
1961 2001 2011 1991 2001 2011 2001 2011
North
West 240973 6502 8298 1777968 2860869 3651261 6502 8298
North 611376 12405 14037 686654 781525 884318 12405 14037
North east 38155 31019 39311 1085250 1768061 2240749 31019 39311
East 135325 23606 27544 1023078 1463583 1707725 23606 27544
New
Delhi 143846 4841 3614 168669 179112 133713 4841 3614
Central 672063 43092 38578 656533 646385 578671 43092 38578
West 250702 20416 1433038 2128908 2531583 20416
South
West 251383 418 5458 1087573 175504 2292363 418 5458
South 314789 589956 986856 1051881 2267023 2733752 986856 South
The maximum decadal growth has taken place in south west district of about 30%,the new stability of
dwarka,which has came up in the ten years, is a major factor leading to high growth rate here. A lot of new
settlements have also taken place in and around najafgarh, leading to population growth. The urbanized village
such as kapashera, Bijwasam ctc have came heavily populated due to tenants who are migrants, mainly working
in factories in gurgaon and in Delhi.North West and north east districts have both shown high growth. In North
West district, which is largest district in Delhi both by area and by population? The slum rehabitation colons at
narela bhalswa, sabda, ghevde, ctc have been selected in the decade while both north east and east district shave
similar characterizes of providing affordable howsing.The population growth in east district is less compare to
north east mainly because of the effect of removal of Yamuna and others long settled slum clusters which fell in
east district, whereas an appreciable number of cluster still in north east district.
The nine districts vary greatly in population. The smallest population is of New Delhi district, which is
mostly contiguous with the NDMC area and comprises mainly of offices and official residences belonging to the
government of India embassies and commercial of Connaught place. The largest population is in North West
district, which is also the largest in area and comprises of a vast area which was still fairly recently quite rural in
character, but has now highly Urbanized and thickly populated. The pie chart above shows comparative
population of the nine districts.
The figure-20 ,represent overall population density of Delhi has increased from 9340 persons per sq.km
in 2001 to 11297 persons per sq.km in 2011.The variation of population density across the nine district as shown
figure 21.The high density of population is north east and central part in NCT of Delhi in 2011, Which
population density is 39311 persons per sq.km. Where 31019 persons per sq km in 2001.Low density is North
west, new Delhi and south west portion of this area in 2011, where population density is below 8298 persons
per sq.km.Where 2001 population density is below 6502 persons per sq km .Others district population density is
8299 to 27544 persons per sq km in 2011, where 6503 to 23606 persons sq km in 2001.

A RS-GIS based Spatial Analysis and Assessment on the Urban Growth of Delhi National Capital ..
DOI: 10.9790/0837-220611103123 www.iosrjournals.org 118 | Page
Figure-26: District wise population growth in Delhi 2001-2011 & Figure -27: District wise population
density in NCT of Delhi, 2001, 2011
Migration to NCT Delhi:
Migration has played a major role in the demographic evolution of NCT Delhi. Over one half of all
migrants living in Delhi during 1991-2001 were from neighboring states in North India: Haryana, Punjab,
Rajasthan and Uttar Pradesh. Delhi UA attracted very high number of migrants from other states in the last
decade. The number of out migrants from Delhi was only 3.92 lakh. Thus the total number of net migrants was
1.6 million in 2001 in comparison to 1.3 million in 1991. Major influx of population into Delhi was from Uttar
Pradesh (8.16 lakh), Bihar (3.82 lakh) and Haryana (1.5 lakh).Migrations from these states were male
dominated.
As per 2001 Census, migration towards NCT Delhi has revealed interesting results. The adjoining
states like Haryana, Uttar Pradesh and Rajasthan together still constitute maximum number of migrants moving
towards NCT Delhi. These three states contributed 51.98%, Uttar Pradesh (40.05%), Haryana (7.87%) and
Rajasthan (4.06%) respectively to the total migrants.

A RS-GIS based Spatial Analysis and Assessment on the Urban Growth of Delhi National Capital ..
DOI: 10.9790/0837-220611103123 www.iosrjournals.org 119 | Page
Table-11: Migrants classified by place of last residence
Place of last Residence Migrants to Delhi (%)
1971-81 1981-91 1991-2001
Uttar Pradesh 50.09 48.5 40.05
Haryana 12.93 11.51 7.87
Bihar 5.77 10.69 19.09
Uttaranchal - - 5.11
Rajasthan 7.63 6.00 4.06
Punjab 6.40 5.28 2.16
West Bengal 2.70 2.72 3.88
Madhya Pradesh 3.07 2.67 1.82
Others 11.41 12.91 15.96
Source: Migration Tables, Census of India, 2001
As per Table-11, the migration from Uttar Pradesh including Uttaranchal has declined from 50.09% in
1971-81 to 40.05% in 1991-01 excluding Uttaranchal. Similarly states of Haryana and Rajasthan have also
shown declining trends. However, the migration from Bihar has increased by three times i.e. 5.77% in 1971-81
to 19.09% in 1991-01. Hence, it can be seen that now migration from far off states have shown increasing trend
in the last decade.
Table 12: Reasons for migration
Reasons % of Migrants
1971-81 1981-91 1991-01
Employment 34.48 31.29 37.60
Business - 4.07 0.5
Education 3.33 2.28 2.7
Family moved 39.43 41.45 36.8
Marriage 12.63 15.62 13.8
Natural Calamities - 0.13 -
Others 10.14 5.16 6.3
Moved after Birth - - 2.4
Source: Migration Tables, Census of India, 2001
As per the Table-12,it is clear that employment is still most important reasons for migration which
constituted 37.6% of the various reasons stated by the migrants followed by movement of family (36.8%) and
marriage (13.8%). Hence, NCT Delhi continues to be center of attraction wherein pull factors have been
dominating as people by and large migrate for economic opportunities.
Table-13: Variation in Migration of people to Delhi between 1991-2001 Based on migrants by last
residence (0-9 years)
Migrated people 2001 Census 1991 Census Variation (1991-2001)
Immigrants from other
States 2172760 1543959 40.7
Immigrations from
abroad 49281 43533 13.2
Total Immigrants 2222041 1587492 40.0
Out migrants 457919 281946 62.4
Net. Migrants (+/-) 1764122 1305546 35.1
Source: Migration Tables, Census of India, 2001
As observed from the above table, Delhi attracted large number of migrants from other states in the last
decade. The total number of immigrants to Delhi during the last decade was 2.2 million while the numbers of
out migrants from Delhi were 4.57 lakh and those who migrated from abroad were 49281 in the same period.
Thus the total number of net - migrants was 1.7 million during 1991-2001 compared to 1.3 million during 1981-
91. Thus the number of out-migrants has doubled during the same period.
A RS-GIS based Spatial Analysis and Assessment on the Urban Growth of Delhi National Capital ..
DOI: 10.9790/0837-220611103123 www.iosrjournals.org 120 | Page
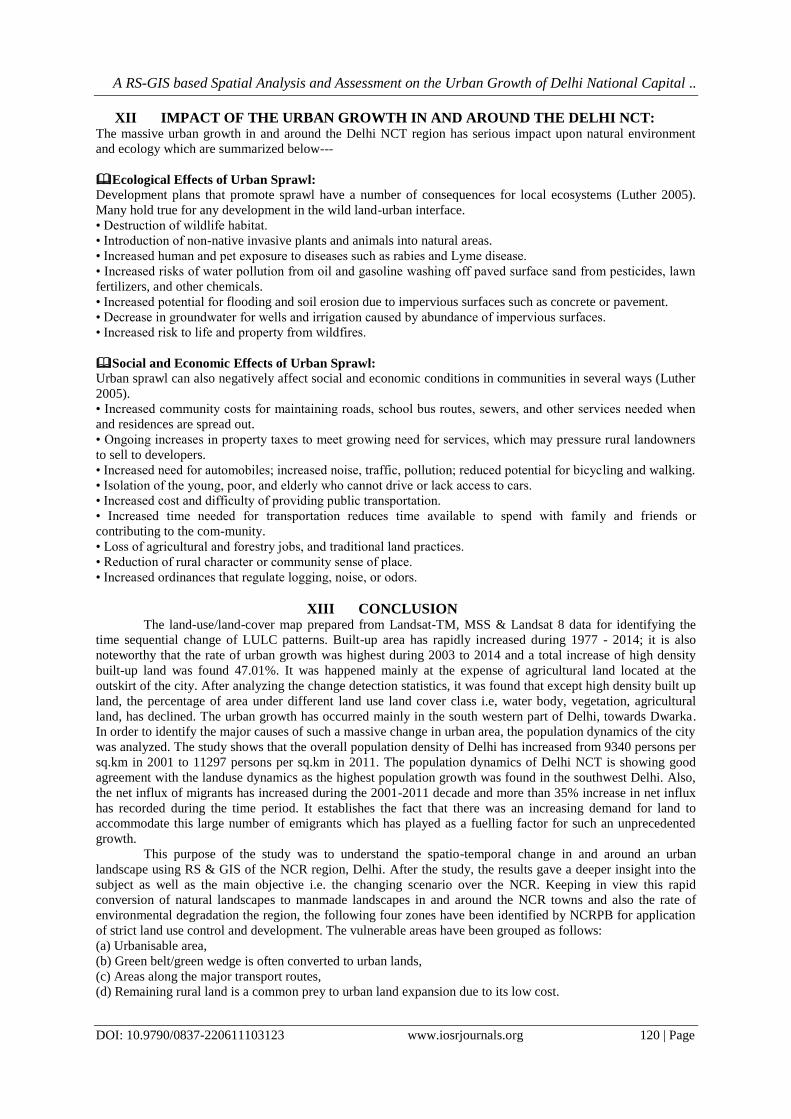
XII IMPACT OF THE URBAN GROWTH IN AND AROUND THE DELHI NCT: The massive urban growth in and around the Delhi NCT region has serious impact upon natural environment
and ecology which are summarized below---
Ecological Effects of Urban Sprawl:
Development plans that promote sprawl have a number of consequences for local ecosystems (Luther 2005).
Many hold true for any development in the wild land-urban interface.
• Destruction of wildlife habitat.
• Introduction of non-native invasive plants and animals into natural areas.
• Increased human and pet exposure to diseases such as rabies and Lyme disease.
• Increased risks of water pollution from oil and gasoline washing off paved surface sand from pesticides, lawn
fertilizers, and other chemicals.
• Increased potential for flooding and soil erosion due to impervious surfaces such as concrete or pavement.
• Decrease in groundwater for wells and irrigation caused by abundance of impervious surfaces.
• Increased risk to life and property from wildfires.
Social and Economic Effects of Urban Sprawl:
Urban sprawl can also negatively affect social and economic conditions in communities in several ways (Luther
2005).
• Increased community costs for maintaining roads, school bus routes, sewers, and other services needed when
and residences are spread out.
• Ongoing increases in property taxes to meet growing need for services, which may pressure rural landowners
to sell to developers.
• Increased need for automobiles; increased noise, traffic, pollution; reduced potential for bicycling and walking.
• Isolation of the young, poor, and elderly who cannot drive or lack access to cars.
• Increased cost and difficulty of providing public transportation.
• Increased time needed for transportation reduces time available to spend with family and friends or
contributing to the com-munity.
• Loss of agricultural and forestry jobs, and traditional land practices.
• Reduction of rural character or community sense of place.
• Increased ordinances that regulate logging, noise, or odors.
XIII CONCLUSION
The land-use/land-cover map prepared from Landsat-TM, MSS & Landsat 8 data for identifying the
time sequential change of LULC patterns. Built-up area has rapidly increased during 1977 - 2014; it is also
noteworthy that the rate of urban growth was highest during 2003 to 2014 and a total increase of high density
built-up land was found 47.01%. It was happened mainly at the expense of agricultural land located at the
outskirt of the city. After analyzing the change detection statistics, it was found that except high density built up
land, the percentage of area under different land use land cover class i.e, water body, vegetation, agricultural
land, has declined. The urban growth has occurred mainly in the south western part of Delhi, towards Dwarka.
In order to identify the major causes of such a massive change in urban area, the population dynamics of the city
was analyzed. The study shows that the overall population density of Delhi has increased from 9340 persons per
sq.km in 2001 to 11297 persons per sq.km in 2011. The population dynamics of Delhi NCT is showing good
agreement with the landuse dynamics as the highest population growth was found in the southwest Delhi. Also,
the net influx of migrants has increased during the 2001-2011 decade and more than 35% increase in net influx
has recorded during the time period. It establishes the fact that there was an increasing demand for land to
accommodate this large number of emigrants which has played as a fuelling factor for such an unprecedented
growth.
This purpose of the study was to understand the spatio-temporal change in and around an urban
landscape using RS & GIS of the NCR region, Delhi. After the study, the results gave a deeper insight into the
subject as well as the main objective i.e. the changing scenario over the NCR. Keeping in view this rapid
conversion of natural landscapes to manmade landscapes in and around the NCR towns and also the rate of
environmental degradation the region, the following four zones have been identified by NCRPB for application
of strict land use control and development. The vulnerable areas have been grouped as follows:
(a) Urbanisable area,
(b) Green belt/green wedge is often converted to urban lands,
(c) Areas along the major transport routes,
(d) Remaining rural land is a common prey to urban land expansion due to its low cost.

A RS-GIS based Spatial Analysis and Assessment on the Urban Growth of Delhi National Capital ..
DOI: 10.9790/0837-220611103123 www.iosrjournals.org 121 | Page
The governing bodies identify these regions and the likely major economic activities in thereof for
proposing appropriate and viable land use conversions. With the policy of inducing development in the regional
and sub-regional centers, the urbanization will be much more faster which implies additional land for urban
expansion. In the same lines, land use policies are existing, designed by the NCRPB for regulating the density of
settlements in the NCR:
(a) For urban centers upto1.0 lac population, a density of 80 persons per hectare,
(b) For urban centersof 1.0 lac of 5.0 lac population, a density of 110 persons per hectare, and
(c) For urban centers of more than 5.0 lac population, a density of 125 persons per hectare.
These policies along with the other quantified factors including spatial metrics should be used for
designing the landscape with environmentalism as an important aspect in mind. Mitigating the UHI intensity
wherein spatial metrics also has a role to play, increasing vegetation cover is the most widely applied measure
which could achieve huge energy savings through temperature reduction of an area. But as mentioned above
only the increase in quantity in few areas is not the solution but it has been uniformed and heterogeneous in its
spread. It was reported in a study conducted by Spronken-Smith et al. (2000) that parks could help control
temperatures through an evaporation of more than 300% as compared to its surrounding. Thus, areas in these
cities where there is high contiguity of built up, there parks and gardens can be introduced. Some other
traditional mitigation measures include lighter color of pavement and cooler roofs using spray; proper
ventilation; shades; open and airy spaces; photovoltaic canopies (Golden et al., 2007) etc. Fortunately, urban
heat island mitigation strategies—for example, trees and vegetation and green roofs—generally provide year-
round benefits, or their winter penalty, such as that from cool roofs, is much smaller than their summertime
benefits. Future policy efforts may focus on encouraging strategies to modify urban geometry and anthropogenic
heat in communities to reduce urban heat islands. However, most effective mitigation measures for an area
should be developed based on context/place specific spatio-temporal nature of UHI of an area. It is one future
potential of this study where the mitigation strategies can be designed based on urban geometry.
It is critical that we develop an integrated approach at a time when urbanizing regions are facing rapid
environmental change. Planners and managers worldwide face unprecedented challenges in accommodating
urban populations and improving their wellbeing while simultaneously maintaining ecosystem functions.
Agencies must devise policies to guide urban development and make decisions about investing in infrastructure
that is both economically viable and ecologically sustainable. An integrated framework is required to assess the
environmental implications of alternative urban development patterns and to develop policies to manage urban
areas in the face of change. In particular, strategies for urban growth management will require such integrated
knowledge to maintain ecological resilience by preventing development pressure on the urban fringe, reducing
resource use and emissions of pollutants, as well as minimizing impacts on terrestrial ecosystems. The ecology
of urban areas has long elicited the academic attention of ecologists, planners and social scientists and regional
planners, there is much opportunity to extend and integrate knowledge of the metropolis using an ecological
lens. How NCRPB and other planning and developmental authorities of the region manage urbanization and its
ecology will be crucial to the health and wellbeing of billions of people in the region. It appears urgent to find
solutions able to maintain the ecology and the biodiversity of conurbations with the sprawling urban areas, and
contemporarily to assure a sustainable future to humanity.
Figure-24: Scope of Urban Landscape Ecology (Wu et.al. 2013)

A RS-GIS based Spatial Analysis and Assessment on the Urban Growth of Delhi National Capital ..
DOI: 10.9790/0837-220611103123 www.iosrjournals.org 122 | Page
“Landscape ecology needs to be more ‘‘urban;’’ urban ecology needs to be more landscape-realistic; both
need to focus more on sustainability.”- (Wu et.al. 2013)
ACKNOWLEDGEMENT: We would like to express my sincere gratitude to the following persons without whom this
case study would not have been carried out effectively and successfully.
We would specially consider the constant support and guidance from my supervisor Dr.
Dipanwita Dutta, (Assistant Professor, Department of Remote Sensing & GIS, Vidyasagar University, Paschim
Medinipur-721102). Hereby we thank for her valuable and constructive suggestion during the planning and
development of this work. Her willingness to give her time so generously has been very much appreciated. We
wish to express my deep sense of gratitude to Mr. Sikhendra Kisor De, [Guest Lecturer, Vidyasagar
University, Retired Director (Geophysics), Geological Survey of India and Faculty of Remote Sensing & GIS
Dept., Vidyasagar University] for his inspiring guidance and constant encouragement throughout this study
work. We would also like to thank Dr. Abhisek Chakraborty (Assistant Professor, Department of Remote
Sensing & GIS., Vidyasagar University, Paschim Medinipur-721102), Dr. Jatisankar Bandyopadhyay
(Professor, Department of Remote Sensing & GIS., Vidyasagar University, Paschim Medinipur-721102) for
their valuable thought and knowledge given throughout the study.
A special thanks needs to Glovis for providing us with the necessary satellite image, Census of
India, 2001, Census Reports and District wise population in NCT of Delhi, 1961-2011 generate population
Density, Migrants classified by place of last residence from Census of India, 2001, Reasons for migration from
Census of India, 2001 and information regarding this work, for giving us necessary data relevant to our
work. Finally, we would give our heartiest respects to Department of Environment and Forests, Government of
NCT of Delhi, Delhi Development Authority-New Delhi and Ministry of Urban Development, Government of
India, Town and Country Planning Organization, New Delhi for extending their broad minds and helping hands
to complete this work.
REFERENCE [1]. Allen and Lu, 2003; Han et al., 2009; Bhatta, 2010; Thapa and Murayama, 2011. Form Follows Function,
Quantifying Urban Growth Pattern In Developing Countries Using Remote Sensing And Spatial Metrics.
[2]. (Lo, 2001; Lo and Yang, 2002; Weng, 2001;Cheng and Masser, 2003; Sudhira et al., 2004; Chabaeva et
al., 2004; Jat et al., 2006).Statistical techniques along with remote sensing and GIS have been used in
many urban sprawl studies.From fallows Urban growth and transport in Jeddah: Dynamic Modelling And
Assessment.
[3]. Batty, M., and K.S. Kim, 1992. Form Follows Function: Reformulating Urban Population Density
Functions, Urban Studies, 29:1043-1070.
[4]. Burchell, R. W.; and D. Listokin. 1995. Land, Infrastructure, Housing Costs and Fiscal Impacts
Associated with Growth: The Literature on the Impacts of Sprawl vs. Managed Growth. Cambridge MA:
Lincoln Institute of Land Policy.
[5]. Jensen, J.R., and D.C. Cowen, 1999. Remote Sensing of UrbanlSuburban Infrastructure and Socio-
Economic Attributes, Photogrammetric Engineering 9 Remote Sensing, 65(5):611-622.
[6]. Luck & Wu, 2002, spatial metrics provides a linkage to structure, pattern, processes and functionality in
urban studies ,from fallows, Quantifying Urban Growth Pattern In Developing Countries Using Remote
Sensing And Spatial Metrics.
[7]. Luther, T. 2005. “The Effects of Urban Sprawl on Forest Fragmentation and Parcelization.” Private
Forest, http://www.privateforest.org /forest101/sprawl.htm (accessed August 9, 2005).
[8]. Masek, J.G., F.E. Lindsay, and S.N. Goward, 2000. Dynamics of urban growth in the Washington DC
metropolitan area, 1973–1996, from Landsat observations, International Journal of Remote Sensing,
21(18):3473–3486.
[9]. McFeeters, S.K., 1996. The use of normalized difference water index (NDWI) in the delineation of open
water features, International Journal of Remote Sensing, 17(7):1425–1432.
[10]. Ottensmann, J.R., 1977. Urban Sprawl, Land Values and the Density of Development, Land Economics,
53(4):389-400.
[11]. Ray, T.W., 1994. Vegetation in remote sensing FAQs, Applications, ER Mapper, Ltd., Perth, unpaginated
CD-ROM.
[12]. Ridd, M.K., 1995. Exploring a VIS (vegetation-impervious surface-soil) model for urban ecosystem
analysis through remote sensing: Comparative anatomy for cities, International Journal of Remote
Sensing, 16(12):2165–2185.

A RS-GIS based Spatial Analysis and Assessment on the Urban Growth of Delhi National Capital ..
DOI: 10.9790/0837-220611103123 www.iosrjournals.org 123 | Page
[13]. Rossi, L., and Hari, R.E. (2007). Screening procedure to assess the impact of urban storm water
temperature to populations of brown trout in receiving water. Integrated Environmental Assessment and
Management, 3(3), 383-392.
[14]. Rouse, J.W., Hass, R.H., J.A. Schell and D.W. Deering, 1974, “Monitoring Vegetation System in the
Great Plains with ERTS”, Third Earth Resources Technology satellite-1 Symposium, Greenbelt: NASA
SP-351, pp3010-3017.
[15]. Santamouris, M. (1995) The Athens urban climate experiment. In PLEA ’98 1995 June 1998 (Lisbon).
James & James Science Publishers Ltd 1998:147-52
[16]. Scholz, M., and Grabowiecki, P. (2007). Review of permeable pavement systems. Building and
Environment, 42(1), 3830-3836.
[17]. Y. Zha, J. Gao and S. Ni (2003) , Use of normalized difference built-up index in automatically mapping
urban areas from TM imagery, International Journal of Remote Sensing 24 (3) (2003), pp. 583–659.