around retirement - scholarworks.iupui.edu · population.1 people are living longer, ... numbers,...
TRANSCRIPT

JULY 2018
How Women & Men GiveAround Retirement
Researched and written by:
Women’s Philanthropy InstituteThe Women’s Philanthropy Institute (WPI) is part of the Indiana University Lilly Family School of Philanthropy. WPI increases understanding of women’s philanthropy through rigorous research and education, interpreting and sharing these insights broadly to improve philanthropy. Learn more at https://philanthropy.iupui.edu/WPI.
Indiana University Lilly Family School of PhilanthropyThe Indiana University Lilly Family School of Philanthropy is dedicated to improving philanthropy to improve the world by training and empowering students and professionals to be innovators and leaders who create positive and lasting change. The school offers a comprehensive approach to philanthropy through its academic, research and international programs and through The Fund Raising School, Lake Institute on Faith & Giving and the Women’s Philanthropy Institute. Learn more at https://philanthropy.iupui.edu.
This research was completed with funding from the Bill & Melinda Gates Foundation. The findings and conclusions contained within are those of the authors and do not necessarily reflect official positions or policies of the Bill & Melinda Gates Foundation.
Indiana University Lilly Family School of Philanthropy Project Team
Una Osili, PhD, Associate Dean for Research and International Programs, Professor of Economics and Philanthropic Studies
Debra Mesch, PhD, Professor and Director of Women’s Philanthropy Institute, Eileen Lamb O’Gara Chair in Women’s Philanthropy
Jacqueline Ackerman, MPA, Assistant Director for Research and Partnerships, Women’s Philanthropy Institute
Andrea Pactor, MA, Associate Director, Women’s Philanthropy Institute
Xiao Han, MA, Applied Statistician
Heather O’Connor, Graduate Assistant
Special thanks to Phil Purcell for his insights on how to apply this research to practice.
Indiana University Lilly Family School of Philanthropy 301 University Boulevard, Suite 3000 Indianapolis, IN 46202-3272 317-278-8990 [email protected]
@WPIinsights #womensphilanthropy philanthropy.iupui.edu/Retirement

Highlights
The number of retirees is growing rapidly: 10,000 Baby Boomers will turn 65 every day through 2030, and those over 65 now represent 15 percent of the total population.1 People are living longer, and are more active during their retirement now than in previous decades. Despite advance planning, retirement represents a significant shift in life circumstances for many individuals. Households find that they have to adjust their spending in response to changes in earnings. How retirees participate in charitable giving, and how giving changes during this stage of life, is not well understood.
Men and women often have different experiences with the labor market; for example, women are less likely to enter and participate consistently in the workforce, and they tend to be paid less than men.2 These realities lead men and women to have different attitudes toward risk, savings, and spending, and to approach retirement differently. As women still live longer than men, they are likely to inherit wealth. They also exhibit different motivations for and patterns of charitable giving. Do these factors affect their philanthropic behavior at this juncture of their lives?
This study is the first known research to examine how retirement affects charitable giving. It looks at single men, single women, and married couples to analyze whether gender differences in giving or volunteering emerge among individuals at retirement. Additionally, it examines how giving changes during a range of years before and after retirement, with the understanding that preparing and undergoing such a life change is a process rather than one moment in time.
Key Findings
• Both men and women maintain their charitable giving after retirement, especially compared to other types of spending.
• Around retirement, single women and married couples are more likely to give and give more than single men. These gender differences are consistent before and after retirement.
• Around retirement, giving by single women and married couples is more stable than giving by single men.
• Around retirement, single women and married couples are more likely to volunteer, and their likelihood of volunteering is more stable, compared to single men.
HOW WOMEN & MEN GIVE AROUND RETIREMENT 3
Overview
As individuals live longer, how they spend their time and money in retirement is garnering more and more attention. In 1935, when the Social Security Administration set the minimum retirement age at 65, the average American life expectancy was 61.7.3 Today, the average age of retirement is 64.6 for men and 62.3 for women; life expectancy for men is 76.3 years and is 81.2 years for women.4 In addition, the over-65 population is expected to double from 49 million in 2016 to 98 million in 2060.5 Baby Boomers, who have been the largest living generation in history (with Millennials set to take over this status in 2019), are driving this exponential increase – thanks largely to advances in medical research and improved access to healthcare.6
With the increase in life expectancy, individuals’ attitudes and behaviors about retirement have changed. Retirement today is a far more fluid life cycle event than in previous decades. Some individuals never retire, some retire once, some have phased retirements, and some transition in and out of retirement.7 The reasons why people retire when they do are also changing. While some are forced to retire by specific workplace policies or poor health, more often people choose to retire – and can make this choice when they feel financially prepared.8 Because of their sheer numbers, Baby Boomers may well leave a unique imprint on retirement as they have throughout their lives in other areas such as culture, politics, entertainment, and sports. An AARP study of Baby Boomers turning 65 stated: “When their parents entered retirement, it was considered a time that might feature travel, relaxation, enjoyment, but little work outside of an avocation. Baby Boomers overall and many of those turning 65 consider work to be part of retirement and a significant percentage would say that they never will consider themselves retired.”9
The evolving attitudes and behaviors around retirement and the growing numbers of those reaching this inflection point prompt questions about how this transition affects charitable giving and volunteering by men and women. What is the impact of retirement on charitable giving? This study addresses the following questions:
• How does giving change as people retire?
• Does giving change in different ways around retirement according to gender and marital status?
• How does volunteering change as people retire, and are there gender differences?
4 HOW WOMEN & MEN GIVE AROUND RETIREMENT
Women and men approach retirement differently
Both academic research and industry studies about retirement indicate that men and women approach retirement differently, especially from a financial perspective. Men are more likely than women to say that planning and saving for retirement is their top financial priority.10 Men tend to plan for retirement earlier than women, and find the transition to retirement easier; men are also more likely than women to say they are very satisfied with their financial health.11 Women may express more concern than men about retirement, in particular about health and finances.12 Women are generally less confident than men in their financial health during retirement. Some of the reasons behind this confidence gap are women’s risk aversion in financial decision-making; longer life expectancy; the prospect of being single as they age; and having less money available in retirement.13 A recent industry study reported: “Retiring comfortably is a desire that’s shared by men and women alike, but their pursuit of that goal may appear very different. For women, achieving a secure retirement means preparing for one very real threat: outliving their savings.”14 Women are twice as likely as men to indicate a fear of running out of money in retirement.15
Although women express less confidence than men in their ability to retire comfortably, women are increasingly interested in learning more about financial management, including major investment decisions and retirement planning.16 At the same time, during their retirement years, women are more likely to volunteer than men, care for family members, and participate in religious activity.17
The question of gender differences around retirement has been largely ignored in the academic literature to date. Some studies have examined how men and women save for retirement differently, finding that women tend to have lower wealth when they retire and linking this trend to women’s greater aversion to risk.18 Marriage tends to benefit people who retire, since these couples save significantly by sharing a household and therefore sharing household expenses. One study found that older wives consume between 30 and 42 percent of total shared household expenditures.19
How do these gender differences affect charitable giving and volunteering at this stage of life?
HOW WOMEN & MEN GIVE AROUND RETIREMENT 5

Spending changes around retirement
Regardless of how well one has planned for retirement, the reduction in income at the end of one’s working life can come as a shock to a household. Economists have theorized for decades about how consumption, another term for purchasing or spending, would change at retirement. One theory posited that people would maintain their spending at the same levels after they retired, assuming that they would plan and save enough to spend the same amount after retirement as they did before.20 However, most studies find this is not the case; household consumption tends to decline at and after retirement.21 Household spending drops even when retirement is expected and planned.22 This decline in spending may take place for a number of reasons, including inadequate preparation for retirement, and recognizing that resources are not sufficient to maintain previous spending patterns.23
The retirement consumption gap is another factor to consider. Several studies have found that retirees’ assets are holding steady or increasing, with one study finding that higher-wealth retirees have a much larger consumption gap than the average household.24 The researchers suggested that “fear, failure to plan, and a lack of confidence in pre-determined drawdown strategies” explain the conservative drawdown.25 Another study suggested that retirees may hold onto their assets for a number of other reasons, including uncertainty about how their medical spending may increase as they age, and a desire to leave a bequest at their death.26
The larger economic situation can also affect retirement. The 2008 financial crisis and subsequent recession affected generations differently, with Baby Boomers seeing their retirement savings diminish significantly just as they were thinking about exiting the workforce.27 This caused many Americans to work longer than anticipated. In recent years, the stock market has recovered; now 17 percent of Baby Boomers indicate being retired, an increase from ten percent in 2010.28
This study examines how one particular type of spending, charitable giving, changes at this inflection point in an individual’s life.
6 HOW WOMEN & MEN GIVE AROUND RETIREMENT

Women and men give differently
A growing body of empirical knowledge has documented gender differences in giving. Prior research by the Women’s Philanthropy Institute has found that married and single women are more likely to give, and give higher amounts, compared to similarly-situated men.29 Women also volunteer more than men.30 Women tend to spread out their giving more than men, giving smaller amounts to more organizations compared to men’s more concentrated giving.31 Marriage is good for charitable giving; for both men and women, marriage increases the likelihood and amount of giving. Overall, married couples tend to give higher amounts to charity than single men and women.32
Because of the sheer size of the Baby Boomer generation and its outsized impact on all aspects of society, many studies have examined charitable giving by Baby Boomers. One study found that Baby Boomer and older women are more likely to give to charity and give more than their male counterparts when other factors affecting giving are held constant.33 While that study considered all financial resources (current income, wealth, home equity) available to the individual, it did not examine the effect of retirement on giving. Another study found that Generation X and Millennial single women today are giving as much as their counterparts in the Baby Boomer and older generations were four decades ago.34 If this trend continues, as future generations approach retirement, the best may be yet to come for charitable giving.
Unique Aspects of This Study
With more Americans entering their “golden years” in the foreseeable future, it is important for nonprofits and policy makers to understand the effect of retirement on charitable giving. This study is unique in two ways: content and methods. It is the first to analyze how charitable giving changes around retirement – as well as the first to explore how these changes may differ for women and men. It examines single men, single women, and married couples to determine whether gender differences emerge among individuals at retirement. The data used also allow for a more nuanced look at the longer time period leading up to and following the point of retirement. This approach reflects that while people may think of their retirement as beginning on a specific day or point in time, their behaviors often change in the years around that date as they prepare for and move through this significant life change.
This first glimpse of retirement, gender, and charitable giving provides encouraging information and suggests directions for deeper engagement with older Americans.
HOW WOMEN & MEN GIVE AROUND RETIREMENT 7

Data, Methods, and Definitions
This study uses data from the Philanthropy Panel Study (PPS), a module in the Panel Study of Income Dynamics (PSID). The PPS is the longest-running study of philanthropy in the United States, and includes information about respondents’ giving and volunteering behavior, as well as employment and retirement history. This report on gender and giving around retirement uses the full PPS data (including the nationally representative Survey Research Center sample as well as a low-income oversample) for eight calendar years of data, collected every two years from 2001 to 2015.
This report investigates the charitable giving of heads of households or partners of heads of households in at least one of the eight years of data, treating both heads of households and their partners as individuals within the data set. The sample is further restricted to individuals at least 55 years old; these individuals range in age from 55 to 101, with an average age of 67.8. Households in the sample had an average income of $75,250 and an average wealth of $463,964 (not including the value of their home). The sample size for this study is 6,012 unique individuals, for whom data are available over multiple years for a total of N = 25,627 person-year observations.
This report on gender and giving around retirement uses some general terms in specific ways. “Giving” means gifts made in a given year of data. This is commonly known as annual or “checkbook” giving. This study did not examine how individuals give at their deaths – known by various terms like planned giving, estate giving, or bequest giving. While this is an avenue for future research, the data used for this study do not contain information about such gifts. “Around retirement” in this report refers specifically to the five years prior to and five years after retirement. Given that people today have longer lifespans, retirement in some cases may last 30 years or more. Data used in this study are available for up to six years prior to and ten years after retirement, and analyses varied the window around retirement to be sure results were consistent no matter which window was used. For ease of visualizing and discussing results, this report shows a five-year window on either side of retirement.
The Methodology section at the end of this report contains more detail about the sample, definitions, and how data were analyzed.
8 HOW WOMEN & MEN GIVE AROUND RETIREMENT

Findings
Finding 1: Both men and women maintain their charitable giving after retirement, especially compared to other types of spending.
Economic studies have shown that people generally reduce their spending on many types of expenses when they retire. This pattern is consistent in data used for this report, illustrated in Figure 1. Consumption, another term for spending or purchasing, falls substantially in the years around retirement. Spending on housing, transportation, and education declines significantly, and food spending drops slightly; spending on healthcare does not drop after retirement. For some households, the decline in spending is a result of the shift in reduced housing or transportation as they reduce their hours worked. Other households may trim their spending if retirement is unexpected or if their financial resources for retirement are not adequate. Healthcare costs increase as retirees age, and some individuals retire specifically due to declining health. Figure 1 demonstrates that all types of households (single women, single men, and married couples) decrease their spending around retirement.i This overall consumption declines steadily, dropping 16 percent on average in the five years before and after retirement.
HOW WOMEN & MEN GIVE AROUND RETIREMENT 9
Note: Consumption measures are raw household averages from PPS data. See Methodology for further detail.
i Trend line figures in this report (Figures 1, 2, 3, and 7) show a five-year window on either side of retirement for ease of interpretation. Analyses underlying these findings varied the retirement window to ensure results are consistent. See Methodology for further detail.
$50,000
$45,000
$40,000
$35,000
$30,000
$25,000
$20,000
$15,000
-5 1-4 2-3 3-2 4-1 5
YEARS BEFORE AND AFTER RETIREMENT
AV
ERA
GE
HO
US
EHO
LD
CO
NS
UM
PT
ION
RETIREMENT
Figure 1: Trends in Consumption Around Retirement, by Gender
Overall Single Women Single Men Married Couples
100%
90%
80%
70%
60%
50%
40%
-5 1-4 2-3 3-2 4-1 5
YEARS BEFORE AND AFTER RETIREMENT
PER
ECEN
T O
F
HO
US
EHO
LDS
TH
AT G
IVE
RETIREMENT
Figure 2: Trends in Likelihood of Giving Around Retirement, by Gender
10 HOW WOMEN & MEN GIVE AROUND RETIREMENT
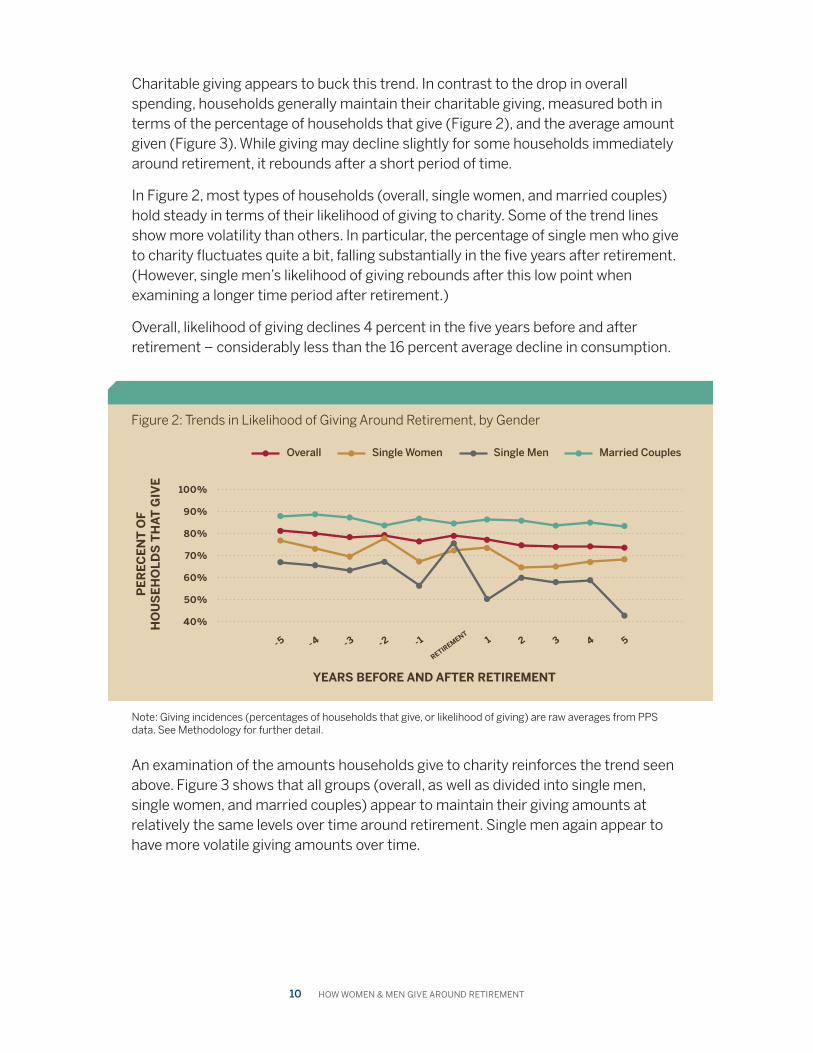
Charitable giving appears to buck this trend. In contrast to the drop in overall spending, households generally maintain their charitable giving, measured both in terms of the percentage of households that give (Figure 2), and the average amount given (Figure 3). While giving may decline slightly for some households immediately around retirement, it rebounds after a short period of time.
In Figure 2, most types of households (overall, single women, and married couples) hold steady in terms of their likelihood of giving to charity. Some of the trend lines show more volatility than others. In particular, the percentage of single men who give to charity fluctuates quite a bit, falling substantially in the five years after retirement. (However, single men’s likelihood of giving rebounds after this low point when examining a longer time period after retirement.)
Overall, likelihood of giving declines 4 percent in the five years before and after retirement – considerably less than the 16 percent average decline in consumption.
An examination of the amounts households give to charity reinforces the trend seen above. Figure 3 shows that all groups (overall, as well as divided into single men, single women, and married couples) appear to maintain their giving amounts at relatively the same levels over time around retirement. Single men again appear to have more volatile giving amounts over time.
Note: Giving incidences (percentages of households that give, or likelihood of giving) are raw averages from PPS data. See Methodology for further detail.
Overall Single Women Single Men Married Couples

HOW WOMEN & MEN GIVE AROUND RETIREMENT 11
Retirees give to charity fairly consistently after retirement, and retired households tend to maintain their giving patterns. This stability of charitable giving at retirement contrasts with other types of spending.
Checking the Numbers: What About Age?
Retirement is what economists consider a choice variable; in many cases, individuals choose to retire – because they are financially ready to do so, because of poor health, or for some other reason. People do not tend to retire simply because they turn age 65. Since many become eligible for government programs such as Social Security and Medicare around age 65, this may lead people to adjust their spending. One way to test Finding 1 is to look instead at whether giving changes around the age of 65, the traditional retirement age. Perhaps charitable giving doesn’t change at the point of retirement because some people retire when they feel ready to do so.
Examining age instead of retirement status confirms Finding 1. Consumption or spending falls between ages 60 and 70 by 22.7 percent. During this same age range, likelihood of giving actually increases by 5.0 percent. These results are similar to the results in Finding 1. Despite consumption falling around age 65, the likelihood and amount of giving stays roughly the same for married couples, and even increases slightly for single men and single women. This confirms that giving does not drop as people retire, or as they reach retirement age – even though these may be two different points in a person’s life.
Note: Giving amount measures are raw household averages from PPS data. Amounts are averaged over donors and non-donors. See Methodology for further detail.
$3,500
$4,000
$4,500
$3,000
$2,500
$2,000
$1,500
$1,000
$500
$0
-5 1-4 2-3 3-2 4-1 5
YEARS BEFORE AND AFTER RETIREMENT
AV
ERA
GE
HO
US
EHO
LD
GIV
ING
AM
OU
NT
RETIREMENT
Figure 3: Trends in Amount of Giving Around Retirement, by Gender
Overall Single Women Single Men Married Couples

12 HOW WOMEN & MEN GIVE AROUND RETIREMENT
Finding 2: Around retirement, single women and married couples are more likely to give and give more than single men. These gender differences are consistent before and after retirement.
Previous research by the Women’s Philanthropy Institute has shown that women are generally more likely to give than men, and they give higher amounts than men (holding all other factors constant, such as wealth, income, and education). Breaking down the population further to examine married and single people, married couples are more likely to give and give higher amounts, but single women maintain their higher likelihood and amounts of giving relative to single men.35 This seems to be generally true at most points during the life cycle.
As they retire, men and women tend to maintain these core gender differences; retirement does not impact the gender differences noted in other work. According to Figure 4, before retirement, an estimated 76.8 percent of single women give to charity, compared to 65.8 percent for single men – a difference of 11 percentage points.ii After retirement, these figures change only slightly: an estimated 76.0 percent of single women give to charity, compared to 67.0 percent for single men. This 9 percentage point difference is similar to the difference before retirement – the patterns before and after retirement do not change in terms of statistical significance.iii Married couples and single women are consistently more likely to give than single men, holding other factors constant, and these differences are statistically significant.
Single women and married couples are more likely to give, and give higher amounts, compared to single men – both before and after retirement. This “typical” pattern of gender differences does not seem to change as these groups retire.
ii A percentage point is the difference between two percentages; this is different from a percent change. For example, moving from 20 percent to 30 percent is a 10 percentage point increase, but is a 50 percent increase in what is being measured. iii Statistical significance means that a particular result is not likely due to chance. See Methodology for further detail. Here, the difference between single women and single men, and the difference between married couples and single men, is statistically significant at the p < 0.01 level.

HOW WOMEN & MEN GIVE AROUND RETIREMENT 13
Note: Giving incidences (percentages of households that give, or likelihood of giving) are estimated or predicted based on regression analysis using PPS data. “Before retirement” data come from households in the sample that selected an employment status other than “retired” in a given year. “After retirement” data come from households in the sample that selected a “retired” employment status in a given year. See Methodology for more detail.
80%
75%
70%
65%
60%
55%
50%
Before Retirement After Retirement
76.8% 76.0%
65.8%67.0%
78.2% 77.4%
PER
CEN
T O
F
HO
US
EHO
LDS
TH
AT G
IVE
Figure 4: Estimated Likelihood of Giving Before and After Retirement, by Gender
Single Women Single Men Married Couples
14 HOW WOMEN & MEN GIVE AROUND RETIREMENT
Checking the Numbers: Does the “transition year” affect giving?
Finding 1 showed that overall, people continue to give to charity as they approach and move through retirement. And Finding 2 showed that pre- and post-retirement giving is relatively stable – as are gender differences in that giving. However, these findings take a number of years of data into account. At the exact time of retirement, individuals may feel uncertain about many areas of their lives, particularly spending – including charitable giving. Understanding changes in giving in the year immediately before or after retirement adds detail to previous findings.
To examine Finding 2 in more depth, the sample was split into four groups:
• Those who were never retired during any years of data • Those who were retired during all years of data • Those in the transition year just before they retired • Those in the transition year just after they retired
This analysis “zooms in” on the transition into retirement to examine whether giving changes by gender right at the point of retirement. See the Methodology section for more detail on how these groups are defined.
Overall, people experiencing transition, regardless of gender or marital status, are less likely to give to charity. Figure 5 shows that during this transition period, giving is more stable for single women and married couples than for single men. In the year just before retirement, single men are more likely to give to charity; but in the year after retirement, their likelihood to give falls to its lowest point in the time period examined. Single men’s giving then rebounds after a few years as they “stabilize” their financial lives during retirement. For single women and married couples, giving rates do not seem to fluctuate in the same manner.

HOW WOMEN & MEN GIVE AROUND RETIREMENT 15
Note: See notes to Figure 4 for how estimated likelihood of giving is measured. “Never retired” households selected an employment status other than “retired” in every year of data. “Always retired” households selected a “retired” employment status in every year of data. “Year before retirement” and “year after retirement” data come from households that selected “retired” in the subsequent or previous year of data, respectively. See Methodology for more detail.
85%
80%
75%
70%
65%
60%
55%
50%
45%
40%
35%
Single Women Single Men Married Couples
PER
CEN
T O
F
HO
US
EHO
LDS
TH
AT G
IVE
Figure 5: Estimated Likelihood of Giving Around Retirement Transition, by Gender
78.7%75.2% 75.5% 76.6%
Year Before Retirement Year After Retirement Always Retired
64.1%
78.1%
67.3%
78.2%
62.2%
77.7%
73.5%77.0%
Never Retired
16 HOW WOMEN & MEN GIVE AROUND RETIREMENT
Finding 3: Around retirement, giving by single women and married couples is more stable than giving by single men.
Finding 1 demonstrated that overall, giving trends for single women, single men, and married couples were fairly stable as these groups moved into and through their retirement years. Households maintain their charitable giving, particularly compared to other types of spending. Yet the trend line for single men fluctuated noticeably: single men’s giving appeared more volatile compared to single women or married couples.
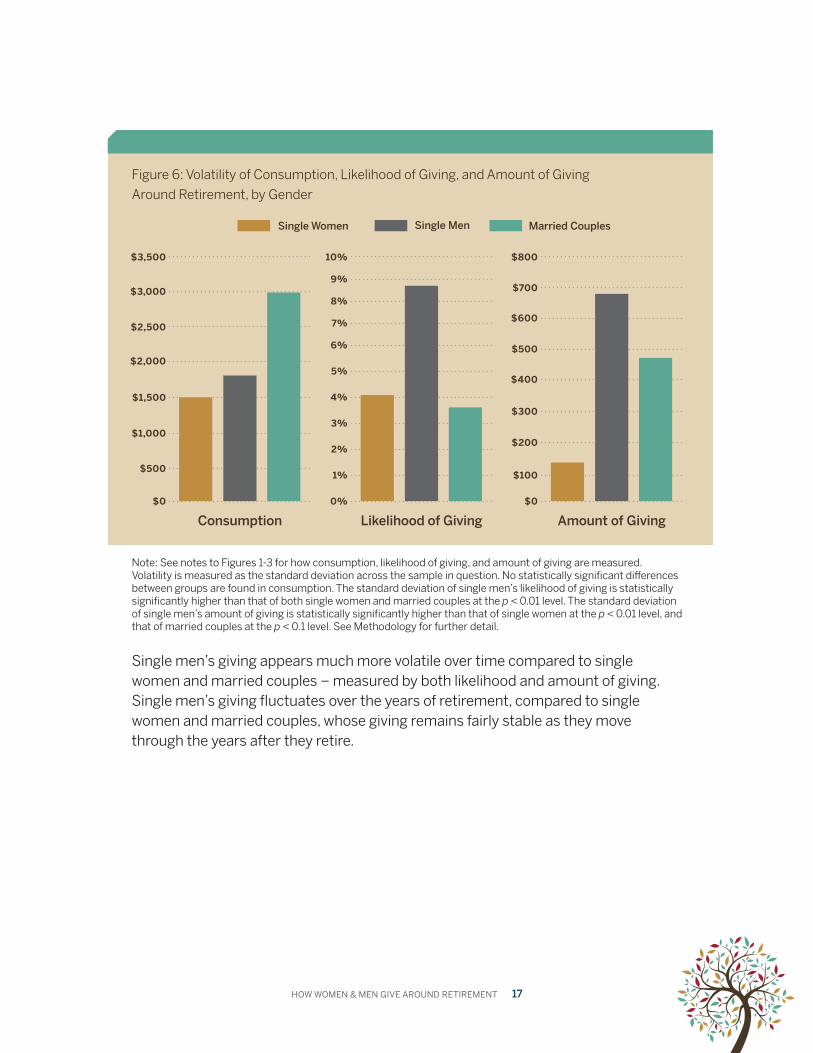
To display this volatility more clearly, Figure 6 shows how key measures vary for different groups by presenting their standard deviations. Standard deviation shows how much measurements in a group are spread out from the average. When standard deviation is high, numbers are very spread out. In Figure 6, a higher bar indicates higher volatility. In the left panel of Figure 6, single women and single men have roughly the same standard deviation in consumption (i.e., spending). Married couples’ consumption varies more widely, since there are two people in the couple who might vary their spending; however, these differences are not statistically significant.
Gender differences appear in the center and right panels of Figure 6. Single men’s giving is more volatile than giving by single women or married couples, both in terms of the likelihood of giving and the amount of giving – and these differences are statistically significant. The center panel shows that single men’s likelihood of giving varies much more widely than that of single women or married couples as they move through retirement. The right panel indicates that the dollar amount given by single women is quite stable, even more so than for married couples, when compared to the amount of giving by single men.
HOW WOMEN & MEN GIVE AROUND RETIREMENT 17
Single men’s giving appears much more volatile over time compared to single women and married couples – measured by both likelihood and amount of giving. Single men’s giving fluctuates over the years of retirement, compared to single women and married couples, whose giving remains fairly stable as they move through the years after they retire.
Note: See notes to Figures 1-3 for how consumption, likelihood of giving, and amount of giving are measured. Volatility is measured as the standard deviation across the sample in question. No statistically significant differences between groups are found in consumption. The standard deviation of single men’s likelihood of giving is statistically significantly higher than that of both single women and married couples at the p < 0.01 level. The standard deviation of single men’s amount of giving is statistically significantly higher than that of single women at the p < 0.01 level, and that of married couples at the p < 0.1 level. See Methodology for further detail.
Figure 6: Volatility of Consumption, Likelihood of Giving, and Amount of Giving
Around Retirement, by Gender
$3,000
6%
$600
$3,500
7%
8%
9%
10%
$700
$800
$2,500
5%
$500$2,000
4%
$400
$1,500
3%$300
$1,000
2%$200
$5001% $100
$0 0% $0
Consumption Likelihood of Giving Amount of Giving
Single Women Single Men Married Couples

18 HOW WOMEN & MEN GIVE AROUND RETIREMENT
Finding 4: Around retirement, single women and married couples are more likely to volunteer, and their likelihood of volunteering is more stable, compared to single men.
Up to this point, findings have examined how single men, single women, and married couples give around retirement. Volunteering is another important measure of generosity and prosocial behavior. As people retire, they may have more time to spend volunteering for causes they care about. Figure 7 shows that volunteering trends around retirement are similar to trends for charitable giving. Specifically, single women and married couples maintain their volunteering rates after retirement, but single men are less likely to volunteer after they retire. Further, single women and married couples’ volunteering appears to be more stable after retirement compared to single men.
Figure 7: Trends in Likelihood of Volunteering Around Retirement, by Gender
Note: Volunteering incidences (percentages of households that volunteer, or likelihood of volunteering) are raw averages from PPS data. See Methodology for further detail.
35%
40%
45%
30%
25%
20%
15%
10%
5%
0%
-5 1-4 2-3 3-2 4-1 5
YEARS BEFORE AND AFTER RETIREMENT
PER
CEN
T O
F
HO
US
EHO
LDS
TH
AT V
OLU
NT
EER
RETIREMENT
Overall Single Women Single Men Married Couples
HOW WOMEN & MEN GIVE AROUND RETIREMENT 19
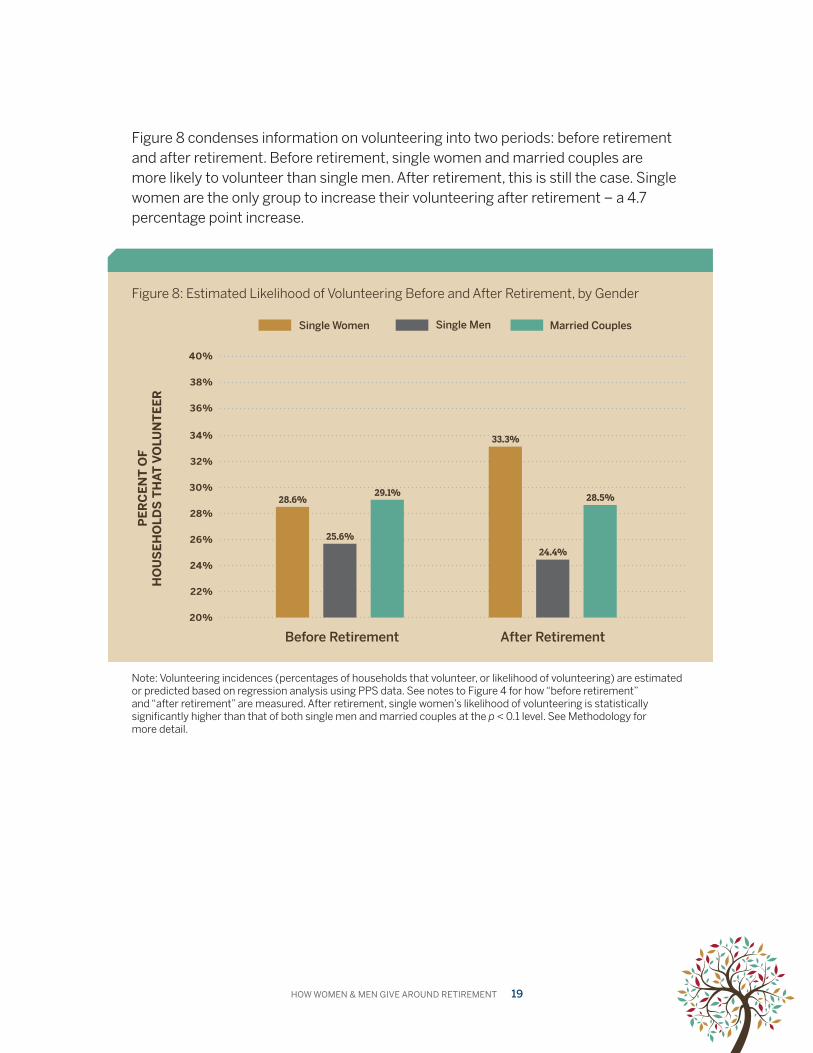
Note: Volunteering incidences (percentages of households that volunteer, or likelihood of volunteering) are estimated or predicted based on regression analysis using PPS data. See notes to Figure 4 for how “before retirement” and “after retirement” are measured. After retirement, single women’s likelihood of volunteering is statistically significantly higher than that of both single men and married couples at the p < 0.1 level. See Methodology for more detail.
Figure 8 condenses information on volunteering into two periods: before retirement and after retirement. Before retirement, single women and married couples are more likely to volunteer than single men. After retirement, this is still the case. Single women are the only group to increase their volunteering after retirement – a 4.7 percentage point increase.
Figure 8: Estimated Likelihood of Volunteering Before and After Retirement, by Gender
32%
34%
36%
38%
40%
30%
28%
26%
24%
22%
20%
Before Retirement After Retirement
28.6%
33.3%
25.6%24.4%
29.1% 28.5%
PER
CEN
T O
F
HO
US
EHO
LDS
TH
AT V
OLU
NT
EER
Single Women Single Men Married Couples

20 HOW WOMEN & MEN GIVE AROUND RETIREMENT
Note: See Figure 7 for how likelihood of volunteering is measured. See notes to Figure 6 for how volatility is measured. The standard deviation of single men’s likelihood of volunteering is statistically significantly higher than that of both single women and married couples at the p < 0.05 level. See Methodology for further detail.
Figure 9 displays the volatility of volunteering around retirement, using standard deviations. As in Figure 6, a higher bar indicates higher volatility. Figure 9 demonstrates that single men’s volunteering varies more widely than volunteering by single women or married couples.
Figure 9: Volatility of Likelihood of Volunteering Around Retirement, by Gender
12%
10%
8%
6%
4%
2%
0%
Single Women Single Men Married Couples

HOW WOMEN & MEN GIVE AROUND RETIREMENT 21
Discussion
Although both men and women maintain their charitable giving after retirement, differences emerge by gender and marital status. These differences are consistent with other research on how men’s and women’s patterns of giving and volunteering differ. Not only are single women and married couples more likely to give, and give higher amounts, than single men at this point in the life cycle, but their giving is also more stable than that of single men. Moreover, after retirement, single women and married couples are more likely to volunteer, and their pattern of volunteering is more stable than that of single men.
This study shows that how people address charitable giving later in life is a continuation of patterns established much earlier. For example, girls volunteer more than boys in childhood.36 Single women are more likely than single men to give, and give higher amounts, to charity.37 The frequency of parents’ giving matters more for adult daughters’ giving than for adult sons’ giving.38
Women also tend to spread out their charitable giving more than men and may be more constant in supporting organizations throughout their lives. Men tend to be more transactional in their giving, often responding to personal appeals and not engaging as deeply with the organizations they support. Women’s deeper engagement and loyalty to the causes they support may lead to more sustained giving, which helps explain their more stable levels of giving around retirement. Women’s and men’s life journeys may differ; women often assume more responsibility for parenting and caregiving along the journey, and women may have less in retirement savings. Despite this fact, charitable giving remains a high priority for women whether single or married.
Additionally, men and women approach retirement differently and with different resources. Most of the financial services industry literature finds that men are more confident they will have enough resources to live on during retirement. Concerns about outliving their resources are far less prevalent among men than women. Thus, it is unlikely that the volatility seen in men’s giving in this study emanates from fear, anxiety, stress, or conservative risk-taking. It is far more possible that ingrained patterns, social roles, and a different focus for retirement activities (e.g., travel, recreation) may help explain the uneven giving patterns.

22 HOW WOMEN & MEN GIVE AROUND RETIREMENT
This report cannot draw conclusions about why single men’s giving is more volatile than that of single or married women’s giving during retirement. Future research should explore this question further to test several potential reasons for this gender difference. One possibility is that women may be more strongly committed to giving and plan better for it prior to retirement. A second path to explore is the impact of women’s labor market experiences in preparation for retirement. Traditionally, men’s and women’s workforce experiences have differed in that men’s career patterns are more stable with progressive growth, and women’s reflect more of an “in and out” pattern due to child rearing and caring for aging parents. As a result, women may have more experience with transitions and how to navigate them – and thus be prepared to maintain their giving at and after retirement. A third area for consideration is the role of social networks that may encourage or induce giving such as engagement in giving circles or other interpersonal connections that prioritize charitable behavior. Finally, the concept of bequest giving cannot be ignored in a discussion about giving during retirement. The data used in this study do not factor in planned giving, and a deeper examination of how retirees plan to give from their assets upon death may provide a different picture of how men and women give at this point in life. Although these possibilities cannot be tested with the current methodology, further research may reveal additional factors that influence a more stable giving pattern around and during retirement.

HOW WOMEN & MEN GIVE AROUND RETIREMENT 23
Implications
In the United States, the number of people retiring today and the length of life after retirement is unprecedented. The retirement boom is impacting society widely, from issues regarding housing and health to finances and concerns around Social Security solvency. While these issues are addressed broadly in the media, less is known about how charitable giving changes around retirement. This report spotlights that one type of discretionary spending, charitable giving, continues around and during retirement, though men’s and women’s giving patterns differ.
Leveraging generosity around retirement
This research finds that both men and women retirees continue to be generous during their retirement, and are engaged in prosocial behavior through charitable giving and volunteering. As choices about how to make charitable gifts have expanded in recent years, retirees may be able to continue or augment their philanthropy more easily. The growth of donor-advised funds may be a game-changer that enables more people to give in and around retirement. One analysis finds that 38 percent of donor-advised fund donors are in the 41-60 age group and 55 percent are over 60. The average age when opening such an account is 55 and the current average donor age is 63.39 Among the many planned gift options, the IRA minimum distribution requirement at age 70½ may also encourage greater charitable giving by retirees and at the same time mitigate or eliminate the income tax on the withdrawal. These options may be more appealing to men, because men are more motivated than women by tax advantages.
Retirement is a process. People think about estate and bequest gifts many years before they retire. Studies have found that planned gifts are often made by current donors – often donors to the annual fund for ten years or more – who have a positive and ongoing relationship with the institution.40 The idea to make a planned gift begins around ages 45-50; about half of planned giving donors were between 51 and 70 at the time of their first gift, placing them close to or in retirement.41 Fundraisers seeking new planned giving donors should include retirees among their prospects and tailor the options to address men’s and women’s motivations and preferences for giving.
Men and women are donor prospects as they approach and enter retirement. Different fundraising strategies are needed to engage and cultivate donors during this life stage, as in all previous life stages. Knowing that women: live longer and are more likely to inherit; continue to be more likely to give and give more than men; and give in a more stable way than men, will help nonprofits design specific actions to

engage women for the long run. The upside of single men’s giving volatility around retirement is the potential to grow the organization’s donor pool and at the same time engage this population in meaningful activity. Research has shown that single men get a boost in life satisfaction when they make their first gift.42 Fundraisers might develop new opportunities to engage and steward prospective single men donors in ways that appeal to them. Unique volunteer experiences, special events connected to the organization’s mission, and opportunities to build their social networks are potential engagement strategies.
Will the gender differences in giving around retirement cited in this report continue over time? Evidence suggests that patterns around financial literacy may be shifting by gender and age.43 While men exhibit higher levels of financial literacy, a growing number of married Millennial women say they are the most financially knowledgeable person in their household. The financial literacy gap for Millennial women compared to Millennial men has narrowed over the years of the study, suggesting that Millennial women are taking more control of their financial lives. Should this trend continue and Millennial women’s increased financial literacy lead to deeper savings, they may write yet another new chapter in charitable giving as they enter retirement.
Philanthropy is a journey and donors engage with it in various ways throughout their lives. Fundraisers who recognize that gender matters in philanthropy and adjust their strategies accordingly will help grow the number of men and women philanthropists through consistent engagement and stewardship of donors throughout their life cycles. Volunteer opportunities that appeal to men and women – and also to their families – can deepen engagement, which can lead to more giving. Nonprofits may wish to expand volunteering and giving opportunities for donors as they reach retirement age. With better health and longer life expectancy than previous generations, today’s retirees are excellent candidates for annual, major, and planned gifts. This report affirms that retirement is a stop along a journey and not the end of charitable giving.
24 HOW WOMEN & MEN GIVE AROUND RETIREMENT

Methodology
The Data
The sample for this report is drawn from the Philanthropy Panel Study (PPS), the generosity module of the Panel Study of Income Dynamics (PSID). As part of the PSID, the PPS tracks the same families’ charitable giving biennially. To collect these data, the Indiana University Lilly Family School of Philanthropy partners with the University of Michigan’s Institute for Social Research, which directs the PSID. The present study uses all eight available waves or years of PPS data: 2001, 2003, 2005, 2007, 2009, 2011, 2013, and 2015. The full PPS data are used, comprising both the nationally representative Survey Research Center (SRC) sample as well as the low-income oversample. PSID family weights are applied in all analyses.
The Sample
The sample for the present study consists of individuals who were heads of households or partners of heads of households in at least one year of the study. The unit of observation is the individual, meaning that both heads of households and their partners are treated as individuals within the data set. For example, if a married couple consists of a retired husband but an employed wife, each of them counts as an “individual” within the data set. To test this methodology, multiple ways of considering households with a mixed retirement status were analyzed and results in the study were not affected.
To ensure a better target sample of those nearing or going through retirement, the sample is restricted to individuals at least 55 years old. The sample size for this study is 6,012 unique people, for whom data are available over multiple years for a total of N = 25,627 person-year observations. The sample ranges in age from 55 to 101, with an average age of 67.8. Note that because likelihood of giving and average giving amounts increase with age, the figures in this report are often higher than would be the case when analyzing giving by the larger population. Households in the sample had an average income of $75,250 and an average wealth of $463,964 (not including the value of their home).
The analyses largely compare single men, single women, and married couples. Cohabiting couples are included in the analyses but are not combined with married couples. This is because cohabiting couples make up a relatively small proportion of the sample for this study. Unlike for other age groups, in this 55+ sample, cohabiting couples behave differently than married couples in terms of charitable giving. While this may be an interesting avenue for future research, they are not highlighted in this report, as more work is needed to understand the differences this group exhibits. The table below provides additional demographic information about the sample.
HOW WOMEN & MEN GIVE AROUND RETIREMENT 25
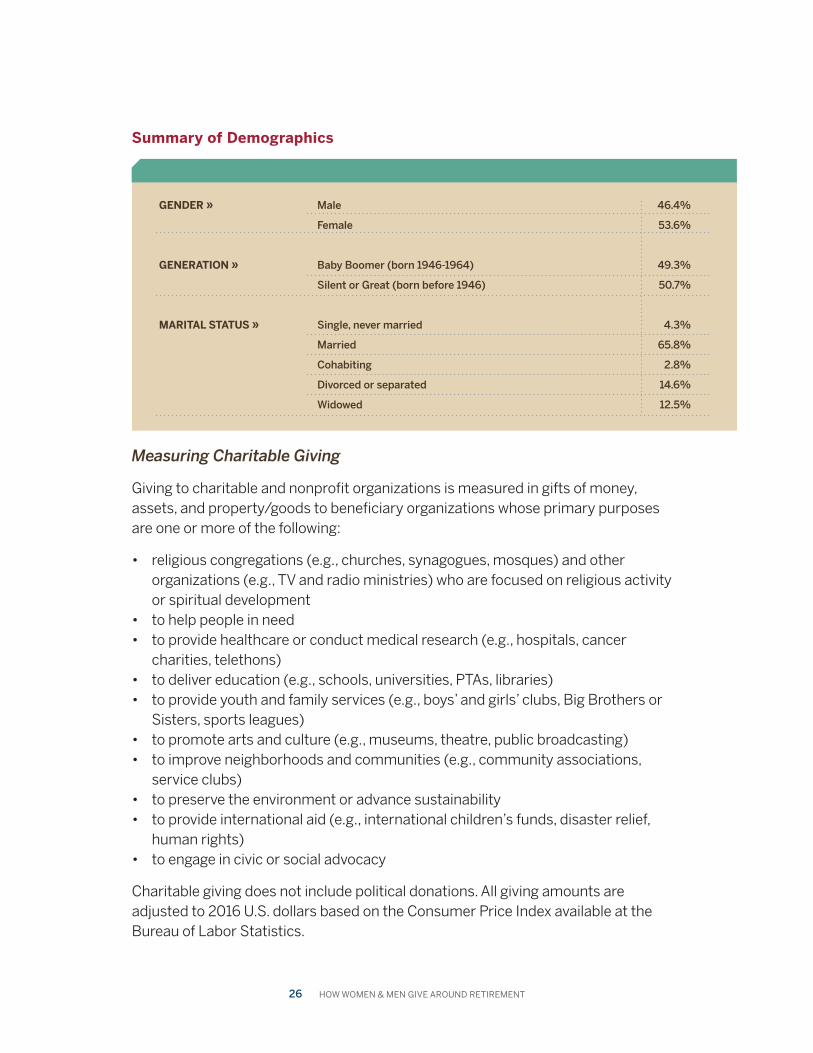
Measuring Charitable Giving
Giving to charitable and nonprofit organizations is measured in gifts of money, assets, and property/goods to beneficiary organizations whose primary purposes are one or more of the following:
• religious congregations (e.g., churches, synagogues, mosques) and other organizations (e.g., TV and radio ministries) who are focused on religious activity or spiritual development • to help people in need • to provide healthcare or conduct medical research (e.g., hospitals, cancer charities, telethons) • to deliver education (e.g., schools, universities, PTAs, libraries) • to provide youth and family services (e.g., boys’ and girls’ clubs, Big Brothers or Sisters, sports leagues) • to promote arts and culture (e.g., museums, theatre, public broadcasting) • to improve neighborhoods and communities (e.g., community associations, service clubs) • to preserve the environment or advance sustainability • to provide international aid (e.g., international children’s funds, disaster relief, human rights) • to engage in civic or social advocacy
Charitable giving does not include political donations. All giving amounts are adjusted to 2016 U.S. dollars based on the Consumer Price Index available at the Bureau of Labor Statistics.
26 HOW WOMEN & MEN GIVE AROUND RETIREMENT
Summary of Demographics
GENDER » Male 46.4%
Female 53.6%
GENERATION » Baby Boomer (born 1946-1964) 49.3%
Silent or Great (born before 1946) 50.7%
MARITAL STATUS » Single, never married 4.3%
Married 65.8%
Cohabiting 2.8%
Divorced or separated 14.6%
Widowed 12.5%

Measuring Retirement
In each wave of data, respondents indicate whether they were retired at the time of the interview, and also provide the year they were first retired. This information allows for observation of both the timing and dynamics of retirement over a number of years, thanks to the longitudinal nature of the PPS data. For the present study, in addition to the usual cross-sectional binary definition of retirement (i.e., retired or not retired), four types or stages of retirement were used: never retired, always retired, in the transition year before retirement, and in the transition year after retirement.
• Those defined as never retired did not report being retired in any waves of the PPS, and did not provide a value for “year retired.” These individuals made up 24.4 percent of the observations in this data set.
• Those defined as always retired reported being retired in the first available wave of the PPS, and all following waves within the study period. These individuals made up 21.3 percent of the observations in this data set.
• Those in the transition year before retirement did not report being retired in the current PPS wave, but reported being retired during the subsequent wave of data. These individuals made up 28.8 percent of the observations in this data set.
• Those in the transition year after retirement reported being retired in the current PPS wave, but had not reported being retired during the previous wave of data. These individuals made up 25.4 percent of the observations in this data set.
In addition to the types of retirement defined above, the present study frequently discusses years of retirement. This measure is available for any individual in the sample who, in any wave of the PPS, reported a year of retirement. When the measure is negative, it indicates a number of years prior to first retirement. Figures in this report that depict trends over time display five years of data before and five years after retirement. To ensure findings are accurate and robust, analysis was conducted of other windows of time (up to six years before retirement and up to ten years after retirement). All findings are displayed in this report in the five-year pre- and post-retirement windows for consistency, but findings were consistent regardless of the time window used.
HOW WOMEN & MEN GIVE AROUND RETIREMENT 27
Statistical Methods
Most findings are derived using regression analysis; all such analyses use a pooled Ordinary Least Squares model. For these analyses, in addition to variables that measure retirement, the following characteristics were included as statistical controls:
• Age cohorts of individuals • Gender and marital status category (i.e., single women, single men, married couple, cohabiting couple) • Race/ethnicity of individuals • Self-reported health status of individuals • Number of children (including birth children and/or adopted and foster children) in household • Education indicator variables (i.e., high school, college) • Log of real household income (converted to 2014 U.S. dollars) • Log of real household wealth excluding housing value (converted to 2014 U.S. dollars) • Year and state indicator variables
In all regression analyses, standard errors are clustered at the individual level. After each regression, predicted margins were computed for each subgroup and compared with summary statistics.
Some findings refer to volatility of giving and volunteering. Unlike other findings that rely on regression analysis, volatility of giving and volunteering around retirement is measured using the average standard deviation. Statistical significance of these standard deviations is tested using standard two-sample t-tests with unequal variance.
This study refers to some results as being statistically significant. Statistical significance is a term used to describe results that are unlikely to have occurred by chance. Significance is a statistical term that states the level of certainty that a difference or relationship exists. In the present study, results are described as being statistically significant if there was less than a 1, 5, or 10 percent probability that the result obtained was due to chance. Specific significance levels are described in individual findings and figures.
28 HOW WOMEN & MEN GIVE AROUND RETIREMENT
References
1 Cohn, D., & Taylor, P. (2010). Baby Boomers Approach 65 – Glumly. Pew Research Center. Retrieved from http://www.pewsocialtrends.org/2010/12/20/baby-boomers-approach-65-glumly/; Mather, M., Jacobsen, L. A., & Pollard, K. M. (2016). Aging in the United States. Population Reference Bureau. Retrieved from: https://www.prb.org/wp-content/uploads/2016/01/aging-us-population-bulletin-1.pdf
2 Burke, A. (2017). 10 facts about American women in the workforce. Brookings. Retrieved from https://www.brookings.edu/blog/brookings-now/2017/12/05/10-facts-about-american-women-in-the-workforce/; Mathur, A. (2016). Forget The Gender Pay Gap, Look At The Gender Labor Force Participation Gap. Forbes. Retrieved from https://www.forbes.com/sites/aparnamathur/2016/03/28/forget-the-gender-pay-gap-look-at-the-gender-labor-force-participation-gap/
3 Arias, E., Heron, M., & Xu, J. Q. (2017). United States Life Tables, 2014. National Vital Statistics Reports, 66(4). Hyattsville, MD: National Center for Health Statistics. Retrieved from https://www.cdc.gov/nchs/data/nvsr/nvsr66/nvsr66_04.pdf
4 Munnell, A. H. (2017). Why the average retirement age is rising. MarketWatch. Retrieved from: https://www.marketwatch.com/story/why-the-average-retirement-age-is-rising-2017-10-09; National Center for Health Statistics. (2017). Health, United States, 2016: With Chartbook on Long-term Trends in Health. Hyattsville, MD. Retrieved from https://www.cdc.gov/nchs/data/hus/hus16.pdf
5 U.S. Department of Health and Human Services. (2018). 2017 Profile of Older Americans. Administration on Aging (AOA), Administration for Community Living (ACL). Retrieved from https://www.acl.gov/sites/default/files/Aging%20and%20Disability%20in%20America/2017OlderAmericansProfile.pdf
6 Dimock, M. (2018). Defining generations: Where Millennials end and post-Millennials begin. Pew Research Center. Retrieved from http://www.pewresearch.org/fact-tank/2018/03/01/defining-generations-where-millennials-end-and-post-millennials-begin/; Fry, R. (2018). Millennials projected to overtake Baby Boomers as America’s largest generation. Pew Research Center. Retrieved from http://www.pewresearch.org/fact-tank/2018/03/01/millennials-overtake-baby-boomers/; Reinberg, S. (2014). Americans Living Longer Than Ever: CDC. HealthDay News. Retrieved from https://consumer.healthday.com/senior-citizen-information-31/age-health-news-7/americans-living-longer-than-ever-cdc-683595.html; USC Leonard Davis School of Gerontology. (2014). Infographics: Americans Are Living Longer. University of Southern California Leonard Davis School of Gerontology. Retrieved from https://gerontology.usc.edu/resources/infographics/americans-are-living-longer/
7 Maestas, N., Mullen, K. J., Powell, D., von Wachter, T., & Wenger, J. B. (2017). Working Conditions in the United States: Results of the 2015 American Working Conditions Survey. Santa Monica, CA: RAND Corporation. Retrieved from https://www.rand.org/pubs/research_reports/RR2014.html
8 Dorn, D., & Sousa-Poza, A. (2010). ‘Voluntary’ and ‘involuntary’ early retirement: an international analysis. Applied Economics, 42 (4), 427-438; Garabato, N. (2016). Why Workers Retire When They Do: A Survey of U.S. Retirees. Willis Towers Watson. Retrieved from https://www.towerswatson.com/en-US/Insights/Newsletters/Americas/insider/2016/01/why-workers-retire-when-they-do-a-survey-of-u-s-retirees; Tanner, S. (1998). The dynamics of male retirement behaviour. Fiscal Studies, 19(2), 175-196.
9 Love, J. (2010). Approaching 65: A Survey of Baby Boomers Turning 65 Years Old. Washington, DC: AARP Research & Strategic Analysis, p. 2. Retrieved from https://assets.aarp.org/rgcenter/general/approaching-65.pdf
10 Gibson, W. E. (2018). Men, Women Differ on Retirement Savings Priority. AARP. Retrieved from https://www.aarp.org/retirement/retirement-savings/info-2018/men-women-retirement-spending-fd.html
11 Teachers Insurance and Annuity Association of America-College Retirement Equities Fund (TIAA). (2016). Voices of Experience 2016: Insights on Life in Retirement. New York, NY. Retrieved from https://www.tiaa.org/public/pdf/C30785_voices_of_experience_survey_findings_final.pdf
12 Collinson, C. (2018). Here and Now: How Women Can Take Control of Their Retirement. Transamerica Center for Retirement Studies, Transamerica Institute. Retrieved from http://www.transamericacenter.org/docs/default-source/women-and-retirement/tcrs2018_sr_women_take_control_of_retirement.pdf
HOW WOMEN & MEN GIVE AROUND RETIREMENT 29
13 Brown, E., Mesch, D. J., & Hayat, A. D. (2016). Life expectancy and the search for a bag lady effect in charitable giving. Nonprofit and Voluntary Sector Quarterly, 45(3), 630-645; Mesch, D. (2012). Women Give 2012: New Research about Women and Giving. Indianapolis, IN: Women’s Philanthropy Institute, Indiana University Lilly Family School of Philanthropy. Retrieved from https://scholarworks.iupui.edu/handle/1805/6339
14 Lake, R. (2018). How Women Can Combat Their Greatest Retirement Risk. Prudential Financial, Inc. Retrieved from https://www.prudential.com/financial-education/living-longer-women-retirement
15 TIAA (2016).
16 Allianz Life Insurance Company of North America & Allianz Life Insurance Company of New York (Allianz). (2016). The Allianz Women, Money, and Power® Study: Empowered and Underserved. Retrieved from https://www.allianzlife.com/-/media/files/allianz/documents/ent_1462_n.pdf?la=en&hash=2955C0DCE4F0BCC290A41345D5C0FBF36D87F976
17 TIAA (2016).
18 Neelakantan, U., & Chang, Y. (2010). Gender differences in wealth at retirement. American Economic Review, 100(2), 362-67; Watson, J., & McNaughton, M. (2007). Gender differences in risk aversion and expected retirement benefits. Financial Analysts Journal, 63(4), 52-62.
19 Bütikofer, A., Lewbel, A., & Seitz, S. (2010). Health and retirement effects in a collective consumption model of elderly households. Boston College.
20 Modigliani, F., & Brumberg, R. (1954). Utility analysis and the consumption function: An interpretation of cross-section data. Franco Modigliani, 1, 388-436.
21 Banks, J., Blundell, R., & Tanner, S. (1998). Is there a Retirement-Savings Puzzle? American Economic Review, 88(4): 769–788; Bernheim, B. D., Skinner, J., & Weinberg, S. (2001). What accounts for the variation in retirement wealth among U.S. households? American Economic Review, 91(4), 832-857; Haider, S. J., & Stephens Jr., M. (2007). Is there a retirement-consumption puzzle? Evidence using subjective retirement expectations. The Review of Economics and Statistics, 89(2), 247-264; Hurd, M. D., & Rohwedder, S. (2008). The retirement consumption puzzle: actual spending change in panel data (No. w13929). National Bureau of Economic Research.
22 See for example: Banks et al. (1998); Bernheim et al. (2001); Hamermesh, D. S. (1984). Life cycle effects on consumption and retirement. Journal of Labor Economics, 2(3), 353-370; Mariger, R. P. (1987). A Life Cycle Consumption Model with Liquidity Constraints: Theory and Empirical Results. Econometrica, 55(3), 533-557.
23 Hurd, M. S., & Rohwedder, S. (2013). Heterogeneity in spending change at retirement. The Journal of the Economics of Ageing, 1-2, 60-71 Retrieved from https://doi.org/10.1016/j.jeoa.2013.09.002
24 Browning, C., Guo, T., & Cheng, Y. (2014). The Retirement Consumption Gap: Evidence from the HRS. Social Science Research Network (SSRN) database. Retrieved from https://papers.ssrn.com/sol3/papers.cfm?abstract_id=2479021
25 Browning et al. (2014).
26 De Nardi, M., French, E., & Jones, J. B. (2016). Savings after retirement: A survey. Annual Review of Economics, 8, 177-204.
27 Pew Research Center. (2011). Angry Silents, Disengaged Millennials: The Generation Gap and the 2012 Election. Retrieved from http://assets.pewresearch.org/wp-content/uploads/sites/5/legacy-pdf/11-3-11%20Generations%20Release.pdf
28 Casselman, B. (2014). What Baby Boomers’ Retirement Means For the U.S. Economy. FiveThirtyEight. Retrieved from https://fivethirtyeight.com/features/what-baby-boomers-retirement-means-for-the-u-s-economy
29 Mesch, D. J. (2010). Women Give 2010: New Research about Women and Giving. Indianapolis, IN: Women’s Philanthropy Institute, Center on Philanthropy at Indiana University. Retrieved from https://scholarworks.iupui.edu/handle/1805/6337
30 HOW WOMEN & MEN GIVE AROUND RETIREMENT

30 Mesch, D., Osili, U., Ackerman, J., & Dale, E. (2015a). How and Why Women Give: Current and Future Directions for Research on Women’s Philanthropy. Indianapolis, IN: Women’s Philanthropy Institute, Indiana University Lilly Family School of Philanthropy. Retrieved from https://scholarworks.iupui.edu/handle/1805/6983
31 Andreoni, J., Brown, E., & Rischall, I. (2003). Charitable giving by married couples: Who decides and why does it matter? Journal of Human Resources, 38(1), 111-133; Mesch et al. (2015a).
32 Mesch et al. (2015a); Mesch, D., Osili, U., Ackerman, J., & Dale, E. (2015b). Do Women Give More? Findings from Three Unique Data Sets on Charitable Giving. Indianapolis, IN: Women’s Philanthropy Institute, Indiana University Lilly Family School of Philanthropy. Retrieved from https://scholarworks.iupui.edu/handle/1805/6984
33 Mesch (2012).
34 Mesch, D., Ottoni-Wilhelm, M., Osili, U., Han, X., Pactor, A., & Ackerman, J. (2016). Women Give 2016: Giving in Young Adulthood: Gender Differences and Changing Patterns Across the Generations. Indianapolis, IN: Women’s Philanthropy Institute, Indiana University Lilly Family School of Philanthropy. Retrieved from https://scholarworks.iupui.edu/handle/1805/11446
35 Mesch et al. (2015a, 2015b); Mesch, (2010).
36 Mesch, D., Osili, U., Hayat, A., Ottoni-Wilhelm, M., Zhang, Y., & Pactor, A. (2013). Women Give 2013: New Research on Charitable Giving by Boys and Girls. Indianapolis, IN: Women’s Philanthropy Institute, Indiana University Lilly Family School of Philanthropy. Retrieved from https://scholarworks.iupui.edu/handle/1805/6340
37 Mesch (2010).
38 Mesch, D., Osili, U., Okten, C., Han, X., Pactor, A., & Ackerman, J. (2017). Women Give 2017: Charitable Giving & Life Satisfaction: Does Gender Matter? Indianapolis, IN: Women’s Philanthropy Institute, Indiana University Lilly Family School of Philanthropy. Retrieved from https://scholarworks.iupui.edu/handle/1805/14283
39 Fidelity Charitable. (2017). 2017 Fidelity Charitable Giving Report. Retrieved from https://www.fidelitycharitable.org/docs/giving-report-2017.pdf
40 Regenovich, D. (2016). Establishing a Planned Giving Program. In Tempel, E. R., Seiler, T. L., & Burlingame, D. F. (Eds.) Achieving Excellence in Fundraising (4th Edition). (pp.259-289). Hoboken, NJ: John Wiley & Sons.
41 Osili, U., Kou, X., Bergdoll, J., St. Claire, M., & Yang, L. (2016). The 2016 Planned Giving Study: Building Lasting Legacies: New Insights from Data on Planned Gifts. Indianapolis, IN: Indiana University Lilly Family School of Philanthropy. Retrieved from https://scholarworks.iupui.edu/handle/1805/11006
42 Mesch et al. (2016).
43 Mottola, G. (2018). Gender, Generation and Financial Knowledge: A Six-Year Perspective. Insights: Financial Capability. Washington, DC: FINRA Investor Education Foundation. Retrieved from http://www.usfinancialcapability.org/downloads/Issue-Brief-Gender-Generation-and-Financial-Knowledge-A-Six-Year-Perspective.pdf
HOW WOMEN & MEN GIVE AROUND RETIREMENT 31
301 University Boulevard, Suite 3000 Indianapolis, IN 46202-3272 317-278-8990 [email protected]
@WPIinsights #womensphilanthropy