arm presentation for jpm 2006 final...
TRANSCRIPT
2
This presentation contains statements relating to future results of the company (including certain projections and business trends) that are “forward-looking statements” as defined in the Private Securities Litigation Reform Act of 1995. Forward-looking statements are typically identified by words or phrases such as “believe,” “expect,” “anticipate,” “estimate,” “should,” “are likely to be,” “will” and similar expressions. Actual results may differ materially from those projected as a result of certain risks and uncertainties, including but not limited to global economic and market cycles and conditions; the demand for commercial, specialty and light vehicles for which the company supplies products; risks inherent in operating abroad (including foreign currency exchange rates and potential disruption of production and supply due to terrorist attacks or acts of aggression); availability and cost of raw materials, including steel; OEM program delays; demand for and market acceptance of new and existing products; successful development of new products; reliance on major OEM customers; labor relations of the company, its suppliers and customers, including potential disruptions in supply of parts to our facilities or demand for our products due to work stoppages; the financial condition of the company’s suppliers and customers, including potential bankruptcies; possible adverse effects of any future suspension of normal trade credit terms by our suppliers; potential difficulties competing with companies that have avoided their existing contracts in bankruptcy and reorganization proceedings; successful integration of acquired or merged businesses; the ability to achieve the expected annual savings and synergies from past and future business combinations and the ability to achieve the expected benefits of restructuring actions; success and timing of potential divestitures; potential impairment of long-lived assets, including goodwill; competitive product and pricing pressures; the amount of the company’s debt; the ability of the company to continue to comply with covenants in its financing agreements; the ability of the company to access capital markets; credit ratings of the company’s debt; the outcome of existing and any future legal proceedings, including any litigation with respect to environmental or asbestos-related matters; rising costs of pension and other post-retirement benefits and possible changes in pension and other accounting rules; as well as other risks and uncertainties, including but not limited to those detailed herein and from time to time in other filings of the company with the SEC. These forward-looking statements are made only as of the date hereof, and the company undertakes no obligation to update or revise the forward-looking statements, whether as a result of new information, future events or otherwise, except as otherwise required by law.
Forward-Looking Statements
3
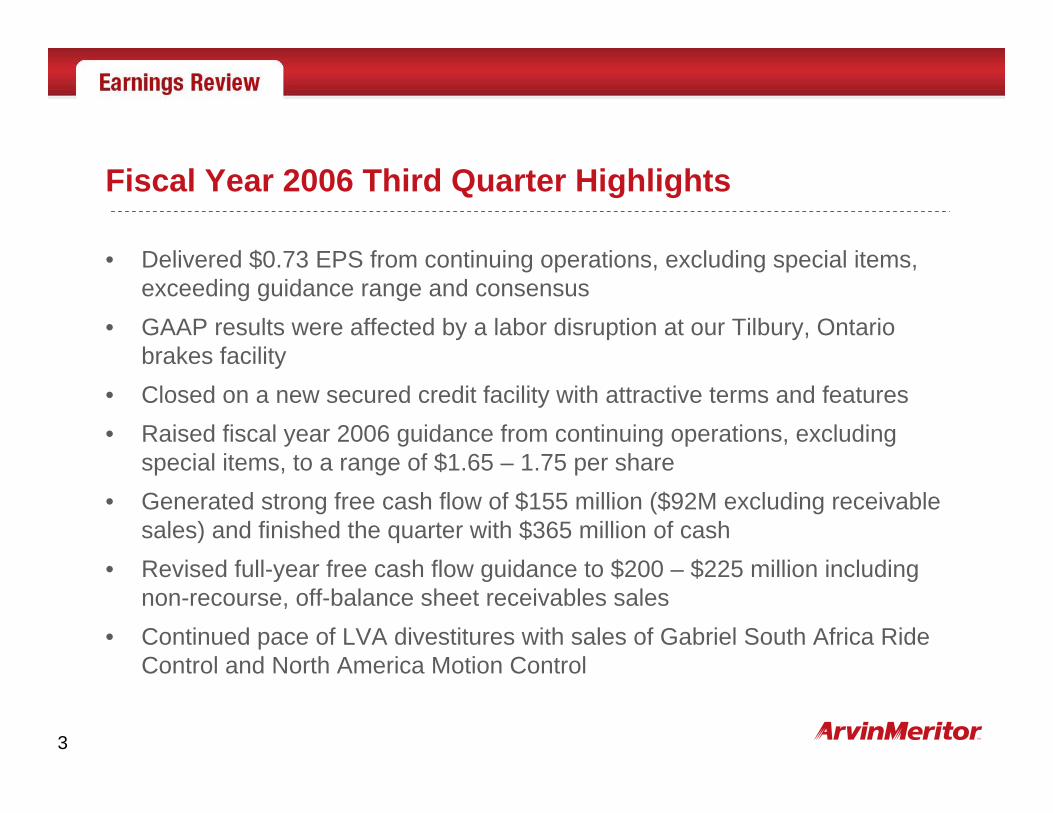
Fiscal Year 2006 Third Quarter Highlights
• Delivered $0.73 EPS from continuing operations, excluding special items, exceeding guidance range and consensus
• GAAP results were affected by a labor disruption at our Tilbury, Ontario brakes facility
• Closed on a new secured credit facility with attractive terms and features• Raised fiscal year 2006 guidance from continuing operations, excluding
special items, to a range of $1.65 – 1.75 per share• Generated strong free cash flow of $155 million ($92M excluding receivable
sales) and finished the quarter with $365 million of cash • Revised full-year free cash flow guidance to $200 – $225 million including
non-recourse, off-balance sheet receivables sales• Continued pace of LVA divestitures with sales of Gabriel South Africa Ride
Control and North America Motion Control

4
pts(0.5)4.1%3.6%Total Operating Margins pts(0.5)4.2%3.7%Segment Operating Margin pts(1.3)6.5%5.2%Commercial Vehicle Systems pts0.3 2.1%2.4%Light Vehicle Systems
Operating Margins
-10%$ (10)$ 98 $ 88 Operating Income (2)(2)(4)Other Unallocated Costs
-8%(8)100 92 Segment Operating Income -18%(13)73 60 Commercial Vehicle Systems 19%$ 5 $ 27 $ 32 Light Vehicle Systems
Operating Income % $ 2005 2006
Better/(Worse) Quarter Ended June 30, (in millions)
Segment Operating IncomeBefore Special Items (1)
(1) See Slide 20 – “Non-GAAP Financial Information”

5
Balance Sheet Strengthening
61%59%
63%
2003 2004 2005 2006 E
$561
$469
$659
2003 2004 2005 2006 E
$299
$948
$696
2003 2004 2005 2006 E
$1,647
$1,354 $1,378
2003 2004 2005 2006 E
Debt-to-capitalization ratio
Unfunded pension liability(millions)
Term debt due within 5 years(millions)
Net debt (1)
(millions)
(1) Excludes any potential divestiture proceeds
$980

6
FY 2006 Outlook –Continuing Operations Before Special Items
(in millions, except EPS)
Sales 9,000$ - 9,100$
Operating Margin 2.9% - 3.0%
Interest Expense (125) - (124)Effective Tax Rate 24% - 23%
Income from Continuing Operations 116$ - 123$
Diluted Earnings Per Share 1.65$ - 1.75$
Free Cash Flow (Total Company) 200$ - 225$
Full Year Outlook (1)FY 2006
(1) Outlook does not include the impact of any future acquisitions or divestitures, the impact of additional restructuring actions and any other special items.

7
FY 2006 Fourth Quarter Outlook –Continuing Operations Before Special Items
(in millions, except EPS)
Sales 2,100$ - 2,200$
Operating Margin 2.7% - 3.0% (2)
Interest Expense (30) - (29)
Effective Tax Rate 24% - 24%
Income from Continuing Operations 25$ - 32$
Diluted Earnings Per Share 0.36$ - 0.46$
Fourth Quarter Outlook (1)FY 2006
(1) Outlook does not include the impact of any future acquisitions or divestitures, the impact of additional restructuring actions and any other special items.
(2) CVS margin higher than Q3 (>5.3%)
8
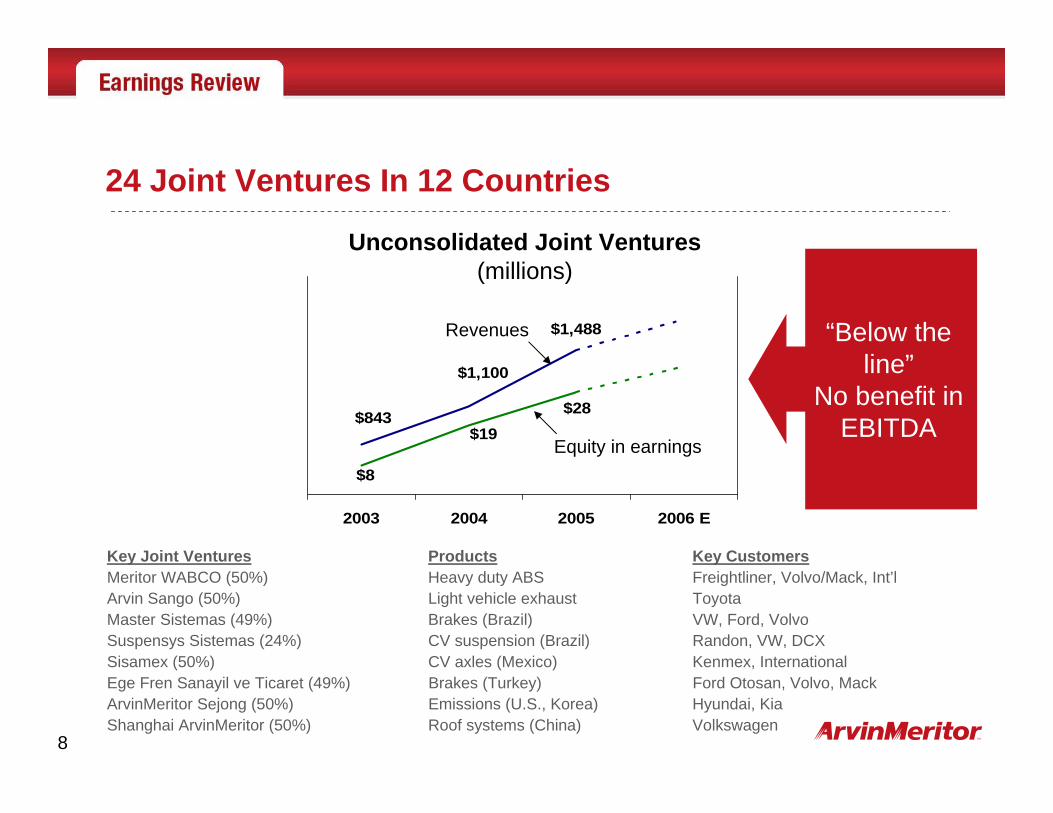
Key Joint Ventures Products Key CustomersMeritor WABCO (50%) Heavy duty ABS Freightliner, Volvo/Mack, Int’lArvin Sango (50%) Light vehicle exhaust ToyotaMaster Sistemas (49%) Brakes (Brazil) VW, Ford, VolvoSuspensys Sistemas (24%) CV suspension (Brazil) Randon, VW, DCXSisamex (50%) CV axles (Mexico) Kenmex, InternationalEge Fren Sanayil ve Ticaret (49%) Brakes (Turkey) Ford Otosan, Volvo, MackArvinMeritor Sejong (50%) Emissions (U.S., Korea) Hyundai, KiaShanghai ArvinMeritor (50%) Roof systems (China) Volkswagen
$1,488
$1,100
$843 $28$19
$8
2003 2004 2005 2006 E
Revenues
Equity in earnings
Unconsolidated Joint Ventures (millions)
24 Joint Ventures In 12 Countries
“Below theline”
No benefit inEBITDA

9
U.S./Canada
Asia/Other
Europe
Footprint Evolution Including JVs - FY 2005 - 2007Region Facilities Closed/Exited Facilities Opened
Greenfield, IN (Coil Coating – 2005) Belvidere, IL (Suspension Modules – 2005)Kingsbury, IN (Coil Coating – 2005) Fort Deposit, AL (Exhaust – 2005)Hawesville, KY (Coil Coating – 2005) Montgomery, AL (Doors – 2005)Weirton, WV (Coil Coating – 2005)Columbus, IN (Exhaust – 2005) Pulaski, TN (Shock Absorbers – 2006)Cleveland, OH (Parts Dist. – 2006)Fayetteville, NC (Filters – 2006)Marion, SC (Motion Control – 2006)Hopkinsville, KY (Suspension – 2006)Chatham, ON (Suspension – 2006)Milton, ON (Suspension – 2006)
Augsburg, Germany #2 & 3 (Exhaust – 2005) St. Priest, France (Axles – 2005)Valladolid, Spain (Doors – 2005) Venisseux, France (Axles – 2005)Villaverde, Spain CVC (Exhaust – 2005) Poznan, Poland (Doors – 2005)Asti, Italy (LV Ride Control – 2005) Bratislava, Slovakia (Roofs – 2005)Sheffield, UK (Suspension – 2006) Eastern Europe (LVS – Soon to be announced)Mosciano, Italy (Exhaust – 2006) Eastern Europe (LVS – Soon to be announced)Redditch UK (Exhaust – 2006)Wrexham, UK (Trailers – 2006)Joigny, France (Exhaust – 2006)Birmingham, UK (Doors/Roofs – 2006)Blackpool, UK (Exhaust – 2007)
Cambui, Brazil (Exhaust – 2005) Shanghai ArvinMeritor (Roofs – 2005)Ga-Rankuwa, S. Africa (Exhaust – 2005) Changchun, China (Brakes – 2005)Cape Town, South Africa (Ride Control – 2006) Anting Shanghai, China (Exhaust – 2005)Thomastown, Australia (Doors – 2006) Yantai, China (Exhaust – 2005)
Pu Dong, China CVC (Exhaust – 2005)Choongnam, Korea (Exhaust – 2005)Xuzhou, China (Axle – 2006)India (LVS – Soon to be announced)Wuxi, China (Axles – 2006)Monterrey, Mexico (CVA Distribution – 2006)
Excludes Chennai, India, new state of the art facility replaced previous plant
New

10
In ProcessLVA Europe
$9 millionSoldEquity share in Purolator India
In ProcessN.A. Ride Control
Close 4QAnnouncedS. Africa Ride Control
SoldN.A. Purolator filters
SoldN.A. Exhaust
Announced LVS MSSC suspension components
Close 4QAnnouncedN.A. Motion Control
$39 millionSoldCVS Off-Highway Brakes
ProceedsStatus
Divestiture Status
$198 million

11
Question #1: Please explain your various programs for the sale of receivables.
• U.S. accounts receivable securitization is included in short-term debt• European programs are off-balance sheet and non-recourse – the ultimate
working capital improvement• Levels of funding through these programs depend on cash needs• We are working on additional accounts receivable programs outside the U.S.
$ 465$ 179$ 105$ 63Total21513310563Sub-total off-balance sheet
90735050European factoring125605513European securitization
$ 250$ 46$ -$ -U.S. on-balance sheet
ProgramSizeJune 30YTDQ3
BalanceFCF Impact(in millions)

12
Question #2: What was your working capital change without the sale of receivables?
10563Off-balance sheet receivable sales$ 202$ 155Total free cash flow (1)
740Change in working capital
$ 90$ 52Sub-total before working capital2022Timing differences and other
(28)(5)Gain on Divestitures(110)(31)Capital Expenditures12541Depreciation and Amortization
$ 83$ 25Income from Continuing Operations(in millions) Q3 Nine Months
(1) See Slide 20 – “Non-GAAP Financial Information”

13
Question #3: What factors caused CVS to be down year-over-year, even excluding the Tilbury disruption?
602006 Q3 operating income (1)
6Productivity, pricing, restructuring and other(4)Dispositions(8)Warranty costs(7)Higher retiree costs732005 Q3 operating income (1)
CVS(in millions)
$
$
(1) Continuing operations, before special items

14
Stainless steel:• Significant upward pressure seen in stainless market prices• Annual buy of about 160K tons, almost all in LVS• Long-term contracts, generally 12 months • We have already been paying some surcharges for nickel,
chromium and molybdenum• Customer recoveries have been and will continue to be a partial
offset
Other commodities:• Moderate upward pressure on prices of other types of steel• Upward pressure on prices of other metals, paint and energy• Customer recoveries have been and will continue to be a partial
offset
Question #4: Are you at risk of a major re-pricing of stainless steel contracts?

15
• In any quarter, taxes at statutory rates will be reduced by various ongoing credits and deductions
• Expenses from the Tilbury disruption reduced full-year income, reducing the full-year effective rate
• Q3 included adjustment to income taxes recorded in Q1 and Q2 at the higher anticipated effective rate
• There may be some opportunity in our full-year rate
Question #5: How do you arrive at a 0% tax rate for the third quarter?

16
ProductivityLVS Sales Per Employee
(000)CVS Sales Per Employee
(000)
$0
$100
$200
$300
$400
$500
2003 2004 2005 2006$0
$100
$200
$300
$400
$500
2003 2004 2005 2006
Per Permanent Employee
Per Employee
LVS improvement due to benefits of restructuring actions and ongoing incremental efficiency gains
CVS improvement due to record truck production, but at higher-than-optimal levels

17
Quality
LVS CVS
568
68
744
55
Q3 2005 Q3 2006
420
169 180114
Q3 2005 Q3 2006
19%Improve-
ment
93%“Filtered
Out”
32%Improve-
ment
37%“Filtered
Out”
= Supplier PPM = Customer PPM
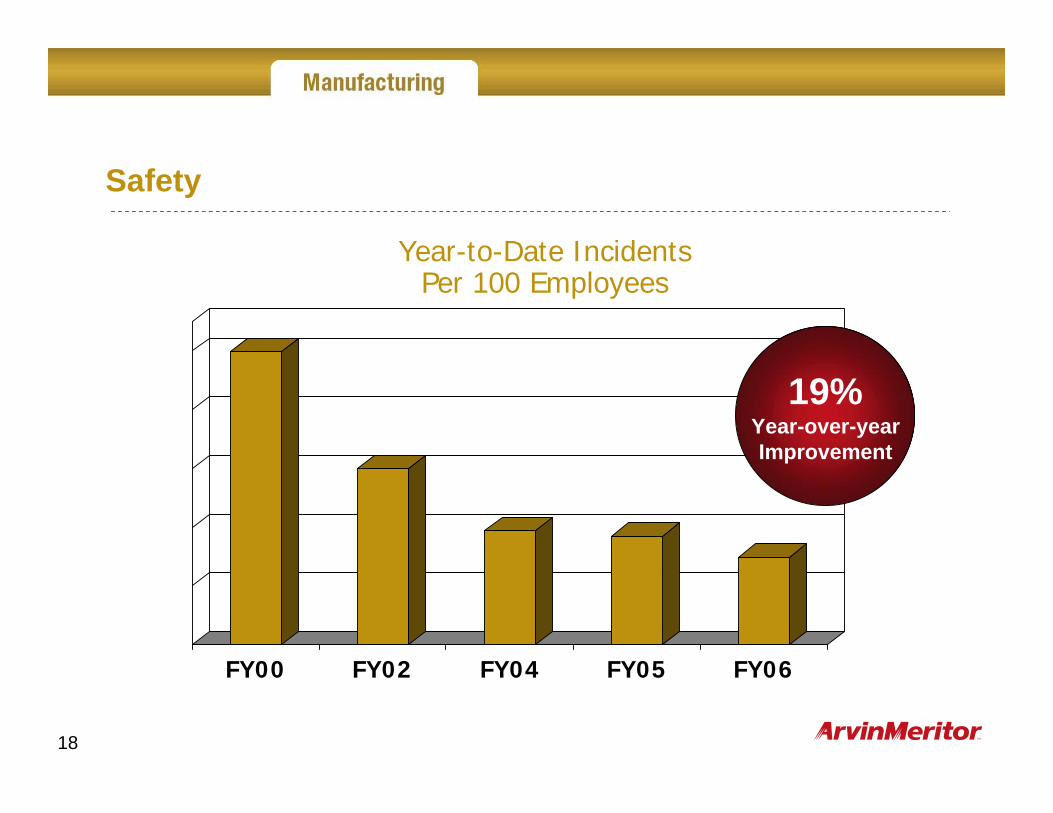
18
Safety
FY00 FY02 FY04 FY05 FY06
Year-to-Date Incidents Per 100 Employees
19%Year-over-yearImprovement

19
Executing Actions to ImproveShort- and Long-Term Financial Outlook
• Continue to lower cost structure through restructuring efforts, increased productivity and Leading Cost-Competitive Country (LCCC) sourcing
• Strengthening technology and R&D to improve competitive positionand value to customers
• Control capital allocation with majority going to low-cost countries• Manage customer mix – factor risks into quotes• Refuse unprofitable programs• Avoid low-value add programs• Drive material recovery strategies• Collaborate and partner as appropriate• Continue to evaluate business mix strategically• Manage for 2007 downturn in N.A. trucks

20
Use of Non-GAAP Financial Information
In addition to the results reported in accordance with accounting principles generally accepted in the United States (“GAAP”) included throughout this presentation, the Company has provided information regarding income from continuing operations, diluted earnings per share and segment operating income and margins before special items, which are non-GAAP financial measures. These non-GAAP measures are defined as reported income or loss from continuing operations, reported diluted earnings or loss per share and segment operating income plus or minus special items. Other non-GAAP financial measures include “net debt” and “free cash flow”. Net debt is defined as total debt less the fair value adjustment of notes due to interest rate swaps, less cash. Free cash flow represents net cash provided by operating activities less capital expenditures.
Management believes that the non-GAAP financial measures used in this presentation are useful to both management and investors in their analysis of the Company’s financial position and results of operations. In particular, management believes that net debt is an important indicator of the Company’s overall leverage and free cash flow is useful in analyzing the Company’s ability to service and repay its debt. Further, management uses these non-GAAP measures for planning and forecasting in future periods.
These non-GAAP measures should not be considered a substitute for the reported results prepared in accordance with GAAP. Neither net debt nor free cash flow should be considered substitutes for debt, cash provided by operating activities or other balance sheet or cash flow statement data prepared in accordance with GAAP or as a measure of financial position or liquidity. In addition, the calculation of free cash flow does not reflect cash used to service debt and thus, does not reflect funds available for investment or other discretionary uses. These non-GAAP financial measures, as determined and presented by the Company, may not be comparable to related or similarly titled measures reported by other companies.
Non-GAAP measures displayed in this presentation are reconciled to their nearest equivalent GAAP measures in the company’s fiscal 2006 third quarter earnings presentation and other materials available at www.arvinmeritor.com.

www.arvinmeritor.com