arlington county solids master plan
TRANSCRIPT

Solids Master Plan Briefing October 27, 2016

Meeting Agenda
• Review of Project/Stakeholder Meeting Role
• Update on Master Plan: Evaluating Technologies
• Financial Planning/Budgeting Process
• Next Steps
• Questions and Answers

Review of Project/Stakeholder
Role

Stakeholder Group Role
To engage in the master plan process – by meeting
quarterly with staff – to understand the need for the plan,
the approach, decisions made/how/why, and impacts to
Arlington community.
To report to representative groups what is learned, and
relay questions and concerns back to staff so they may be
adequately be addressed in a timely fashion.
To provide input throughout the process for better
decision making by the staff, so that solutions are
understood and generally supported by stakeholders.

Update of Master Plan
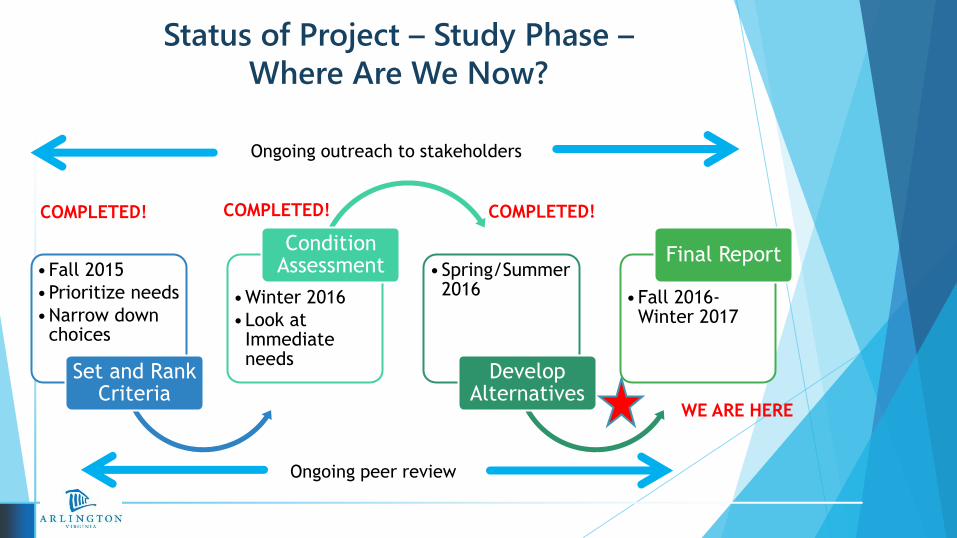
Status of Project – Study Phase –
Where Are We Now?
•Fall 2015
•Prioritize needs
•Narrow down choices
Set and Rank Criteria
•Winter 2016
•Look at Immediate needs
Condition Assessment •Spring/Summer
2016
Develop Alternatives
•Fall 2016-Winter 2017
Final Report
Ongoing outreach to stakeholders
Ongoing peer review
COMPLETED! COMPLETED!
WE ARE HERE
COMPLETED!

SOLIDS MANAGEMENT PLAN: EVALUATION PROCESS
Workshop 1 - Kickoff and Project
Objectives Defined
Workshop 2 - Define Screening and
Evaluation Criteria
Workshop 3 - Technology Identification and
Screening
Workshop 4 - Process Specific Analysis
Workshop 5 – Alternative Train
Development and Preliminary Findings :
Selection of top 4 alternatives
Workshop 6 – Weighted Criteria Ranking of
Alternatives
Workshop 7 – Final Plan Recommendations
Universe of Technologies
Screened Technologies and Process Analysis
Top 4 Selected Alternatives
Ranking and Final Evaluation
Recommended Plan

Selected Long-Term Alternatives for Further Evaluation
Alt. 1. Lime Stabilization with Improvements (Lime)
Class B bulk land application, no biogas production
Alt. 2. Mesophilic Anaerobic Digestion (MAD)
Class B bulk land application, or other third-party product mgmt., biogas
production
Alt. 3. Thermal Hydrolysis Pretreatment with MAD (THP/MAD)
Class A bulk land application or other third-party product mgmt., biogas
production
Alt. 4. MAD with Thermal Drying (MAD/DRY)
Class A product, biogas production
All alternatives, except Alt. 1, include Anaerobic Digestion

Anaerobic Digestion Key Points
Reduction of volatile solids
Biogas production
Nutrient release
Biogas production
Energy for process heating needs
Opportunity for utilization
Nutrient release
Sidestream treatment and nutrient recovery considerations
Biogas Utilization/Sidestream
Management

Anaerobic Digestion Energy Recovery
Anaerobic
Digestion
Digester
Feedstock/
Biosolids
Biosolids
Volatile
Solids to
BioGas Combined
Heat and
Power
(CHP)
Recovered
Heat
Electrical
Power
Energy
Losses
Gas
Purificatio
n BioMethane
to Pipeline
BioCNG
To
Flare

Biogas – Composition and Emissions
Combustion is considered GHG neutral since biogas is renewable
Energy recovery may result in GHG offsets - power, heat, etc.
Emissions function of combustion source and biogas quality
Flaring is a required safety feature
Biogas typically utilized as fuel first
Equipment specified to meet air quality standards
Raw Biogas
Combustion
of Biogas
CH4 CO2
Other (H2S, NH3, VOCs)
CO2 H2O Other
(CO, NOx, SOx)

Sidestreams from Digestion (THP example)
Primary
Sludge
WAS
Holding/
Blending/
Tank(s)
Screening and
Pre-
Dewatering Anaerobic
Digestion Dewatering
Land
Application or
Distribution
and Marketing
(Class A)
Biogas to
Utilization
Filtrate or
Centrate Filtrate or
Centrate
Cake
Hopper
Holding
Tank
Cake Storage THP Reactors
Steam Generator

Marketing Assessment
Summary

Market Assessment Product Review
BIOSOLIDS PRODUCT TYPES
Dewatered Cake
Class A
Class B
Class A Dryer Product
Pellet
Non-Pellet
Nutrient Enhanced Pellet
Class A Compost
Soil Blend Product
ENERGY AND OTHER PRODUCT TYPES
Ash
Electricity
Steam
Biogas for Vehicle Fuel or Natural Gas Pipeline
Recovered P Fertilizer

Biosolids: Mid-Atlantic Market
Class A , 11.8%
Landfill/Incineration, 12.1%
Class B Land App, 76.1%
Class A , 39.8%
Landfill/Incineration, 17.2%
Class B Land App, 43.0%
2010 – Based On 1.28 M WT
2016 – Based on 0.904 M WT

Class A – Biosolids Distribution
Pellets 31%
Compost 11%
Cake Land App 58%
Based on 360,000 WT

Summary: County Opportunities
BIOSOLIDS AND NON-BIOSOLIDS PRODUCTS
Need for organic soil amendment – soil blends created now
Little use of fertilizers
Currently engaged with community to produce and utilize compost materials (leaf
compost)
Looking at separating and digesting food waste in future
Interested in urban soil amendments
ENERGY
Energy Recovery On-Site
Energy Recovery using BioGas derived fuels is of interest to County Transit Bureau
- ART Bus Fleet runs on compressed natural gas (CNG) – New ART fueling station
being constructed across the street from the plant

Review Scoring Framework


Final Criteria Weighting

Scoring Process
Apply a score 1 – 5 for
each alternative
Highest score is most
preferred
Weighting was applied so
each alternative received
a weighted score for
ranking

5.85 8.06 6.71 6.12
14.70 14.07
11.79 12.07
7.78 9.09
10.14 8.76
3.04
4.77 5.56
5.43
0
5
10
15
20
25
30
35
40
Lime MAD THP/MAD MAD/DRY
PRELIMINARY WEIGHTED CRITERIA RANKING SUMMARY
ECONOMIC OPERATIONAL ENVIRONMENTAL SOCIAL

Economic Performance Measures
Capital Cost
Annual O&M Cost
Life Cycle Cost
Financial Options and Risk
End Use Management and Control
Outlet availability
Ability to control/mitigate off-site problems

Life Cycle Cost Impacts of Biogas Utilization
Biogas utilization has potential to generate revenue streams
CHP revenues – Off-set electrical consumption at WPCP
CNG revenues – Sale of biomethane as fuel
Renewable Identification Numbers (RINs) for biofuel
$0.65 / therm
Energy Policy Act 2005
EPA moderated transaction system

Operating Cost Comparison – Year 1
-2,000,000
-1,000,000
0
1,000,000
2,000,000
3,000,000
4,000,000
5,000,000
6,000,000
1-Lime 2-MAD 3-THP/MAD 4-MAD/Dry
An
nu
al C
ost
s an
d R
eve
nu
es
O&M Labor Hauling Power Natural Gas Chemicals

Operating Cost Comparison – w/CNG – Year 1
-2,000,000
-1,000,000
0
1,000,000
2,000,000
3,000,000
4,000,000
5,000,000
6,000,000
1-Lime 2-MAD 3-THP/MAD 4-MAD/Dry
An
nu
al C
ost
s an
d R
eve
nu
es
O&M Labor Hauling Power Natural Gas Chemicals Net Revenues

PRELIMINARY WEIGHTED ECONOMIC CRITERIA RANKING

Operational Evaluation Criteria
Flexibility
Construction Phasing
Expansion Potential
Diversification of Product
Operability and Safety
Operability for Existing
Staff
Number of new staff
Plant Safety
Proven System/ Technology
Reliability
Ability to monitor asset
and deploy maintenance
strategy
Constructability
Physical limitations for
on-site construction
Impacts on Plant Processes
Outages for construction
Impacts of ‘new’
facilities/ ease of
integration

0.00 2.00 4.00 6.00 8.00 10.00 12.00 14.00 16.00
Alt 1 Lime
Alt 2 MAD
Alt 3 THP/MAD
Alt 4- MAD/DRY
Operational Criteria Chart
Flexibility Operability and Safety Proven System/Technology Reliability Constructability Impacts on Plant Processes
PRELIMINARY WEIGHTED OPERATIONAL CRITERIA RANKING

Environmental Criteria
Resource Recovery Potential
Focused on energy,
nutrients, organic
products
Energy Intensity
Amount of purchased
energy (power, fuel)
Carbon Footprint
Relative change in GHG
emissions compared to
baseline
Regulatory Permits
Ease of permitting (air
quality, process, and final
product use)
Gas and Biosolids Product
Quality
Ability of products to
meet end- use
requirements

Biosolids Quantities/Type
0 50,000 100,000 150,000 200,000 250,000 300,000
1- Lime
2 - MAD
3 - THP/MESO
4 - MAD/DRY
Wet Solids Hauled (lb/day)
Class A
Class B

Carbon Intensity
Difference in estimated GHG emissions

0.00 2.00 4.00 6.00 8.00 10.00 12.00
Alt 1 Lime
Alt 2 MAD
Alt 3 THP/MAD
Alt 4- MAD/DRY
Environmental Criteria Chart
Resource Recovery Potential Energy Intensity Carbon Footprint Regulatory Permits Gas and Product Quality
PRELIMINARY WEIGHTED ENVIRONMENTAL CRITERIA RANKING

Social Evaluation Criteria
Acceptability
Community impacts –
process and product
Visual
Odor (covered in Other
Criteria)
Emissions
Noise
Product Use Potential
(covered in Env.
Criteria)
Odor Generation Potential/ Reduction
Impact of process odor
Impact of product odor
Hauling
Traffic volume

0.00 1.00 2.00 3.00 4.00 5.00 6.00
Alt 1 Lime
Alt 2 MAD
Alt 3 THP/MAD
Alt 4- MAD/DRY
Social Criteria Chart
Odor Generation Potential/Reduction Acceptability Hauling
PRELIMINARY WEIGHTED SOCIAL CRITERIA RANKING

Budgeting/Financial
Process

Utilities Fund is an Enterprise Fund
Enterprise funds are self-sufficient.
Revenues generated within fund must sustain all activities (operations and capital) of the fund, while maintaining 3 months of operating reserves and debt coverage ratio of 1.25.
Water-sewer rate set at level which, along with other revenues including excess fund balance, will fully fund activities.

Overall Considerations
Balancing of priorities in Utilities Fund
• Internal:
Water Distribution
Sanitary Sewer Collection
Sanitary Sewer Treatment
Billing Office/ Customer Service
• External:
• Washington Aqueduct – drinking water provider
• Blue Plains – sanitary sewer treatment provider
• Inter-jurisdictional (IJ) Partners – sanitary sewer treatment provided to Fairfax County, Alexandria, and Falls Church

Water/Sewer Programs & Funding Sources
[CATEGORY
NAME], $15.9
[CATEGORY
NAME], $24.2
[CATEGORY
NAME], $218.3
Water/ Sewer Maint.
Capital, $162.1
[CATEGORY NAME],
$59.7
[CATEGORY
NAME], $146.2
[CATEGORY NAME], $137.9
[CATEGORY NAME],
$39.0
[CATEGORY NAME],
$37.7
$420.5 over 10 years
10-Year Total –
Programs ($M)
10-Year Total –
Funding Sources ($M)

WPCP CIP FY2017-2026
Source: Arlington County, adopted
C apital C os t S c hedule F Y 17 F Y 18 F Y 19 F Y 20 F Y 21 F Y 22 F Y 23 F Y 24 F Y 25 F Y 26 T otal
WP C P Maintenance C apital 2,000 2,060 2,122 2,186 2,251 2,318 2,388 2,460 2,534 2,610 22,929
B lue P lains C apital Improvements 974 630 526 233 165 119 164 185 250 250 3,496
Improvements to E ads S t P roperty 100 103 106 109 113 116 119 123 127 130 1,146
O C B HVAC Upgrades 3,500 - - - - - - - - - 3,500
S econdary C larifiers 860 3,866 6,551 6,577 - - - - - - 17,854
S olids Mas ter P lan - P has e 1- B ios olids 1,620 6,880 4,010 1,552 - - - - - - 14,062
S olids Mas ter P lan - P has e 2 - 1,030 2,652 1,639 - - - - - - 5,321
S olids Mas ter P lan - P has e 3 - - - 500 1,000 8,250 23,250 25,000 46,000 46,000 150,000
T otal 9,054 14,569 15,967 12,796 3,529 10,803 25,921 27,768 48,911 48,990 218,308
F unding S chedule F Y 17 F Y 18 F Y 19 F Y 20 F Y 21 F Y 22 F Y 23 F Y 24 F Y 25 F Y 26 T otal
P AYG 3,724 3,719 2,827 2,675 2,941 2,123 2,228 2,312 2,441 2,506 27,496
New B ond Is s ue - - 3,560 1,480 - 6,848 19,298 20,750 38,180 38,180 128,296
O ther F unding - T rans it 17 18 18 19 19 20 20 21 22 22 196
O ther F unding - IJ P artners 1,370 2,366 2,624 3,262 569 1,812 4,375 4,685 8,268 8,282 37,613
Authoriz ed but Unis s ued B onds - 4,100 - - - - - - - - 4,100
Is s ued but Uns pent B onds 8,733 - - - - - - - - - 8,733
O ther P revious ly Approved F unds 11,874 - - - - - - - - - 11,874
T otal 25,718 10,203 9,029 7,436 3,529 10,803 25,921 27,768 48,911 48,990 218,308

-
5,000,000
10,000,000
15,000,000
20,000,000
25,000,000
30,000,000
35,000,000
40,000,000
45,000,000
FY16 FY17 FY18 FY19 FY20 FY21 FY22 FY23 FY24 FY25 FY26 FY27 FY28 FY29 FY30
Projected Utility Fund Annual Debt Service
Existing VRA Debt
Existing GO Debt
FY17-26 CIP
Plant
Debt
Service
FY17-26 CIP
Water & Sewer
Infrastructure
Debt Service

FY 2017-2026 CIP Process Schedule
Summer 2015 – Winter 2016
•Update & revise prior CIP to create proposed FY 2017–2026 CIP
Spring 2016
•FY 2017-2026 CIP plan proposed by County Manager
•May - July: Public Work Session with County Board
•June 22: Public Hearing on CIP
Summer 2016
•Written Comments Until July 19
•County Board adopts CIP July 19
FY 2017
•Departments execute the first year of the 10-year CIP

FY 2018 Process Schedule
Fall 2016
•Department formulates FY 2018 operating budget plan, including FY 2018 CIP information (2nd year of CIP) in proposed budget
February 2017
•FY 2018 operating budget proposed by County Manager
Spring 2017
•Worksession with County Board
•Tax Rate & Budget Hearing in March, including Water-Sewer Rate
•County Board adopts operating budget in April
FY 2018
•Departments execute the FY 2018 proposed budget & second year of the 10-year CIP
•Summer 2017-Spring 2018: Departments will update their 10 year CIP… will be adopted July 2018

Next Steps

Next Steps
Further work is needed to finalize preliminary
ranking
Risk/sensitivity analyses
Virginia Tech studies
Site visits
Discussions with stakeholders and leadership
Finalize ranking
Finalize Master Plan report

DISCUSSION