arkansas department of education academic … arkansas department of education designated the...
TRANSCRIPT

Academic Shortage Areasfor 2016-2017
Arkansas Department of Education

• Each year the US Dept. of Education asks states to identify academic teacher Shortage Areas.
• These Shortage Areas are established as areas of need in Arkansas Public Schools.
• Teachers who prepare for, and license, in Shortage Areas may be eligible for financial incentives.
– In accordance with the DOE request teachers may achieve financial benefits such as loan cancellation within the regulations of the Stafford Loan Program, the TEACH* Grant Program and/or Federal Perkins loans.
*Teacher Education Assistance for College and Higher Education
Arkansas Academic Shortage Areas
2/18

The Arkansas Department of Education designated the following as critical academic shortage areas* for the 2016-2017 school year.
– Agriculture Science & Technology– Art– Computer Science– Family and Consumer Science– French– Library Media– Mathematics– Physical Science (Chemistry, Physics)– Spanish– Special Education
* Pursuant to A.C.A. § 6-81-601 et seq. and A.C.A. § 6-85-109
Arkansas Academic Shortage Areas
3/18

<#>
Arkansas Academic Shortage Areas
• The ADE uses a ‘Supply and Demand’ formula to establish Shortage Areas, incorporating the following factors.
• Supply (incoming pipeline):
– The numbers of students in educator preparation programs (preparing for licenses).
– The numbers of licenses issued to educators (for the first time).
• Demand (need for teachers):
– The numbers of classes being taught by long-term subs or teachers out of area (on waivers).
– The retirement or potential retirement of teachers in each license area (based on age and years towards retirement).
est. December 20154/18

• Preparing – Those preparing to be licensed in the area (i.e., enrolled in educator preparation programs).
• Potential New Hires – Those who were newly licensed (received the license for the first time) in the license area.
• Vacancies/Subs – Those classes taught by long-term substitute teachers.
• Waivers – Those classes taught by teachers teaching out of their area of licensure.
• Potential Need (Veterans) – The number who retired the previous year or are expected to retire in the near future.
Shortage Area Calculation Definitions
Preparing for the workforce Potential new hiresImmediate need -
Vacancies, Subs
Immediate need -
Waivers
Potential for need in the
near future
Area
# o
f
Te
ac
he
rs in
Are
a (
TIA
)
Pre
pa
rin
g
for
the
lic
en
se
Pre
pa
rin
g
as
% o
f T
IA
Pre
pa
rin
g
Sc
ore
Fir
st-
tim
e
lic
en
se
d in
are
a
FT
L a
s %
of
TIA
FT
L S
co
re
# V
/S
V/S
as
% o
f T
IA
V/S
Sc
ore
# W
aiv
ers
Wa
ive
rs
as
% o
f T
IA
Wa
ive
r S
co
re
# w
ho
are
Ve
tera
n
Ve
tera
n
as
% o
f T
IA
Ve
tera
n S
co
re
To
tal
Sc
ore
Example Subject 77 4 5.19% 5.19 2 2.60% 2.60 1 1.30% 12.99 2 2.60% 2.60 10 12.99% 12.99 79
Dec 20155/18

• To define a Veteran for the purpose of this project, according to Arkansas Teacher Retirement System:
– The average age of retirees is 61.
– The average years towards retirement is 23.
• Therefore a Veteran is defined as:
– One who retired in the last year, or one whose age plus years towards retirement equals 84 or greater.
• 61 + 23 = 84
<#>
Shortage Area Calculation Definitions
Dec 20156/18

• The number of teachers in each area (TIA) was the basis for calculations.
• Each score was devised by the number of educators in each factor calculated as % of TIA.
• Factors were given a score accordingly.– The score for Vacancies/Subs, which was much smaller than other factors, but highly
significant, was weighted by a factor of ten.
• Positive factors (# preparing and # of first-time licensed) were compiled and added to the standard of 100.
• Negative factors (Vacancies, Waivers, Veterans) were compiled and subtracted from the standard.
• Scores less than 100 indicated the need was greater than the supply.
– These were determined to be shortage areas.
Shortage Area Score Criteria
Preparing for the workforce Potential new hiresImmediate need -
Vacancies, Subs
Immediate need -
Waivers
Potential for need in the
near future
Area
# o
f
Te
ac
he
rs in
Are
a
(TIA
)
Pre
pa
rin
g
for
the
lic
en
se
Pre
pa
rin
g
as
% o
f T
IA
Pre
pa
rin
g
Sc
ore
Fir
st-
tim
e
lic
en
se
d in
are
a
FT
L a
s %
of
TIA
FT
L S
co
re
# V
/S
V/S
as
% o
f T
IA
V/S
Sc
ore
# W
aiv
ers
Wa
ive
rs
as
% o
f T
IA
Wa
ive
r S
co
re
# w
ho
are
Ve
tera
n
Ve
tera
n
as
% o
f T
IA
Ve
tera
n S
co
re
To
tal
Sc
ore
Example Subject 77 4 5.19% 5.19 2 2.60% 2.60 1 1.30% 12.99 2 2.60% 2.60 10 12.99% 12.99 79
Dec 20157/18

Arkansas Supply and Demand Table
Preparing for the workforce Potential new hiresImmediate need -
Vacancies, Subs
Immediate need -
Waivers
Potential for need in the
near future
Area
# of
Teachers
in Area
(TIA)
Preparing
for the
license
Preparing
as % of
TIA
Preparing
Score
First-time
licensed
in area
FTL as %
of TIA
FTL
Score# V/S
V/S as %
of TIA
V/S
Score
#
Waivers
Waivers
as % of
TIA
Waiver
Score
# who
are
Veteran
Veteran
as % of
TIA
Veteran
Score
Total
Score
French 77 4 5.19% 5.19 2 2.60% 2.60 1 1.30% 12.99 2 2.60% 2.60 10 12.99% 12.99 79
Art 915 86 9.40% 9.40 68 7.43% 7.43 23 2.51% 25.14 16 1.75% 1.75 94 10.27% 10.27 80
Special Education 2,795 526 18.82% 18.82 365 13.06% 13.06 65 2.33% 23.26 415 14.85% 14.85 359 12.84% 12.84 81
Fam & Cons Sci 576 42 7.29% 7.29 69 11.98% 11.98 13 2.26% 22.57 10 1.74% 1.74 57 9.90% 9.90 85
Agriculture 294 27 9.18% 9.18 33 11.22% 11.22 8 2.72% 27.21 0 0.00% 0.00 23 7.82% 7.82 85
Physical Science
(Physics, Chemistry)784 56 7.14% 7.14 140 17.86% 17.86 16 2.04% 20.41 37 4.72% 4.72 87 11.10% 11.10 89
Library 968 163 16.84% 16.84 105 10.85% 10.85 5 0.52% 5.17 100 10.33% 10.33 178 18.39% 18.39 94
Mathematics 1,698 177 10.42% 10.42 136 8.01% 8.01 25 1.47% 14.72 41 2.41% 2.41 115 6.77% 6.77 95
Spanish 389 34 8.74% 8.74 37 9.51% 9.51 5 1.29% 12.85 5 1.29% 1.29 37 9.51% 9.51 95
Drama/Speech 507 37 7.30% 7.30 87 17.16% 17.16 4 0.79% 7.89 37 7.30% 7.30 47 9.27% 9.27 100
Journalism 280 30 10.71% 10.71 36 12.86% 12.86 0 0.00% 0.00 30 10.71% 10.71 32 11.43% 11.43 101
Middle Childhood 7,407 586 7.91% 7.91 663 8.95% 8.95 42 0.57% 5.67 125 1.69% 1.69 573 7.74% 7.74 102
English / LA 1,734 267 15.40% 15.40 228 13.15% 13.15 29 1.67% 16.72 12 0.69% 0.69 154 8.88% 8.88 102
Social Studies 1,565 212 13.55% 13.55 211 13.48% 13.48 17 1.09% 10.86 50 3.19% 3.19 164 10.48% 10.48 102
Marketing 80 3 3.75% 3.75 10 12.50% 12.50 0 0.00% 0.00 0 0.00% 0.00 9 11.25% 11.25 105
Elementary 11,039 1,008 9.13% 9.13 1163 10.54% 10.54 49 0.44% 4.44 67 0.61% 0.61 903 8.18% 8.18 106
Counseling 1,311 327 24.94% 24.94 120 9.15% 9.15 2 0.15% 1.53 104 7.93% 7.93 225 17.16% 17.16 107
Music 1,378 177 12.84% 12.84 177 12.84% 12.84 8 0.58% 5.81 11 0.80% 0.80 147 10.67% 10.67 108
Phys Ed / Health 2,923 295 10.09% 10.09 351 12.01% 12.01 4 0.14% 1.37 50 1.71% 1.71 268 9.17% 9.17 110
Gifted - Talented 494 219 44.33% 44.33 70 14.17% 14.17 0 0.00% 0.00 140 28.34% 28.34 86 17.41% 17.41 113
Business 1,334 105 7.87% 7.87 369 27.66% 27.66 12 0.90% 9.00 21 1.57% 1.57 128 9.60% 9.60 115
Life Science 762 159 20.87% 20.87 155 20.34% 20.34 3 0.39% 3.94 15 1.97% 1.97 69 9.06% 9.06 126
Bldg Level Admin 1,764 944 53.51% 53.51 360 20.41% 20.41 0 0.00% 0.00 51 2.89% 2.89 296 16.78% 16.78 154
District Level Admin 614 556 90.55% 90.55 79 12.87% 12.87 0 0.00% 0.00 13 2.12% 2.12 173 28.18% 28.18 173
Reading 74 90 121.62% 121.62 64 86.49% 86.49 8 10.81% 108.11 0 0.00% 0.00 16 21.62% 21.62 178
Computer Science new requirement for '15-'16 xxxxx xxxxx xxxxx xxxxx xxx
Dec 20158/18

Arkansas Shortage Areas - December 2015
Preparing for the
workforcePotential new hires
Immediate need -
Vacancies, Subs
Immediate need –
Waivers
Potential for need in
the near future
Area
# o
f
Te
ac
he
rs in
Are
a
(TIA
)
Pre
pa
rin
g
for
the
li cense
Pre
pa
rin
g
as
% o
f T
IA
Pre
pa
rin
g
Sc
ore
Fir
st-
tim
e
lic
en
se
din
are
a
FT
L a
s %
of
TIA
FT
L S
co
re
# V
/S
V/S
as %
of
TIA
V/S
Sc
ore
# W
aiv
ers
Wa
ive
rs
as
% o
f T
IA
Wa
ive
r S
co
re
# w
ho
are
Ve
tera
n
Ve
tera
n
as
% o
f T
IA
Ve
tera
n S
co
re
To
tal
Sc
ore
French 77 4 5.19% 5.19 2 2.60% 2.60 1 1.30% 12.99 2 2.60% 2.60 10 12.99%12.99 79
Art 915 86 9.40% 9.4068
7.43% 7.43 23 2.51% 25.14 16 1.75% 1.75 94 10.27%10.27 80
Special Education 2,795 526 18.82% 18.82 365 13.06% 13.06 65 2.33% 23.26 415 14.85% 14.85 359 12.84%12.84 81
Fam & Cons Sci 576 42 7.29% 7.29 69 11.98% 11.98 13 2.26% 22.57 10 1.74% 1.74 57 9.90% 9.90 85
Agriculture 294 27 9.18% 9.18 33 11.22% 11.22 8 2.72% 27.21 0 0.00% 0.00 23 7.82% 7.82 85
Physical Science(Physics, Chemistry)
784 56 7.14% 7.14 140 17.86% 17.86 16 2.04% 20.41 37 4.72% 4.72 87 11.10%11.10 89
Library 968 163 16.84% 16.84 105 10.85% 10.85 5 0.52% 5.17 100 10.33% 10.33 178 18.39%18.39 94
Mathematics 1,698 177 10.42% 10.42 136 8.01% 8.01 25 1.47% 14.72 41 2.41% 2.41 115 6.77% 6.77 95
Spanish 389 34 8.74% 8.74 37 9.51% 9.51 5 1.29% 12.85 5 1.29% 1.29 37 9.51% 9.51 95
Computer Science new requirement for '15-'16 xxx xxx xxx xxx xxx
9/18

10
License Areaf
‘07-08 thru ‘16-17
Special Education 10
Mathematics 10
Library Media 10
Science 9
Gifted-Talented 9
Counseling 8
Middle Childhood 7
Foreign Language 6
ESL 4
Art 3
Drama/Speech 2
5-6 Endorsement 2
Music 1
FACS 1
Computer Science 1
Business 1
Bldg. Level Admin. 1
Agriculture 1Agriculture
Bldg Level Admin
Business
Computer Science
FACS
Music
5-6 Endorsement
Drama/Speech
Art
ESL
Foreign Language
Middle Childhood
Counseling
Gifted-Talented
Science
Library Media
Mathematics
Special Education
Frequency (f) of License Areas as Shortage Areas
10/18

Area 07-08 08-09 09-10 10-11 11-12 12-13 13-14 14-15 15-16 16-17
Library Media X X X X X X X X X X
Mathematics X X X X X X X X X X
Special Education X X X X X X X X X X
Gifted-Talented X X X X X X X X X
Science X X X X X X X X
Phys,
Chem
Counseling X X X X X X X X
Middle Childhood X X X X X X X
Foreign Language X X X X X Fr, Sp
ESL X X X X
Art X X X
5-6 Endorsement X X
Drama/Speech X X
Agriculture X
Bldg Level Admin X
Business X
FACS X
Music X
Computer Science X
<#>
License Areas as Shortage Areas by School Year
11/18
12
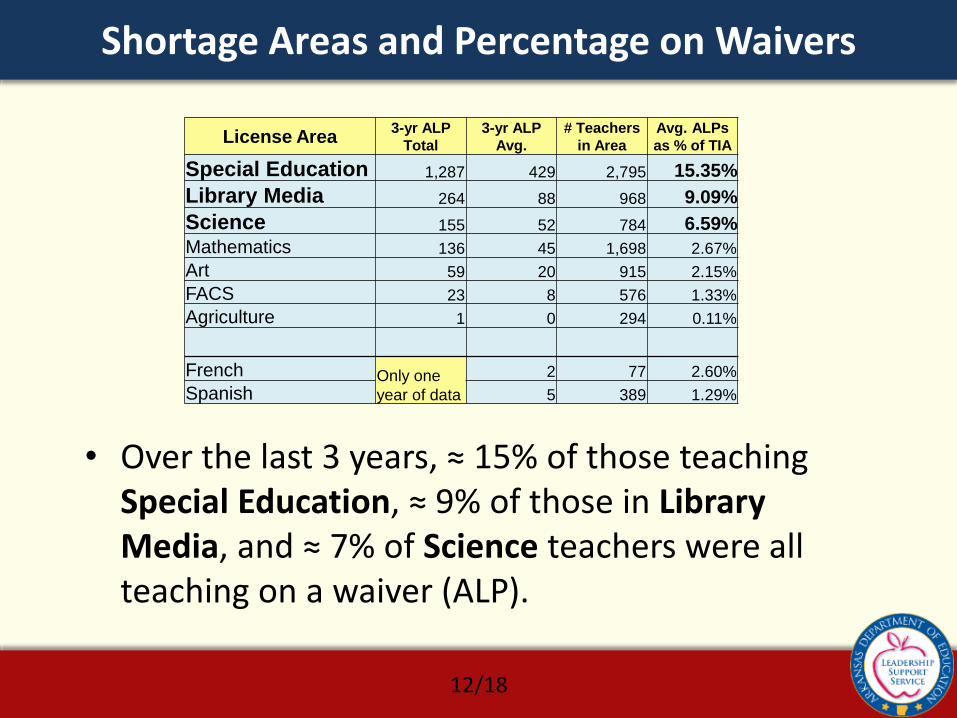
Shortage Areas and Percentage on Waivers
• Over the last 3 years, ≈ 15% of those teaching Special Education, ≈ 9% of those in Library Media, and ≈ 7% of Science teachers were all teaching on a waiver (ALP).
License Area3-yr ALP
Total
3-yr ALP
Avg.
# Teachers
in Area
Avg. ALPs
as % of TIA
Special Education 1,287 429 2,795 15.35%
Library Media 264 88 968 9.09%
Science 155 52 784 6.59%
Mathematics 136 45 1,698 2.67%
Art 59 20 915 2.15%
FACS 23 8 576 1.33%
Agriculture 1 0 294 0.11%
French Only one
year of data
2 77 2.60%
Spanish 5 389 1.29%
12/18

13
Veteran status of Educators in All License Areas
Area % Veteran > 10% Area % Veteran > 10%
District Level Admin. ** 28.18% √ Social Studies 10.48% √
Reading ** 21.62% √ Art 10.27% √
Library ** 18.39% √ Fam. & Cons. Sci. 9.90%
Gifted - Talented ** 17.41% √ Business 9.60%
Counseling 17.16% √ Spanish 9.51%
Bldg. Level Admin. ** 16.78% √ Drama/Speech 9.27%
French 12.99% √ Phys Ed / Health 9.17%
Special Education 12.84% √ Life Science 9.06%
Journalism ** 11.43% √ English / LA 8.88%
Marketing 11.25% √ Elementary (P-4) 8.18%
Physical Science(Physics, Chemistry)
11.10% √ Agriculture 7.82%
Music 10.67% √ Middle Childhood (5-8) 7.74%
Mathematics 6.77%
Shortage Area
** = requires a prior license √ = > 10%
On the average ≈ 10% of the Arkansas Educator workforce fits the ‘Veteran’ definition. 14 of the 25 license areas below are > 10%.
Dec 201513/18

14
Percentage of “newly licensed” Educators
Area% newly licensed
Area% newly licensed
French 2.60% Music 12.84%
Art 7.43% Journalism ** 12.86%
Mathematics 8.01% District Level Admin. ** 12.87%
Middle Childhood (5-8) 8.95% Special Education 13.06%
Counseling 9.15% English / LA 13.15%
Spanish 9.51% Social Studies 13.48%
Elementary (P-4) 10.54% Gifted - Talented ** 14.17%
Library ** 10.85% Drama/Speech 17.16%
Agriculture 11.22%Physical Science(Physics, Chemistry)
17.86%
Fam & Cons Sci 11.98% Life Science 20.34%
Phys Ed / Health 12.01% Bldg. Level Admin. ** 20.41%
Marketing 12.50% Business 27.66%
Reading ** 86.49%
Shortage Area** = requires a prior license
Newly licensed (or new to the area) refers to a those who, in the past year, have received the license in the area for the first time.
Dec 201514/18

Shortage Areas
Non-Shortage Areas
Educators AvailableSum of those preparing plus newly licensed
2,070 9,158
Positions AvailableSum of Vacancies, Waivers and Veterans
1,747 4,194
Ratio Persons to Positions 1.2 to 1 2.2 to 1
<#>
Numbers of Educators vs Positions
Dec 201515/18
There are about half as many educators available (per
position) in shortage areas as there are in non-shortage
areas (a ratio of 1.2 to 1 vs 2.2 to 1).

Another way of looking at this:Shortage
AreasNon-Shortage
Areas
Educators Preparing 1,115 5,015
Positions Available 1,747 4,194
% of Persons to Positions 63% 120%
<#>
Numbers of Educators vs Positions
Dec 2015
The number of students preparing for licenses in shortage areas is equal to only 63% of the number of positions available.
While the number of students preparing for licenses in non-shortage areas is equal to 120% of the number of positions available.
16/18

<#>
These data clearly indicate that there are some areas in which teacher shortages exist.
The Arkansas Department of Education is working diligently to address these areas and ensure that the annual Demand for educators is met with a sufficient Supply of qualified and effective educators.
Conclusion
17/18

Ivy Pfeffer
– Assistant Commissioner
– Educator Effectiveness and Licensure
– (501) 683-4095
Frank Servedio
– Special Projects Administrator
– (501) 682-4589
<#>
Contact Information
18/18