arikaree watershed september 2008 - usda
TRANSCRIPT

Arikaree Watershed — 10250001
1
United States Department of Agriculture
Natural Resources Conservation Service
Lakewood, Colorado
RWA 10250001
September 2008
Arikaree Watershed
Hydrologic Unit Code 102500001
Rapid Assessment
KA

Arikaree Watershed — 10250001
2

Arikaree Watershed — 10250001
3
The United States Department of Agriculture (USDA) prohibits discrimination in all its programs and activities on the basis of race, color, national origin, sex, religion, age, disability, political beliefs, sexual orientation, and marital or family status. (Not all prohibited bases apply to all programs.) Persons with disabilities who require alternative means for communication of program information (Braille, large print, audiotape, etc.) should contact USDA’s TARGET Center at 202-720-2600 (voice and TDD). To file a complaint of discrimination, write USDA, Director, Office of Civil Rights, Room 326W, Whitten Building, 14th and Independence Avenue, SW, Washington DC 20250-9410, or call (202) 720-5964 (voice and TDD). USDA is an equal opportunity provider and employer.

Arikaree Watershed — 10250001
4
Introduction Background Information The Natural Resources Conservation Service (NRCS) is encouraging the development of rapid watershed assessments in order to increase the speed and efficiency generating information to guide conservation implementation, as well as the speed and efficiency of putting it into the hands of local decision makers. Rapid watershed assessments provide initial estimates of where conservation investments would best address the concerns of landowners, conservation districts, and other community organizations and stakeholders. These assessments help land-owners and local leaders set priorities and determine the best actions to achieve their goals. Benefits of these Activities While rapid assessments provide less detail and analysis than full-blown studies and plans, they do provide the benefits of NRCS locally-led planning in less time and at a reduced cost. The benefits include: • Quick and inexpensive tools for setting priorities and taking action • Providing a level of detail that is sufficient for identifying actions that can be
taken with no further watershed-level studies or analyses • Actions to be taken may require further Federal or State permits or ESA or
NEPA analysis but these activities are part of standard requirements for use of best management practices (BMPs) and conservation systems
• Identifying where further detailed analyses or watershed studies are needed • Plans address multiple objectives and concerns of landowners and
communities • Plans are based on established partnerships at the local and state levels • Plans enable landowners and communities to decide on the best mix of NRCS
programs that will meet their goals • Plans include the full array of conservation program tools (i.e. cost-share
practices, easements, technical assistance)
Rapid Watershed Assessments provide information that helps land-owners and local leaders set conservation priorities.

Arikaree Watershed — 10250001
5
COLORADO County County Acres County Acres in ARIKA-REE Watershed
% of County in the Watershed
% of Watershed in the County
Elbert 1,183,750 5,079 0.4% 0.4%
Kit Carson 1,383,889 34,487 2.5% 3.0%
Lincoln 1,654,463 296,317 17.9% 25.9%
Washington 1,615,004 262,635 16.3% 22.9%
Yuma 1,516,523 516,981 34.1% 45.1%
The Arikaree Watershed is located in the Republi-can River Basin, on the eastern plains of Colorado. The watershed is 1,115,485 acres in size, with ap-proximately 538 farms and ranches covering 978,248 acres in the watershed. As of April 2005, there are 59,570 acres of land in the Conservation Reserve Program.

Arikaree Watershed — 10250001
6

Arikaree Watershed — 10250001
7
MLRA CRA CRA NAME DESCRIPTION
67B 67B.1 Central Great Plains, Southern Part
The Central High Plains, Southern Part CRA is broad, undulating to rolling plains dis-sected by streams and rivers. Local relief is measured in tens of feet on the plains. Most soils are deep and formed in aeolian and alluvial materials. Pre-settlement vege-tation was mainly mixed mid and short grass on the heavy soils, and tall grass on the sandy soils. Nearly all of this area in fallow cropland rotations or rangeland. Some cropland areas are irrigated.
72 72.1 Central High Tableland The Central High Tableland CRA is broad, level to gently rolling, loess mantled table-land. Local relief is measured in feet on the tableland tens of feet and major river valleys bordered by steep slopes. Most soils are deep. Pre-settlement vegetation was mainly mixed mid and short grass on the heavy soils, and tall grass on the sandy soils. About half of this area is in rangeland and half is in cropland, including dry land small grain crops and irrigated corn and grain sorghum.
Common Resource Areas (CRA): Geographical areas where resource concerns, problems, and treatment needs are similar. Landscape conditions, soil, climate, human considerations, and other natural resource information are used to determine the geographical bounda-ries of the common resource area.

Arikaree Watershed — 10250001
8
Land Ownership
Approximately1,073,560 acres in the Arikaree Watershed are privately owned. There are 41,839 acres of state controlled land and 214 acres of federally controlled lands.
The predominant land use is agriculture, consisting of cash grain farming and livestock production. Cropland is dominated by dryland winter wheat rotations, and corn and grain sorghum production in areas where irrigation is available. Steeper slopes are generally in native grasses and used for livestock grazing.
Physical Description
The Arikaree watershed consists of broad, inter-valley remnants of smooth plain, with gently rolling slopes, punctuated by steeper slopes along the drainages. The Arikaree River bisects deep, well-drained soils overlaying the Ogallala formation, and cuts into Cretaceous Pierre shale on the eastern edge of the watershed.

Arikaree Watershed — 10250001
9
ARIKAREE Colorado Land Use
Total Acreage Vegetation Acreage
Cropland 472,673 Dryland Ag 420,623.0
Irrigated Ag 52,049.9
Rangeland/Grassland 624,940
Grass Dominated 203,924.0
Grass/Forb Mix 139,578.1
Grass/Yucca Mix 47,410.9
Sagebrush Community 8,403.2
Sagebrush/Grass Mix 225,603.9
Shrub/Grass/Forb Mix 20.1
Forest 3,653 Cottonwood 3,644.1
Ponderosa Pine 8.7
Riparian 10,817 Riparian 2,574.6
Herbaceous Riparian 8,242.7
Water 59 Water 59.1
Other 4,060 Soil 4,031.9
No Data 28.0
Total Colorado Watershed Acres 1,116,202
Total Vegetation Acreage 1,146,192

Arikaree Watershed — 10250001
10
Arikaree Annual Precipitation, 1918-2006
0
5
10
15
20
25
30
1918
1922
1926
1930
1934
1938
1942
1946
1950
1954
1958
1962
1966
1970
1974
1978
1982
1986
1990
1994
1998
2002
2006
Year
Ann
ual P
reci
pita
tion
(Inch
es)
.
Annual Precipitation Mean
Precipitation
Precipitation in the Arikaree watershed averages between 15 and 17 inches per year. Droughts are common in the watershed, as with the rest of Colorado. Statewide, in the 1900's alone, four prolonged dry spells occurred. The first took place in the 1910s, and another, in the '30s, caused the dust-bowl period. The second worst drought on record in the state occurred in the mid-50s, when a series of hot, dry summers following a period of scant mountain snowpack created water shortages. The fourth serious drought hit parts of Colorado in the late 1970s. In this century, the most severe drought since 1723 hit the state in 2002. Prior to the 1700's, researchers looking at tree ring records found evidence of droughts, even more severe than those during the record period, with some lasting many years.
Rainfall in the watershed typically occurs as frontal storms in the spring and early summer, and as high intensity, convective thunderstorms in late summer. Maximum precipitation is from mid spring through late autumn, and precipitation in winter is snow. The average annual temperature is from 37 to 65 degrees F. The frost free period averages 155 days but ranges from 106 to 184 days.

Arikaree Watershed — 10250001
11
Ecological Sites
The plant community on an ecological site is typified by an association of species that differs from that of other ecological sites in the kind and/or proportion of species or in total production.
Ecological Site maps give an overall indication of the soils plant relationship in the area. More detailed descriptions of ecological sites are provided in the Field Office Technical Guide (FOTG). The FOTG is available in local offices of the Natural Resources Conservation Service (NRCS) and online at http://www.nrcs.usda.gov/technical/efotg/.
Loamy
Soil: Ecological Site NameCLAY UPLAND
Choppy Sands
Clayey
Clayey - veg. zone 2
Clayey Plains
Deep Sands
Gravel Breaks
LOAMY LOWLAND (PE16-20)
LOAMY TERRACE (PE16-20)
LOAMY UPLAND (PE16-20)
LOESS BREAKS (PE16-20)
Limestone Breaks
Limy Upland
Loamy Bottomland
Loamy Plains
Loamy Slopes
Loamy Upland
Loess Breaks
Overflow
Plains Swale
SANDS (PE16-20)
SANDY TERRACE (PE16-20)
SHALLOW LIMY (PE16-20)
SUBIRRIGATED (PE16-20)
Saline Lowland - Veg. zone 2
Saline Overflow
Saline Subirrigated
Salt Flat
Salt Meadow
Sands
Sandstone Breaks
Sandy
Sandy (formerly Sandy Plains)
Sandy Bottomland
Sandy Meadow
Sandy Plains
Sandy Salt Flat
Shallow to Gravel - Veg. zone 2
Shaly Plains
Subirrigated
No Data

Arikaree Watershed — 10250001
12
Land Capability Classes
Class 1 - soils have few limitations that restrict their use.
Class 2 - soils have moderate limitations that reduce the choice of plants or that re-quire moderate conservation practices.
Class 3 - soils have severe limitations that reduce the choice of plants or that require special conservation practices, or both.
Class 4 - soils have very severe limitations that reduce the choice of plants or that re-quire very careful management, or both.
Class 5 - soils are subject to little or no erosion but have other limitations, imprac-tical to remove, that restrict their use mainly to pasture, rangeland, forestland, or wildlife habitat.
Class 6 - soils have severe limitations that make them generally unsuitable for culti-vation and that restrict their use mainly to pasture, rangeland, forestland, or wildlife habitat.
Class 7 - soils have very severe limitations that make them unsuitable for cultivation and that restrict their use mainly to grazing, forestland, or wildlife habitat.
Class 8 - soils and miscellaneous areas have limitations that preclude commercial plant production and that restrict their use to recreational purposes, wildlife habitat, watershed, or aesthetic purposes.
Land Capability Classification shows, in a general way, the suitability of soils for most kinds of field crops. Crops that require special management are excluded. The soils are grouped according to their limita-tions for field crops, the risk of damage if they are used for crops, and the way they respond to management. The criteria used in grouping the soils do not include major and generally expensive landforming that would change slope, depth, or other characteristics of the soils, nor do they include possible but unlikely major recla-mation projects. Capability classification is not a substitute for interpretations that show suitability and limita-tions of groups of soils for rangeland, for woodland, and for engineering purposes. Capability classes, the broadest groups, are designated by the numbers 1 through 8. The numbers indicate progressively greater limi-tations and narrower choices for practical use.
Arikaree Watershed — 10250001
13
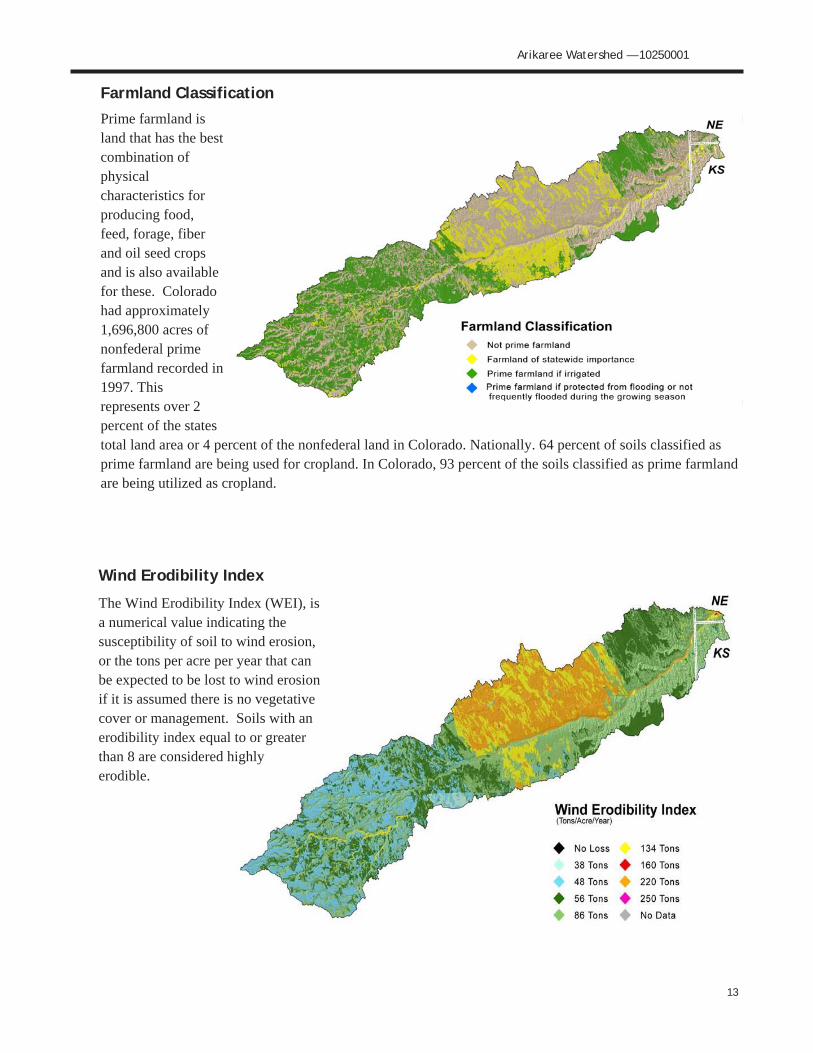
Wind Erodibility Index
The Wind Erodibility Index (WEI), is a numerical value indicating the susceptibility of soil to wind erosion, or the tons per acre per year that can be expected to be lost to wind erosion if it is assumed there is no vegetative cover or management. Soils with an erodibility index equal to or greater than 8 are considered highly erodible.
Farmland Classification
Prime farmland is land that has the best combination of physical characteristics for producing food, feed, forage, fiber and oil seed crops and is also available for these. Colorado had approximately 1,696,800 acres of nonfederal prime farmland recorded in 1997. This represents over 2 percent of the states total land area or 4 percent of the nonfederal land in Colorado. Nationally. 64 percent of soils classified as prime farmland are being used for cropland. In Colorado, 93 percent of the soils classified as prime farmland are being utilized as cropland.

Arikaree Watershed — 10250001
14
Ground Water The High Plains Aquifer underlies the Arikaree watershed, and is the primary source of irrigation and domestic water for the area. The High Plains aquifer is an extensive regional aquifer that underlies the Great Plains states extending from South Dakota on the north to Texas and New Mexico on the south. The Denver Basin Aquifer underlies the easternmost tip of the watershed.
Ground water quality is generally good, although moderately to very hard. Total dissolved solids in the aquifer have risen significantly since the early 1900s, and in some areas, the water may exceed drinking water standards for sulfate, chloride, fluoride, iron and arsenic. These concentrations may be naturally derived from geologic sources.
Surface Water Quality Surface water quality in the Arikaree Watershed is generally good. Section 303(d) of the Clean Water Act requires states to identify and list all water bodies where state water quality standards are not being met for designated uses. As indicated in the map, there are no 303(d) listed streams in the watershed. The Arikaree River is designated as Primary Contact Recreation, Aquatic Life Warm I, and Agriculture. Updates to the 303d/TMDL list can be found at: http://www.cdphe.state.co.us/op/wqcc/SpecialTopics/303(d)/303dtmdlpro.html

Arikaree Watershed — 10250001
15
Geology
The Arikaree River lies within the Ogallala formation, and dips into Cretaceous Pierre shale on the eastern edge of the watershed. Eolian sands and silt cover much of the up-lands surrounding the river.
Table from the USGS Groundwater Atlas: http://geosurvey.state.co.us/wateratlas/chapter5_
Hydrogeologic Units of the High Plains Aquifer

Arikaree Watershed — 10250001
16
Threatened & Endangered Species
State & Federally Threatened, Endangered & Candidate Species as well as Species of Special Concern in Arikaree Watershed.
Common Name Scientific
Name Class
Federal Status
State Status
Comments
Bald Eagle Haliaeetus leu-
cocephalus Birds None
Threat-ened
May migrate through
watershed
Black-footed Ferret Mustela ni-gripes
Mammals Endan-gered
Endan-gered
No current records of occurrence
Black-tailed Prairie Dog Cynomys ludo-
vicianus Mammals None Concern
Occurs in the watershed
Brassy Minnow Hybognathus
hankinsoni Fish None Threat-ened
Occurs in the watershed
Burrowing Owl Athene cunicu-laria
Birds None Threat-ened
Occurs in the watershed
Common garter snake Thamnophis
sirtalis Reptiles None Concern
May occur in the water-
shed
Cylindrical papershell Anodontoides ferussacianus
Gastropods None Concern May occur in
the water-shed
Ferruginous Hawk Buteo regalis Birds None Concern Occurs in the
watershed
Long-Billed Curlew Numenius
americanus Birds None Concern
Occurs in the watershed
Mountain Plover Charadrius montanus
Birds None Concern Occurs in the
watershed
Northern Cricket Frog Acris crepitans Amphibians None Concern May occur in
the water-shed
Northern leopard frog Rana pipiens Amphibians None Concern May occur in
the water-shed
Plains Leopard Frog Rana blairi Amphibians None Concern Occurs in the
watershed
NO PHOTO AVAIL-ABLE
Plains Minnow Hybognathus placitus
Fish None Endan-gered
Occurs in the watershed

Arikaree Watershed — 10250001
17
Threatened & Endangered Species (continued)
State & Federally Threatened, Endangered & Candidate Species as well as Species of Special Concern in Arikaree Watershed.
Plains Orangethroat Darter
Etheostoma spectabile
Fish None Concern Occurs in the
watershed
Stonecat Noturus flavus Fish None Concern
May occur in the water-
shed
Swift fox Vulpes velox Mammals None Concern Occurs in the
watershed
Yellow mud turtle Kinosternon flavescens
Reptiles None Concern May occur in
the water-shed
Short grass is the dominant terrestrial habitat type on the heavy soils in the watershed, and tall/mid/short/shrub is the dominant type on sandy soils. Burrowing owl, mountain plover, black-tailed prairie dog, and swift fox are representative species for the shortgrass habitat. Greater prairie chickens use the sand sage-mixed grass rangeland habitats in the eastern half of the watershed. Water is scarce and the native species in this watershed are those that can survive without abundant water supplies. Riparian areas, playa lakes, and the occasional stock pond provide seasonal to intermittent aquatic habitats. Economically important wildlife species that occur in much of the watershed include black bullhead, green sunfish, pronghorn (antelope), mule and white-tailed deer, mourning dove, pheasant, and greater prairie chicken. Bobwhite quail and wild turkey (Rio Grande) occur in the Arikaree River riparian area.
Common Name Scientific
Name Class
Federal Status
State Status
Comments

Arikaree Watershed — 10250001
18
Social Data Elbert Kit Carson Lincoln Washington Yuma
Demographics (US Census, American Factfinder)
Total population 19,872 8,011 20,504 4,926 9,841
Male 9,966 4,236 10,834 2,504 4,840
Female 9,906 3,775 9,670 2,422 5,001
Median age (years) 37.2 37.4 36.5 40.2 37.3
White 18,923 6,992 18,792 4,748 9,267
Black or African American 128 139 420 2 11
American Indian and Alaska Native 125 41 131 28 28
Asian 74 26 82 5 7
Native Hawaiian and Other Pacific Islander 18 3 14 1 2
Some other race 255 737 772 100 407
Hispanic or Latino (of any race) 766 1095 2439 310 1268
Economic Characteristics (US Census, American Factfinder)
In labor force (population 16 years and over) 11,056 3,746 9,771 2,400 4,919
Median household income (dollars) 62,480 33,152 32,724 32,431 33,169
Median family income (dollars) 66,740 41,867 42,241 37,287 39,814
Per capita income (dollars) 24,960 16,964 16,721 17,788 16,005
Families below poverty level 145 198 454 121 235
Individuals below poverty level 791 908 2253 555 1244
Farms (number) 1153 678 455 861 864
Land in farms/ranches (acres) 1,068,359 1,247,181 1,428,404 1,408,583 1,351,01
0
Average size farm/ranch (acres) 927 1,840 3,139 1,636 1,567
Median size farm (acres) 160 11,112 1,497 865 1,000
Average age of farmer or rancher 52.8 54.3 55.6 55.4 52.7
Net cash return from ag sales ($1,000) 108 3,392 4,829 2,612 58,023
Cattle and calves (number) 36,000 148,000 40,000 60,000 250,000
County Agricultural Characteristics (Colorado Agricultural Census, county data tables)

Arikaree Watershed — 10250001
19
Conservation District Priorities
The Colorado Conservation Districts identified and prioritized these resource concerns during facilitated public meetings and they are included in their Long Range Plans. Higher scores indicate higher priority
Resource Concern By Priority
Burlington Chey-enne
Cope Flagler High
Plains Washington
County Yuma
Yuma County
Totals
Soil Erosion 4 5 5 5 5 4 4 32
Rangeland/Grazingland Health and Productivity
2 5 3 4 4 4 3 2 27
Water Quality/Quantity 5 3 4 1 5 5 23
Plants-Invasive Species 1 3 3 7
Trees 3 2 2 7
Wildlife Habitat 2 2
Arikaree Watershed Natural Resource Concerns
Concerns and Issues Identified By Other Entities (NRCS staff, Colorado State University, and others)
Water Quantity - meeting Republican River Compact requirements Conversion from high water use crops to lower water use crops Invasive weeds Wind erosion

Arikaree Watershed — 10250001
20
Conservation Systems to Address Major Resource Concerns
Primary Resource Concern:
Conservation System Description:
Prescribed Grazing—Planned management that provides adequate recovery opportunity between grazing events and proper stocking of animals. Estimate 600,000 acres need to be treated on median sized ranches of 3,500 acres.
Based on
Conservation System Guide Code:
CO 67B.1-GR-01-R-Grazing
Practices Unit Quantity Cost/Unit ($) Estimated Cost per Median Sized Ranch ($)
Prescribed Grazing
Fencing (382) Ft. 50,000 .40 20,000
Pipeline (516) Ft. 2,000 2.40 4,800
Upland Wildlife Habitat Management (645)
Ac. 300 na 0
Watering Facility (614) No. 6 410 2,460
Costs to apply prescribed grazing per median sized ranch of 3,500 acres
No. 150 27,260
Subtotal Rangeland costs: $4,089,000
Selected Conservation Application Data
FY 2004 FY 2005 FY 2006 FY 2007 Total
Total Conservation Systems Planned (Acres) 529,441 1,900,002 178,030 233,662 2,841,135
Total Conservation Systems Applied (Acres) 136,419 101,588 129,972 276,888 644,867
Practices
Terraces (Acres) 32,179 11,667 34,530 0 78,376
Soil Enhancement (Acres) Not Available 5,047 Not Avail. 43,310 48,357
Nutrient Management 1,894 2,698 3,444 30,000 38,036
Water Management 2,364 538 1,224 19,351 23,477

Arikaree Watershed — 10250001
21
General Effects, Impacts, and Estimated Costs of Application of Conservation Systems Landuse Resource
Concern Measurable Effects
Non-measurable Effects Estimated Cost ($)
Rangeland Plants Improved plant condition, productivity, health and vigor. Grazing animals have adequate feed, forage and shelter. Wildlife habitat is sustained or improved.
4,089,000
Dryland Crop Soil 50,400 total tons/yr soil saved
Cropland sustainability 819,000
Estimated Total Costs to Address Major Resource Concerns: $4,908,000
Conservation Systems to Address Major Resource Concerns (cont’d)
Primary Resource Concern: Dry Cropland Seasonal
Conservation System Description:
HEL cropland with wind erosion as a major resource concern. Conservation system includes crop rotation, terraces, seasonal residue management, and nutrient and pest management. Estimate 70,000 acres need to be treated on median sized farms of 2,000 acres
Reference Conservation System Guide Code:
CO 72.1-CR-Dryland –R-1
Practices Unit Quantity Cost/Unit ($) Estimated Cost ($)
Conservation Crop Rotation (328) Ac. 8,400 0.5 4,200
Nutrient Management (590) Ac. 3,500 5.0 17,500
Pest Management (595) Ac. 3,500 5.0 17,500
Residue Management, Seasonal (344) Ac. 9,000 1.2 10,800
Cost to apply cropland conservation system per median sized farm of 2,000 acres
No. 35 $11.7/Ac $23,400
Subtotal Costs Dryland Crops $ 819,000

Arikaree Watershed — 10250001
22
REFERENCES NOT CITED
Common Resource Area (CRA), a subdivision of the Major Land Resource Area (MLRA), is a geographical area where resource concerns, problems, or treatment needs are similar. Visit http://soils.usda.gov/survey/geography/cra.html.
Land Ownership (status, 12/31/2006 dataset) from the Colorado Department of Transportation (CDOT). Visit http://www.dot.state.co.us.
Vegetation data was generated using the Colorado Division of Wildlife’s “Colorado Vegetation Classification Pro-ject” (CVCP) data. For more information on the Colorado Vegetation Classification Project, visit http://ndis.nrel.colostate.edu/coveg.
Threatened and Endangered Species information was gathered by the NRCS State Biologist using data from the Colorado Division of Wildlife (CDOW) Natural Diversity Information Source (NDIS).
303(d) listed streams map was created using data from Colorado Department of Public Health & Environments’ Wa-ter Quality & Control Commission. Impaired streams are current as of April 30, 2006.
Geology & Water information was obtained from the USGS, http://geosurvey.state.co.us/wateratlas/, and the Colo-rado Department of Public Health and Environment, http://www.cdphe.state.co.us/op/wqcc/SpecialTopics/303(d)/303dtmdlpro.html
Resource Concerns were identified using the Colorado Association of Conservation Districts’ (CACD) long range (10 year) plans from the period of 1996-2000. Only the top three environmental resource concerns for each district were used. For more information on Colorado’s Conservation Districts, visit http://www.cacd.us.
Soils Maps were generated using Soil Survey Geographic Database (SSURGO) tabular and spatial data. To download SSURGO data, visit http://soildatamart.nrcs.usda.gov.
Average Annual Precipitation data was developed through a partnership between the Natural Resources Conserva-tion Service’s (NRCS) National Water and Climate Center (NWCC), the National Cartography and Geospatial Cen-ter (NCGC), and the PRISM (the Parameter-elevation Regressions on Independent Slopes Model) group at Oregon State University (OSU), developers of PRISM.
Relief & Elevation maps were created using the National Elevation Dataset (NED), 30m Digital Elevation Model (DEM) raster product assembled by the U.S. Geological Survey (USGS).
Conservation Systems to address major resource concerns were extracted from the Conservation Systems Guides (CSG) compiled from local conservationists by the NRCS Ecological Sciences Section at the Lakewood State Of-fice.
Effects and Impacts of application of conservation systems were extracted from Colorado eFOTG, Section III, Re-source Quality Criteria, NRCS, Colorado, March 2005 and CSG.
Cost Estimates to apply conservation systems were developed by estimating costs per median size farm and ranch and calculating costs from the field office cost lists.

Arikaree Watershed — 10250001
23