arhi · mha, senior project manager ... appendix a5.1. physical exercise: ... management class...
TRANSCRIPT
December 2009, Prepared by the Voinovich School of Leadership and Public Affairs
AppAlAchiAn RuRAl heAlth instituteHealth Needs Assessment Survey III · Research Report
ARHI
(This page was intentionally left blank.)

ARHI: Appalachian Rural Health Institute
Health Needs Assessment Survey III Research Report
Prepared by: The Voinovich School of Leadership and Public Affairs at Ohio University
Building 22, The Ridges Athens, OH 45701
(740) 593-4388
December 2009

APPALACHIANRURALHEALTHINSTITUTE(ARHI)HealthNeedsAssessmentSurveyIII∙ResearchReport
(Thispagewasintentionallyleftblank.)

APPALACHIANRURALHEALTHINSTITUTE(ARHI)HealthNeedsAssessmentSurveyIII∙ResearchReport
Acknowledgments
Manyindividualscontributedtothesuccessfulundertakingofthisreport,andweextendourgratitudetoallofthepeoplewhogavetheirtimeandassistance.
VoinovichSchoolofLeadershipandPublicAffairsatOhioUniversity
SaraLichtinBoyd,BSN,MHA,SeniorProjectManager
FigenKaradogan,MS,ResearchAssistant
HollyRaffle,PhD,CHES,AssistantProfessorofLeadershipandPublicAffairs
AnirudhV.S.Ruhil,PhD,AssociateProfessorofLeadershipandPublicAffairs
LezleeJ.Ware,PhD,ResearchAssociate
NicoleYandell,MA,ResearchAssociate
HollyCraycraft,ResearchAssistant
KateLeeman,Editor
VladPascal,CoverPhotography
LindseySiegrist,GraphicDesign
EliasBarberi,UndergraduateVoinovichScholarOhioUniversityScrippsSurveyResearchCenter
JerryL.Miller,PhD,AssociateProfessor,SchoolofCommunicationStudies
MaxLaird,GraduateResearchAssistantAppalachianRuralHealthInstitute
SharonDenham,DSN,RN,Director
JaneHamel‐Lambert,MBA,PhD,AssociateDirector
FrankSchwartz,MD,Director,ARHIDiabetesCenter,AssociateProfessorofEndocrinology
ThisprojectwasfundedbytheU.S.DepartmentofHealthandHumanServices,HealthResourcesandServicesAdministration,OfficeofRuralHealthPolicy.

APPALACHIAN RURAL HEALTH INSTITUTE (ARHI) Health Needs Assessment Survey III ∙ Research Report
(This page was intentionally left blank.)

APPALACHIAN RURAL HEALTH INSTITUTE (ARHI) Health Needs Assessment Survey III ∙ Research Report
Table of Contents
I. EXECUTIVE SUMMARY ............................................................................................................................... 1
II. INTRODUCTION ......................................................................................................................................... 7
III. SURVEY METHOD ..................................................................................................................................... 9
SURVEY DESIGN ............................................................................................................................... 9
SURVEY PROCESS ............................................................................................................................. 9
POST‐SURVEY PROCEDURES ............................................................................................................ 9
COMPARING THE ARHI STUDY RESULTS TO PREVIOUS RESEARCH ............................................... 10
IV. SURVEY FINDINGS .................................................................................................................................. 13
INTRODUCTION .............................................................................................................................. 13
Distribution of the Survey Sample .................................................................................... 13
GENERAL HEALTH STATUS ............................................................................................................. 15
EXAMINED HEALTH CONDITIONS .................................................................................................. 17
Asthma Rates .................................................................................................................... 18
Arthritis Rates ................................................................................................................... 19
Diabetes Rates .................................................................................................................. 20
Heart Attack Rates ............................................................................................................ 21
Heart Disease Rates .......................................................................................................... 22
Stroke Rates ...................................................................................................................... 23
High Blood Pressure Rates ................................................................................................ 24
High Blood Pressure Medication Use .................................................................. 25
High Cholesterol Rates ...................................................................................................... 26
SPOTLIGHT ON DIABETES ............................................................................................................... 27
Comorbid Conditions ........................................................................................................ 27
Diabetes Diagnosis Before Age 40 .................................................................................... 28
Daily Blood‐Glucose Testing ............................................................................................. 29
Diabetes Pill Use ............................................................................................................... 30

APPALACHIAN RURAL HEALTH INSTITUTE (ARHI) Health Needs Assessment Survey III ∙ Research Report
Insulin Use ......................................................................................................................... 31
Diabetes Class Attendance ............................................................................................... 32
Annual Diabetes‐Related Doctor Visit .............................................................................. 33
Annual Dental Visit and Diabetes ..................................................................................... 34
Cost Restricting Diabetes Care .......................................................................................... 35
Cost Restricting Doctor Visits ............................................................................... 35
Cost Restricting Medication ................................................................................. 36
Cost Restricting Glucose Checks .......................................................................... 37
RISK FACTORS ................................................................................................................................. 39
Body Mass Index ............................................................................................................... 40
Rate of Healthy Weight ........................................................................................ 40
Rate of Obesity .................................................................................................... 41
Activity Level ..................................................................................................................... 42
Moderate Exercise ............................................................................................... 42
Vigorous Exercise ................................................................................................. 44
Smoking ............................................................................................................................. 46
Smoked 100 Cigarettes ........................................................................................ 46
Current Smokers .................................................................................................. 47
Self‐Reported Depressed Mood ....................................................................................... 48
HEALTH CARE ACCESS .................................................................................................................... 49
Single Primary Care Physician ........................................................................................... 49
Cost Prohibiting Necessary Care ....................................................................................... 50
Annual Dental Visit ........................................................................................................... 51
Insurance Coverage .......................................................................................................... 52
Insurance Demographics .................................................................................................. 53
Detailed Insurance Coverage ............................................................................................ 54
Prescription Coverage ....................................................................................................... 55
APPALACHIAN RURAL HEALTH INSTITUTE (ARHI) Health Needs Assessment Survey III ∙ Research Report
List of Figures and Tables
Figure 1. General Health Status ........................................................................................................... 15
Figure 2. Examined Health Conditions ................................................................................................ 17
Figure 3. Asthma Rates ........................................................................................................................ 18
Figure 4. Arthritis Rates ........................................................................................................................ 19
Figure 5. Diabetes Rates ....................................................................................................................... 20
Figure 6. Heart Attack Rates ................................................................................................................. 21
Figure 7. Heart Disease Rates ............................................................................................................... 22
Figure 8. Stroke Rates ........................................................................................................................... 23
Figure 9. High Blood Pressure Rates ..................................................................................................... 24
Figure 10. High Blood Pressure Medication Use .................................................................................. 25
Figure 11. High Cholesterol Rates ........................................................................................................ 26
Figure 12. Diabetes Diagnosis Before Age 40 ....................................................................................... 28
Figure 13. Daily Blood‐Glucose Testing ................................................................................................ 29
Figure 14. Regular Diabetes Pill Use ..................................................................................................... 30
Figure 15. Regular Insulin Use .............................................................................................................. 31
Figure 16. Diabetes Class Attendance .................................................................................................. 32
Figure 17. Annual Diabetes‐Related Doctor Visit ................................................................................. 33
Figure 18. Annual Dental Visit and Diabetes ........................................................................................ 34
Figure 19. Cost Restricting Doctor Visit ................................................................................................ 35
Figure 20. Cost Restricting Medication ................................................................................................ 36
Figure 21. Cost Restricting Glucose Checks .......................................................................................... 37
Figure 22. Rate of Healthy Weight ....................................................................................................... 40
Figure 23. Rate of Obesity .................................................................................................................... 41
Figure 24. 5 Days or More of Weekly Moderate Exercise .................................................................... 42

APPALACHIAN RURAL HEALTH INSTITUTE (ARHI) Health Needs Assessment Survey III ∙ Research Report
Figure25. 3 Days or More of Weekly Vigorous Exercise ....................................................................... 44
Figure 26. Smoked 100 Cigarettes ........................................................................................................ 46
Figure 27. Current Smokers .................................................................................................................. 47
Figure 28. Self‐Reported Depressed Mood .......................................................................................... 48
Figure 29. Single Primary Care Physician .............................................................................................. 49
Figure 30. Cost Prohibiting Necessary Care.......................................................................................... 50
Figure 31. Annual Dental Visit .............................................................................................................. 51
Figure 32. Insurance Coverage ............................................................................................................. 52
Figure 33. Detailed Insurance Coverage ............................................................................................... 54
Figure 34. Prescription Coverage ......................................................................................................... 55
Table 1. Employment and Insurance Coverage .................................................................................... 53
Table 2. Income and Insurance Coverage ............................................................................................ 53

APPALACHIAN RURAL HEALTH INSTITUTE (ARHI) Health Needs Assessment Survey III ∙ Research Report
Table of Appendices
Appendix A. Weighted ARHI III Data ........................................................................................................... 58
Appendix A1. General Health Status .............................................................................................. 58
Appendix A2. Examined Health Conditions ................................................................................... 61
Appendix A3. Diabetes ................................................................................................................... 66
Appendix A3.1. Diabetes: Belmont County ...................................................................... 67
Appendix A3.2. Diabetes: Columbiana County ................................................................. 68
Appendix A3.3. Diabetes: Gallia County ........................................................................... 69
Appendix A3.4. Diabetes: Harrison County ...................................................................... 70
Appendix A3.5. Diabetes: Jefferson County ..................................................................... 71
Appendix A3.6. Diabetes: Lawrence County ..................................................................... 72
Appendix A3.7. Diabetes: Monroe County ....................................................................... 73
Appendix A3.8. Diabetes: Muskingum County ................................................................. 74
Appendix A3.9. Diabetes: Noble County ........................................................................... 75
Appendix A4. Body Mass Index (BMI) Categories .......................................................................... 76
Appendix A5. Physical Exercise ...................................................................................................... 77
Appendix A5.1. Physical Exercise: Belmont County .......................................................... 78
Appendix A5.2. Physical Exercise: Columbiana County .................................................... 79
Appendix A5.3. Physical Exercise: Gallia County .............................................................. 80
Appendix A5.4. Physical Exercise: Harrison County .......................................................... 81
Appendix A5.5. Physical Exercise: Jefferson County ......................................................... 82
Appendix A5.6. Physical Exercise: Lawrence County ........................................................ 83
Appendix A5.7. Physical Exercise: Monroe County .......................................................... 84
Appendix A5.8. Physical Exercise: Muskingum County .................................................... 85
Appendix A5.9. Physical Exercise: Noble County .............................................................. 86
APPALACHIAN RURAL HEALTH INSTITUTE (ARHI) Health Needs Assessment Survey III ∙ Research Report
Appendix A6. Smoking ................................................................................................................... 87
Appendix A7. Self‐Reported Depressed Mood .............................................................................. 90
Appendix A8. Health Care Access .................................................................................................. 93
Appendix A9. Insurance Coverage ................................................................................................. 98
Appendix B. Weighted Demographics ...................................................................................................... 103
Appendix B1. Weighted Demographics: Belmont County ........................................................... 104
Appendix B2. Weighted Demographics: Columbiana County ..................................................... 105
Appendix B3. Weighted Demographics: Gallia County ................................................................ 106
Appendix B4. Weighted Demographics: Harrison County ........................................................... 107
Appendix B5. Weighted Demographics: Jefferson County .......................................................... 108
Appendix B6. Weighted Demographics: Lawrence County ......................................................... 109
Appendix B7. Weighted Demographics: Monroe County ............................................................ 110
Appendix B8. Weighted Demographics: Muskingum County ...................................................... 111
Appendix B9. Weighted Demographics: Noble County ............................................................... 112
Appendix C. Weighted and Unweighted Sample Demographics .............................................................. 113
Appendix D. Statistical Limitations: A Tutorial .......................................................................................... 114
Appendix D1. Cross‐Tabulated Variables at the County Level ..................................................... 114
Appendix D2. Standard Errors Reported as Zero ......................................................................... 116
Appendix E. Comprehensive Description of the Survey ........................................................................... 117

APPALACHIANRURALHEALTHINSTITUTE(ARHI)HealthNeedsAssessmentSurveyIII∙ResearchReport 1
AspartoftheAppalachianRuralHealthInstitute(ARHI)DiabetesResearchInitiative,residentsinBelmont,Columbiana,Gallia,Harrison,Jefferson,Lawrence,Monroe,Muskingum,andNoblecountiesparticipatedinahealthcareneedsassessmentsurvey.Thesurveycollectedprevalencedataonanumberofchronicdiseaseswithanemphasisondiabetes.Additionalinformationwascollectedonrelevantriskfactors,includingsmoking,physicalexercise,highcholesterol,andobesity.Thesurveywasintentionallymodeledafterthe2007BehavioralRiskFactorSurveillanceSystemsurvey(BRFSS),createdbytheCentersforDiseaseControlandPrevention(CDC)1,toallowforstateandnationalcomparisonsofthesurveyresults.Further,surveyresultswere,wheneverpossible,comparedtotheCDC’sHealthyPeople20102–anationalhealthpromotionandpreventionplanwithdefinedgoalsandbenchmarksintendedtoenhancethehealthstatusofAmericans.Thecurrentsurvey(ARHIIII)includesmanyofthequestionsfrompreviousARHIsurveysconductedin2006(Jackson,Meigs,Morgan,Perry,Ross,Scioto,andWashingtoncounties)and2003(Athens,Hocking,Pike,andVintoncounties).
Somecriticalpointstotakeawayfromthisneedsassessmentsurveyinclude:
1. Whencomparedtothe2007BRFSSratesforOhioandthenation,ARHIIIIrespondentsreportworseoverallhealthstatus.
• AsmallerproportionofARHIIIIresidentsreportedtheirhealthasexcellentorverygoodascomparedtothestateandnational2007BRFSSResults.
• AgreaterproportionofARHIIIIresidentsdescribedtheirhealthasfairorpoorascomparedtothestateandnational2007BRFSSresults.
• ARHIIIIresidentswhoseself‐reportedhealthstatuswasfairorpoorhadasignificantlygreater3likelihoodofhavingachronicdisease,demonstratingtherelationshipbetweenself‐reportedhealthstatusanddiseaseprevalence.
• BodyMassIndex(BMI)wasrelatedtohealthstatus,withobeseindividualssignificantlymorelikelytoreportthattheirhealthwasfairorpoor.
2. TheARHIIIIregionalprevalenceratesofallsevenchronicdiseasessurveyed(asthma,
arthritis,diabetes,heartattack,heartdisease,stroke,andhighbloodpressure)exceededthenational2007BRFSSratesand,inallbutoneinstance(arthritis),theOhio2007BRFSSrates.
1InformationontheBRFSScanbefoundathttp://www.cdc.gov/BRFSS2HealthyPeople2010informationcanberetrievedathttp://www.healthypeople.gov3Thewordsignificantlydenotesastatisticallymeaningfuldifference.Pleaseseepage13fordetails.
EXECUTIVE SUMMARY

APPALACHIANRURALHEALTHINSTITUTE(ARHI)HealthNeedsAssessmentSurveyIII∙ResearchReport 2
• TherateofasthmaamongARHIIIIresidentsis14.1%,whichishigherthantheOhio(13.1%)andnational(12.9%)2007BRFSSrates.
• TherateofarthritisamongARHIIIIresidentswas32.2%,whichisthesameastheOhio(32.2%)andhigherthanthenational(26.9%)2007BRFSSrates.
• TherateofdiabetesamongARHIIIIresidentsis12.5%,whichishigherthantheOhio(9.5%)andnational(8.6%)2007BRFSSrates.
• TherateofheartattackamongARHIIIIresidentsis7.3%,whichishigherthantheOhio(5.4%)andnational(4.2%)2007BRFSSrates.
• TherateofheartdiseaseamongARHIIIIresidentsis6.7%,whichishigherthantheOhio(5.1%)andthenational(4.2%)2007BRFSSrates.
• TherateofstrokeamongARHIIIIresidentsis4.2%,whichishigherthantheOhiorate(3.1%)andthenational(2.7%)2007BRFSSrates.
• TherateofhighbloodpressureamongARHIIIIresidentsis32.2%,whichishigherthantheOhio(28.4%)andthenational(27.7%)2007BRFSSrates.
3. TherateofdiabetesamongARHIIIIresidents(12.5%)isapproximatelythreepercentage
pointshigherthantheOhio2007BFRSSrate(9.5%)andapproximatelyfourpercentagepointsabovethenational2007BRFSSrate(8.6%).
• AmongthoseARHIIIIresidentslivingwithdiabetes,49.2%werediagnosedwiththediseasebeforetheageof40,whichisamuchhigherproportionthanseenacrossthenation(19.0%).4
• TherateofARHIIIIresidentslivingwithdiabetesthatchecktheirblood‐glucoselevelatleastonceaday(71.9%)exceededtheHealthyPeople2010targetrateof60.0%.
• TherateofARHIIIIresidentslivingwithdiabetesthatregularlyusediabetespills(67.2%)fallsbelowthenational2007BRFSSrateof70.2%.
• TherateofARHIIIIresidentslivingwithdiabetesthatregularlyuseinsulinis28.4%whichisabovethenational2007BRFSSrateof(26.8%).
• TherateofARHIIIIresidentslivingwithdiabetesthathaveattendedadiabetes‐managementclass(46.4%)fallsbelowthenational2007BRFSSrate(55.1%)andbelowtheHealthyPeople2010targetrate(60.0%).
• TherateofARHIIIIresidentslivingwithdiabeteswhohaveanannualdiabetes‐relateddoctorvisitis95.0%,whichexceedsthenationalrateof85.2%.
4Thisnationalrateisfromthe2007NationalHealthInterviewSurvey(NHIS).Thisdatacanbereviewedathttp://www.cdc.gov/diabetes/statistics/age/fig1.htm

APPALACHIANRURALHEALTHINSTITUTE(ARHI)HealthNeedsAssessmentSurveyIII∙ResearchReport 3
• TherateofARHIIIIresidentslivingwithdiabetesthatvisitadentistatleastonceannuallyis58.2%,whichfallsbelowtheHealthyPeople2010targetrateof75.0%.
• TherateofARHIIIIresidentslivingwithdiabeteswhocannotaffordtoseeadoctoris26.3%.
• TherateofARHIIIIresidentslivingwithdiabeteswhocannotafforddiabetes‐relatedmedicationis16.9%.
• TherateofARHIIIIresidentslivingwithdiabeteswhocannotaffordteststripstochecktheirblood‐glucoselevelsis23.6%.
4. BMI(BodyMassIndex)isanimportantriskfactorforthemajorityofhealthconditions
surveyed.• TheHealthyPeople2010targetistoreducethenumberofobeseindividualsto
15.0%andincreasethenumberofhealthyweightadultsto60.0%.• AcrosstheARHIIIIcounties,30.7%ofadultsareobeseandonly34.0%area
healthyweight.• ForeachincreaseinBMIcategory,thereisasignificantlyhigherlikelihoodof
reportingthefollowingconditions:diabetes,arthritis,highbloodpressure,andhighcholesterol.
• ARHIIIIresidentswhoareobeseoroverweightaresignificantlymorelikelytoreporthavingaheartattackthanhealthyweightindividuals.
• ARHIIIIresidentswhoareobeseoroverweightaresignificantlymorelikelytohaveheartdiseasethanhealthyweightindividuals.
5. TheHealthyPeople2010targetisfor30.0%ofAmericanstoengagein20minutesof
moderateexerciseatleast5daysaweek.• AcrosstheARHIIIIcounties,35.6%ofresidentsaremeetingthistarget.• ARHIIIIresidentswhoaremeetingtheHealthyPeople2010goalformoderate
exercisearesignificantlylesslikelytoreporthavingarthritis,diabetes,aheartattack,heartdisease,highbloodpressure,highcholesterol,andstroke.
• ARHIIIIresidentswhoaremeetingtheHealthyPeople2010goalformoderateexercisearesignificantlylesslikelytobeobese.
6. TheHealthyPeople2010targetisfor30.0%ofAmericanstoengagein20minutesof
vigorousexerciseatleast3daysaweek.• AcrosstheARHIIIIcounties,27.0%ofresidentsaremeetingthistarget.
APPALACHIANRURALHEALTHINSTITUTE(ARHI)HealthNeedsAssessmentSurveyIII∙ResearchReport 4
• ARHIIIIresidentswhoaremeetingtheHealthyPeople2010goalforvigorousexercisearesignificantlylesslikelytoreporthavingarthritis,diabetes,aheartattack,heartdisease,highbloodpressure,highcholesterol,andstroke.
• ARHIIIIresidentswhoaremeetingtheHealthyPeople2010goalforvigorousexercisearesignificantlylesslikelytobeoverweightorobese.
• Witheachincreaseinagecategoryaftertheageof44,thelikelihoodofmeetingtheHealthyPeople2010goalforvigorousexercisesignificantlydecreases.
• Males(33.4%)aresignificantlymorelikelytomeettheHealthyPeople2010goalforvigorousexercisecomparedtofemales(21.1%).
7. Onequarter(25.6%)ofARHIIIIresidentsreportedsmokingeverydayorsomedays;greatlyexceedingthenational2007BRFSSrateof19.3%andtheHealthyPeople2010targetof12.0%.
• Individualswhohavesmoked100ormorecigarettesintheirlifetimehaveasignificantlygreaterlikelihoodofhavingarthritis,diabetes,heartattack,andheartdisease.
8. TherateofARHIIIIresidentswhoreportedfeelingdepressedinthepreviousmonthwas
38.0%,whichwasbelowthenational2007BRFSSrate(41.9%).• Individualswithhouseholdincomesbelow$15,000weresignificantlymorelikely
toreportfeelingdepressedduringthepreviousmonththanindividualsinhigherincomebrackets.
• ObeseindividualsweresignificantlymorelikelytoreportfeelingdepressedwithinthepreviousmonthcomparedtootherBMIcategories.
• Ratesofdepressedfeelingsweresignificantlyhigheramongfemales(41.3%)thanmales(34.5%).
9. AccesstohealthcareacrossARHIIIIcountieswasroughlyequivalenttostateandnational2007BRFSSrates.
• Therateofindividualswhohaveasingle,primarycarephysicianacrosstheARHIIIIcounties(80.2%)isabovetheOhiorate(79.5%)andthenational(71.9%)2007BRFSSrates.However,itisstillbelowtheHealthyPeople2010targetof85.0%.
• AmongARHIIIIcounties,therateofresidentswhoareunabletoaffordadoctoris15.2%,whichisabovetheOhiorate(12.4%)andthenational(13.5%)2007BRFSSrates.
• AcrossARHIIIIcounties,69.5%ofresidentshavehadanannualdentalexam,whichishigherthantheHealthyPeople2010targetof56.0%.

APPALACHIANRURALHEALTHINSTITUTE(ARHI)HealthNeedsAssessmentSurveyIII∙ResearchReport 5
• TherateofARHIIIIresidentswithinsurancecoveragewas85.9%,whichisbetweentheOhio(88.2%)andnational(84.4%)2007BRFSSrates.TheHealthyPeople2010targetisforeveryindividualtohaveinsurancecoverage.

APPALACHIANRURALHEALTHINSTITUTE(ARHI)HealthNeedsAssessmentSurveyIII∙ResearchReport 6
(Thispagewasintentionallyleftblank.)

APPALACHIANRURALHEALTHINSTITUTE(ARHI)HealthNeedsAssessmentSurveyIII∙ResearchReport 7
TheAppalachianRuralHealthInstitute(ARHI)ResearchInitiativeisacomprehensiveprojectwiththegoalofimprovingthehealthstatusandrelatedqualityoflifeinunderservedandruralpopulations;particularlythoseinruralAppalachianOhio.Itisanumbrellaorganizationforinterdisciplinaryresearch,education,andservice.DiabetesisaspecialemphasisoftheARHIResearchInitiative.
ThisreportcontainsfindingsfromtheneedsassessmentsurveyconductedbetweenNovember2008andFebruary2009aspartofthiscomprehensiveinitiative.ThisisthethirdtimeARHIandtheVoinovichSchoolofLeadershipandPublicAffairs(GVS)haveconductedsuchasurvey,thefirsttakingplaceinDecemberof2003andthesecondinJanuaryof2006.Asintheprevioustwostudies,theintentofthissurveyistoassessandimproveunderstandingofthehealthproblemsoftheresidentsofAppalachianOhio,withaspecialemphasisondiabetesandtheassociatedhealthproblems.Thistime,thesurveywasconductedinninecounties–Belmont,Columbiana,Gallia,Harrison,Jefferson,Lawrence,Monroe,Muskingum,andNoble–andisreferredtoastheARHIIII.Informationwasgatheredontheprevalenceratesforcertainchronichealthconditions,includingdiabetesandrelateddisorders,aswellasrelevantriskfactorsfortheseillnesses.Inadditiontotheseriesofquestionsaimedtowardsrespondentslivingwithdiabetes,thesurveyalsocollectedinformationongeneralhealthstatus,accesstohealthcare,activitylevel,bodymass,andsmoking.AprimarygoalofthesurveydesignwastoallowforcomparisonsbetweenthecurrentstatewidefindingsinOhioandnationalfindingsfromtheU.S.CentersforDiseaseControlandPrevention’s(CDC)2007BehavioralRiskFactorSurveillanceSurvey(BRFSS)5aswellastheCDC’sHealthyPeople2010standards.
AllninesurveyedcountiesareinAppalachianOhio.Eightoftheninearedesignated,inpartorinwhole,asMedicallyUnderservedAreas(MUA)bytheU.S.DepartmentofHealthandHumanServices,HealthResourcesandServicesAdministration(HRSA).6HRSAappliesthisdefinitiontogeographicareaswithhighpovertyandinfantmortalityrates,alowprimarycarephysiciantopopulationratio,andalargeelderlypopulation.
5CentersforDiseaseControlandPrevention(CDC).BehavioralRiskFactorSurveillanceSystemSurveyQuestionnaire.Atlanta,Georgia:U.S.DepartmentofHealthandHumanServices,CentersforDiseaseControlandPrevention,[2007].6AllofColumbiana,Harrison,Lawrence,Monroe,andMuskingumcountiesaredesignatedasMUAswhilecertaintownshipsinBelmont,JeffersonandNoblecountieshavetheMUAdesignation.GalliaCountyistheonlyoneintheARHIIIIregionwithoutaMUAdesignation.Thesedatawereretrievedatthefollowingwebsite:http://muafind.hrsa.gov/
INTRODUCTION
APPALACHIANRURALHEALTHINSTITUTE(ARHI)HealthNeedsAssessmentSurveyIII∙ResearchReport 8
(Thispagewasintentionallyleftblank.)

APPALACHIANRURALHEALTHINSTITUTE(ARHI)HealthNeedsAssessmentSurveyIII∙ResearchReport 9
Whatfollowsisabriefdescriptionoftheprocessbywhichthissurveywasdesigned,administered,andanalyzed.Foramorecompletedescriptionofthemethodology,includingthesurveydesign,datacollectionandsamplingplan,andweightingofthedata,pleaserefertoAppendixVofthisreport.
SurveyDesign
TheinstrumentutilizedforthistelephonesurveymostlyreplicatestheprevioustwoARHIneedsassessmentinstruments.7ThemajorsourceforbothphasesoftheARHIsurveywastheBehavioralRiskFactorSurveillanceSystemsurvey(BRFSS)fromtheCentersofDiseaseControlandPrevention(CDC).8Changesfromthe2006ARHIinstrumentincludetheadditionofseveraldiabetesquestionsmodeledafterthe2007BRFSSdiabetesmodule,moreactivitylevelinformation,andmorecomprehensivehealthaccessitems.Inanefforttokeepthesurveyasconciseaspossible,afewquestionsweredroppedthatdidnotprovidesufficientlyusefulinformationoranopportunityforcomparisonwithresultscollectedwithintheBRFSS.
SurveyProcess
Thetelephonesurveys9tookplacebetweenNovember2008andFebruary2009.Allpotentialparticipantswereadvisedthattheirinvolvementinthesurveywasvoluntaryandconfidential.Onegoaloftheresearchteamwastostratifytheresultsofthesurveybycountyinordertoaccuratelyrepresentthepresenceofvarioushealthconditionswithinthepopulationsoftheseninecounties.Thisnecessitatedthecollectionofarelativelylargesamplesize.Atotalof3,841surveyswerecollectedfromresidents18andolder.TheindividualARHIIIIcountysamplecountsareprovidedinAppendixC.Differencesamongthenumberofpeoplesurveyedineachcountygenerallyreflecttherelativedifferencesincountypopulations.
Post‐SurveyProcedures
Oncethesurveywasconducted,post‐stratificationweightswerecomputedinordertomakethesampleasrepresentativeoftheentireARHIIIIpopulationaspossible.Forthissurvey,theweightswereconstructedbystratifyingeachcounty’spopulationbythegenderandagecategoriesgiveninthe2000U.S.CensusofPopulationestimates.Post‐stratificationweights
7PreviousARHIreportsandinformationcanbefoundathttp://www.oucom.ohiou.edu/arhi/research.htm8ThefullBRFSSquestionnaireanddatacanbelocatedathttp://www.cdc.gov/BRFSS9Onlylandlinetelephonenumbersweretargetedandnopost‐samplingadjustmentsweremadetocorrectforwireless‐onlyhomes.
SURVEY METHOD

APPALACHIANRURALHEALTHINSTITUTE(ARHI)HealthNeedsAssessmentSurveyIII∙ResearchReport 10
werethencomputedasusual(i.e.,theratioofthewithin‐stratumpopulationproportiontothewithin‐stratumsampleproportion).Theseweightswerethenappliedtothesurveydatapriortoinitiatingtheanalysesmotivatingthisreport.TheassignedweightsareprovidedinAppendixIII.
ComparingtheARHIStudyResultstoPreviousResearch
OneofthegoalsofthisprojectwastoallowforacomparisonoftheARHIIIIsurveyresultstotheOhioandnational2007BRFSSfindings.Tomakesuchcomparisons,theARHIIIIsurveywasdesignedtoincludeidenticallywordedquestionsandresponsesfromexistinghealthsurveysconductedbytheCDC.Specifically,andasemphasizedearlierinthisreport,theAHRIIIIsurveyincludesquestionsfromtheCDC’sBRFSS.TheBRFSSisatelephonesurveydesignedbytheCDCandadministeredbytheindividualstatesandUSterritories.Itincludescorequestionsaswellasmodules.Allgovernmententitiesaskthecorequestions,andcanelectwhichmodulestouse.Forinstrumentationpurposes,thesurveyquestionswerecarefullydrawnfromtheBRFSScoreandfromthediabetesmodule.BecausethestateofOhiodidnotadministerthediabetesmodulein2007,comparisonsforthosequestionscanonlybemadewithnationaldata.ComparisonsbetweentheARHIIIIandthestateandnational2007BRFSSdataarealwaysmadebetweenweighteddata,andallratecomparisonsareunadjusted.
SincetheARHIIIIsurveyalsocontainsquestionsnotfoundintheBRFSS,notalloftheARHIIIIresultscanbecomparedtostateandnationaldata.Furthercomparisonsaremade,whenpossible,totheHealthyPeople2010targetspublishedbytheCDC.HealthyPeople2010isanationwidehealthpromotionanddiseasepreventionplanwhichhasdevelopedtargetsandobjectivesfortheU.S.population.Wheneverpossible,thesurveyresultsforeachAHRIIIIcountyarecomparedtothesehealthbenchmarks.10
TheBRFSSdataaremadepubliclyavailable,makingitpossibletocomparetheresultsoftheARHIIIIsurveyagainstboththe2007BRFSSdataandtheHealthyPeople2010targets.Todoso,the2007BRFSSdatawereretrievedfromtheCDCwebsite,11andthe2007BRFSSmasterdatafile(N=430,912)wasretainedinitsoriginalformforsubsequentanalysisofthenationalsample.12Forderivingthestateestimatesdocumentedinthisreport,theprojectteamtrimmedthismasterdatafiletocreateaseconddatafilethatincludedonlyOhioans(NOhio=11,229).BoththemasterdatafileandtheOhiosubsamplefilewerethenweighted(accordingtoBRFSSprotocols)asfollows:
FINALWT=STRWT*(1/IMPNPH)*NUMADULT*POSTSTR
10HealthyPeople2010informationcanberetrievedathttp://www.healthypeople.gov.11http://www.cdc.gov/BRFSS12Notethatthenationalsampleincludesrespondentsinallfiftystates,DC,andallUSterritories.

APPALACHIANRURALHEALTHINSTITUTE(ARHI)HealthNeedsAssessmentSurveyIII∙ResearchReport 11
whereSTRWTisstratumweight,IMPNPHisthenumberoftelephonenumbersperhousehold,NUMADULTSisthenumberofadultsinthehousehold,andPOSTSTRisthepost‐stratificationweightcomputedfromthe2000U.S.CensusofPopulationandHousingestimates.TheaccuracyofthereconstructedBRFSSweightswastestedbycomparingtheGVSweightedfrequencytabulationsforrandomlyselectedsurveyitemsagainstnationalandOhio2007BRFSStabulatedprevalencedatareportsretrievedfromtheBRFSSwebsite.

APPALACHIANRURALHEALTHINSTITUTE(ARHI)HealthNeedsAssessmentSurveyIII∙ResearchReport 12
(Thispagewasintentionallyleftblank.)

APPALACHIANRURALHEALTHINSTITUTE(ARHI)HealthNeedsAssessmentSurveyIII∙ResearchReport 13
Introduction
Inthefollowinganalysisofthesurveyresults,findingsfromtheninecountiesthatmakeuptheARHIIIIsurveyareaaredisplayedingraphs,providingcomparisonsamongeachcounty,theOhioandnational2007BRFSSrates,andtheHealthyPeople2010targetbenchmarks,whenavailable.PrevalenceratesacrosstheARHIIIIareprovidedinthetext.AllratecomparisonsbetweenARHIIIIandthe2007BRFSSareunadjusted.
AcomprehensivereviewofthesurveyresultsisprovidedwithinAppendixA.AppendixAconsistsofaseriesoftablesreportingtheweightedresponsedatafortheARHIIIIregionandeachcounty,aswellasthestandarderror,andupperandlowerconfidenceintervallimits(allconfidenceintervalsareatthealpha.05levelindicatinga95%confidencethatthetruepopulationmeanfallswithinthatrange).AppendixBprovidestheweighteddemographicsfortheentireARHIIIIregionaswellaseachcounty.
Comparisonsbetweengroupswerealwaysmadeatanalphalevelof.05.Therefore,allstatementsindicatingasignificantdifferencebetweengroupsorcategorylevelsidentifyastatisticallymeaningfuldifferencethatisatorbelowaprobabilitylevelofp≤.05.Forexample,thestatement“menaresignificantlymorelikelytoengageinregularvigorousexercise,”denotesastatisticallymeaningfuldifferenceinvigorousexerciseengagementbetweenmenandwomen.
Furtherstatisticalbreakdownsbeyondwhatisprovidedinthisreport–specificallycountybreakdownsforcombinedvariables–arenotpossibleduetothincellvalueswhichmaketheresultsunreliable.AtutorialisprovidedinAppendixDtodemonstratethislimitation.
DistributionoftheSurveySample
Between100and816surveyswerecollectedfromeachoftheninecounties.Thisrangereflectsthegreatvariationincountypopulationsize.Forexample,themostpopulatedcounty,Columbiana,has112,075residentsovertheageof18whiletheleastpopulatedcounty,Noble,has14,058adultresidents.BoththeweightedandunweightedfrequenciesreflectthesepopulationdifferencesandcanbefoundinAppendixC.
SURVEY FINDINGS

APPALACHIANRURALHEALTHINSTITUTE(ARHI)HealthNeedsAssessmentSurveyIII∙ResearchReport 14
(Thispagewasintentionallyleftblank.)

APPALACHIANRURALHEALTHINSTITUTE(ARHI)HealthNeedsAssessmentSurveyIII∙ResearchReport 15
Respondentsfirstansweredaquestionaboutgeneralhealthstatus.TheARHIIIIsurveyemployedthesamewordingandresponsecategoriesusedbytheBRFSS,allowingforthedirectcomparisonofweightedresponses.
Wouldyousaythatingeneralyourhealthisexcellent,verygood,good,fair,orpoor?
Figure1.GeneralHealthStatus
• AcrosstheARHIIIIcounties,fewerresidentsreportedtheirhealthasexcellent(16.7%)orverygood(32.9%)whencomparedtoratesfromtheOhio(18.6%and35.8%,respectively)orthenational2007BRFSS(20.3%and32.3%,respectively).
• Further,acrosstheARHIIIIcounties,moreresidentsreportthattheirhealthstatusisfair(14.9%)orpoor(5.4%)whencomparedtoratesfromtheOhio(11.8%and4.0%,respectively)orthenational2007BRFSS(12.2%and4.5%,respectively).
GENERAL HEALTH STATUS
!" #!" $!" %!" &!"
!"#$%%$&'
($)*+,--.
,--.
/01)
2--)
!"#$%$$$%% &#%'"())% %*+,-.+/%'"())
%'()"
%$(*"
%$(%"
#)(+"
#+(,"
$!(%"
$*()"
%!(#"
%!(&"
##()"
#&(*"
#$($"
&(!"
'(&"
&('"

APPALACHIANRURALHEALTHINSTITUTE(ARHI)HealthNeedsAssessmentSurveyIII∙ResearchReport 16
• AcrosstheARHIIIIcounties,individualsreportingtheirhealthasfairorpoorhadsignificantlyhigherratesofdisease(asthma,arthritis,diabetes,heartattack,heartdisease,highbloodpressure,andstroke)comparedtoindividualsreportingtheirhealthstatusasexcellentorverygood.13
• BodyMassIndex(BMI)14wasalsofoundtoberelatedtoself‐reportedhealthstatus,withobeseindividualssignificantlymorelikelytodescribetheirhealthasfairorpoorcomparedtohealthyweightindividuals.
13Thewordsignificantindicatedastatisticallymeaningfuldifferenceatanalphalevelof.05;pleaseseepage13forfurtherexplanation.14BMIwascalculatedusingtheguidelineslistedbytheCDC:[(weightinlbs)/(heightininches)2]*703.ThreeBMIcategorieswerecreated,combining“underweight”and“normal”BMIlevels,replicatingthethreecategoriesusedbytheBRFSS:healthyweight≤24.9,overweight25‐29.9,andobese≥30.Only1.79%ofrespondentsfellintothe“underweight”category,andthemajorityofthesewerewithin1pointofthe“normal”category.

APPALACHIANRURALHEALTHINSTITUTE(ARHI)HealthNeedsAssessmentSurveyIII∙ResearchReport 17
InordertodeterminetheprevalenceofcertainchronicdiseasesintheARHIIIIcounties,respondentswereaskedifadoctor,nurse,orotherhealthcareprofessionalhadevertoldthemthattheyhaveagivenchroniccondition.Thewordingandresponsecategoriesfortheseitemsmatchthe2007BRFSS,allowingforprevalencecomparisonsbetweentheARHIIIIcounties,thestateofOhio,andthenation.HealthyPeople2010targets,whereapplicable,arealsousedascomparisonbenchmarks.
Figure2.ExaminedHealthConditions
• AcrosstheARHIIIIcounties,therearenoticeablyhigherprevalenceratesofallchronicconditionssurveyedincomparisontotheOhioandnational2007BRFSSfindings,withtheexceptionofarthritis.ArthritisratesfortheARHIIIIregionandtheOhioBRFSSarecomparable,andbothexceedthenationalBRFSSrate.
EXAMINED HEALTH CONDITIONS
!" #!" $!" %!" &!"
'()"#$()"
*(+"
#%(#"#&(#"
#$('"
%$($"%$($"
$+('"
)(&",(%"
&($"
)(#"+(,"
&($"
%(#"&($"
$(,"
$*(&"%$($"
$,(,"
-./01213
43256/
!"#$"%&'
()*"#+!,*-.
71/829-.31/31
/#"0.)
7.:59;<==>9?8133@81
!1(2+222++ 3(+415//+ +6*&07*8+415//
APPALACHIANRURALHEALTHINSTITUTE(ARHI)HealthNeedsAssessmentSurveyIII∙ResearchReport 18
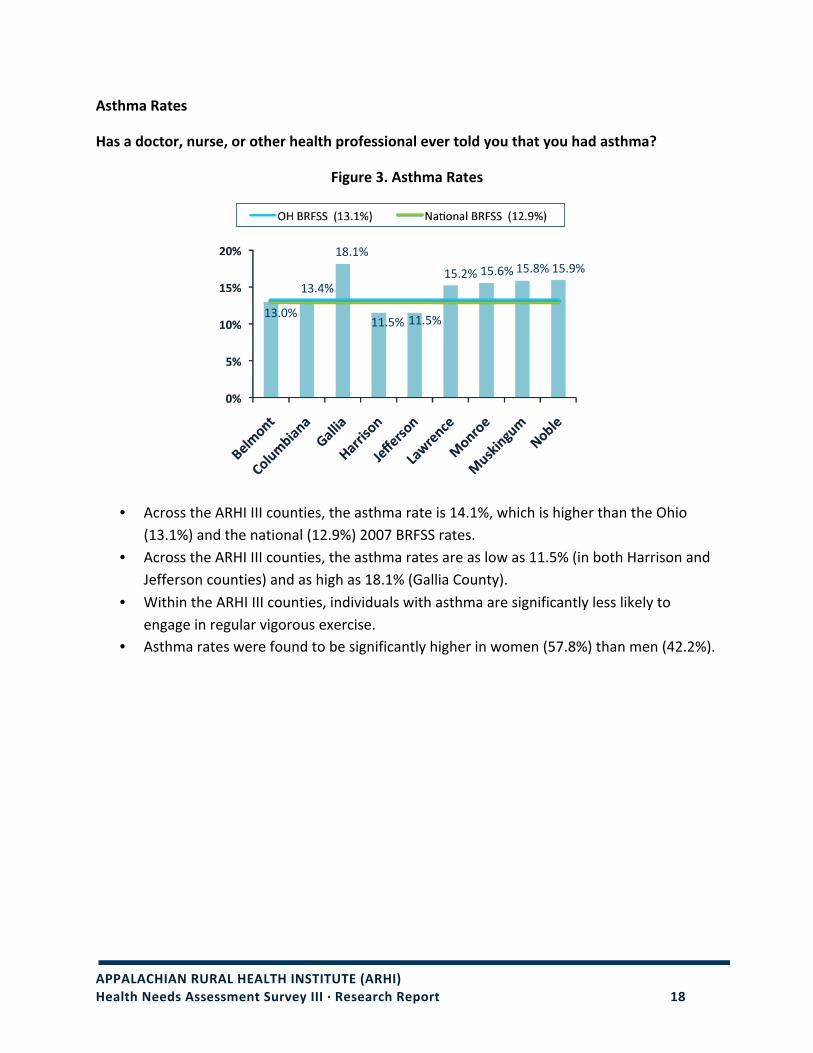
AsthmaRates
Hasadoctor,nurse,orotherhealthprofessionalevertoldyouthatyouhadasthma?
Figure3.AsthmaRates
• AcrosstheARHIIIIcounties,theasthmarateis14.1%,whichishigherthantheOhio(13.1%)andthenational(12.9%)2007BRFSSrates.
• AcrosstheARHIIIIcounties,theasthmaratesareaslowas11.5%(inbothHarrisonandJeffersoncounties)andashighas18.1%(GalliaCounty).
• WithintheARHIIIIcounties,individualswithasthmaaresignificantlylesslikelytoengageinregularvigorousexercise.
• Asthmarateswerefoundtobesignificantlyhigherinwomen(57.8%)thanmen(42.2%).
!"#$%
!"#&%
!'#!%
!!#(% !!#(%
!(#)% !(#*% !(#'% !(#+%

APPALACHIANRURALHEALTHINSTITUTE(ARHI)HealthNeedsAssessmentSurveyIII∙ResearchReport 19
ArthritisRates
Hasadoctor,nurse,orotherhealthprofessionalevertoldyouthatyouhadarthritis,rheumatoidarthritis,gout,lupusorfibromyalgia?
Figure4.ArthritisRates
• AcrosstheARHIIIIcounties,thearthritisrate(32.2%)isthesameastheOhio2007BRFSSrate(32.2%),bothofwhichareabovethenationalBRFSSrate(26.9%).
• AmongtheARHIIIIcounties,thelowestarthritisratewasreportedinNobleCounty(22.9%)andthehighestratewasfoundinMonroeCounty(38.6%).
• Witheachincreaseinagecategory,thelikelihoodofhavingarthritissignificantlyincreases.
• WitheachincreaseinBMIcategory,thelikelihoodofhavingarthritissignificantlyincreases.
• Arthritisratesweresignificantlyhigheramongwomen(56.6%)thanmen(43.4%).
!"#$%
&$#&%
!"#&% !'#$% !"#(%
!)#*%
!$#(%
!&#&%
&&#+%

APPALACHIANRURALHEALTHINSTITUTE(ARHI)HealthNeedsAssessmentSurveyIII∙ResearchReport 20
DiabetesRates
Haveyoueverbeentoldbyadoctor,nurse,orotherhealthcareprofessionalthatyouhaveproblemswithhighbloodsugarorthatyouhavediabetesorsugar?
Figure5.DiabetesRates
• TheprimaryfocusoftheARHIIIIResearchInitiativeistheprevalenceandtreatmentofdiabetes.ThisreportincludesresultsfromtheBRFSSdiabetesmodule,locatedwithinSpotlightonDiabetes,whichbeginsonpage27.
• AcrosstheAHRIIIIcounties,thediabetesrateis12.5%,whichexceedstheOhio(9.5%)andthenational(8.6%)2007BRFSSrates.
• WithintheARHIIIIcounties,thediabetesrateswereaslowas8.8%inNobleCountyandashighas16.0%inMonroeCounty.
• WitheachincreaseinBMIcategory,thelikelihoodofhavingdiabetessignificantlyincreases.
• Diabetesratesweresignificantlyhigheramongresidentswithhouseholdincomesbelow$25,000(49.2%)comparedtoresidentswithhouseholdincomesabove$35,000(36.3%).
!"#$%!$#&% !$#'%
!(#)% !&#!%!*#(%
!'#$%
!"#'%
+#+%

APPALACHIANRURALHEALTHINSTITUTE(ARHI)HealthNeedsAssessmentSurveyIII∙ResearchReport 21
HeartAttackRates
Hasadoctor,nurse,orotherhealthprofessionalevertoldyouthatyouhadaheartattackormyocardialinfarction?
Figure6.HeartAttackRates
• AcrosstheARHIIIIcounties,theheartattackrate(7.3%)ishigherthantheOhio(5.4%)andthenational(4.2%)2007BRFSSrates.
• AmongtheARHIIIIcounties,theheartattackratewasaslowas4.8%inNobleCountyandashighas13.5%inMonroeCounty.
• Regularlyengaginginanyamountofvigorousexercisesignificantlyreducesthelikelihoodofhavingaheartattack.
• Theheartattackrateforbothoverweight(36.9%)andobese(42.5%)individualsissignificantlyhigherthantherateforhealthyweightindividuals(20.6%).
• Heartattackratesweresignificantlyhigheramongmen(64.2%)thanwomen(35.8%).
!"#$
%"&$
!"'$
%"%$&"!$
("($
)'"%$
!"%$
#"*$

APPALACHIANRURALHEALTHINSTITUTE(ARHI)HealthNeedsAssessmentSurveyIII∙ResearchReport 22
HeartDiseaseRates
Hasadoctor,nurse,orotherhealthprofessionalevertoldyouthatyouhadheartdisease,suchashardeningofthearteriesoranginaorcoronaryheartdisease?
Figure7.HeartDiseaseRates
• AcrossARHIIIIcounties,theheartdiseaserate(6.7%)isgreaterthanboththeOhio(5.1%)andnational(4.2%)2007BRFSSrates.
• AcrosstheARHIIIIcounties,heartdiseaserateswereaslowas4.0%inNobleCountyandashighas8.9%inLawrenceCounty.
• Regularlyengaginginanyamountofvigorousexercisesignificantlyreducesthelikelihoodofhavingheartdisease.
• Witheachincreaseinagecategoryaftertheageof54,thelikelihoodofhavingheartdiseasesignificantlyincreases.
!"#$
%"&$
'"%$
%"($
'"%$
!")$
'")$ '")$
*"#$

APPALACHIANRURALHEALTHINSTITUTE(ARHI)HealthNeedsAssessmentSurveyIII∙ResearchReport 23
StrokeRates
Hasadoctor,nurse,orotherhealthprofessionalevertoldyouthatyouhadastroke?
Figure8.StrokeRates
• AcrosstheARHIIIIcounties,thestrokerate(4.2%)isabovetheOhio(3.1%)andthenational
(2.7%)BRFSSrates.
• AcrosstheARHIIIIcounties,thestrokeratesareaslowas2.3%inNobleCountyandashighas6.1%inMonroeCounty.
• WithintheARHIIIIregion,fivecounties(Columbiana,Jefferson,Lawrence,MonroeandMuskingum)haveastrokerateabove4.0%.
• Regularlyengaginginanyamountofvigorousexercisesignificantlyreducesthelikelihoodofhavingastroke.
• Individualsovertheageof54aresignificantlymorelikelytohaveastrokethanyoungerindividuals.
!"#
$"#
%"#
&"#
'"#
()*+,-.#
/,*0+123-3#
43**23#
536627,-#
8)9)67,-#
:3;6)-<)#
=,-6,)#
=07>2-?0+#
@,1*)#
A.6,>)##
B3.)7#
!"#$%&''##()*+,-# ./012/3#$%&''##(4*5,-#
!"#$ %"&$ !"'$
!"&$
%"($)"*$
("&$
%"&$
*"!$
!"#
$"#
%"#
&"#
'"#
()*+,-.#
/,*0+123-3#
43**23#
536627,-#
8)9)67,-#
:3;6)-<)#
=,-6,)#
=07>2-?0+#
@,1*)#
A.6,>)##
B3.)7#
!"#$%&''##()*+,-# ./012/3#$%&''##(4*5,-#

APPALACHIANRURALHEALTHINSTITUTE(ARHI)HealthNeedsAssessmentSurveyIII∙ResearchReport 24
HighBloodPressureRates
Hasadoctor,nurse,orotherhealthprofessionalevertoldyouthatyouhadhighbloodpressure,alsocalledhypertension?
Figure9.HighBloodPressureRates
• AcrosstheARHIIIIcounties,therateofhighbloodpressure(32.2%)isabovetheOhio(28.4%)andthenational(27.7%)2007BRFSSrates.
• TheHealthyPeople2010targetrateforhighbloodpressureis16.0%.NoneoftheARHIIIIcountiesaremeetingthisHealthyPeople2010target.
• AcrosstheARHIIIIcounties,thehighbloodpressureratesareaslowas21.1%inNobleCountyandashighas41.5%inMonroeCounty.
• WitheachincreaseinBMIcategory,thelikelihoodofhavinghighbloodpressuresignificantlyincreases.
• Witheachincreaseinagecategoryaftertheageof34,thelikelihoodofhavinghighbloodpressuresignificantlyincreases.
!"#$%!&#'%!!#(%
!&#"%!&#'%!)#*%
+"#)%
!!#!%
,"#"%

APPALACHIANRURALHEALTHINSTITUTE(ARHI)HealthNeedsAssessmentSurveyIII∙ResearchReport 25
HighBloodPressureMedicationUse
Ifyouhavebeentoldyouhavehighbloodpressure,areyounowtakingprescribedmedicationforyourhighbloodpressure?
Figure10.HighBloodPressureMedicationUse
• AcrosstheARHIIIIcounties,therateofmedicationuseforhighbloodpressure(71.1%)islowerthantheOhio(81.1%)andthenational(78.9%)2007BRFSSrates.
• WithintheARHIIIIcounties,therateofhighbloodpressuremedicationuseisaslowas56.5%inGalliaCountyandashighas89.2%inMonroeCounty.
• Highbloodpressuremedicationuseissignificantlyhigheramongwomen(77.3%)thanmen(65.0%).
!"#"$
%&#'$"%#"$
%(#!$!"#)$!*#&$
*(#)$
!+#'$!%#)$

APPALACHIANRURALHEALTHINSTITUTE(ARHI)HealthNeedsAssessmentSurveyIII∙ResearchReport 26
HighCholesterolRates15
Ifyouhaveeverhadyourcholesterolcheckedwithabloodtest,haveyoueverbeentoldbyadoctor,nurseorotherhealthprofessionalthatyourbloodcholesterollevelwashigh?
Figure11.HighCholesterolRates
• AcrosstheARHIIIIcounties,81.2%ofrespondentsreportedhavinghadatesttochecktheircholesterollevels.Amongtheseresidents,therateofhighcholesterolis38.4%.
• TheHealthyPeople2010targetrateforhighcholesterolis17.0%.AllARHIIIIcountiesfailedtomeetthetarget.
• AcrosstheARHIIIIcounties,theratesofhighcholesterolrangebetween33.9%inNobleCountyand43.3%inGalliaCounty.
15TheARHIIIIquestionlimitsrespondentstoindividualswhohavehadabloodtesttoconfirmtheircholesterollevels;theBRFSSquestionlimitsrespondentstoindividualswhohavehadabloodtestwithinthepreviousfiveyears.Therefore,itisnotappropriatetocomparetheBRFSSbenchmarkstotheARHIIIIdata.
!"#$%&$#'%
!&#&%
&$#(% &)#$% &*#+%!&#,%
&(#&% &&#*%

APPALACHIANRURALHEALTHINSTITUTE(ARHI)HealthNeedsAssessmentSurveyIII∙ResearchReport 27
TheprimaryfocusoftheARHIIIIistheprevalenceandtreatmentofdiabetes.ThequestionsincludedaboutdiabetesmatchtheitemsinthediabetesmoduleoftheBRFSSwiththefollowingexception:inordertoaccommodatelocalvocabulary,theword“sugar”wasaddedtotheoriginalBRFSSquestions.SimilartotheBRFSSdiabetesmodule,femalerespondentsindicatingthattheyhavebeendiagnosedashavingdiabeteswerescreenedtodetermineiftheyhadonlybeendiagnosedashavingdiabetesduringpregnancy.Femaleswithonlygestationaldiabeteswerenotincludedinthediabetesratesandwerenotaskedfurtherdiabetes‐relatedquestions.Finally,becauseOhiodidnotconducttheBRFSSdiabetesmodulein2007,statewidecomparisonsareunavailable.
• AcrosstheARHIIIIcounties,thediabetesrate(12.5%)iswellabovetheOhiorate(9.5%)andthenationalrate(8.6%).
ComorbidConditions
Withintheproportionofpeoplewhohaveachronichealthcondition,thereisanincreasedlikelihoodofalsohavingdiabetes.
• Amongindividualswithasthma,thereisasignificantlyhigherlikelihoodofhavingdiabetes.
• Amongindividualswitharthritis,thereisasignificantlyhigherlikelihoodofhavingdiabetes.
• Amongindividualswhohavesufferedaheartattack,thereisasignificantlyhigherlikelihoodofhavingdiabetes.
• Amongindividualswithheartdisease,thereisasignificantlyhigherlikelihoodofhavingdiabetes.
• Amongindividualswithstroke,thereisasignificantlyhigherlikelihoodofhavingdiabetes.
• Amongindividualswithhighbloodpressure,thereisasignificantlyhigherlikelihoodofhavingdiabetes.
• Amongindividualswhohavehadabloodtestthatdiagnosedthemashavinghighcholesterol,thereisasignificantlyhigherlikelihoodofhavingdiabetes.
SPOTLIGHT ON DIABETES

APPALACHIANRURALHEALTHINSTITUTE(ARHI)HealthNeedsAssessmentSurveyIII∙ResearchReport 28
DiabetesDiagnosisBeforeAge40
Howoldwereyouwhenyouweretoldthatyouhavediabetesorhighbloodsugar,orthatyouhavediabetesorsugar?
Figure12.DiabetesDiagnosisBeforeAge40
• AcrossARHIIIIcounties,therateofdiabetesdiagnosisbeforetheageof40is49.2%,whichgreatlyexceedsthenationalrateof19.0%.16
• AcrosstheARHIIIIcounties,therateofdiabetesdiagnosisbeforetheageof40wasaslowas27.4%inHarrisonCountyandwasashighas60.4%inNobleCounty.
16Thisnationalrateisfromthe2007NationalHealthInterviewSurvey(NHIS).Thisdatacanbereviewedathttp://www.cdc.gov/diabetes/statistics/age/fig1.htm
!"#$%
&"#'%
()#!%
*+#!%
&*#"% &!#,%
('#+%
&&#$%$"#!%

APPALACHIANRURALHEALTHINSTITUTE(ARHI)HealthNeedsAssessmentSurveyIII∙ResearchReport 29
DailyBlood‐GlucoseTesting
Abouthowoftendoyouusuallycheckyourbloodforglucoseorsugar?Includethetimeswhenitwascheckedbyafamilymemberorfriend,butdonotincludetimeswhenitwascheckedbyahealthcareprofessional.
Figure13.DailyBlood‐GlucoseTesting
• AmongtheARHIIIIcounties,71.9%ofresidentslivingwithdiabeteschecktheirblood‐glucoselevelsatleastonceaday,whichexceedsthenational2007BRFSSrateof61.4%.
• TheHealthyPeople2010targetratefordailyblood‐glucosetestingis60.0%.AllARHIIIIcountiesmetthisHealthyPeople2010target.
• AmongtheARHIIIIcounties,therangeofdaily‐glucosetestingisbetween65.3%inLawrenceCountyand84.1%inNobleCounty.
!!"#$!%"#$
&'"($!#"#$
!)"'$
&'"*$ &&"+$ &,")$
,("+$

APPALACHIANRURALHEALTHINSTITUTE(ARHI)HealthNeedsAssessmentSurveyIII∙ResearchReport 30
DiabetesPillUse
Doyouregularlyusediabetespills?
Figure14.RegularDiabetesPillUse
• AmongARHIIIIcounties,therateofregulardiabetespilluseis67.2%,whichisbelowthenational2007BRFSSrateof70.2%.
• AcrosstheARHIIIIcounties,regulardiabetespillusevariedconsiderablywithratesaslowas50.5%(MuskingumCounty)andashighas94.9%(NobleCounty).
!"#"$
%&#!$'(#!$
)%#"$ )&#!$
%"#&$
!*#'$
'+#'$
("#($

APPALACHIANRURALHEALTHINSTITUTE(ARHI)HealthNeedsAssessmentSurveyIII∙ResearchReport 31
InsulinUse
Doyoutakeinsulinshotsoruseaninsulinpump?
Figure15.RegularInsulinUse
• AmongARHIIIIcounties,therateofregularinsulinuseis28.4%,whichisslightlyabovethenational2007BRFSSrateof26.8%.
• WithintheARHIIIIcounties,therateofregularinsulinusewasaslowas17.3%inGalliaCountyandashighas47.2%inMonroeCounty.
!"#$%
&'#(%
)"#!%
&"#"%
!*#)%
)"#+%
*"#&%
&*#*%
*&#*%

APPALACHIANRURALHEALTHINSTITUTE(ARHI)HealthNeedsAssessmentSurveyIII∙ResearchReport 32
DiabetesClassAttendance
Haveyouevertakenacourseorclassonhowtomanageyourdiabetesyourself?
Figure16.DiabetesClassAttendance
• AmongtheARHIIIIcounties,therateofresidentslivingwithdiabeteswhohavetakenadiabetesmanagementclass,46.4%,isbelowthenationalrateof55.1%.
• TheHealthyPeople2010targetratefordiabetes‐managementcourseattendanceis60.0%.OnlytwoARHIIIIcounties(HarrisonandNoble)havemetthistarget.
• AmongtheARHIIIIcounties,therateofdiabetes‐managementcourseattendanceisaslowas34.3%inColumbianaCountyandashighas79.0%inNobleCounty.
!"#$%
&'#&% &(#(%
((#"%
!)#*%
&*#(%'(#)%
!(#*%
*+#"%

APPALACHIANRURALHEALTHINSTITUTE(ARHI)HealthNeedsAssessmentSurveyIII∙ResearchReport 33
AnnualDiabetes‐RelatedDoctorVisit
Abouthowmanytimesinthepast12monthshaveyouseenadoctor,nurse,orotherhealthcareprofessionalforyourdiabetes,highbloodsugar,orsugar?
Figure17.AnnualDiabetes‐RelatedDoctorVisit
• AmongtheARHIIIIcounties,therateofannualdiabetes‐relateddoctorvisitsis95.0%,whichexceedsthenationalrateof85.2%.
• Therangeofannualdiabetes‐relateddoctorvisitsisbetween88.4%inMonroeCountyand100%inNobleCounty.
!"#$%!$#&%
!"#'%!(#!%
!'#&%
&&#)%
!"#)%(**#*%
!""#
$"#
%"#
!"#
"#
!(#*%
= = = = = = = = = =

APPALACHIANRURALHEALTHINSTITUTE(ARHI)HealthNeedsAssessmentSurveyIII∙ResearchReport 34
AnnualDentalVisitandDiabetes
Figure18.AnnualDentalVisitandDiabetes
• AmongtheARHIIIIcounties,therateofARHIIIIresidentslivingwithdiabeteswhohaveseenadentistatleastonceinthelast12monthsis58.2%.
• TheHealthyPeople2010targetrateforannualdentalvisitsamongpeoplelivingwithdiabetesis75.0%.NoneoftheARHIIIIcountiesaremeetingtheHealthyPeopletargetrate.
• AcrosstheARHIIIIcounties,therateofannualdentalexamsamongpeoplelivingwithdiabetesisaslowas40.1%inNobleCountyandashighas62.5%inHarrisonCounty.
!"#$%&!#'%
&"#$%
!"#&%&(#)% !*#'%
+$#'%
&(#&%
+*#)%

APPALACHIANRURALHEALTHINSTITUTE(ARHI)HealthNeedsAssessmentSurveyIII∙ResearchReport 35
CostRestrictingDiabetesCare
Doescosteverkeepyoufromseeingthedoctoronaregularbasisforyourdiabetes?
Figure19.CostRestrictingDoctorVisit
• AmongtheARHIIIIcounties,therateofpersonslivingwithdiabeteswhocouldnotaffordadiabetes‐relateddoctorvisitwas26.3%.
• TheHealthyPeople2010targetistoreducetherateofindividualsexperiencingdelaysordifficultiesobtaininghealthcareto7.0%.17AllARHIIIIcountiesfailedtomeetthistarget.
• WithintheARHIIIIcounties,therateofcostrestrictionsondiabetes‐relateddoctorvisitswasaslowas9.2%inNobleCountyandashighas52.8%inGalliaCounty.
17ThisHealthyPeople2010targetreferstoalltypesofhealthcareaccessandisusedasabenchmarkacrossindividualhealthcareaccessitemsinthisreport.
!"#$% !"#&%
"!#'%
$&#&%$'#&%
!!#"%
()#&%
(*#(%
)#!%

APPALACHIANRURALHEALTHINSTITUTE(ARHI)HealthNeedsAssessmentSurveyIII∙ResearchReport 36
Doescosteverkeepyoufromregularlytakingyourprescribeddiabetespillsorinsulin?
Figure20.CostRestrictingMedication
• AmongtheARHIIIIcounties,therateofresidentslivingwithdiabeteswhocannotafforddiabetesmedicationis16.9%.
• TheHealthyPeopletargetistoreducetherateofpersonshavingdifficultyordelaysingettinghealthcareto7.0%.NoneoftheAHRIIIIcountieshavemetthistarget.
• AmongtheARHIIIIcounties,therateofindividualsunabletoafforddiabetesmedicationisbetween8.1%inHarrisonCountyand35.1%inMonroeCounty.
!"#$% !&#'%
"$#(%
)#!%!"#!% !&#*%
&+#!%
"'#(%
!$#&%
APPALACHIANRURALHEALTHINSTITUTE(ARHI)HealthNeedsAssessmentSurveyIII∙ResearchReport 37
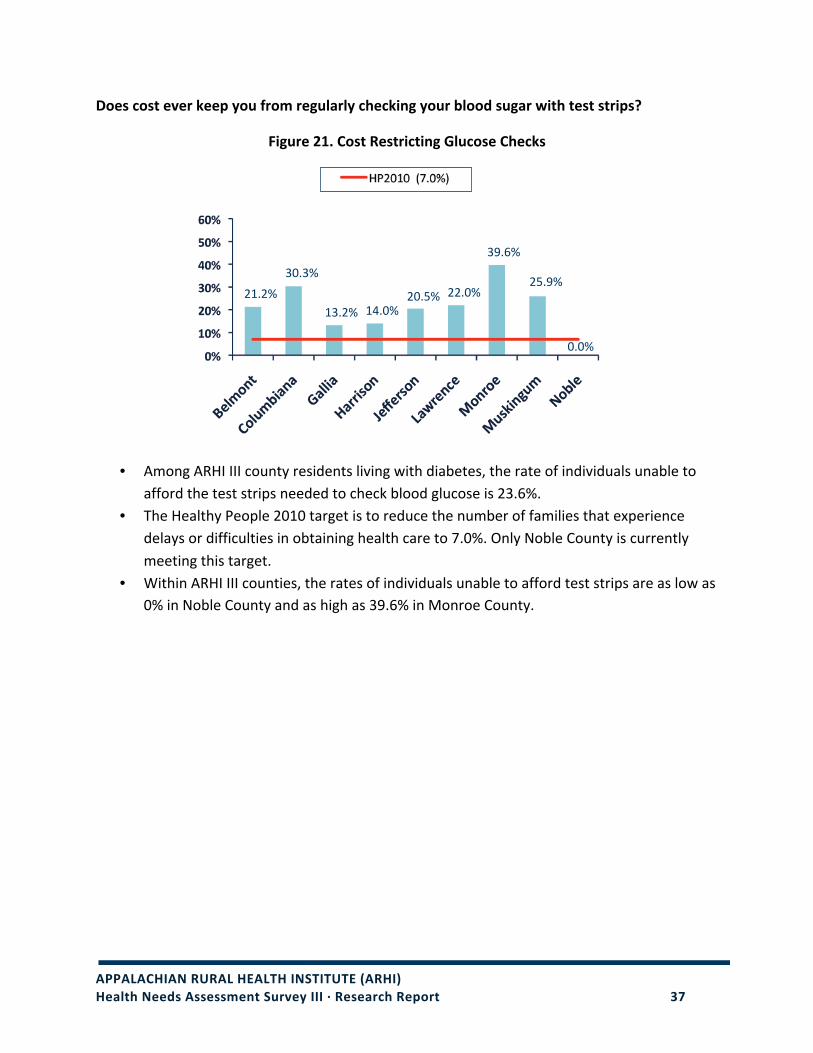
Doescosteverkeepyoufromregularlycheckingyourbloodsugarwithteststrips?
Figure21.CostRestrictingGlucoseChecks
• AmongARHIIIIcountyresidentslivingwithdiabetes,therateofindividualsunabletoaffordtheteststripsneededtocheckbloodglucoseis23.6%.
• TheHealthyPeople2010targetistoreducethenumberoffamiliesthatexperiencedelaysordifficultiesinobtaininghealthcareto7.0%.OnlyNobleCountyiscurrentlymeetingthistarget.
• WithinARHIIIIcounties,theratesofindividualsunabletoaffordteststripsareaslowas0%inNobleCountyandashighas39.6%inMonroeCounty.
!"#!$
%&#%$
"%#!$ "'#&$
!&#($ !!#&$
%)#*$
!(#)$
&#&$

APPALACHIANRURALHEALTHINSTITUTE(ARHI)HealthNeedsAssessmentSurveyIII∙ResearchReport 38
(Thispagewasintentionallyleftblank.)

APPALACHIANRURALHEALTHINSTITUTE(ARHI)HealthNeedsAssessmentSurveyIII∙ResearchReport 39
TheARHIIIISurveycontaineditemsrelatedtofourriskfactorsassociatedwithchronicdisease:bodymassindex,activitylevel,smoking,andself‐reporteddepressedmood.Eachfactorisdescribedinmoredetailbelow.
BodyMassIndex
Respondentswereaskedtheirweightandheightinordertocalculatetheirbodymassindex(BMI),ameasureofbodyfat.UsingtheCDCguidelinestocalculateBMI,threecategorieswerethencreatedinagreementwiththe2007BRFSS.IndividualswerecategorizedasobeseiftheirBMIwas30orabove;overweightifBMIlevelsfellbetween25and29.9.ThoughtheCDCcategorizesindividualswithaBMIunder18.5asunderweight,theBRFSScombinestheseindividualswiththoseinthenormalrange(18.6to24.9).Thus,thethirdcategory,referredtoashealthyweight,wasassignedtoindividualswithaBMIunder24.9.18
ActivityLevel
HealthyPeople2010hassetregular‐exercisebenchmarksforbothmoderateexerciseandvigorousexercise.Whetherornotrespondentsregularlyengagedineitherlevelofexercisewasfirstdeterminedbeforethefrequencyofengagementwasrecorded.
Smoking
Theuseoftobaccoproductsisarecognizedriskfactorforavarietyofillnessesincludingheartdisease,stroke,andhighbloodpressure.Onlysmokingbehavior,andnotsmokelesstobaccouse,wasinvestigatedintheARHIIIIand2007BRFSS.
Self‐ReportedDepressedMood
Depressedmoodwasusedasageneralmeasureofmentalwellbeing,whichhasbeenshowntobeimportantpartofphysicalhealth.
18Lessthan1.8%oftheentireARHIIIIsamplehadaBMIunder18.5,andthemajorityofthoseindividualswerewithin1pointofnormal.
RISK FACTORS

APPALACHIANRURALHEALTHINSTITUTE(ARHI)HealthNeedsAssessmentSurveyIII∙ResearchReport 40
RateofHealthyWeight
Figure22.RateofHealthyWeight
• AcrossARHIIIIcounties,therateofhealthyweightindividualswas34.0%,whichisbelowtheOhio(36.5%)andthenational2007BRFSSrates(35.6%).
• TheHealthyPeople2010targetrateforhealthyweightadultsis60.0%.NoneoftheARHIIIIcountieshasmetthistarget.
• AmongtheARHIIIIcounties,therateofresidentsatahealthyweightwaslowestinMonroeCounty(20.8%)andhighestinHarrisonCounty(37.3%).
• Peopleatahealthyweight(i.e.,BMIbelow25)weresignificantlylesslikelytohavediabetes,arthritis,heartattack,heartdisease,highcholesterol,andhighbloodpressure.
!"#$% !&#'% !&#'%
!(#!%
!"#&% !)#"%
'*#$%
!&#+% !!#*%

APPALACHIANRURALHEALTHINSTITUTE(ARHI)HealthNeedsAssessmentSurveyIII∙ResearchReport 41
RateofObesity
Figure23.RateofObesity
• AmongtheARHIIIIcounties,therateofobesityis30.7%,whichisabovetheOhiorate(28.1%)andthenationalrate(25.1%).
• TheHealthyPeople2010targetrateforobesityis15.0%.NoneoftheARHIIIIcountiesaremeetingthistarget.
• AmongtheARHIIIIcounties,theobesityratesrangedbetween27.6%inNobleCountyand37.5%inMonroeCounty.
• Individualswhoareobese(i.e.,BMIatorabove30)weresignificantlymorelikelytohavediabetes,arthritis,heartattack,heartdisease,highcholesterol,andhighbloodpressurethanhealthyweightindividuals.
• Obeseindividuals(24.0%)weresignificantlylesslikelytobemeetingtheHealthyPeople2010goalforweeklymoderateexercisecomparedtooverweight(36.6%)andhealthyweightindividuals(39.5%).
• Obeseindividuals(21.4%)weresignificantlylesslikelytobemeetingtheHealthyPeople2010goalforweeklyvigorousexercisecomparedtooverweight(35.2%)andhealthyweightindividuals(43.3%).
• Obeseindividuals(42.9%)weresignificantlymorelikelytoreportfeelingdepressedwithinthelastmonththanindividualswhowereoverweight(35.1%)oratahealthyweight(37.0%).
!"#!$ !%#&$
!'#%$
(!#)$(&#'$ (!#*$('#+$
((#*$
!'#)$

APPALACHIANRURALHEALTHINSTITUTE(ARHI)HealthNeedsAssessmentSurveyIII∙ResearchReport 42
ModerateExercise
Pleasethinkaboutthemoderateactivitiesyoudowhenyouarenotworking.Inausualweekdoyoudomoderateactivitiessuchasbriskwalking,bicycling,vacuuming,gardening,oranythingelsethatcausessmallincreasesinbreathingorheartrateforatleast20minutesatatime?
Ifyes,howmanydaysperweekdoyoudomoderateactivitiesforatleast20minutesatatime?
Figure24.5DaysorMoreofWeeklyModerateExercise
• AmongtheARHIIIIcounties,therateofengaginginanyamountofmoderateexerciseduringaregularweekis77.0%.
• TheHealthyPeople2010targetistoincreasethepercentofindividualsperformingmoderateexercisefiveormoredaysaweekto30.0%.AmongallARHIIIIrespondents,35.6%reportperformingmoderateexercisefiveormoredaysaweek.
• AllARHIIIIcountiesaremeetingtheHealthyPeople2010target.• AmongtheARHIIIIcounties,theratesofmoderateexerciseperformedfiveormore
daysaweekwereaslowas32.4%inMuskingumCountyandashighas44.8%inHarrisonCounty.
• ARHIIIIresidentswhoaremeetingtheHealthyPeople2010goalformoderateexercisearesignificantlylesslikelytoreporthavingarthritis,diabetes,aheartattack,heartdisease,highbloodpressure,highcholesterol(asdeterminedbyabloodtest),andstroke.
!!"#$ !%"&$
''"($ ''")$
!*"'$ !*"#$ !*")$!("'$ !!"+$

APPALACHIANRURALHEALTHINSTITUTE(ARHI)HealthNeedsAssessmentSurveyIII∙ResearchReport 43
• ARHIIIIresidentswhoaremeetingtheHealthyPeople2010goalformoderateexercisearesignificantlylesslikelytobeobese.

APPALACHIANRURALHEALTHINSTITUTE(ARHI)HealthNeedsAssessmentSurveyIII∙ResearchReport 44
VigorousExercise
Thinkaboutthevigorousactivitiesyoudowhenyouarenotworking.Inausualweekdoyoudovigorousactivitiessuchasrunning,aerobics,heavyyardwork,oranythingelsethatcauseslargeincreasesinbreathingorheartrateforatleast20minutesatatime?
Ifyes,howmanydaysperweekdoyoudovigorousactivityforatleast20minutesatatime?
Figure25.3DaysofMoreofWeeklyVigorousExercise
• AmongtheARHIIIIcounties,therateofengaginginanyamountofvigorousexerciseduringaregularweekis42.7%.
• TheHealthyPeople2010targetistoincreasethepercentofindividualsperformingvigorousexercisethreeormoredaysaweekto30.0%.AmongallARHIIIIrespondents,27.0%performvigorousexercisethreeormoredaysaweek.
• OnlytwoARHIIIIcounties(HarrisonandNoble)aremeetingtheHealthyPeople2010target.
• AmongtheARHIIIIcounties,theratesofengagementinvigorousexercisethreeormoredaysaweekwereaslowas24.6%inLawrenceCountyandashighas35.6%inNobleCounty.
• ARHIIIIresidentswhoaremeetingtheHealthyPeople2010goalforvigorousexercisearesignificantlylesslikelytoreporthavingarthritis,diabetes,aheartattack,heartdisease,highbloodpressure,highcholesterol(asdeterminedbyabloodtest),andstroke.
• ARHIIIIresidentswhoaremeetingtheHealthyPeople2010goalforvigorousexercisearesignificantlylesslikelytobeoverweightorobese.
!"#$% !"#"% !&#"%
'(#)%
!*#$% !+#)%!&#&%
!*#(%
'*#)%

APPALACHIANRURALHEALTHINSTITUTE(ARHI)HealthNeedsAssessmentSurveyIII∙ResearchReport 45
• Witheachincreaseinagecategoryaftertheageof44,thelikelihoodofmeetingtheHealthyPeople2010goalforvigorousexercisesignificantlydecreases.
• Males(33.4%)aresignificantlymorelikelytobemeetingtheHealthyPeople2010goalforvigorousexercisecomparedtofemales(21.1%).

APPALACHIANRURALHEALTHINSTITUTE(ARHI)HealthNeedsAssessmentSurveyIII∙ResearchReport 46
Haveyousmoked100cigarettesinyourentirelife?
Figure26.Smoked100Cigarettes
• AmongARHIIIIcounties,therateofresidentssmoking100cigarettesormoreintheirlifetime(47.7%)isapproximatelythesameastheOhio(47.9%)andhigherthanthenational(43.4%)2007BRFSSrates.
• Havingsmokedatleast100cigarettessignificantlyincreasedthelikelihoodofhavingdiabetes,aheartattack,andheartdisease.
!"#"$ !%#&$
'&#&$!(#)$
')#!$ !*#!$ ')#&$
!'#)$+*#+$

APPALACHIANRURALHEALTHINSTITUTE(ARHI)HealthNeedsAssessmentSurveyIII∙ResearchReport 47
Ifyouhavesmokedatleast100cigarettesinyourentirelife,doyounowsmokeeveryday,somedays,ornotatall?
Figure27.CurrentSmokers
• Currentsmokerswerecategorizedasindividualswhohavesmokedmorethan100cigarettesintheirlifetimeandcontinuetosmoke“everyday”or“somedays.”
• AmongtheAHRIIIIcounties,therateofcurrentsmokersis25.6%,whichgreatlyexceedsthenationalrateof19.3%.
• TheHealthyPeople2010targetistoreducethecurrentsmokingpopulationto12.0%.AllARHIIIIcountieshavefailedtomeetthistarget.
• AmongtheARHIIIIcounties,therateofcurrentsmokerswasaslowas23.3%(MuskingumCounty)andashighas29.1%(inbothGalliaandHarrisoncounties).
!"#!$ !%#&$
!'#($ !'#($ !)#&$ !*#'$
!%#*$ !%#%$
!)#)$
APPALACHIANRURALHEALTHINSTITUTE(ARHI)HealthNeedsAssessmentSurveyIII∙ResearchReport 48
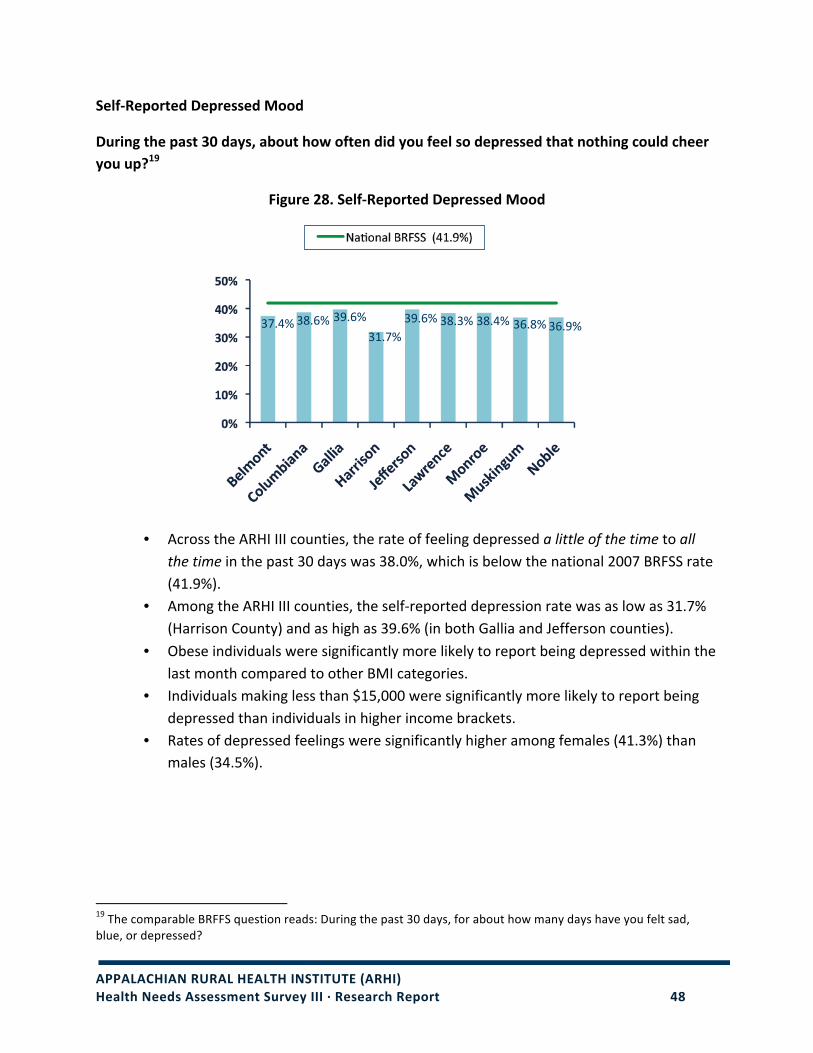
Self‐ReportedDepressedMood
Duringthepast30days,abouthowoftendidyoufeelsodepressedthatnothingcouldcheeryouup?19
Figure28.Self‐ReportedDepressedMood
• AcrosstheARHIIIIcounties,therateoffeelingdepressedalittleofthetimetoallthetimeinthepast30dayswas38.0%,whichisbelowthenational2007BRFSSrate(41.9%).
• AmongtheARHIIIIcounties,theself‐reporteddepressionratewasaslowas31.7%(HarrisonCounty)andashighas39.6%(inbothGalliaandJeffersoncounties).
• ObeseindividualsweresignificantlymorelikelytoreportbeingdepressedwithinthelastmonthcomparedtootherBMIcategories.
• Individualsmakinglessthan$15,000weresignificantlymorelikelytoreportbeingdepressedthanindividualsinhigherincomebrackets.
• Ratesofdepressedfeelingsweresignificantlyhigheramongfemales(41.3%)thanmales(34.5%).
19ThecomparableBRFFSquestionreads:Duringthepast30days,forabouthowmanydayshaveyoufeltsad,blue,ordepressed?
!"#$% !&#'% !(#'%
!)#"%
!(#'% !&#!% !&#$% !'#&% !'#(%

APPALACHIANRURALHEALTHINSTITUTE(ARHI)HealthNeedsAssessmentSurveyIII∙ResearchReport 49
SinglePrimaryCarePhysician
Doyouhaveonepersonyouthinkofasyourpersonaldoctororhealthcareprovider?
Figure29.SinglePrimaryCarePhysician
• AmongtheARHIIIIcounties,therateofresidentsthathaveasingleprimaryphysicianis80.2%,whichisabovetheOhiorate(79.5%)andthenationalrate(71.9%).
• TheHealthyPeople2010targetrateforindividualsthathaveasingleprimarycarephysicianis85.0%.NoneoftheARHIIIIcountieshavemetthisHealthyPeople2010target.
• AmongtheARHIIIIcounties,therateofresidentsthathaveasingleprimaryphysicianrangesbetween73.9%inLawrenceCountyand83.9%inColumbianaCounty.
HEALTH CARE ACCESS
!"#$% !"#&%
'$#(%
!)#$%
()%
!)%
')%
")%
)%
'(#"%
!&#&%!$#(%
'*#(%''#(%
= = = = = = = = ==
APPALACHIANRURALHEALTHINSTITUTE(ARHI)HealthNeedsAssessmentSurveyIII∙ResearchReport 50
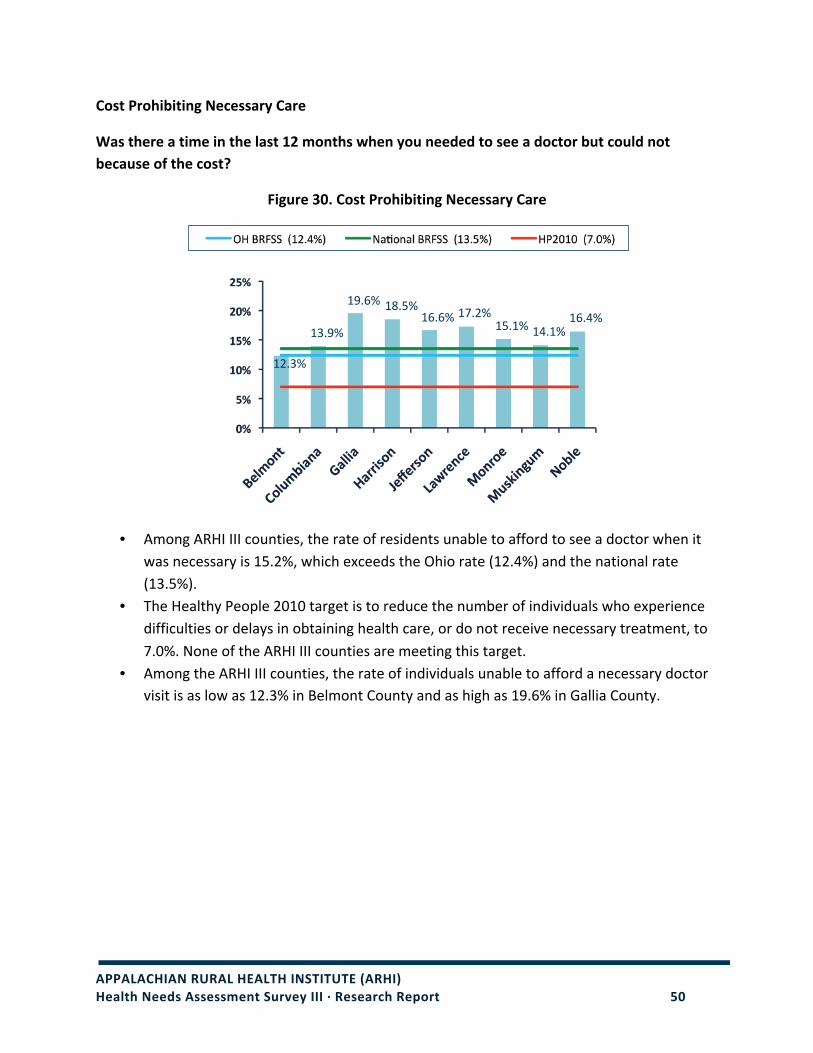
CostProhibitingNecessaryCare
Wasthereatimeinthelast12monthswhenyouneededtoseeadoctorbutcouldnotbecauseofthecost?
Figure30.CostProhibitingNecessaryCare
• AmongARHIIIIcounties,therateofresidentsunabletoaffordtoseeadoctorwhenitwasnecessaryis15.2%,whichexceedstheOhiorate(12.4%)andthenationalrate(13.5%).
• TheHealthyPeople2010targetistoreducethenumberofindividualswhoexperiencedifficultiesordelaysinobtaininghealthcare,ordonotreceivenecessarytreatment,to7.0%.NoneoftheARHIIIIcountiesaremeetingthistarget.
• AmongtheARHIIIIcounties,therateofindividualsunabletoaffordanecessarydoctorvisitisaslowas12.3%inBelmontCountyandashighas19.6%inGalliaCounty.
!"#$%
!$#&%
!&#'% !(#)%!'#'% !*#"%
!)#!%!+#!%
!'#+%

APPALACHIANRURALHEALTHINSTITUTE(ARHI)HealthNeedsAssessmentSurveyIII∙ResearchReport 51
AnnualDentalVisit
Howlonghasitbeensinceyoulastvisitedadentistoradentalclinicforanyreason?
Figure31.AnnualDentalVisit
• AmongtheARHIIIIcounties,therateofannualdentalvisitsis69.5%.• TheHealthyPeople2010targetrateforannualdentalvisitsis56.0%.EveryARHIIII
countyhasmetthisHealthyPeople2010target.• AmongARHIIIIcounties,therateofannualdentalvisitsrangebetween59.1%inNoble
Countyand72.9%inBelmontCounty.
!"#
$!"#
%!"#
&!"#
'!"#
()*+,-.#
/,*0+123-3#
43**23#
536627,-#
8)9)67,-#
:3;6)-<)#
=,-6,)#
=07>2-?0+#
@,1*)#
A--03*##
B)-.3*#C272.#
!"#$%$&&'()*$+,&
!"#$%&'#(%
&)#*%&&#+%
!)#"%!"#!%&$#+%!)#'%
+$#*%
!"#
$!"#
%!"#
&!"#
'!"#
()*+,-.#
/,*0+123-3#
43**23#
536627,-#
8)9)67,-#
:3;6)-<)#
=,-6,)#
=07>2-?0+#
@,1*)#
A--03*##
B)-.3*#C272.#
!"#$%$&&'()*$+,&

APPALACHIANRURALHEALTHINSTITUTE(ARHI)HealthNeedsAssessmentSurveyIII∙ResearchReport 52
InsuranceCoverage
Doyouhaveanykindofhealthcareinsuranceatthistime?
Figure32.InsuranceCoverage
• AmongARHIIIIcounties,therateofresidentswithinsurancecoverageis85.9%,whichisbetweentheOhiorate(88.2%)andthenationalrate(84.4%).
• TheHealthyPeople2010targetistohaveeveryindividualinsured.NoneoftheARHIIIIcountiesaremeetingthistarget.
• AmongtheARHIIIIcounties,therateofinsurancecoverageisaslowas83.9%inNobleCountyandashighas88.0%inBelmontCounty.
!"#$% !&#'%!!#$% !(#)% !"#*% !"#)% !*#(% !+#"% !+#)%
= = = = = = = = =
,$$%
'$%
!$%
,$%
$%
=

APPALACHIANRURALHEALTHINSTITUTE(ARHI)HealthNeedsAssessmentSurveyIII∙ResearchReport 53
InsuranceDemographics
Table1.EmploymentandInsuranceCoverage
• AmongtheARHIIIIcounties,thelowestrateofinsurancecoverage(62.5%)belongstounemployedresidents.
• AcrosstheARHIIIIcounties,studentsandemployedindividualsaccountfor27.0%ofthosewithouthealthinsurance;with13.5%ofstudentsand13.5%ofemployedindividualsbeinguninsured.
Table2.IncomeandInsuranceCoverage
• Individualswithannualhouseholdincomesbetween$15,000and$24,999havethelowestrateofinsurancecoverage(70.8%)comparedtootherincomebrackets.
Insured Not Insured
Employed 86.5% 13.5%
Unemployed 62.5% 37.5%
Homemaker 89.2% 10.8%
Student 86.5% 13.5%
Retired 95.3% 4.7%
Unable to Work 91.2% 8.8%
Insured Not Insured
Less than $15,000 76.4% 23.6%
$15,000 to $24,000 70.8% 29.2%
$25,000 to $34,999 83.8% 16.2%
$35,000 to $49,000 90.5% 9.5%
$50,000 to $74,000 92.8% 7.2%
$75,000 or more 95.2% 4.8%

APPALACHIANRURALHEALTHINSTITUTE(ARHI)HealthNeedsAssessmentSurveyIII∙ResearchReport 54
DetailedInsuranceCoverage
Ifyoudohaveinsurance,whatkind?
Figure33.DetailedInsuranceCoverage
• AcrosstheARHIIIIcounties,therateofindividualswithoutinsurancecoverageis13.6%.• AmongARHIIIIcounties,themajority(56.0%)ofinsuredresidentsarecoveredby
privateorcommercialinsuranceonly.• AmongtheARHIIIIcounties,therateofresidentscoveredbyMedicaidis7.2%.20• AmongtheARHIIIIcounties,therateofresidentscoveredbyMedicareonlyis7.8%.• WithintheARHIIIIcounties,therateofresidentswhoarecoveredbyMedicareand
anotherpayeris8.6%.21• IntheARHIIIIcounties,therateofresidentscoveredbymilitaryinsurance(Veterans
AffairsorActiveMilitary)is2.0%.22
20ThecategoryMedicaidincludesindividualswhoareMedicaid/MedicareDualEligible,aswellasindividualswhohaveadditionalprivatecoverage.21ThecategoryMedicareandotherexcludesindividualswithMedicaidandMilitaryinsuranceasadditionalpayersource.22ThecategoryMilitaryincludesindividualswhohaveadditionalprivatecoverageorMedicare.
!"#
$!"#
%!"#
&!"#
'!"#
(!"#
)!"#
*+#,-./01-23#
435,2103#+-67#
435,2103#1-5#+8930#
435,21,5#
:0,;183<2+==30,216#+-67#
4,6,8107#
>8930#
?381,635##
@-./01-23##
A+;301B3##
!"#$%
&#'% '#$% &#(%
)$#*%
(#*%+#'%

APPALACHIANRURALHEALTHINSTITUTE(ARHI)HealthNeedsAssessmentSurveyIII∙ResearchReport 55
PrescriptionCoverage
Doyouhaveinsurancethatpaysforatleastpartofyourprescriptioncost?
Figure34.PrescriptionCoverage
• AcrosstheARHIIIIcounties,approximately82.0%ofresidentshaveatleastpartialprescriptioncoverage.
• AmongtheARHIIIIcounties,therateofprescriptioncoverageisaslowas78.7%inHarrisonCountyandashighas86.0%inBelmontCounty.
!"#$%!&#$% !$#"% '!#'%
!&#(% !&#(%!)#'%
'*#"% '*#!%
!"#
$"#
%"#
&"#
"#
= = = = = = = = = =

APPALACHIANRURALHEALTHINSTITUTE(ARHI)HealthNeedsAssessmentSurveyIII∙ResearchReport 56
(Thispagewasintentionallyleftblank.)

APPALACHIANRURALHEALTHINSTITUTE(ARHI)HealthNeedsAssessmentSurveyIII∙ResearchReport 57
APPENDICES

Appendix A. Weighted ARHI III Data Appendix A1. General Health Status
General health status: Percent SE LCL
@ .95 UCL
@ .95 Entire 9 County Sample Excellent 16.74% 0.63% 15.50% 17.98%Very Good 32.88% 0.79% 31.34% 34.43%Good 30.13% 0.77% 28.62% 31.64%Fair 14.87% 0.55% 13.79% 15.96%Poor 5.37% 0.34% 4.70% 6.05%
General health status: Percent SE LCL
@ .95 UCL
@ .95 Belmont County Excellent 17.75% 1.69% 14.45% 21.06%Very Good 32.77% 2.06% 28.72% 36.81%Good 32.42% 2.04% 28.42% 36.42%Fair 12.47% 1.27% 9.97% 14.96%Poor 4.59% 0.81% 3.01% 6.18%
General health status: Percent SE LCL
@ .95 UCL
@ .95 Columbiana County Excellent 18.17% 1.39% 15.45% 20.90%Very Good 34.50% 1.71% 31.14% 37.86%Good 29.49% 1.63% 26.29% 32.69%Fair 13.18% 1.16% 10.91% 15.45%Poor 4.66% 0.71% 3.26% 6.05%
General health status: Percent SE LCL
@ .95 UCL
@ .95 Gallia County Excellent 16.31% 2.30% 11.79% 20.82%Very Good 30.58% 2.79% 25.11% 36.05%Good 28.16% 2.79% 22.69% 33.64%Fair 20.14% 2.42% 15.38% 24.89%Poor 4.81% 1.15% 2.56% 7.07%
APPALACHIAN RURAL HEALTH INSTITUTE (ARHI) Health Needs Assessment Survey III ∙ Research Report 58

Appendix A. Weighted ARHI III Data Appendix A1. General Health Status
General health status: Percent SE LCL
@ .95 UCL
@ .95 Harrison County Excellent 16.81% 3.29% 10.36% 23.26%Very Good 29.49% 3.48% 22.67% 36.31%Good 31.90% 4.11% 23.84% 39.96%Fair 13.63% 2.84% 8.06% 19.20%Poor 8.17% 2.28% 3.70% 12.65%
General health status: Percent SE LCL
@ .95 UCL
@ .95 Jefferson County Excellent 16.52% 1.59% 13.41% 19.63%Very Good 32.41% 2.00% 28.50% 36.32%Good 28.76% 1.92% 24.99% 32.53%Fair 16.50% 1.47% 13.63% 19.38%Poor 5.80% 0.92% 4.01% 7.60%
General health status: Percent SE LCL
@ .95 UCL
@ .95 Lawrence County Excellent 13.63% 1.49% 10.71% 16.54%Very Good 29.58% 1.93% 25.79% 33.36%Good 31.95% 1.98% 28.07% 35.83%Fair 17.77% 1.54% 14.76% 20.78%Poor 7.08% 1.05% 5.03% 9.13%
General health status: Percent SE LCL
@ .95 UCL
@ .95 Monroe County Excellent 15.03% 3.13% 8.91% 21.16%Very Good 34.40% 4.37% 25.84% 42.97%Good 30.88% 4.25% 22.54% 39.21%Fair 15.09% 3.14% 8.93% 21.25%Poor 4.60% 1.76% 1.15% 8.05%
APPALACHIAN RURAL HEALTH INSTITUTE (ARHI) Health Needs Assessment Survey III ∙ Research Report 59

Appendix A. Weighted ARHI III Data Appendix A1. General Health Status
APPALACHIAN RURAL HEALTH INSTITUTE (ARHI) Health Needs Assessment Survey III ∙ Research Report 60
General health status: Percent SE LCL
@ .95 UCL
@ .95 Muskingum County Excellent 17.55% 1.60% 14.40% 20.69%Very Good 33.62% 1.99% 29.72% 37.52%Good 28.42% 1.92% 24.67% 32.18%Fair 15.01% 1.36% 12.34% 17.68%Poor 5.40% 0.82% 3.78% 7.02%
General health status: Percent SE LCL
@ .95 UCL
@ .95 Noble County Excellent 13.10% 3.97% 5.32% 20.88%Very Good 40.62% 5.37% 30.09% 51.14%Good 34.21% 4.78% 24.84% 43.58%Fair 8.08% 2.44% 3.28% 12.87%Poor 3.99% 1.61% 0.84% 7.14%

Appendix A. Weighted ARHI III Data Appendix A2. Examined Health Conditions
Examined health conditions: Percent SE LCL
@ .95 UCL
@ .95 Entire 9 County Sample Diabetes 12.49% 0.50% 11.51% 13.47%Asthma 14.06% 0.59% 12.90% 15.21%Arthritis 32.16% 0.68% 30.84% 33.49%Heart Attack 7.27% 0.38% 6.52% 8.02%Heart Disease 6.71% 0.37% 5.98% 7.43%Stroke 4.25% 0.31% 3.63% 4.86%Have you had a blood test to screen your cholesterol levels? Yes 81.18% 0.65% 79.91% 82.45%If Yes: Have you been told that you have high blood
cholesterol? Yes 38.41% 0.84% 36.75% 40.06%
High Blood Pressure 32.19% 0.69% 30.85% 33.54%
If Yes: Are you currently taking prescribed medication for high blood pressure?
Yes 71.12% 1.31% 68.54% 73.70%
Examined health conditions: Percent SE LCL
@ .95 UCL
@ .95 Belmont County Diabetes 11.97% 1.28% 9.46% 14.48%Asthma 12.98% 1.53% 9.98% 15.98%Arthritis 34.84% 1.79% 31.33% 38.34%Heart Attack 7.43% 1.07% 5.33% 9.54%Heart Disease 8.04% 1.11% 5.86% 10.21%Stroke 3.93% 0.87% 2.22% 5.64%Have you had a blood test to screen your cholesterol levels? Yes 83.96% 1.67% 80.69% 87.23%If Yes: Have you been told that you have high blood
cholesterol? Yes 40.67% 2.59% 35.58% 45.75%
High Blood Pressure 31.78% 1.75% 28.34% 35.22%
If Yes: Are you currently taking prescribed medication for high blood pressure?
Yes 75.51% 3.17% 69.28% 81.73%
APPALACHIAN RURAL HEALTH INSTITUTE (ARHI) Health Needs Assessment Survey III ∙ Research Report 61

Appendix A. Weighted ARHI III Data Appendix A2. Examined Health Conditions
Examined health conditions: Percent SE LCL
@ .95 UCL
@ .95 Columbiana County Diabetes 10.40% 0.99% 8.46% 12.34%Asthma 13.36% 1.23% 10.95% 15.78%Arthritis 28.25% 1.42% 25.47% 31.02%Heart Attack 5.61% 0.73% 4.18% 7.04%Heart Disease 5.18% 0.71% 3.80% 6.57%Stroke 4.06% 0.67% 2.74% 5.38%Have you had a blood test to screen your cholesterol levels? Yes 79.76% 1.38% 77.06% 82.46%If Yes: Have you been told that you have high blood
cholesterol? Yes 37.10% 1.84% 33.49% 40.70%
High Blood Pressure 30.64% 1.47% 27.76% 33.52%
If Yes: Are you currently taking prescribed medication for high blood pressure?
Yes 64.10% 2.89% 58.43% 69.78%
Examined health conditions: Percent SE LCL
@ .95 UCL
@ .95 Gallia County Diabetes 10.63% 1.75% 7.19% 14.06%Asthma 18.11% 2.32% 13.56% 22.66%Arthritis 34.16% 2.56% 29.14% 39.18%Heart Attack 7.29% 1.42% 4.50% 10.08%Heart Disease 6.54% 1.31% 3.96% 9.11%Stroke 3.79% 1.13% 1.58% 6.01%Have you had a blood test to screen your cholesterol levels? Yes 85.62% 2.18% 81.35% 89.89%If Yes: Have you been told that you have high blood
cholesterol? Yes 43.27% 2.80% 37.78% 48.76%
High Blood Pressure 33.74% 2.65% 28.55% 38.94%
If Yes: Are you currently taking prescribed medication for high blood pressure?
Yes 56.55% 3.45% 49.79% 63.31%
APPALACHIAN RURAL HEALTH INSTITUTE (ARHI) Health Needs Assessment Survey III ∙ Research Report 62

Appendix A. Weighted ARHI III Data Appendix A2. Examined Health Conditions
Examined health conditions: Percent SE LCL
@ .95 UCL
@ .95 Harrison County Diabetes 13.70% 2.80% 8.22% 19.18%Asthma 11.49% 2.73% 6.14% 16.85%Arthritis 35.77% 3.93% 28.06% 43.49%Heart Attack 5.45% 1.83% 1.87% 9.04%Heart Disease 5.32% 1.87% 1.66% 8.98%Stroke 3.08% 1.45% 0.25% 5.92%Have you had a blood test to screen your cholesterol levels? Yes 77.32% 3.51% 70.44% 84.20%If Yes: Have you been told that you have high blood
cholesterol? Yes 37.49% 4.21% 29.23% 45.74%
High Blood Pressure 30.11% 3.61% 23.02% 37.19%
If Yes: Are you currently taking prescribed medication for high blood pressure?
Yes 69.66% 6.30% 57.31% 82.01%
Examined health conditions: Percent SE LCL
@ .95 UCL
@ .95 Jefferson County Diabetes 14.11% 1.40% 11.37% 16.85%Asthma 11.51% 1.33% 8.90% 14.11%Arthritis 34.56% 1.76% 31.10% 38.02%Heart Attack 6.69% 0.93% 4.86% 8.52%Heart Disease 6.53% 0.90% 4.75% 8.30%Stroke 4.61% 0.80% 3.03% 6.18%Have you had a blood test to screen your cholesterol levels? Yes 82.50% 1.63% 79.32% 85.69%If Yes: Have you been told that you have high blood
cholesterol? Yes 38.73% 2.01% 34.78% 42.68%
High Blood Pressure 30.63% 1.68% 27.32% 33.93%
If Yes: Are you currently taking prescribed medication for high blood pressure?
Yes 75.20% 2.65% 69.99% 80.41%
APPALACHIAN RURAL HEALTH INSTITUTE (ARHI) Health Needs Assessment Survey III ∙ Research Report 63

Appendix A. Weighted ARHI III Data Appendix A2. Examined Health Conditions
Examined health conditions: Percent SE LCL
@ .95 UCL
@ .95 Lawrence County Diabetes 15.26% 1.38% 12.56% 17.97%Asthma 15.20% 1.53% 12.20% 18.19%Arthritis 31.67% 1.80% 28.14% 35.20%Heart Attack 9.93% 1.16% 7.66% 12.21%Heart Disease 8.88% 1.13% 6.67% 11.09%Stroke 5.22% 0.87% 3.51% 6.94%Have you had a blood test to screen your cholesterol levels? Yes 84.35% 1.59% 81.23% 87.47%If Yes: Have you been told that you have high blood
cholesterol? Yes 39.55% 2.06% 35.52% 43.59%
High Blood Pressure 35.94% 1.85% 32.32% 39.56%
If Yes: Are you currently taking prescribed medication for high blood pressure?
Yes 78.43% 3.16% 72.23% 84.63%
Examined health conditions: Percent SE LCL
@ .95 UCL
@ .95 Monroe County Diabetes 16.00% 3.03% 10.07% 21.94%Asthma 15.55% 3.02% 9.63% 21.47%Arthritis 38.59% 3.96% 30.82% 46.35%Heart Attack 13.50% 2.54% 8.53% 18.47%Heart Disease 6.92% 2.03% 2.94% 10.91%Stroke 6.07% 1.89% 2.36% 9.78%Have you had a blood test to screen your cholesterol levels? Yes 85.18% 2.31% 80.66% 89.71%If Yes: Have you been told that you have high blood
cholesterol? Yes 43.25% 3.82% 35.75% 50.75%
High Blood Pressure 41.51% 3.59% 34.47% 48.54%
If Yes: Are you currently taking prescribed medication for high blood pressure?
Yes 89.17% 2.20% 84.86% 93.48%
APPALACHIAN RURAL HEALTH INSTITUTE (ARHI) Health Needs Assessment Survey III ∙ Research Report 64

Appendix A. Weighted ARHI III Data Appendix A2. Examined Health Conditions
APPALACHIAN RURAL HEALTH INSTITUTE (ARHI) Health Needs Assessment Survey III ∙ Research Report 65
Examined health conditions: Percent SE LCL
@ .95 UCL
@ .95 Muskingum County Diabetes 12.62% 1.20% 10.26% 14.98%Asthma 15.84% 1.60% 12.71% 18.97%Arthritis 32.24% 1.60% 29.10% 35.37%Heart Attack 7.53% 0.95% 5.67% 9.38%Heart Disease 6.90% 0.91% 5.11% 8.69%Stroke 4.10% 0.71% 2.69% 5.50%Have you had a blood test to screen your cholesterol levels? Yes 78.40% 1.75% 74.97% 81.82%If Yes: Have you been told that you have high blood
cholesterol? Yes 35.33% 1.96% 31.48% 39.17%
High Blood Pressure 33.33% 1.76% 29.88% 36.79%
If Yes: Are you currently taking prescribed medication for high blood pressure?
Yes 70.10% 4.27% 61.73% 78.47%
Examined health conditions: Percent SE LCL
@ .95 UCL
@ .95 Noble County Diabetes 8.85% 2.60% 3.76% 13.94%Asthma 15.95% 3.94% 8.21% 23.68%Arthritis 22.92% 3.42% 16.21% 29.63%Heart Attack 4.81% 1.65% 1.58% 8.05%Heart Disease 4.00% 1.51% 1.04% 6.96%Stroke 2.33% 1.27% ‐0.17% 4.83%Have you had a blood test to screen your cholesterol levels? Yes 64.03% 4.80% 54.62% 73.43%If Yes: Have you been told that you have high blood
cholesterol? Yes 33.90% 5.25% 23.62% 44.19%
High Blood Pressure 21.07% 3.31% 14.59% 27.55%
If Yes: Are you currently taking prescribed medication for high blood pressure?
Yes 76.17% 2.28% 71.69% 80.64%

Appendix A. Weighted ARHI III Data Appendix A3. Diabetes
Respondents living with diabetes: Percent SE LCL @ .95 UCL @ .95 Entire 9 County Sample Age of diabetes diagnosis.
Under 18 years 10.05% 0.86% 8.36% 11.75%19 to 40 years 39.19% 1.59% 36.08% 42.30%41 to 49 years 16.38% 1.40% 13.64% 19.13%50 to 59 years 15.79% 1.19% 13.46% 18.13%Over 60 years 18.58% 0.90% 16.82% 20.35%
Diabetes related health care visits in the last 12 months.
None 4.98% 0.94% 3.14% 6.83%1 time 11.97% 1.19% 9.63% 14.32%2 or 3 times 34.83% 1.96% 30.99% 38.67%4-5 times 30.30% 1.69% 26.98% 33.61%6-10 times 10.32% 1.24% 7.88% 12.77%More than 10 times 7.59% 0.93% 5.77% 9.41%
Regular blood sugar checks. 3 or more times per day 17.58% 1.38% 14.86% 20.29%1 or 2 times per day 54.33% 2.15% 50.10% 58.55%
At least 1 time per week but less than daily 20.42% 1.75% 16.98% 23.86%Less than 1 time per week 7.68% 0.98% 5.76% 9.60%
Are insulin shots or pumps used regularly? Yes 28.41% 1.78% 24.91% 31.91%
Are diabetes pills used regularly? Yes 67.16% 1.83% 63.57% 70.75%
Have you taken a course/class on managing your diabetes?
Yes 46.37% 2.01% 42.43% 50.31%
Does cost keep you from seeing the doctor on a regular basis for your diabetes?
Yes 26.25% 1.84% 22.63% 29.87%
Does cost keep you from regularly taking your prescribed diabetes pills or insulin?
Yes 16.87% 1.48% 13.97% 19.77%
Does cost keep you from regularly checking your blood sugar with test strips?
Yes 23.64% 1.80% 20.10% 27.18%
APPALACHIAN RURAL HEALTH INSTITUTE (ARHI) Health Needs Assessment Survey III ∙ Research Report 66

Appendix A. Weighted ARHI III Data Appendix A3.1. Diabetes: Belmont County
Respondents living with diabetes: Percent SE LCL @ .95 UCL @ .95 Belmont County Age of diabetes diagnosis.
Under 18 years * * * *19 to 40 years 40.60% 3.87% 32.99% 48.20%41 to 49 years 16.44% 3.91% 8.76% 24.11%50 to 59 years 18.60% 3.97% 10.80% 26.41%Over 60 years 24.36% 2.61% 19.24% 29.49%
Diabetes related health care visits in the last 12 months.
None 3.69% 1.82% 0.12% 7.26%1 time 6.67% 2.24% 2.27% 11.06%2 or 3 times 42.08% 5.65% 30.99% 53.17%4-5 times 38.52% 5.72% 27.29% 49.75%6-10 times 4.84% 2.07% 0.76% 8.92%
More than 10 times 4.20% 1.75% 0.76% 7.63%Regular blood sugar checks.
3 or more times per day 17.92% 4.19% 9.69% 26.15%
1 or 2 times per day 59.26% 5.89% 47.68% 70.84%
At least 1 time per week but less than daily 15.55% 5.26% 5.21% 25.88%
Less than 1 time per week 7.28% 2.53% 2.30% 12.26%
Are insulin shots or pumps used regularly? Yes 37.50% 3.09% 31.43% 43.57%
Are diabetes pills used regularly? Yes 84.38% 4.35% 75.84% 92.92%
Have you taken a course/class on managing your diabetes?
Yes 50.09% 7.28% 35.78% 64.39%
Does cost keep you from seeing the doctor on a regular basis for your diabetes?
Yes 25.07% 5.26% 14.72% 35.41%
Does cost keep you from regularly taking your prescribed diabetes pills or insulin?
Yes 12.43% 1.98% 8.54% 16.31%
Does cost keep you from regularly checking your blood sugar with test strips?
Yes 21.20% 5.06% 11.26% 31.14%*Denotes cells without observations.
APPALACHIAN RURAL HEALTH INSTITUTE (ARHI) Health Needs Assessment Survey III ∙ Research Report 67

Appendix A. Weighted ARHI III Data Appendix A3.2. Diabetes: Columbiana County
Respondents living with diabetes: Percent SE LCL @ .95 UCL @ .95 Columbiana County Age of diabetes diagnosis.
Under 18 years 4.91% 2.76% ‐0.52% 10.34%19 to 40 years 45.18% 4.69% 35.95% 54.40%41 to 49 years 17.84% 3.56% 10.85% 24.84%50 to 59 years 10.66% 2.88% 5.00% 16.32%Over 60 years 21.41% 2.30% 16.89% 25.92%
Diabetes related health care visits in the last 12 months.
None 6.19% 2.86% 0.57% 11.80%1 time 6.32% 3.21% 0.02% 12.62%2 or 3 times 47.65% 5.72% 36.41% 58.89%4-5 times 22.82% 3.76% 15.43% 30.21%6-10 times 15.55% 4.36% 6.99% 24.12%More than 10 times 1.47% 0.84% ‐0.18% 3.13%
Regular blood sugar checks. 3 or more times per day 8.19% 3.13% 2.03% 14.35%1 or 2 times per day 61.99% 5.99% 50.22% 73.75%
At least 1 time per week but less than daily 25.82% 5.32% 15.36% 36.28%Less than 1 time per week 4.00% 1.43% 1.18% 6.82%
Are insulin shots or pumps used regularly? Yes 28.01% 5.34% 17.52% 38.50%Are diabetes pills used regularly? Yes 63.83% 4.48% 55.02% 72.64%Have you taken a course/class on managing your diabetes? Yes 34.33% 4.91% 24.67% 43.98%
Does cost keep you from seeing the doctor on a regular basis for your diabetes? Yes 25.60% 5.45% 14.89% 36.32%
Does cost keep you from regularly taking your prescribed diabetes pills or insulin? Yes 13.67% 4.19% 5.44% 21.90%
Does cost keep you from regularly checking your blood sugar with test strips? Yes 30.33% 4.95% 20.61% 40.06%
APPALACHIAN RURAL HEALTH INSTITUTE (ARHI) Health Needs Assessment Survey III ∙ Research Report 68
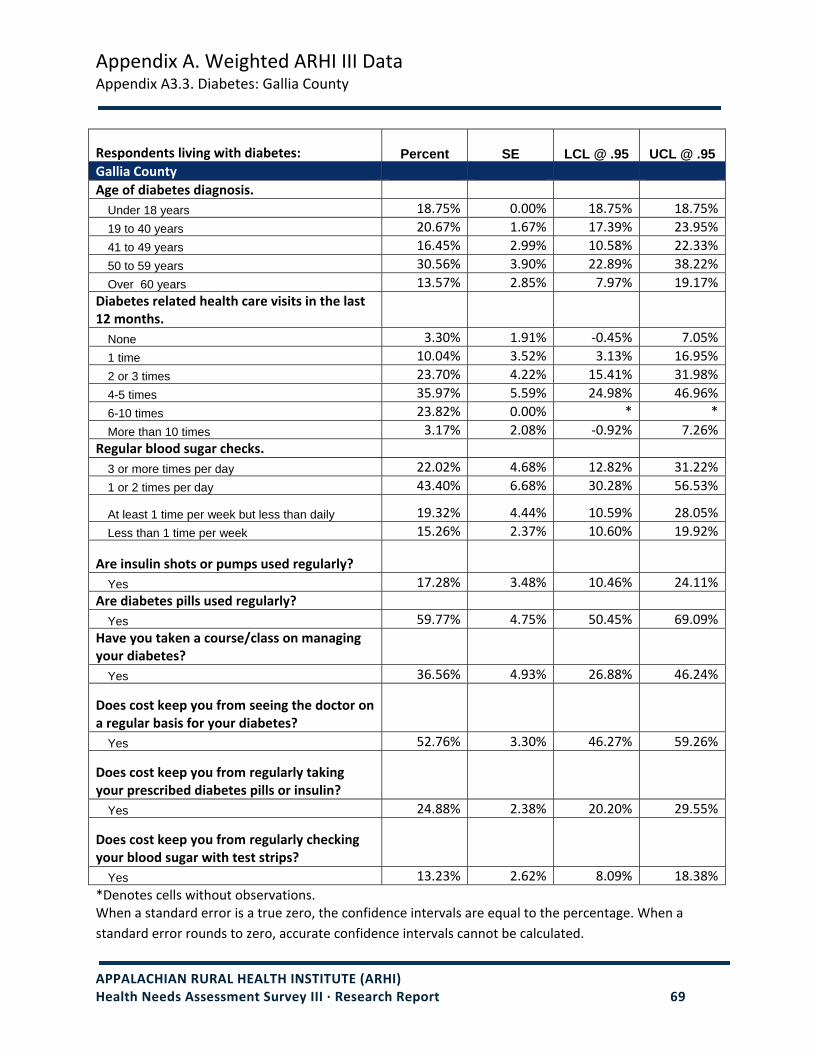
Appendix A. Weighted ARHI III Data Appendix A3.3. Diabetes: Gallia County
Respondents living with diabetes: Percent SE LCL @ .95 UCL @ .95 Gallia County
Age of diabetes diagnosis. 18.75% 0.00% 18.75% 18.75%Under 18 years 20.67% 1.67% 17.39% 23.95%19 to 40 years 16.45% 2.99% 10.58% 22.33%41 to 49 years 30.56% 3.90% 22.89% 38.22%50 to 59 years 13.57% 2.85% 7.97% 19.17%Over 60 years
Diabetes related health care visits in the last 12 months.
3.30% 1.91% ‐0.45% 7.05%None 10.04% 3.52% 3.13% 16.95%1 time 23.70% 4.22% 15.41% 31.98%2 or 3 times 35.97% 5.59% 24.98% 46.96%4-5 times 23.82% 0.00% * *6-10 times 3.17% 2.08% ‐0.92% 7.26%More than 10 times
Regular blood sugar checks. 22.02% 4.68% 12.82% 31.22%3 or more times per day 43.40% 6.68% 30.28% 56.53%1 or 2 times per day
19.32% 4.44% 10.59% 28.05%At least 1 time per week but less than daily 15.26% 2.37% 10.60% 19.92%Less than 1 time per week
Are insulin shots or pumps used regularly? 17.28% 3.48% 10.46% 24.11%Yes
Are diabetes pills used regularly? 59.77% 4.75% 50.45% 69.09%Yes
Have you taken a course/class on managing your diabetes?
36.56% 4.93% 26.88% 46.24%Yes
Does cost keep you from seeing the doctor on a regular basis for your diabetes?
52.76% 3.30% 46.27% 59.26%Yes
Does cost keep you from regularly taking your prescribed diabetes pills or insulin?
24.88% 2.38% 20.20% 29.55%Yes
Does cost keep you from regularly checking your blood sugar with test strips?
13.23% 2.62% 8.09% Yes 18.38%*Denotes cells without observations. When a standard error is a true zero, the confidence intervals are equal to the percentage. When a standard error rounds to zero, accurate confidence intervals cannot be calculated.
APPALACHIAN RURAL HEALTH INSTITUTE (ARHI) Health Needs Assessment Survey III ∙ Research Report 69

Appendix A. Weighted ARHI III Data Appendix A3.4. Diabetes: Harrison County
Respondents living with diabetes: Percent SE LCL @ .95 UCL @ .95 Harrison County
Age of diabetes diagnosis. * * * *Under 18 years
27.45% 0.00% * *19 to 40 years 18.81% 3.00% 12.92% 24.70%41 to 49 years 34.51% 6.82% 21.11% 47.90%50 to 59 years 19.24% 6.12% 7.21% 31.27%Over 60 years
Diabetes related health care visits in the last 12 months.
8.09% 5.73% ‐3.16% 19.34%None 5.20% 4.50% ‐3.65% 14.04%1 time
14.08% 6.10% 2.09% 26.07%2 or 3 times 53.81% 8.17% 37.76% 69.85%4-5 times 18.83% 3.20% 12.55% 25.11%6-10 times
* * * *More than 10 times Regular blood sugar checks.
26.90% 6.46% 14.20% 39.60%3 or more times per day 45.34% 9.18% 27.30% 63.38%1 or 2 times per day
13.54% 6.93% ‐0.07% 27.16%At least 1 time per week but less than daily 14.21% 2.64% 9.02% 19.40%Less than 1 time per week
Are insulin shots or pumps used regularly? 27.75% 7.39% 13.23% 42.26%Yes
Are diabetes pills used regularly? 76.43% 8.31% 60.11% 92.75%Yes
Have you taken a course/class on managing your diabetes?
66.00% 5.41% 55.37% 76.63%Yes
Does cost keep you from seeing the doctor on a regular basis for your diabetes?
16.57% 7.87% 1.12% 32.03%Yes
Does cost keep you from regularly taking your prescribed diabetes pills or insulin?
8.09% 5.73% ‐3.16% 19.34%Yes
Does cost keep you from regularly checking your blood sugar with test strips?
13.99% 6.58% 1.07% Yes 26.91%*Denotes cells without observations. When a standard error rounds to zero, accurate confidence intervals cannot be calculated.
APPALACHIAN RURAL HEALTH INSTITUTE (ARHI) Health Needs Assessment Survey III ∙ Research Report 70

Appendix A. Weighted ARHI III Data Appendix A3.5. Diabetes: Jefferson County
Respondents living with diabetes: Percent SE LCL @ .95 UCL @ .95 Jefferson County
Age of diabetes diagnosis. 17.40% 2.52% 12.46% 22.35%Under 18 years 34.60% 3.80% 27.14% 42.06%19 to 40 years 16.99% 3.36% 10.39% 23.60%41 to 49 years 12.00% 2.79% 6.51% 17.49%50 to 59 years 19.00% 2.12% 14.83% 23.17%Over 60 years
Diabetes related health care visits in the last 12 months.
2.25% 1.27% ‐0.25% 4.74%None 8.76% 3.31% 2.25% 15.28%1 time
37.76% 3.74% 30.41% 45.10%2 or 3 times 24.32% 3.79% 16.87% 31.77%4-5 times 8.85% 2.56% 3.82% 13.88%6-10 times
18.06% 3.57% 11.04% 25.08%More than 10 times Regular blood sugar checks.
26.08% 3.89% 18.43% 33.72%3 or more times per day 53.39% 4.35% 44.84% 61.94%1 or 2 times per day
7.28% 2.23% 2.90% 11.65%At least 1 time per week but less than daily 13.26% 3.25% 6.87% 19.65%Less than 1 time per week
Are insulin shots or pumps used regularly? 34.08% 4.28% 25.67% 42.50%Yes
Are diabetes pills used regularly? 73.78% 4.41% 65.11% 82.45%Yes
Have you taken a course/class on managing your diabetes?
52.72% 4.69% 43.51% 61.93%Yes
Does cost keep you from seeing the doctor on a regular basis for your diabetes?
18.56% 3.80% 11.10% 26.02%Yes
Does cost keep you from regularly taking your prescribed diabetes pills or insulin?
12.10% 3.60% 5.02% 19.18%Yes
Does cost keep you from regularly checking your blood sugar with test strips?
Yes 20.47% 4.16% 12.29% 28.65%
APPALACHIAN RURAL HEALTH INSTITUTE (ARHI) Health Needs Assessment Survey III ∙ Research Report 71

Appendix A. Weighted ARHI III Data Appendix A3.6. Diabetes: Lawrence County
Respondents living with diabetes: Percent SE LCL @ .95 UCL @ .95 Lawrence County Age of diabetes diagnosis.
Under 18 years 8.94% 0.00% 8.94% 8.94%19 to 40 years 45.86% 2.72% 40.51% 51.20%41 to 49 years 14.94% 3.21% 8.63% 21.25%50 to 59 years 16.11% 2.68% 10.85% 21.37%Over 60 years 14.15% 1.85% 10.52% 17.79%
Diabetes related health care visits in the last 12 months.
None 9.04% 2.93% 3.28% 14.80%1 time 20.08% 3.47% 13.27% 26.90%2 or 3 times 32.89% 4.28% 24.48% 41.30%4-5 times 15.78% 2.58% 10.72% 20.85%6-10 times 5.81% 2.07% 1.75% 9.87%More than 10 times 16.39% 3.38% 9.75% 23.03%
Regular blood sugar checks. 3 or more times per day 14.67% 3.68% 7.45% 21.90%1 or 2 times per day 50.63% 5.69% 39.46% 61.81%
At least 1 time per week but less than daily 22.60% 3.63% 15.47% 29.74%Less than 1 time per week 12.09% 3.84% 4.55% 19.63%
Are insulin shots or pumps used regularly? Yes 17.59% 4.22% 9.30% 25.87%
Are diabetes pills used regularly? Yes 64.25% 5.41% 53.62% 74.88%
Have you taken a course/class on managing your diabetes?
Yes 37.62% 4.76% 28.27% 46.98%
Does cost keep you from seeing the doctor on a regular basis for your diabetes?
Yes 22.48% 4.37% 13.90% 31.06%
Does cost keep you from regularly taking your prescribed diabetes pills or insulin?
Yes 12.98% 3.64% 5.82% 20.14%
Does cost keep you from regularly checking your blood sugar with test strips?
21.98% 5.30% 11.58% 32.39%Yes When a standard error is a true zero, the confidence intervals are equal to the percentage.
APPALACHIAN RURAL HEALTH INSTITUTE (ARHI) Health Needs Assessment Survey III ∙ Research Report 72

Appendix A. Weighted ARHI III Data Appendix A3.7. Diabetes: Monroe County
Respondents living with diabetes: Percent SE LCL @ .95 UCL @ .95 Monroe County Age of diabetes diagnosis.
Under 18 years * * * *19 to 40 years 31.69% 4.54% 22.77% 40.61%41 to 49 years 11.63% 5.45% 0.92% 22.33%50 to 59 years 39.13% 3.01% 33.21% 45.05%Over 60 years 17.55% 3.01% 11.63% 23.47%
Diabetes related health care visits in the last 12 months.
None 11.61% 5.83% 0.15% 23.07%1 time 15.17% 1.83% 11.57% 18.76%2 or 3 times 16.65% 6.81% 3.27% 30.03%4-5 times 34.29% 7.28% 19.98% 48.60%6-10 times 16.22% 3.83% 8.70% 23.74%More than 10 times 6.07% 3.83% ‐1.45% 13.59%
Regular blood sugar checks. 3 or more times per day * * * *1 or 2 times per day 66.05% 3.83% 58.53% 73.57%
At least 1 time per week but less than daily 32.00% 3.36% 25.39% 38.60%Less than 1 time per week 1.95% 1.83% ‐1.64% 5.55%
Are insulin shots or pumps used regularly? Yes 47.18% 6.25% 34.90% 59.46%
Are diabetes pills used regularly? Yes 82.53% 6.42% 69.92% 95.14%
Have you taken a course/class on managing your diabetes?
Yes 46.17% 8.55% 29.37% 62.97%
Does cost keep you from seeing the doctor on a regular basis for your diabetes?
Yes 39.60% 3.83% 32.08% 47.12%
Does cost keep you from regularly taking your prescribed diabetes pills or insulin?
Yes 35.14% 6.14% 23.09% 47.20%
Does cost keep you from regularly checking your blood sugar with test strips?
Yes 39.60% 3.83% 32.08% 47.12%*Denotes cells without observations.
APPALACHIAN RURAL HEALTH INSTITUTE (ARHI) Health Needs Assessment Survey III ∙ Research Report 73

Appendix A. Weighted ARHI III Data Appendix A3.8. Diabetes: Muskingum County
Respondents living with diabetes: Percent SE LCL @ .95 UCL @ .95 Muskingum County Age of diabetes diagnosis.
Under 18 years 18.45% 2.01% 14.51% 22.39%19 to 40 years 37.13% 3.51% 30.24% 44.03%41 to 49 years 16.23% 3.24% 9.86% 22.60%50 to 59 years 12.67% 2.26% 8.23% 17.11%Over 60 years 15.52% 1.84% 11.91% 19.13%
Diabetes related health care visits in the last 12 months.
None 3.63% 1.77% 0.15% 7.11%1 time 21.18% 1.93% 17.39% 24.98%2 or 3 times 23.98% 4.00% 16.12% 31.84%4-5 times 43.48% 4.38% 34.87% 52.08%6-10 times 4.53% 1.97% 0.66% 8.40%More than 10 times 3.20% 1.51% 0.24% 6.17%
Regular blood sugar checks. 3 or more times per day 22.18% 2.27% 17.71% 26.65%1 or 2 times per day 46.77% 4.53% 37.86% 55.67%
At least 1 time per week but less than daily 29.18% 4.23% 20.88% 37.48%Less than 1 time per week 1.88% 0.99% ‐0.08% 3.83%
Are insulin shots or pumps used regularly? Yes 24.37% 3.59% 17.32% 31.43%
Are diabetes pills used regularly? Yes 50.48% 4.05% 42.53% 58.43%
Have you taken a course/class on managing your diabetes?
Yes 56.68% 3.47% 49.86% 63.51%
Does cost keep you from seeing the doctor on a regular basis for your diabetes?
Yes 30.31% 3.29% 23.84% 36.77%
Does cost keep you from regularly taking your prescribed diabetes pills or insulin?
Yes 27.86% 3.50% 20.98% 34.74%
Does cost keep you from regularly checking your blood sugar with test strips?
Yes 25.93% 2.98% 20.07% 31.80%
APPALACHIAN RURAL HEALTH INSTITUTE (ARHI) Health Needs Assessment Survey III ∙ Research Report 74

Appendix A. Weighted ARHI III Data Appendix A3.9. Diabetes: Noble County
Respondents living with diabetes: Percent SE LCL @ .95 UCL @ .95 Noble County Age of diabetes diagnosis.
Under 18 years * * * *19 to 40 years 60.38% 7.72% 45.20% 75.55%41 to 49 years 6.73% 5.50% ‐4.08% 17.54%50 to 59 years 15.88% 8.50% ‐0.81% 32.58%Over 60 years 17.01% 6.92% 3.41% 30.61%
Diabetes related health care visits in the last 12 months.
None * * * *1 time 10.28% 4.20% 2.03% 18.53%2 or 3 times * * * *4-5 times 45.71% 9.48% 27.09% 64.34%6-10 times 34.85% 5.50% 24.05% 45.66%More than 10 times 9.15% 6.48% ‐3.57% 21.88%
Regular blood sugar checks. 3 or more times per day 14.29% 7.72% ‐0.88% 29.47%1 or 2 times per day 69.82% 6.92% 56.22% 83.42%
At least 1 time per week but less than daily 15.88% 8.50% ‐0.82% 32.59%Less than 1 time per week * * * *
Are insulin shots or pumps used regularly? Yes 42.42% 7.72% 27.25% 57.59%
Are diabetes pills used regularly? Yes 94.86% 4.20% 86.61% 103.11%
Have you taken a course/class on managing your diabetes?
Yes 78.98% 9.48% 60.35% 97.60%
Does cost keep you from seeing the doctor on a regular basis for your diabetes?
Yes 9.15% 6.48% ‐3.57% 21.88%
Does cost keep you from regularly taking your prescribed diabetes pills or insulin?
Yes 14.29% 7.72% ‐0.88% 29.47%
Does cost keep you from regularly checking your blood sugar with test strips?
Yes * * * **Denotes cells without observations.
APPALACHIAN RURAL HEALTH INSTITUTE (ARHI) Health Needs Assessment Survey III ∙ Research Report 75

Appendix A. Weighted ARHI III Data Appendix A4. Body Mass Index (BMI) Categories
Body Mass Index (BMI) categories: Percent SE LCL @
.95 UCL @
.95 Entire 9 County Sample Neither overweight nor obese 34.00% 0.78% 32.47% 35.53%Overweight 35.32% 0.79% 33.77% 36.86%Obese 30.69% 0.77% 29.18% 32.20%Belmont County Neither overweight nor obese 35.75% 2.08% 31.66% 39.84%Overweight 36.02% 2.09% 31.93% 40.12%Obese 28.23% 1.98% 24.35% 32.10%Columbiana County Neither overweight nor obese 34.19% 1.63% 31.00% 37.38%Overweight 36.71% 1.71% 33.35% 40.07%Obese 29.10% 1.61% 25.95% 32.25%Gallia County Neither overweight nor obese 34.23% 2.97% 28.41% 40.05%Overweight 37.83% 2.95% 32.05% 43.61%Obese 27.94% 2.82% 22.42% 33.46%Harrison County Neither overweight nor obese 37.26% 4.00% 29.42% 45.09%Overweight 30.14% 3.70% 22.89% 37.40%Obese 32.60% 3.95% 24.86% 40.34%Jefferson County Neither overweight nor obese 35.41% 2.02% 31.45% 39.38%Overweight 32.92% 1.96% 29.07% 36.77%Obese 31.66% 1.98% 27.77% 35.55%Lawrence County Neither overweight nor obese 31.54% 1.98% 27.66% 35.42%Overweight 36.44% 2.05% 32.41% 40.46%Obese 32.03% 2.02% 28.07% 35.98%Monroe County Neither overweight nor obese 20.82% 3.13% 14.69% 26.95%Overweight 41.71% 4.45% 32.98% 50.44%Obese 37.47% 4.49% 28.67% 46.26%Muskingum County Neither overweight nor obese 34.62% 1.99% 30.72% 38.52%Overweight 32.36% 1.90% 28.64% 36.09%Obese 33.02% 1.97% 29.15% 36.88%Noble County Neither overweight nor obese 33.03% 4.83% 23.55% 42.51%Overweight 39.39% 5.13% 29.32% 49.45%Obese 27.59% 4.20% 19.34% 35.83%
APPALACHIAN RURAL HEALTH INSTITUTE (ARHI) Health Needs Assessment Survey III ∙ Research Report 76

Appendix A. Weighted ARHI III Data Appendix A5. Physical Exercise
Physical exercise: Percent SE LCL
@ .95 UCL
@ .95 Entire 9 County Sample In a usual week, do you engage in moderate exercise? Yes 77.01% 0.69% 75.66% 78.37%
How many times per week do you do moderate activities for at least 20 minutes at a time?
1 3.75% 0.36% 3.05% 4.45%
2 10.46% 0.58% 9.32% 11.60%
3 24.29% 0.81% 22.70% 25.89%
4 15.21% 0.70% 13.85% 16.58%
5 14.40% 0.65% 13.12% 15.68%
6 4.82% 0.42% 3.99% 5.65%
7 27.05% 0.85% 25.38% 28.72%In a usual week, do you engage in vigorous exercise? Yes 42.68% 0.79% 41.14% 44.22%
How many times per week do you do vigorous activities for at least 20 minutes at a time?
1 18.97% 1.02% 16.96% 20.98%
2 19.16% 1.02% 17.16% 21.16%
3 26.10% 1.15% 23.84% 28.36%
4 10.97% 0.81% 9.39% 12.56%
5 10.98% 0.84% 9.34% 12.62%
6 3.16% 0.46% 2.25% 4.07%7 10.66% 0.83% 9.02% 12.29%
APPALACHIAN RURAL HEALTH INSTITUTE (ARHI) Health Needs Assessment Survey III ∙ Research Report 77

Appendix A. Weighted ARHI III Data Appendix A5.1. Physical Exercise: Belmont County
Percent SE LCL
@ .95 UCL
@ .95 Physical exercise: Belmont County
In a usual week, do you engage in moderate exercise? Yes 75.26% 1.85% 71.63% 78.90%
How many times per week do you do moderate activities for at least 20 minutes at a time?
4.66% 0.98% 2.74% 6.58%1 10.16% 1.54% 7.14% 13.17%2 24.96% 2.22% 20.61% 29.32%3 16.15% 1.85% 12.52% 19.78%4 12.54% 1.53% 9.54% 15.53%5 2.33% 0.73% 0.89% 3.77%6
29.20% 2.34% 24.61% 33.79%7 In a usual week, do you engage in vigorous exercise? Yes 40.82% 1.98% 36.94% 44.70%
How many times per week do you do vigorous activities for at least 20 minutes at a time?
17.58% 2.76% 12.16% 23.00%1 16.40% 2.59% 11.32% 21.47%2 24.71% 3.08% 18.66% 30.75%3 9.92% 2.02% 5.95% 13.90%4
14.55% 2.53% 9.60% 19.51%5 4.25% 1.21% 1.88% 6.63%6
7 12.58% 2.47% 7.73% 17.44%
APPALACHIAN RURAL HEALTH INSTITUTE (ARHI) Health Needs Assessment Survey III ∙ Research Report 78
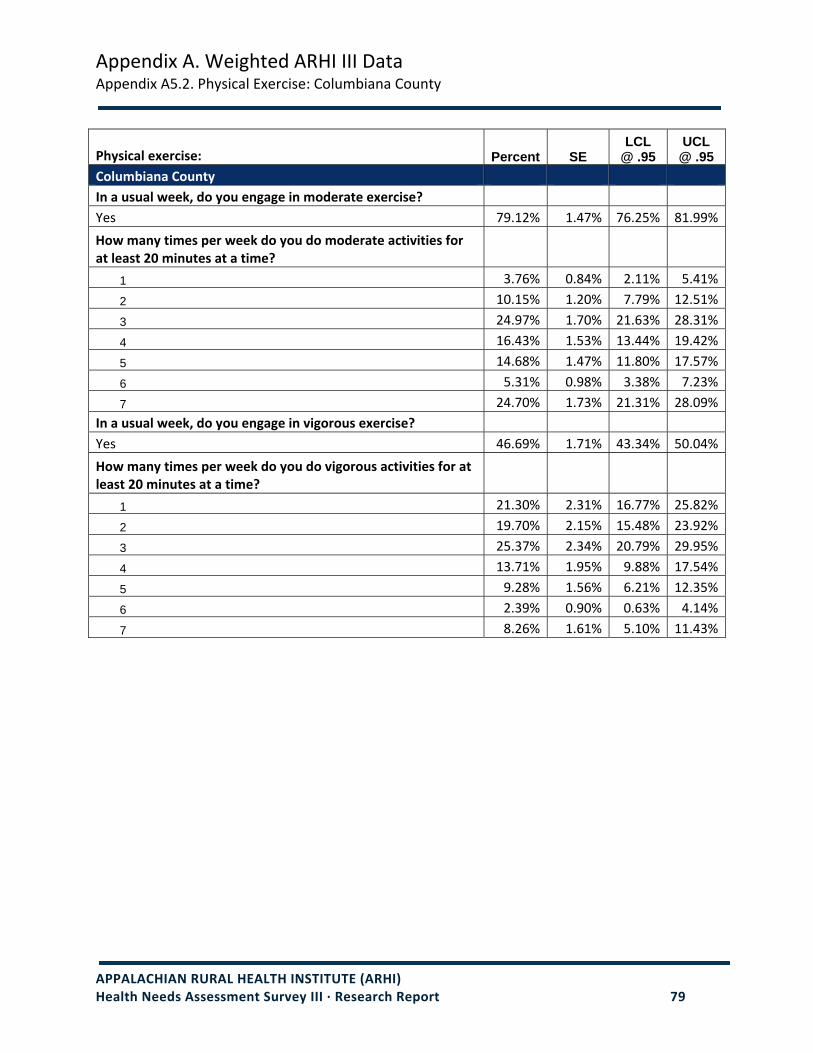
Appendix A. Weighted ARHI III Data Appendix A5.2. Physical Exercise: Columbiana County
Physical exercise: Percent SE LCL
@ .95 UCL
@ .95 Columbiana County In a usual week, do you engage in moderate exercise? Yes 79.12% 1.47% 76.25% 81.99%
How many times per week do you do moderate activities for at least 20 minutes at a time?
1 3.76% 0.84% 2.11% 5.41%
2 10.15% 1.20% 7.79% 12.51%
3 24.97% 1.70% 21.63% 28.31%
4 16.43% 1.53% 13.44% 19.42%
5 14.68% 1.47% 11.80% 17.57%
6 5.31% 0.98% 3.38% 7.23%
7 24.70% 1.73% 21.31% 28.09%In a usual week, do you engage in vigorous exercise? Yes 46.69% 1.71% 43.34% 50.04%
How many times per week do you do vigorous activities for at least 20 minutes at a time?
1 21.30% 2.31% 16.77% 25.82%
2 19.70% 2.15% 15.48% 23.92%
3 25.37% 2.34% 20.79% 29.95%
4 13.71% 1.95% 9.88% 17.54%
5 9.28% 1.56% 6.21% 12.35%
6 2.39% 0.90% 0.63% 4.14%
7 8.26% 1.61% 5.10% 11.43%
APPALACHIAN RURAL HEALTH INSTITUTE (ARHI) Health Needs Assessment Survey III ∙ Research Report 79
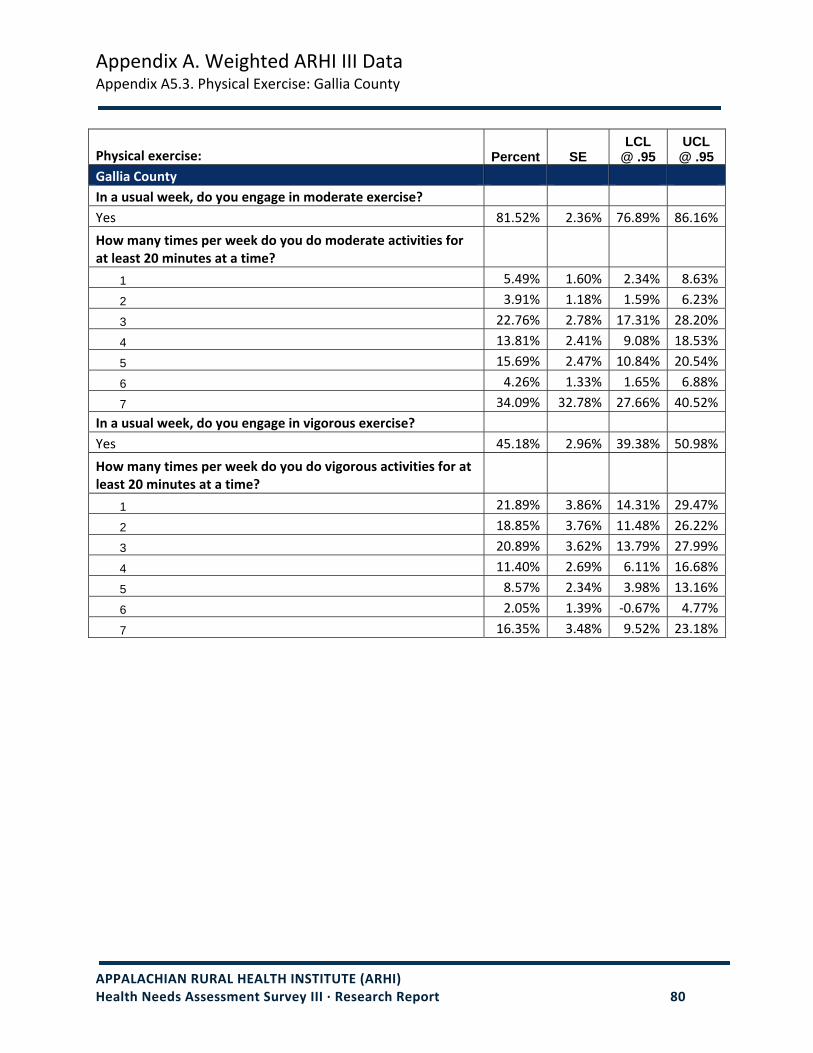
Appendix A. Weighted ARHI III Data Appendix A5.3. Physical Exercise: Gallia County
Physical exercise: Percent SE LCL
@ .95 UCL
@ .95 Gallia County In a usual week, do you engage in moderate exercise? Yes 81.52% 2.36% 76.89% 86.16%
How many times per week do you do moderate activities for at least 20 minutes at a time?
1 5.49% 1.60% 2.34% 8.63%
2 3.91% 1.18% 1.59% 6.23%
3 22.76% 2.78% 17.31% 28.20%
4 13.81% 2.41% 9.08% 18.53%
5 15.69% 2.47% 10.84% 20.54%
6 4.26% 1.33% 1.65% 6.88%
7 34.09% 32.78% 27.66% 40.52%In a usual week, do you engage in vigorous exercise? Yes 45.18% 2.96% 39.38% 50.98%
How many times per week do you do vigorous activities for at least 20 minutes at a time?
1 21.89% 3.86% 14.31% 29.47%
2 18.85% 3.76% 11.48% 26.22%
3 20.89% 3.62% 13.79% 27.99%
4 11.40% 2.69% 6.11% 16.68%
5 8.57% 2.34% 3.98% 13.16%
6 2.05% 1.39% ‐0.67% 4.77%
7 16.35% 3.48% 9.52% 23.18%
APPALACHIAN RURAL HEALTH INSTITUTE (ARHI) Health Needs Assessment Survey III ∙ Research Report 80
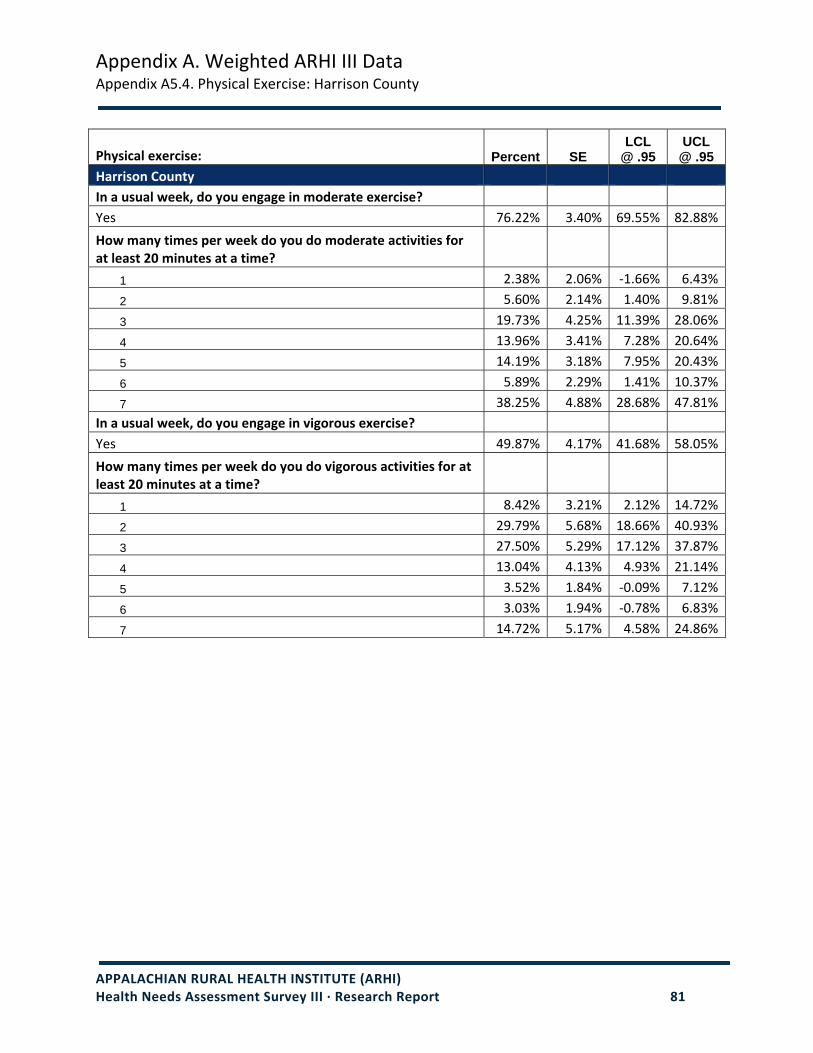
Appendix A. Weighted ARHI III Data Appendix A5.4. Physical Exercise: Harrison County
LCL @ .95 Physical exercise: Percent SE
UCL @ .95
Harrison County In a usual week, do you engage in moderate exercise? Yes 76.22% 3.40% 69.55% 82.88%
How many times per week do you do moderate activities for at least 20 minutes at a time?
1 2.38% 2.06% ‐1.66% 6.43%
2 5.60% 2.14% 1.40% 9.81%
3 19.73% 4.25% 11.39% 28.06%
4 13.96% 3.41% 7.28% 20.64%
5 14.19% 3.18% 7.95% 20.43%
6 5.89% 2.29% 1.41% 10.37%
7 38.25% 4.88% 28.68% 47.81%In a usual week, do you engage in vigorous exercise? Yes 49.87% 4.17% 41.68% 58.05%
How many times per week do you do vigorous activities for at least 20 minutes at a time?
1 8.42% 3.21% 2.12% 14.72%
2 29.79% 5.68% 18.66% 40.93%
3 27.50% 5.29% 17.12% 37.87%
4 13.04% 4.13% 4.93% 21.14%
5 3.52% 1.84% ‐0.09% 7.12%
6 3.03% 1.94% ‐0.78% 6.83%
7 14.72% 5.17% 4.58% 24.86%
APPALACHIAN RURAL HEALTH INSTITUTE (ARHI) Health Needs Assessment Survey III ∙ Research Report 81
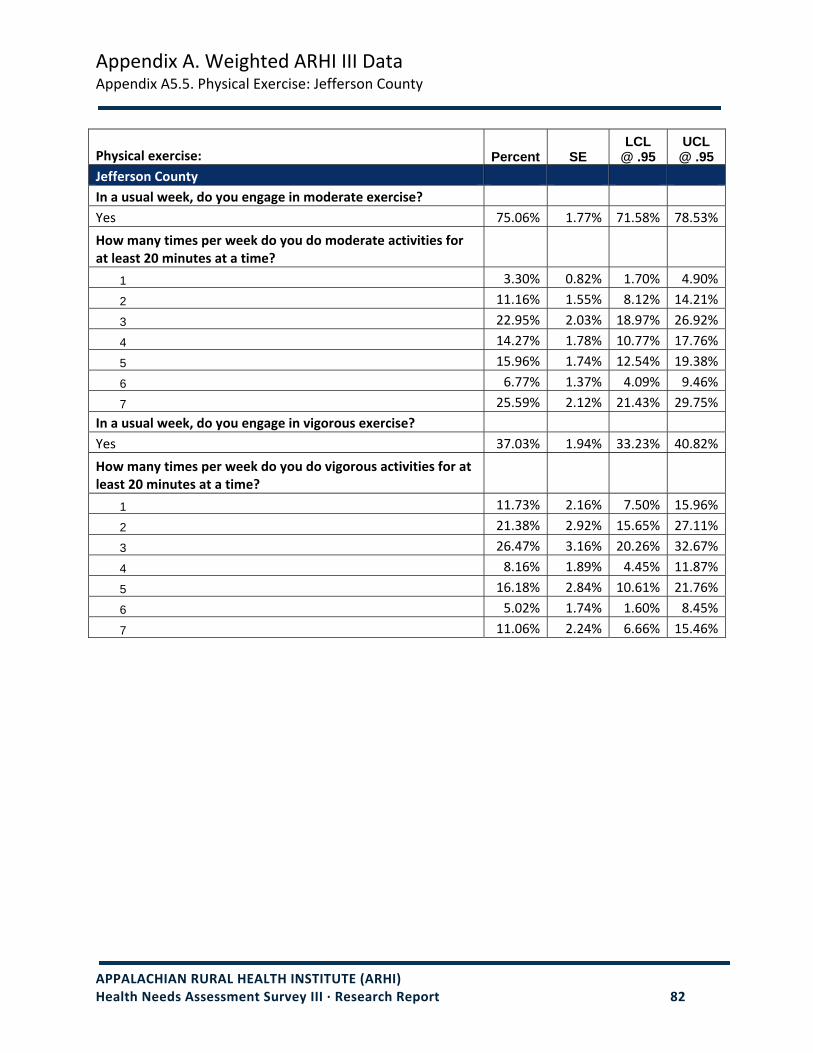
Appendix A. Weighted ARHI III Data Appendix A5.5. Physical Exercise: Jefferson County
Physical exercise: Percent SE LCL
@ .95 UCL
@ .95 Jefferson County In a usual week, do you engage in moderate exercise? Yes 75.06% 1.77% 71.58% 78.53%
How many times per week do you do moderate activities for at least 20 minutes at a time?
1 3.30% 0.82% 1.70% 4.90%
2 11.16% 1.55% 8.12% 14.21%
3 22.95% 2.03% 18.97% 26.92%
4 14.27% 1.78% 10.77% 17.76%
5 15.96% 1.74% 12.54% 19.38%
6 6.77% 1.37% 4.09% 9.46%
7 25.59% 2.12% 21.43% 29.75%In a usual week, do you engage in vigorous exercise? Yes 37.03% 1.94% 33.23% 40.82%
How many times per week do you do vigorous activities for at least 20 minutes at a time?
1 11.73% 2.16% 7.50% 15.96%
2 21.38% 2.92% 15.65% 27.11%
3 26.47% 3.16% 20.26% 32.67%
4 8.16% 1.89% 4.45% 11.87%
5 16.18% 2.84% 10.61% 21.76%
6 5.02% 1.74% 1.60% 8.45%
7 11.06% 2.24% 6.66% 15.46%
APPALACHIAN RURAL HEALTH INSTITUTE (ARHI) Health Needs Assessment Survey III ∙ Research Report 82

Appendix A. Weighted ARHI III Data Appendix A5.6. Physical Exercise: Lawrence County
Physical exercise: Percent SE LCL
@ .95 UCL
@ .95 Lawrence County In a usual week, do you engage in moderate exercise? Yes 78.09% 1.74% 74.68% 81.49%
How many times per week do you do moderate activities for at least 20 minutes at a time?
1 3.29% 0.82% 1.69% 4.90%
2 10.80% 1.53% 7.81% 13.80%
3 25.44% 2.03% 21.47% 29.41%
4 14.20% 1.68% 10.91% 17.49%
5 14.68% 1.70% 11.34% 18.02%
6 6.15% 1.15% 3.90% 8.41%
7 25.43% 2.11% 21.30% 29.56%In a usual week, do you engage in vigorous exercise? Yes 43.10% 2.06% 39.05% 47.14%
How many times per week do you do vigorous activities for at least 20 minutes at a time?
1 21.49% 2.85% 15.91% 27.08%
2 24.19% 2.87% 18.56% 29.82%
3 23.55% 2.84% 17.98% 29.12%
4 9.36% 1.96% 5.52% 13.19%
5 9.10% 1.90% 5.38% 12.83%
6 2.53% 1.01% 0.55% 4.51%
7 9.78% 2.01% 5.84% 13.72%
APPALACHIAN RURAL HEALTH INSTITUTE (ARHI) Health Needs Assessment Survey III ∙ Research Report 83

Appendix A. Weighted ARHI III Data Appendix A5.7. Physical Exercise: Monroe County
Percent SE LCL
@ .95 UCL
@ .95 Physical exercise: Monroe County
In a usual week, do you engage in moderate exercise? Yes 80.50% 3.46% 73.72% 87.29%
How many times per week do you do moderate activities for at least 20 minutes at a time?
7.68% 2.52% 2.74% 12.62%1 8.82% 2.87% 3.19% 14.46%2
24.36% 4.16% 16.20% 32.52%3 12.48% 3.34% 5.92% 19.03%4 17.38% 3.83% 9.88% 24.88%5 1.96% 1.31% ‐0.62% 4.53%6
27.32% 4.75% 18.00% 36.64%7 In a usual week, do you engage in vigorous exercise? Yes 39.45% 4.37% 30.88% 48.02%
How many times per week do you do vigorous activities for at least 20 minutes at a time?
19.67% 4.13% 11.57% 27.76%1 10.55% 4.05% 2.61% 18.50%2 33.76% 6.78% 20.45% 47.07%3 8.13% 3.52% 1.23% 15.03%4
13.14% 3.98% 5.33% 20.94%5 2.44% 2.11% ‐1.70% 6.58%6
7 12.31% 5.30% 1.91% 22.72%
APPALACHIAN RURAL HEALTH INSTITUTE (ARHI) Health Needs Assessment Survey III ∙ Research Report 84

Appendix A. Weighted ARHI III Data Appendix A5.8. Physical Exercise: Muskingum County
Physical exercise: Percent SE LCL
@ .95 UCL
@ .95 Muskingum County In a usual week, do you engage in moderate exercise? Yes 75.34% 1.70% 72.00% 78.68%
How many times per week do you do moderate activities for at least 20 minutes at a time?
1 2.61% 0.67% 1.29% 3.93%
2 14.50% 1.67% 11.22% 17.78%
3 23.84% 2.07% 19.78% 27.90%
4 15.88% 1.75% 12.45% 19.31%
5 14.26% 1.60% 11.12% 17.40%
6 2.88% 0.75% 1.41% 4.35%
7 26.02% 2.10% 21.91% 30.14%In a usual week, do you engage in vigorous exercise? Yes 40.69% 1.98% 36.80% 44.58%
How many times per week do you do vigorous activities for at least 20 minutes at a time?
1 24.01% 2.82% 18.47% 29.55%
2 14.78% 2.28% 10.30% 19.26%
3 29.48% 3.01% 23.58% 35.38%
4 11.32% 2.02% 7.37% 15.28%
5 10.34% 2.00% 6.41% 14.27%
6 2.19% 0.87% 0.48% 3.91%
7 7.87% 1.80% 4.34% 11.40%
APPALACHIAN RURAL HEALTH INSTITUTE (ARHI) Health Needs Assessment Survey III ∙ Research Report 85

Appendix A. Weighted ARHI III Data Appendix A5.9. Physical Exercise: Noble County
Physical exercise: Percent SE LCL
@ .95 UCL
@ .95 Noble County In a usual week, do you engage in moderate exercise? Yes 72.39% 4.88% 62.81% 81.96%
How many times per week do you do moderate activities for at least 20 minutes at a time?
1 3.64% 2.51% ‐1.29% 8.57%
2 7.24% 2.55% 2.24% 12.25%
3 28.84% 5.73% 17.61% 40.07%
4 13.89% 4.20% 5.66% 22.13%
5 7.29% 2.51% 2.36% 12.22%
6 11.80% 4.07% 3.83% 19.78%
7 27.29% 5.80% 15.91% 38.67%In a usual week, do you engage in vigorous exercise? Yes 50.72% 4.42% 42.06% 59.38%
How many times per week do you do vigorous activities for at least 20 minutes at a time?
1 11.34% 4.14% 3.22% 19.46%
2 18.35% 5.29% 7.99% 28.72%
3 29.91% 6.67% 16.83% 42.99%
4 14.78% 4.86% 5.25% 24.30%
5 1.39% 1.14% ‐0.84% 3.63%
6 5.44% 2.72% 0.10% 10.77%
7 18.78% 4.43% 10.10% 27.46%
APPALACHIAN RURAL HEALTH INSTITUTE (ARHI) Health Needs Assessment Survey III ∙ Research Report 86

Appendix A. Weighted ARHI III Data Appendix A6. Smoking
LCL @ .95 Have you smoked at least 100 cigarettes in your entire life? Percent SE
UCL @ .95
Entire 9 County Sample Yes 47.65% 0.81% 46.06% 49.25%If yes: Do you smoke every day, some days, or not at all?
Every day 43.50% 1.14% 41.27% 45.73%
Some days 11.59% 0.78% 10.06% 13.12%
Not at all/I quit 44.91% 1.07% 42.81% 47.02%
Have you smoked at least 100 cigarettes in your entire life? Percent SE LCL
@ .95 UCL
@ .95 Belmont County Yes 47.69% 2.13% 43.51% 51.86%If yes: Do you smoke every day, some days, or not at all?
Every day 38.13% 3.18% 31.89% 44.37%
Some days 13.70% 2.13% 9.52% 17.87%
Not at all/I quit 48.17% 2.96% 42.37% 53.98%
Have you smoked at least 100 cigarettes in your entire life? Percent SE LCL
@ .95 UCL
@ .95 Columbiana County Yes 46.24% 1.74% 42.84% 49.64%If yes: Do you smoke every day, some days, or not at all?
Every day 41.61% 2.27% 37.15% 46.07%
Some days 11.34% 1.59% 8.23% 14.44%
Not at all/I quit 47.05% 2.29% 42.56% 51.55%
Have you smoked at least 100 cigarettes in your entire life? Percent SE LCL
@ .95 UCL
@ .95 Gallia County Yes 52.22% 2.99% 46.35% 58.09%If yes: Do you smoke every day, some days, or not at all?
Every day 44.26% 4.13% 36.17% 52.35%
Some days 10.63% 2.38% 5.96% 15.30%
Not at all/I quit 45.11% 4.02% 37.23% 52.99%
APPALACHIAN RURAL HEALTH INSTITUTE (ARHI) Health Needs Assessment Survey III ∙ Research Report 87

Appendix A. Weighted ARHI III Data Appendix A6. Smoking
LCL @ .95 Have you smoked at least 100 cigarettes in your entire life? Percent SE
UCL @ .95
Harrison County Yes 48.04% 3.95% 40.30% 55.79%If yes: Do you smoke every day, some days, or not at all?
Every day 44.02% 5.95% 32.36% 55.68%
Some days 19.27% 4.94% 9.59% 28.95%
Not at all/I quit 36.71% 5.14% 26.63% 46.79%
Have you smoked at least 100 cigarettes in your entire life? Percent SE LCL
@ .95 UCL
@ .95 Jefferson County Yes 50.36% 2.07% 46.30% 54.43%If yes: Do you smoke every day, some days, or not at all?
Every day 45.80% 2.74% 40.42% 51.18%
Some days 9.56% 1.86% 5.90% 13.21%
Not at all/I quit 44.65% 2.41% 39.91% 49.38%
Have you smoked at least 100 cigarettes in your entire life? Percent SE LCL
@ .95 UCL
@ .95 Lawrence County Yes 49.37% 2.08% 45.30% 53.44%If yes: Do you smoke every day, some days, or not at all?
Every day 53.33% 2.99% 47.46% 59.20%
Some days 4.87% 1.32% 2.28% 7.45%
Not at all/I quit 41.80% 2.91% 36.09% 47.52%
Have you smoked at least 100 cigarettes in your entire life? Percent SE LCL
@ .95 UCL
@ .95 Monroe County Yes 50.17% 4.31% 41.72% 58.61%If yes: Do you smoke every day, some days, or not at all?
Every day 42.42% 6.47% 29.72% 55.11%
Some days 10.41% 3.95% 2.66% 18.15%
Not at all/I quit 47.18% 6.16% 35.09% 59.26%
APPALACHIAN RURAL HEALTH INSTITUTE (ARHI) Health Needs Assessment Survey III ∙ Research Report 88

Appendix A. Weighted ARHI III Data Appendix A6. Smoking
APPALACHIAN RURAL HEALTH INSTITUTE (ARHI) Health Needs Assessment Survey III ∙ Research Report 89
Have you smoked at least 100 cigarettes in your entire life? Percent SE LCL
@ .95 UCL
@ .95 Muskingum County Yes 44.96% 2.06% 40.92% 49.00%If yes: Do you smoke every day, some days, or not at all?
Every day 37.38% 2.93% 31.63% 43.13%
Some days 15.28% 2.35% 10.67% 19.89%
Not at all/I quit 47.35% 2.80% 41.85% 52.84%
Have you smoked at least 100 cigarettes in your entire life? Percent SE LCL
@ .95 UCL
@ .95 Noble County Yes 39.26% 4.61% 30.21% 48.31%If yes: Do you smoke every day, some days, or not at all?
Every day 64.67% 6.97% 51.01% 78.34%
Some days 16.74% 5.72% 5.51% 27.96%
Not at all/I quit 18.59% 4.61% 9.55% 27.63%
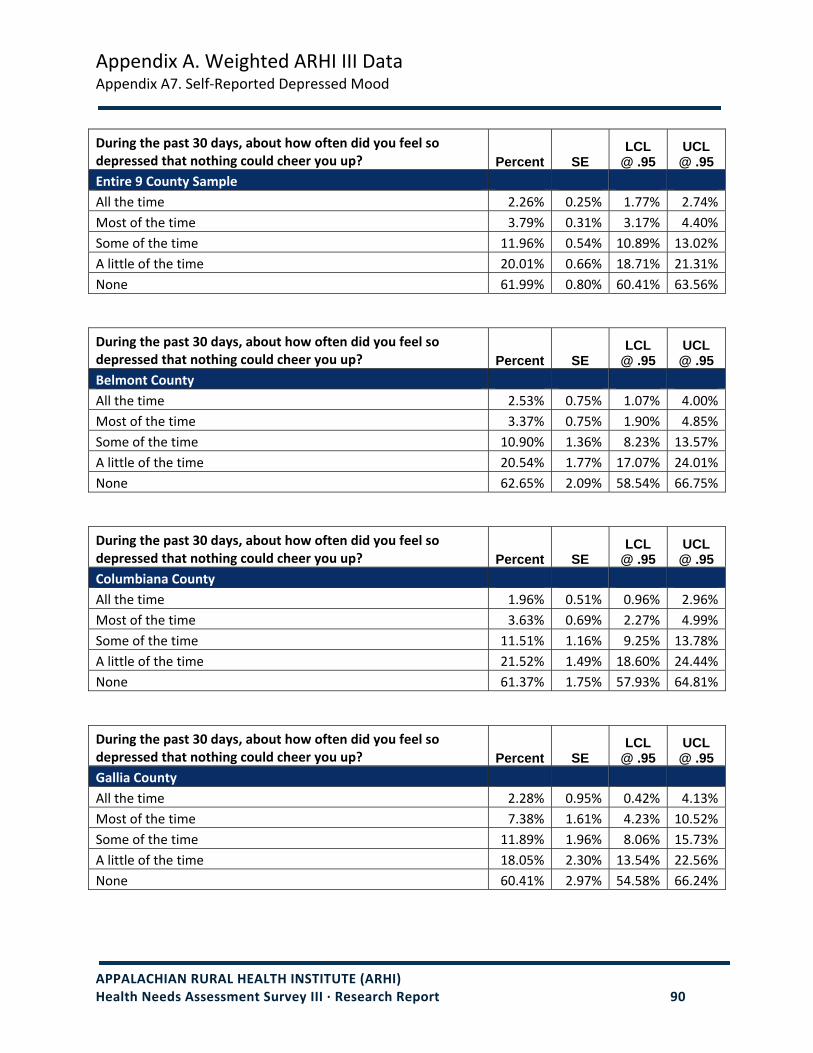
Appendix A. Weighted ARHI III Data Appendix A7. Self‐Reported Depressed Mood
During the past 30 days, about how often did you feel so depressed that nothing could cheer you up? Percent SE
LCL @ .95
UCL @ .95
Entire 9 County Sample All the time 2.26% 0.25% 1.77% 2.74%Most of the time 3.79% 0.31% 3.17% 4.40%Some of the time 11.96% 0.54% 10.89% 13.02%A little of the time 20.01% 0.66% 18.71% 21.31%None 61.99% 0.80% 60.41% 63.56%
During the past 30 days, about how often did you feel so depressed that nothing could cheer you up? Percent SE
LCL @ .95
UCL @ .95
Belmont County All the time 2.53% 0.75% 1.07% 4.00%Most of the time 3.37% 0.75% 1.90% 4.85%Some of the time 10.90% 1.36% 8.23% 13.57%A little of the time 20.54% 1.77% 17.07% 24.01%None 62.65% 2.09% 58.54% 66.75%
During the past 30 days, about how often did you feel so depressed that nothing could cheer you up? Percent SE
LCL @ .95
UCL @ .95
Columbiana County All the time 1.96% 0.51% 0.96% 2.96%Most of the time 3.63% 0.69% 2.27% 4.99%Some of the time 11.51% 1.16% 9.25% 13.78%A little of the time 21.52% 1.49% 18.60% 24.44%None 61.37% 1.75% 57.93% 64.81%
During the past 30 days, about how often did you feel so depressed that nothing could cheer you up? Percent SE
LCL @ .95
UCL @ .95
Gallia County All the time 2.28% 0.95% 0.42% 4.13%Most of the time 7.38% 1.61% 4.23% 10.52%Some of the time 11.89% 1.96% 8.06% 15.73%A little of the time 18.05% 2.30% 13.54% 22.56%None 60.41% 2.97% 54.58% 66.24%
APPALACHIAN RURAL HEALTH INSTITUTE (ARHI) Health Needs Assessment Survey III ∙ Research Report 90

Appendix A. Weighted ARHI III Data Appendix A7. Self‐Reported Depressed Mood
During the past 30 days, about how often did you feel so depressed that nothing could cheer you up? Percent SE
LCL @ .95
UCL @ .95
Harrison County All the time 1.65% 1.11% ‐0.52% 9.70%Most of the time 5.41% 2.19% 1.13% 9.70%Some of the time 11.61% 2.74% 6.24% 16.97%A little of the time 13.05% 2.80% 7.56% 18.55%None 68.28% 4.16% 60.12% 76.44%
During the past 30 days, about how often did you feel so depressed that nothing could cheer you up? Percent SE
LCL @ .95
UCL @ .95
Jefferson County All the time 3.09% 0.70% 1.73% 4.46%Most of the time 3.79% 0.79% 2.24% 5.34%Some of the time 12.13% 1.34% 9.49% 14.76%A little of the time 20.62% 1.72% 17.26% 23.99%None 60.36% 2.02% 56.40% 64.32%
During the past 30 days, about how often did you feel so depressed that nothing could cheer you up? Percent SE
LCL @ .95
UCL @ .95
Lawrence County All the time 2.48% 0.65% 1.21% 3.76%Most of the time 4.35% 0.88% 2.62% 6.09%Some of the time 11.42% 1.35% 8.78% 14.07%A little of the time 20.05% 1.71% 16.70% 23.41%None 61.68% 2.07% 57.64% 65.73%
During the past 30 days, about how often did you feel so depressed that nothing could cheer you up? Percent SE
LCL @ .95
UCL @ .95
Monroe County All the time 3.51% 1.95% ‐0.31% 7.33%Most of the time 2.30% 1.25% ‐0.16% 4.76%Some of the time 10.68% 2.65% 5.48% 15.88%A little of the time 21.90% 3.61% 14.81% 28.98%None 61.61% 4.52% 52.76% 70.47%
APPALACHIAN RURAL HEALTH INSTITUTE (ARHI) Health Needs Assessment Survey III ∙ Research Report 91

Appendix A. Weighted ARHI III Data Appendix A7. Self‐Reported Depressed Mood
APPALACHIAN RURAL HEALTH INSTITUTE (ARHI) Health Needs Assessment Survey III ∙ Research Report 92
During the past 30 days, about how often did you feel so depressed that nothing could cheer you up? Percent SE
LCL @ .95
UCL @ .95
Muskingum County All the time 1.60% 0.48% 0.66% 2.54%Most of the time 2.63% 0.60% 1.45% 3.80%Some of the time 14.11% 1.46% 11.26% 16.97%A little of the time 18.45% 1.49% 15.52% 21.38%None 63.21% 1.93% 59.42% 67.00%
During the past 30 days, about how often did you feel so depressed that nothing could cheer you up? Percent SE
LCL @ .95
UCL @ .95
Noble County All the time 0.79% 0.75% ‐0.69% 2.26%Most of the time 3.41% 2.00% ‐0.52% 7.33%Some of the time 11.65% 3.70% 4.41% 18.90%A little of the time 21.03% 4.12% 12.96% 29.10%None 63.12% 5.14% 53.03% 73.20%
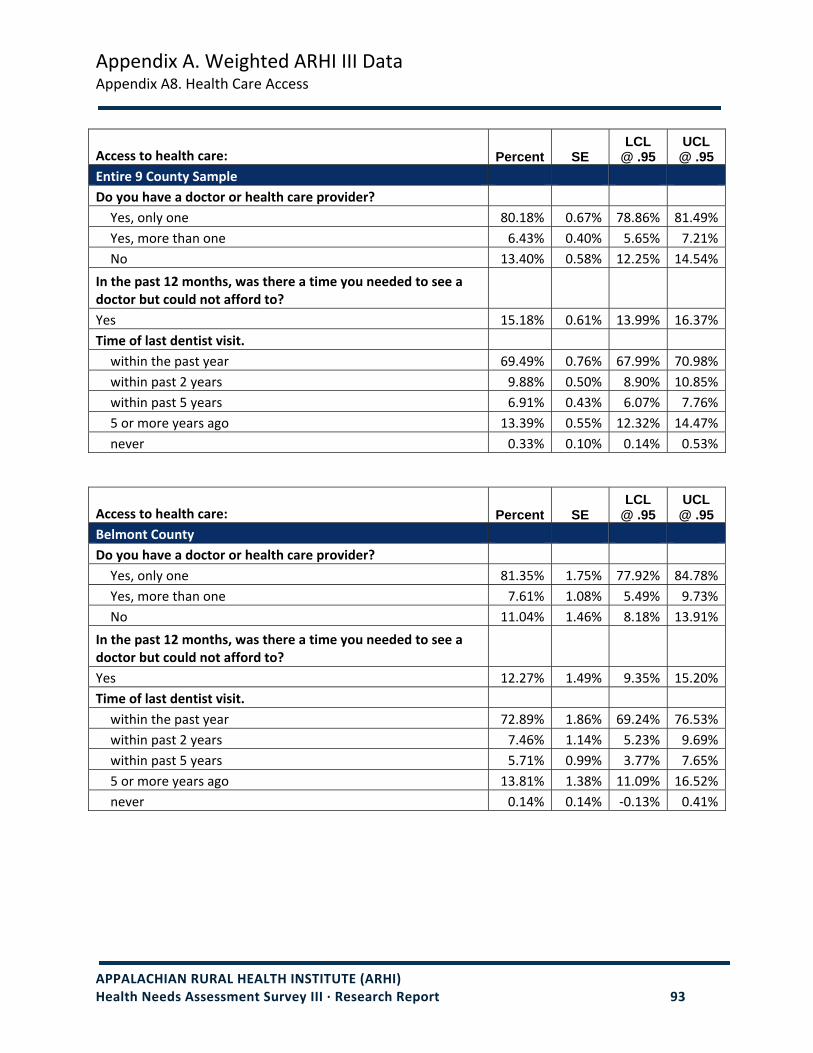
Appendix A. Weighted ARHI III Data Appendix A8. Health Care Access
Access to health care: Percent SE LCL
@ .95 UCL
@ .95 Entire 9 County Sample Do you have a doctor or health care provider? Yes, only one 80.18% 0.67% 78.86% 81.49%Yes, more than one 6.43% 0.40% 5.65% 7.21%No 13.40% 0.58% 12.25% 14.54%
In the past 12 months, was there a time you needed to see a doctor but could not afford to? Yes 15.18% 0.61% 13.99% 16.37%Time of last dentist visit. within the past year 69.49% 0.76% 67.99% 70.98%within past 2 years 9.88% 0.50% 8.90% 10.85%within past 5 years 6.91% 0.43% 6.07% 7.76%5 or more years ago 13.39% 0.55% 12.32% 14.47%never 0.33% 0.10% 0.14% 0.53%
Access to health care: Percent SE LCL
@ .95 UCL
@ .95 Belmont County Do you have a doctor or health care provider? Yes, only one 81.35% 1.75% 77.92% 84.78%Yes, more than one 7.61% 1.08% 5.49% 9.73%No 11.04% 1.46% 8.18% 13.91%
In the past 12 months, was there a time you needed to see a doctor but could not afford to? Yes 12.27% 1.49% 9.35% 15.20%Time of last dentist visit. within the past year 72.89% 1.86% 69.24% 76.53%within past 2 years 7.46% 1.14% 5.23% 9.69%within past 5 years 5.71% 0.99% 3.77% 7.65%5 or more years ago 13.81% 1.38% 11.09% 16.52%never 0.14% 0.14% ‐0.13% 0.41%
APPALACHIAN RURAL HEALTH INSTITUTE (ARHI) Health Needs Assessment Survey III ∙ Research Report 93

Appendix A. Weighted ARHI III Data Appendix A8. Health Care Access
Access to health care: Percent SE LCL
@ .95 UCL
@ .95 Columbiana County Do you have a doctor or health care provider? Yes, only one 83.95% 1.35% 81.29% 86.60%Yes, more than one 3.92% 0.72% 2.50% 5.34%No 12.13% 1.21% 9.75% 14.51%
In the past 12 months, was there a time you needed to see a doctor but could not afford to? Yes 13.91% 1.27% 11.42% 16.41%Time of last dentist visit. within the past year 68.38% 1.69% 65.06% 71.69%within past 2 years 10.93% 1.14% 8.69% 13.17%within past 5 years 6.93% 0.95% 5.07% 8.79%5 or more years ago 13.16% 1.18% 10.85% 15.47%never 0.61% 0.31% 0.00% 1.21%
Access to health care: Percent SE LCL
@ .95 UCL
@ .95 Gallia County Do you have a doctor or health care provider? Yes, only one 76.90% 2.62% 71.78% 82.03%Yes, more than one 3.30% 1.12% 1.12% 5.49%No 19.80% 2.48% 14.94% 24.65%
In the past 12 months, was there a time you needed to see a doctor but could not afford to? Yes 19.55% 2.45% 14.76% 24.35%Time of last dentist visit. within the past year 60.13% 2.99% 54.27% 66.00%within past 2 years 13.70% 2.22% 9.34% 18.06%within past 5 years 10.59% 1.93% 6.81% 14.38%5 or more years ago 14.39% 2.04% 10.39% 18.40%never 1.18% 0.69% ‐0.18% 2.53%
APPALACHIAN RURAL HEALTH INSTITUTE (ARHI) Health Needs Assessment Survey III ∙ Research Report 94
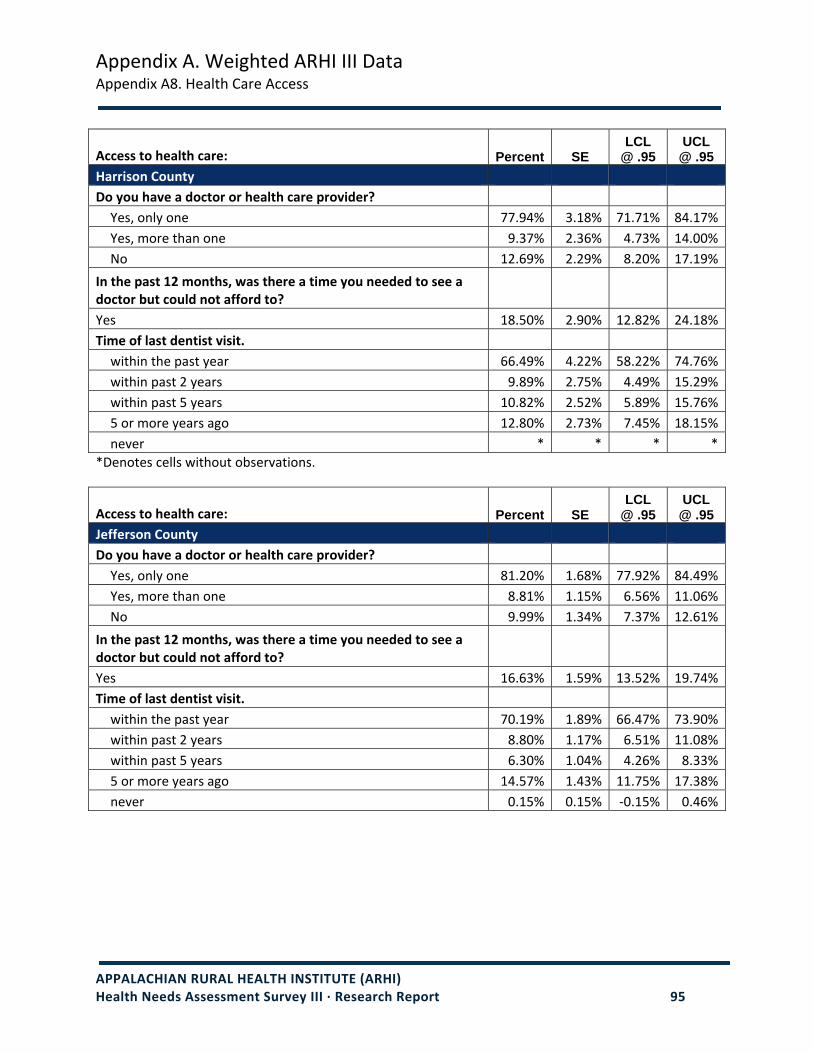
Appendix A. Weighted ARHI III Data Appendix A8. Health Care Access
Access to health care: Percent SE LCL
@ .95 UCL
@ .95 Harrison County Do you have a doctor or health care provider? Yes, only one 77.94% 3.18% 71.71% 84.17%Yes, more than one 9.37% 2.36% 4.73% 14.00%No 12.69% 2.29% 8.20% 17.19%
In the past 12 months, was there a time you needed to see a doctor but could not afford to? Yes 18.50% 2.90% 12.82% 24.18%Time of last dentist visit. within the past year 66.49% 4.22% 58.22% 74.76%within past 2 years 9.89% 2.75% 4.49% 15.29%within past 5 years 10.82% 2.52% 5.89% 15.76%5 or more years ago 12.80% 2.73% 7.45% 18.15%never * * * *
*Denotes cells without observations.
Access to health care: Percent SE LCL
@ .95 UCL
@ .95 Jefferson County Do you have a doctor or health care provider? Yes, only one 81.20% 1.68% 77.92% 84.49%Yes, more than one 8.81% 1.15% 6.56% 11.06%No 9.99% 1.34% 7.37% 12.61%
In the past 12 months, was there a time you needed to see a doctor but could not afford to? Yes 16.63% 1.59% 13.52% 19.74%Time of last dentist visit. within the past year 70.19% 1.89% 66.47% 73.90%within past 2 years 8.80% 1.17% 6.51% 11.08%within past 5 years 6.30% 1.04% 4.26% 8.33%5 or more years ago 14.57% 1.43% 11.75% 17.38%never 0.15% 0.15% ‐0.15% 0.46%
APPALACHIAN RURAL HEALTH INSTITUTE (ARHI) Health Needs Assessment Survey III ∙ Research Report 95
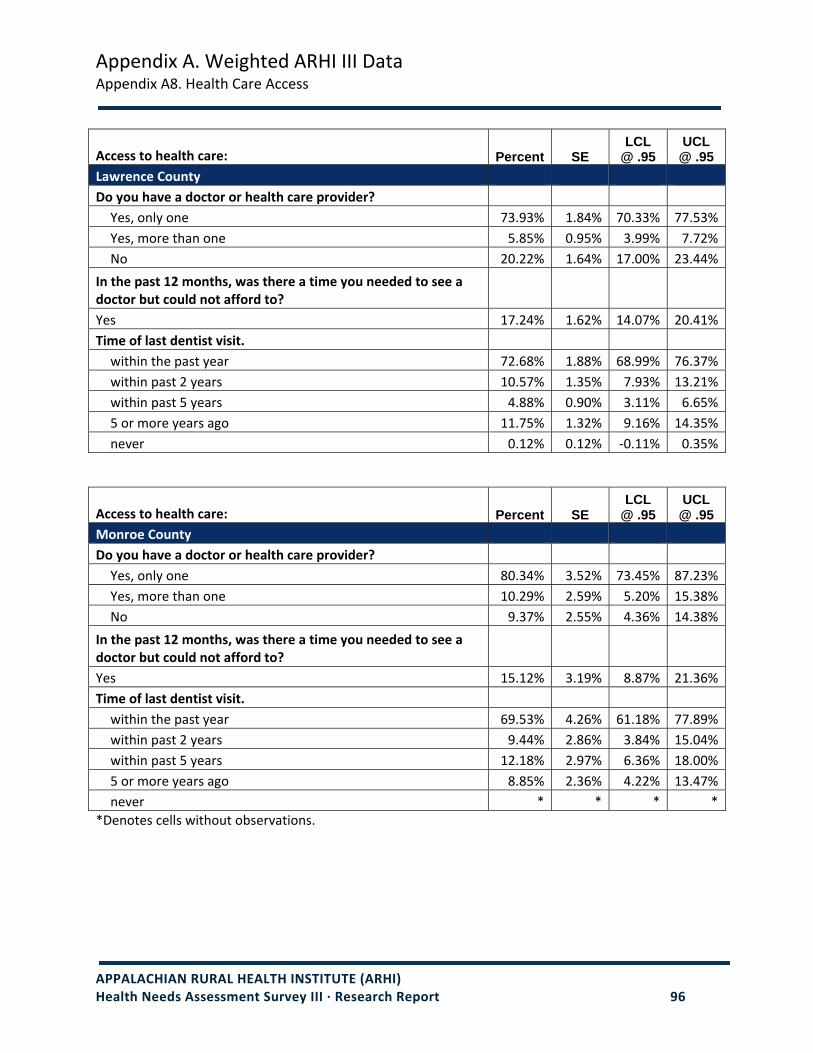
Appendix A. Weighted ARHI III Data Appendix A8. Health Care Access
Access to health care: Percent SE LCL
@ .95 UCL
@ .95 Lawrence County Do you have a doctor or health care provider? Yes, only one 73.93% 1.84% 70.33% 77.53%Yes, more than one 5.85% 0.95% 3.99% 7.72%No 20.22% 1.64% 17.00% 23.44%
In the past 12 months, was there a time you needed to see a doctor but could not afford to? Yes 17.24% 1.62% 14.07% 20.41%Time of last dentist visit. within the past year 72.68% 1.88% 68.99% 76.37%within past 2 years 10.57% 1.35% 7.93% 13.21%within past 5 years 4.88% 0.90% 3.11% 6.65%5 or more years ago 11.75% 1.32% 9.16% 14.35%never 0.12% 0.12% ‐0.11% 0.35%
Access to health care: Percent SE LCL
@ .95 UCL
@ .95 Monroe County Do you have a doctor or health care provider? Yes, only one 80.34% 3.52% 73.45% 87.23%Yes, more than one 10.29% 2.59% 5.20% 15.38%No 9.37% 2.55% 4.36% 14.38%
In the past 12 months, was there a time you needed to see a doctor but could not afford to? Yes 15.12% 3.19% 8.87% 21.36%Time of last dentist visit. within the past year 69.53% 4.26% 61.18% 77.89%within past 2 years 9.44% 2.86% 3.84% 15.04%within past 5 years 12.18% 2.97% 6.36% 18.00%5 or more years ago 8.85% 2.36% 4.22% 13.47%never * * * *
*Denotes cells without observations.
APPALACHIAN RURAL HEALTH INSTITUTE (ARHI) Health Needs Assessment Survey III ∙ Research Report 96

Appendix A. Weighted ARHI III Data Appendix A8. Health Care Access
APPALACHIAN RURAL HEALTH INSTITUTE (ARHI) Health Needs Assessment Survey III ∙ Research Report 97
Access to health care: Percent SE LCL
@ .95 UCL
@ .95 Muskingum County Do you have a doctor or health care provider? Yes, only one 79.07% 1.75% 75.63% 82.50%Yes, more than one 6.91% 1.04% 4.86% 8.95%No 14.03% 1.56% 10.97% 17.08%
In the past 12 months, was there a time you needed to see a doctor but could not afford to? Yes 14.07% 1.53% 11.07% 17.07%Time of last dentist visit. within the past year 70.81% 1.85% 67.17% 74.44%within past 2 years 8.87% 1.12% 6.68% 11.07%within past 5 years 6.86% 1.11% 4.68% 9.04%5 or more years ago 13.13% 1.36% 10.47% 15.80%never 0.32% 0.23% ‐0.12% 0.77%
Access to health care: Percent SE LCL
@ .95 UCL
@ .95 Noble County Do you have a doctor or health care provider? Yes, only one 82.15% 4.21% 73.89% 90.41%Yes, more than one 6.29% 2.29% 1.80% 10.77%No 11.56% 3.80% 4.11% 19.02%
In the past 12 months, was there a time you needed to see a doctor but could not afford to? Yes 16.41% 3.84% 8.87% 23.94%Time of last dentist visit. within the past year 59.14% 5.03% 49.27% 69.00%within past 2 years 14.69% 3.62% 7.59% 21.79%within past 5 years 7.36% 2.69% 2.08% 12.64%5 or more years ago 18.81% 4.29% 10.41% 27.22%never * * * *
*Denotes cells without observations.

Appendix A. Weighted ARHI III Data Appendix A9. Insurance Coverage
Percent SE LCL
@ .95 UCL
@ .95 Health insurance coverage: Entire 9 County Sample 13.56% 0.60% 12.38% 14.73%
No insurance 7.78% 0.39% 7.01% 8.54%
Medicare only 8.65% 0.35% 7.95% 9.34%
Medicare and other 7.22% 0.45% 6.35% 8.10%
Medicaid 56.05% 0.78% 54.51% 57.58%
Private/commercial 1.97%
Military 0.24% 1.50% 2.43%
Other 4.78% 0.35% 4.09% 5.47%
Do you have insurance that pays for at least a part of your prescription costs? Yes 82.04% 0.66% 80.75% 83.33%
Percent SE LCL
@ .95 UCL
@ .95 Health insurance coverage: Belmont County 12.63% 1.54% 9.61% 15.64%
No insurance 12.54% 1.68% 9.25% 15.83%
Medicare only 20.28% 1.57% 17.19% 23.36%
Medicare and other 13.17% 2.08% 9.10% 17.25%
Medicaid 15.16% 0.51% 14.16% 16.16%
Private/commercial 20.27% 5.28%
Military 9.92% 30.61%
Other 15.58% 2.71% 10.27% 20.89%
Do you have insurance that pays for at least a part of your prescription costs? Yes 85.98% 1.56% 82.92% 89.05%
APPALACHIAN RURAL HEALTH INSTITUTE (ARHI) Health Needs Assessment Survey III ∙ Research Report 98

Appendix A. Weighted ARHI III Data Appendix A9. Insurance Coverage
Percent SE LCL
@ .95 UCL
@ .95 Health insurance coverage: Columbiana County 24.67% 1.94% 20.87% 28.46%
No insurance 23.03% 2.18% 18.77% 27.30%
Medicare only 17.72% 1.69% 14.42% 21.03%
Medicare and other 21.79% 2.62% 16.65% 26.93%
Medicaid 23.42% 0.62% 22.21% 24.63%
Private/commercial 34.84%
Military 5.90% 23.27% 46.41%
Other 24.23% 3.25% 17.65% 30.40%
Do you have insurance that pays for at least a part of your prescription costs? Yes 82.02% 1.44% 79.19% 84.86%
Percent SE LCL
@ .95 UCL
@ .95 Health insurance coverage: Gallia County 6.83% 1.02% 4.84% 8.82%
No insurance 6.69% 1.11% 4.52% 8.87%
Medicare only 4.51% 0.81% 2.91% 6.10%
Medicare and other 10.17% 1.75% 6.75% 13.60%
Medicaid 6.11% 0.32% 5.48% 6.74%
Private/commercial 5.61% 2.43% 0.85%
Military 10.37%
Other 5.62% 1.65% 2.39% 8.85%
Do you have insurance that pays for at least a part of your prescription costs? Yes 80.58% 2.51% 75.65% 85.51%
APPALACHIAN RURAL HEALTH INSTITUTE (ARHI) Health Needs Assessment Survey III ∙ Research Report 99

Appendix A. Weighted ARHI III Data Appendix A9. Insurance Coverage
Percent SE LCL
@ .95 UCL
@ .95 Health insurance coverage: Harrison County 3.39% 0.76% 1.90% 4.89%
No insurance 4.34% 1.05% 2.28% 6.41%
Medicare only 3.84% 0.82% 2.23% 5.46%
Medicare and other 2.58% 0.91% 0.80% 4.37%
Medicaid 3.20% 0.24% 2.73% 3.66%
Private/commercial 2.59% 1.73% ‐0.79%
Military 5.98%
Other 3.79% 1.33% 1.18% 6.41%
Do you have insurance that pays for at least a part of your prescription costs? Yes 78.67% 3.79% 71.23% 86.11%
Percent SE LCL
@ .95 UCL
@ .95 Health insurance coverage: Jefferson County 14.30% 1.57% 11.22% 17.38%
No insurance 18.92% 2.05% 14.90% 22.95%
Medicare only 20.55% 1.66% 17.29% 23.81%
Medicare and other 15.06% 2.27% 10.61% 19.50%
Medicaid 15.67% 0.51% 14.67% 16.67%
Private/commercial 12.14%
Military 3.58% 5.13% 19.16%
Other 12.37% 2.55% 7.39% 17.37%
Do you have insurance that pays for at least a part of your prescription costs? Yes 82.13% 1.69% 78.82% 85.44%
APPALACHIAN RURAL HEALTH INSTITUTE (ARHI) Health Needs Assessment Survey III ∙ Research Report 100

Appendix A. Weighted ARHI III Data Appendix A9. Insurance Coverage
Percent SE LCL
@ .95 UCL
@ .95 Health insurance coverage: Lawrence County 12.42% 1.35% 9.76% 15.07%
No insurance 14.36% 1.63% 11.17% 17.55%
Medicare only 10.76% 1.19% 8.43% 13.09%
Medicare and other 12.89% 1.89% 9.18% 16.61%
Medicaid 13.29% 0.43% 12.44% 14.14%
Private/commercial 14.48%
Military 3.76% 7.10% 21.85%
Other 9.93% 2.02% 5.96% 13.90%
Do you have insurance that pays for at least a part of your prescription costs? Yes 82.07% 1.73% 78.69% 85.45%
Percent SE LCL
@ .95 UCL
@ .95 Health insurance coverage: Monroe County 3.01% 0.72% 1.59% 4.43%
No insurance 3.13% 0.85% 1.47% 4.80%
Medicare only 3.33% 0.71% 1.94% 4.72%
Medicare and other 2.89% 0.94% 1.05% 4.73%
Medicaid 3.24% 0.22% 2.81% 3.68%
Private/commercial * * *
Military *
Other 4.36% 1.42% 1.56% 7.14%
Do you have insurance that pays for at least a part of your prescription costs? Yes 84.71% 3.36% 78.12% 91.30%
*Denotes cells without observations
APPALACHIAN RURAL HEALTH INSTITUTE (ARHI) Health Needs Assessment Survey III ∙ Research Report 101

Appendix A. Weighted ARHI III Data Appendix A9. Insurance Coverage
APPALACHIAN RURAL HEALTH INSTITUTE (ARHI) Health Needs Assessment Survey III ∙ Research Report 102
Health insurance coverage: Percent SE LCL
@ .95 UCL
@ .95 Muskingum County
No insurance 19.40% 1.75% 15.97% 22.82%
Medicare only 15.13% 1.80% 11.60% 18.66%
Medicare and other 16.25% 1.54% 13.22% 19.27%
Medicaid 19.96% 2.59% 14.88% 25.04%
Private/commercial 16.47% 0.53% 15.43% 17.52%
Military 10.08% 3.34% 3.53% 16.63%
Other 22.15% 3.00% 16.27% 28.03%
Do you have insurance that pays for at least a part of your prescription costs? Yes 79.55% 1.58% 76.45% 82.65%
Health insurance coverage: Percent SE LCL
@ .95 UCL
@ .95 Noble County
No insurance 3.37% 0.86% 1.68% 5.06%
Medicare only 1.84% 0.63% 0.61% 3.07%
Medicare and other 2.77% 0.62% 1.55% 3.99%
Medicaid 1.48% 0.56% 0.37% 2.58%
Private/commercial 3.44% 0.22% 3.00% 3.87%
Military * * * *
Other 2.18% 1.02% 0.18% 4.17%
Do you have insurance that pays for at least a part of your prescription costs? Yes 79.79% 4.43% 71.10% 88.47%
*Denotes cells without observations

Appendix B. Weighted Demographics
APPALACHIAN RURAL HEALTH INSTITUTE (ARHI) Health Needs Assessment Survey III ∙ Research Report 103
Demographics: Percent SE LCL
@ .95 UCL @
.95 Entire 9 County Sample Age 18 to 24 11.12% 0.00% 11.12% 11.12%25 to 34 16.04% 0.00% 16.04% 16.04%35 to 44 20.15% 0.00% 20.15% 20.15%45 to 54 18.75% 0.00% 18.75% 18.75%55 to 64 13.22% 0.00% 13.22% 13.22%65 and over 20.72% 0.00% 20.72% 20.72%
Income Less than $15,000 17.49% 0.79% 15.94% 19.04%$15,000 to $24,999 15.79% 0.75% 14.32% 17.26%$25,000 to $34,999 13.65% 0.66% 12.35% 14.95%$35,000 to $49,999 14.25% 0.66% 12.96% 15.55%$50,000 to $74,999 20.08% 0.75% 18.61% 21.55%$75,000 or more 18.74% 0.71% 17.36% 20.13%
Gender Male 48.09% 0.00% 48.09% 48.09%Female 51.91% 0.00% 51.91% 51.91%
Employment Employed 54.21% 0.74% 52.77% 55.66%Unemployed 11.35% 0.54% 10.30% 12.41%A homemaker 5.80% 0.36% 5.09% 6.50%A student 3.68% 0.36% 2.98% 4.38%Retired 20.60% 0.39% 19.84% 21.36%Unable to work 4.35% 0.33% 3.71% 4.99%
Education Never attended school 0.05% 0.03% ‐0.02% 0.11%Grade 1‐8 1.56% 0.20% 1.18% 1.95%Grades 9‐11 (some high school) 6.91% 0.44% 6.05% 7.77%Grade 12 or GED (high school graduate) 43.00% 0.82% 41.38% 44.61%College 1‐3 years (some college) 27.09% 0.74% 25.64% 28.53%College 4 or more (college graduate) 21.39% 0.66% 20.09% 22.69%
Ethnicity White 96.19% 0.35% 95.50% 96.88%Black or African American 1.80% 0.25% 1.31% 2.28%Asian 0.11% 0.05% 0.01% 0.21%Native Hawaiian or Pacific Islander 0.03% 0.02% ‐0.02% 0.07%American Indian or Alaskan Native 0.74% 0.14% 0.47% 1.02%Other 1.13% 0.21% 0.72% 1.54%
When a standard error is a true zero, the confidence intervals are equal to the percentage.

Appendix B. Weighted Demographics Appendix B1. Weighted Demographics: Belmont County
Demographics: Percent SE LCL
@ .95 UCL
@ .95 Belmont County Age 18 to 24 9.86% 0.00% 9.86% 9.86%25 to 34 15.26% 0.00% 15.26% 15.26%35 to 44 19.82% 0.00% 19.82% 19.82%45 to 54 19.16% 0.00% 19.16% 19.16%55 to 64 12.68% 0.00% 12.68% 12.68%65 and over 23.22% 0.00% 23.22% 23.22%
Income Less than $15,000 19.89% 2.09% 15.80% 23.98%$15,000 to $24,999 13.76% 1.77% 10.29% 17.23%$25,000 to $34,999 15.29% 1.87% 11.62% 18.97%$35,000 to $49,999 13.58% 1.77% 10.11% 17.05%$50,000 to $74,999 18.60% 1.84% 15.00% 22.21%$75,000 or more 18.87% 1.94% 15.07% 22.67%
Gender Male 48.35% 0.00% 48.35% 48.35%Female 51.65% 0.00% 51.65% 51.65%
Employment Employed 55.73% 1.88% 52.04% 59.41%Unemployed 8.33% 1.17% 6.05% 10.62%A homemaker 5.55% 0.91% 3.77% 7.32%A student 4.36% 1.06% 2.27% 6.44%Retired 21.11% 1.03% 19.09% 23.13%Unable to work 4.93% 0.83% 3.31% 6.56%
Education Never attended school * * * *Grade 1‐8 1.58% 0.49% 0.61% 2.54%Grades 9‐11 (some high school) 7.27% 1.19% 4.94% 9.60%Grade 12 or GED (high school graduate) 41.79% 2.13% 37.62% 45.97%College 1‐3 years (some college) 30.65% 2.02% 26.69% 34.62%College 4 or more (college graduate) 18.70% 1.67% 15.42% 21.98%
Ethnicity White 95.79% 1.00% 93.83% 97.74%Black or African American 2.17% 0.83% 0.55% 3.80%Asian 0.31% 0.22% ‐0.11% 0.73%Native Hawaiian or Pacific Islander * * * *American Indian or Alaskan Native 0.32% 0.22% ‐0.12% 0.76%Other 1.41% 0.46% 0.50% 2.32%
*Denotes cells without observations. When a standard error is a true zero, the confidence intervals are equal to the percentage.
APPALACHIAN RURAL HEALTH INSTITUTE (ARHI) Health Needs Assessment Survey III ∙ Research Report 104

Appendix B. Weighted Demographics Appendix B2. Weighted Demographics: Columbiana County
Demographics: Percent SE LCL
@ .95 UCL
@ .95 Columbiana County Age 18 to 24 10.37% 0.00% 10.37% 10.37%25 to 34 16.72% 0.00% 16.72% 16.72%35 to 44 21.07% 0.00% 21.07% 21.07%45 to 54 19.17% 0.00% 19.17% 19.17%55 to 64 12.80% 0.00% 12.80% 12.80%65 and over 19.86% 0.00% 19.86% 19.86%
Income Less than $15,000 16.02% 1.66% 12.77% 19.26%$15,000 to $24,999 14.47% 1.53% 11.47% 17.46%$25,000 to $34,999 12.99% 1.35% 10.35% 15.62%$35,000 to $49,999 15.10% 1.57% 12.02% 18.18%$50,000 to $74,999 21.83% 1.82% 18.26% 25.41%$75,000 or more 19.59% 1.51% 16.63% 22.56%
Gender Male 49.14% 0.00% 49.14% 49.14%Female 50.86% 0.00% 50.86% 50.86%
Employment Employed 52.62% 1.61% 49.46% 55.77%Unemployed 14.29% 1.27% 11.79% 16.79%A homemaker 5.03% 0.76% 3.53% 6.52%A student 2.82% 0.66% 1.54% 4.11%Retired 19.69% 0.79% 18.13% 21.25%Unable to work 5.56% 0.84% 3.90% 7.21%
Education Never attended school * * * *Grade 1‐8 1.69% 0.44% 0.84% 2.55%Grades 9‐11 (some high school) 7.10% 0.96% 5.23% 8.97%Grade 12 or GED (high school graduate) 42.45% 1.75% 39.03% 45.87%College 1‐3 years (some college) 26.00% 1.54% 22.98% 29.03%College 4 or more (college graduate) 22.75% 1.48% 19.85% 25.65%
Ethnicity White 96.19% 0.78% 94.66% 97.72%Black or African American 2.03% 0.59% 0.87% 3.20%Asian * * * *Native Hawaiian or Pacific Islander * * * *American Indian or Alaskan Native 0.54% 0.27% 0.01% 1.06%Other 1.24% 0.47% 0.33% 2.16%
*Denotes cells without observations. When a standard error is a true zero, the confidence intervals are equal to the percentage.
APPALACHIAN RURAL HEALTH INSTITUTE (ARHI) Health Needs Assessment Survey III ∙ Research Report 105

Appendix B. Weighted Demographics Appendix B3. Weighted Demographics: Gallia County
Demographics: Percent SE LCL
@ .95 UCL @
.95 Gallia County Age 18 to 24 12.98% 0.00% 12.98% 12.98%25 to 34 15.69% 0.00% 15.69% 15.69%35 to 44 20.99% 0.00% 20.99% 20.99%45 to 54 18.24% 0.00% 18.24% 18.24%55 to 64 14.02% 0.00% 14.02% 14.02%65 and over 18.07% 0.00% 18.07% 18.07%
Income Less than $15,000 21.68% 2.95% 15.90% 27.46%$15,000 to $24,999 11.45% 2.47% 6.62% 16.29%$25,000 to $34,999 14.38% 2.42% 9.63% 19.12%$35,000 to $49,999 16.40% 2.63% 11.25% 21.55%$50,000 to $74,999 16.46% 2.44% 11.68% 21.24%$75,000 or more 19.63% 2.38% 14.95% 24.30%
Gender Male 47.95% 0.00% 47.95% 47.95%Female 52.05% 0.00% 52.05% 52.05%
Employment Employed 53.72% 2.72% 48.38% 59.06%Unemployed 14.94% 2.21% 10.60% 19.28%A homemaker 5.47% 1.31% 2.89% 8.04%A student 3.17% 1.11% 1.00% 5.35%Retired 18.78% 1.34% 16.15% 21.40%Unable to work 3.92% 1.15% 1.67% 6.17%
Education Never attended school * * * *Grade 1‐8 1.85% 0.75% 0.37% 3.32%Grades 9‐11 (some high school) 9.29% 1.77% 5.83% 12.75%Grade 12 or GED (high school graduate) 43.63% 3.05% 37.64% 49.62%College 1‐3 years (some college) 21.71% 2.45% 16.90% 26.52%College 4 or more (college graduate) 23.53% 2.56% 18.50% 28.56%
Ethnicity White 96.39% 1.13% 94.18% 98.60%Black or African American 0.35% 0.35% ‐0.33% 1.04%Asian * * * *Native Hawaiian or Pacific Islander * * * *American Indian or Alaskan Native 2.65% 0.99% 0.71% 4.60%Other 0.60% 0.43% ‐0.24% 1.45%
*Denotes cells without observations. When a standard error is a true zero, the confidence intervals are equal to the percentage.
APPALACHIAN RURAL HEALTH INSTITUTE (ARHI) Health Needs Assessment Survey III ∙ Research Report 106

Appendix B. Weighted Demographics Appendix B4. Weighted Demographics: Harrison County
Demographics: Percent SE LCL
@ .95 UCL
@ .95 Harrison County Age 18 to 24 8.92% 0.00% * *25 to 34 14.41% 0.00% * *35 to 44 20.17% 0.00% * *45 to 54 19.39% 0.00% * *55 to 64 14.15% 0.00% * *65 and over 22.97% 0.00% * *
Income Less than $15,000 15.17% 3.61% 8.10% 22.25%$15,000 to $24,999 15.96% 3.65% 8.80% 23.11%$25,000 to $34,999 23.23% 3.88% 15.63% 30.83%$35,000 to $49,999 13.86% 3.38% 7.23% 20.49%$50,000 to $74,999 19.06% 3.57% 12.06% 26.06%$75,000 or more 12.72% 3.23% 6.38% 19.05%
Gender Male 47.33% 0.00% * *Female 52.67% 0.00% * *
Employment Employed 57.10% 4.06% 49.14% 65.05%Unemployed 5.52% 1.92% 1.76% 9.28%A homemaker 8.70% 2.63% 3.53% 13.86%A student 0.75% 0.72% ‐0.66% 2.16%Retired 23.43% 2.76% 18.02% 28.84%Unable to work 4.51% 1.71% 1.15% 7.87%
Education Never attended school * * * *Grade 1‐8 2.21% 1.19% ‐0.13% 4.56%Grades 9‐11 (some high school) 8.59% 2.29% 4.11% 13.08%Grade 12 or GED (high school graduate) 51.16% 4.34% 42.66% 59.67%College 1‐3 years (some college) 21.85% 3.70% 14.60% 29.09%College 4 or more (college graduate) 16.19% 2.95% 10.41% 21.97%
Ethnicity White 98.34% 1.12% 96.15% 100.53%Black or African American 0.75% 0.72% ‐0.67% 2.17%Asian * * * *Native Hawaiian or Pacific Islander * * * *American Indian or Alaskan Native * * * *Other 0.91% 0.85% ‐0.76% 2.58%
*Denotes cells without observations. When a standard error rounds to zero, accurate confidence intervals cannot be calculated.
APPALACHIAN RURAL HEALTH INSTITUTE (ARHI) Health Needs Assessment Survey III ∙ Research Report 107

Appendix B. Weighted Demographics Appendix B5. Weighted Demographics: Jefferson County
Demographics: Percent SE LCL
@ .95 UCL
@ .95 Jefferson County Age 18 to 24 10.80% 0.00% 10.80% 10.80%25 to 34 13.93% 0.00% 13.93% 13.93%35 to 44 18.61% 0.00% 18.61% 18.61%45 to 54 19.31% 0.00% 19.31% 19.31%55 to 64 13.67% 0.00% 13.67% 13.67%65 and over 23.68% 0.00% 23.68% 23.68%
Income Less than $15,000 17.07% 1.95% 13.25% 20.90%$15,000 to $24,999 20.09% 2.03% 16.11% 24.07%$25,000 to $34,999 11.39% 1.52% 8.42% 14.36%$35,000 to $49,999 13.56% 1.55% 10.53% 16.60%$50,000 to $74,999 19.92% 1.94% 16.12% 23.72%$75,000 or more 17.97% 1.87% 14.30% 21.63%
Gender Male 46.66% 0.00% 46.66% 46.66%Female 53.34% 0.00% 53.34% 53.34%
Employment Employed 51.77% 1.83% 48.18% 55.36%Unemployed 9.35% 1.23% 6.94% 11.76%A homemaker 5.80% 0.89% 4.05% 7.54%A student 5.14% 0.97% 3.24% 7.04%Retired 24.76% 0.96% 22.89% 26.64%Unable to work 3.18% 0.69% 1.83% 4.54%
Education Never attended school 0.15% 0.15% ‐0.15% 0.45%Grade 1‐8 0.90% 0.36% 0.19% 1.61%Grades 9‐11 (some high school) 5.91% 1.04% 3.87% 7.95%Grade 12 or GED (high school graduate) 41.59% 2.07% 37.54% 45.64%College 1‐3 years (some college) 28.17% 1.92% 24.40% 31.93%College 4 or more (college graduate) 23.28% 1.74% 19.86% 26.69%
Ethnicity White 95.46% 0.85% 93.80% 97.13%Black or African American 2.82% 0.69% 1.47% 4.17%Asian * * * *Native Hawaiian or Pacific Islander 0.16% 0.16% ‐0.15% 0.46%American Indian or Alaskan Native 0.65% 0.32% 0.02% 1.27%Other 0.91% 0.37% 0.19% 1.63%
*Denotes cells without observations. When a standard error is a true zero, the confidence intervals are equal to the percentage.
APPALACHIAN RURAL HEALTH INSTITUTE (ARHI) Health Needs Assessment Survey III ∙ Research Report 108

Appendix B. Weighted Demographics Appendix B6. Weighted Demographics: Lawrence County
Demographics: Percent SE LCL
@ .95 UCL
@ .95 Lawrence County Age 18 to 24 11.38% 0.00% 11.38% 11.38%25 to 34 17.39% 0.00% 17.39% 17.39%35 to 44 19.68% 0.00% 19.68% 19.68%45 to 54 18.39% 0.00% 18.39% 18.39%55 to 64 14.10% 0.00% 14.10% 14.10%65 and over 19.06% 0.00% 19.06% 19.06%
Income Less than $15,000 16.10% 1.64% 12.88% 19.32%$15,000 to $24,999 15.73% 1.74% 12.33% 19.13%$25,000 to $34,999 15.59% 1.67% 12.32% 18.87%$35,000 to $49,999 12.40% 1.57% 9.32% 15.47%$50,000 to $74,999 20.25% 1.83% 16.66% 23.84%$75,000 or more 19.93% 1.84% 16.33% 23.53%
Gender Male 46.92% 0.00% 46.92% 46.92%Female 53.08% 0.00% 53.08% 53.08%
Employment Employed 55.50% 1.84% 51.90% 59.11%Unemployed 10.13% 1.32% 7.53% 12.72%A homemaker 6.20% 0.98% 4.28% 8.12%A student 3.16% 0.81% 1.57% 4.75%Retired 20.73% 1.02% 18.73% 22.72%Unable to work 4.29% 0.81% 2.69% 5.88%
Education Never attended school * * * *Grade 1‐8 1.81% 0.56% 0.71% 2.92%Grades 9‐11 (some high school) 5.63% 0.94% 3.78% 7.49%Grade 12 or GED (high school graduate) 37.43% 2.05% 33.42% 41.44%College 1‐3 years (some college) 33.10% 2.00% 29.19% 37.01%College 4 or more (college graduate) 22.02% 1.70% 18.68% 25.36%
Ethnicity White 96.22% 0.81% 94.64% 97.79%Black or African American 1.53% 0.49% 0.56% 2.49%Asian 0.30% 0.22% ‐0.13% 0.73%Native Hawaiian or Pacific Islander * * * *American Indian or Alaskan Native 1.30% 0.48% 0.35% 2.24%Other 0.66% 0.38% ‐0.09% 1.41%
*Denotes cells without observations. When a standard error is a true zero, the confidence intervals are equal to the percentage.
APPALACHIAN RURAL HEALTH INSTITUTE (ARHI) Health Needs Assessment Survey III ∙ Research Report 109
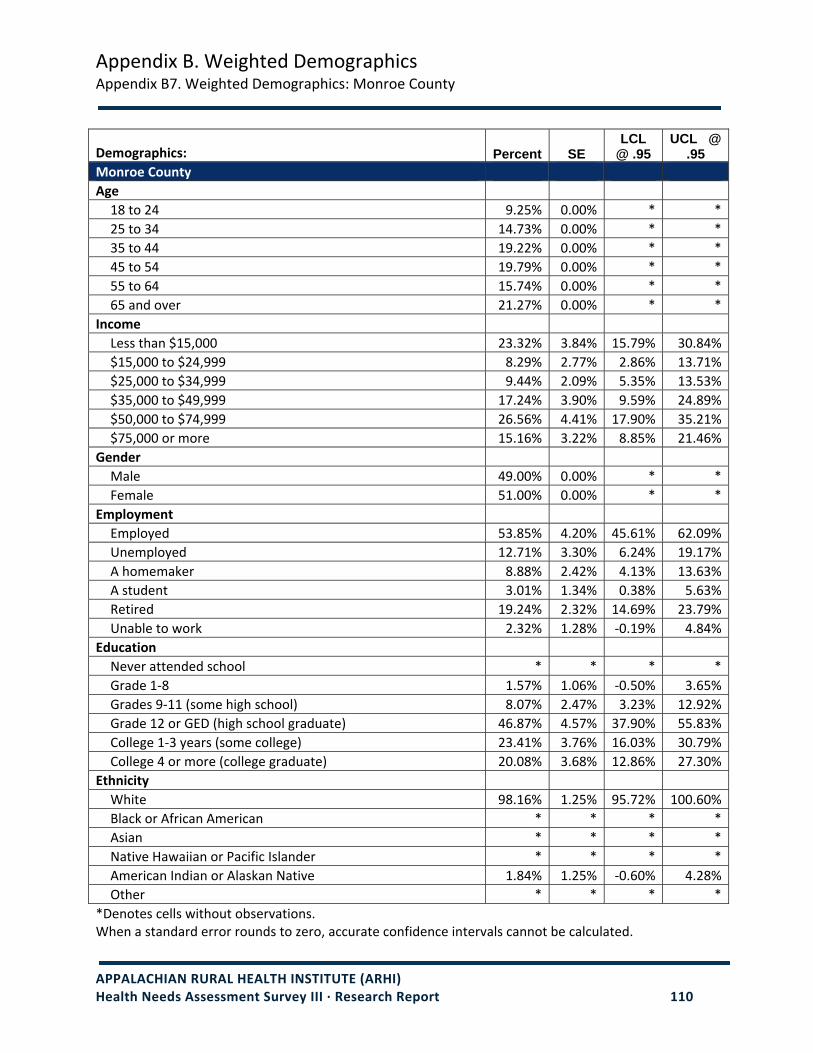
Appendix B. Weighted Demographics Appendix B7. Weighted Demographics: Monroe County
Demographics: Percent SE LCL
@ .95 UCL @
.95 Monroe County Age 18 to 24 9.25% 0.00% * *25 to 34 14.73% 0.00% * *35 to 44 19.22% 0.00% * *45 to 54 19.79% 0.00% * *55 to 64 15.74% 0.00% * *65 and over 21.27% 0.00% * *
Income Less than $15,000 23.32% 3.84% 15.79% 30.84%$15,000 to $24,999 8.29% 2.77% 2.86% 13.71%$25,000 to $34,999 9.44% 2.09% 5.35% 13.53%$35,000 to $49,999 17.24% 3.90% 9.59% 24.89%$50,000 to $74,999 26.56% 4.41% 17.90% 35.21%$75,000 or more 15.16% 3.22% 8.85% 21.46%
Gender Male 49.00% 0.00% * *Female 51.00% 0.00% * *
Employment Employed 53.85% 4.20% 45.61% 62.09%Unemployed 12.71% 3.30% 6.24% 19.17%A homemaker 8.88% 2.42% 4.13% 13.63%A student 3.01% 1.34% 0.38% 5.63%Retired 19.24% 2.32% 14.69% 23.79%Unable to work 2.32% 1.28% ‐0.19% 4.84%
Education Never attended school * * * *Grade 1‐8 1.57% 1.06% ‐0.50% 3.65%Grades 9‐11 (some high school) 8.07% 2.47% 3.23% 12.92%Grade 12 or GED (high school graduate) 46.87% 4.57% 37.90% 55.83%College 1‐3 years (some college) 23.41% 3.76% 16.03% 30.79%College 4 or more (college graduate) 20.08% 3.68% 12.86% 27.30%
Ethnicity White 98.16% 1.25% 95.72% 100.60%Black or African American * * * *Asian * * * *Native Hawaiian or Pacific Islander * * * *American Indian or Alaskan Native 1.84% 1.25% ‐0.60% 4.28%Other * * * *
*Denotes cells without observations. When a standard error rounds to zero, accurate confidence intervals cannot be calculated.
APPALACHIAN RURAL HEALTH INSTITUTE (ARHI) Health Needs Assessment Survey III ∙ Research Report 110

Appendix B. Weighted Demographics Appendix B8. Weighted Demographics: Muskingum County
Demographics: Percent SE LCL
@ .95 UCL
@ .95 Muskingum County Age 18 to 24 12.74% 0.00% 12.74% 12.74%25 to 34 16.85% 0.00% 16.85% 16.85%35 to 44 20.55% 0.00% 20.55% 20.55%45 to 54 17.97% 0.00% 17.97% 17.97%55 to 64 12.59% 0.00% 12.59% 12.59%65 and over 19.30% 0.00% 19.30% 19.30%
Income Less than $15,000 16.95% 2.28% 12.48% 21.43%$15,000 to $24,999 17.48% 2.19% 13.18% 21.78%$25,000 to $34,999 13.67% 1.91% 9.93% 17.41%$35,000 to $49,999 13.84% 1.47% 10.97% 16.72%$50,000 to $74,999 19.13% 1.72% 15.76% 22.50%$75,000 or more 18.92% 1.74% 15.51% 22.33%
Gender Male 46.92% 0.00% 46.92% 46.92%Female 53.08% 0.00% 53.08% 53.08%
Employment Employed 54.44% 1.89% 50.73% 58.14%Unemployed 13.50% 1.53% 10.50% 16.50%A homemaker 5.00% 0.80% 3.44% 6.57%A student 3.58% 0.99% 1.65% 5.52%Retired 19.30% 0.97% 17.41% 21.19%Unable to work 4.18% 0.76% 2.68% 5.68%
Education Never attended school 0.13% 0.13% ‐0.12% 0.38%Grade 1‐8 1.09% 0.38% 0.35% 1.83%Grades 9‐11 (some high school) 6.83% 1.12% 4.65% 9.02%Grade 12 or GED (high school graduate) 45.83% 2.08% 41.75% 49.90%College 1‐3 years (some college) 25.71% 1.83% 22.12% 29.30%College 4 or more (college graduate) 20.41% 1.54% 17.39% 23.42%
Ethnicity White 96.27% 0.97% 94.36% 98.18%Black or African American 1.64% 0.53% 0.60% 2.67%Asian 0.15% 0.15% ‐0.14% 0.44%Native Hawaiian or Pacific Islander * * * *American Indian or Alaskan Native 0.14% 0.14% ‐0.14% 0.43%Other 1.80% 0.80% 0.24% 3.36%
* Denotes cells without observations. When a standard error is a true zero, the confidence intervals are equal to the percentage.
APPALACHIAN RURAL HEALTH INSTITUTE (ARHI) Health Needs Assessment Survey III ∙ Research Report 111

Appendix B. Weighted Demographics Appendix B9. Weighted Demographics: Noble County
Demographics: Percent SE LCL
@ .95 UCL
@ .95 Noble County Age 18 to 24 15.06% 0.00% * *25 to 34 19.31% 0.00% * *35 to 44 21.84% 0.00% * *45 to 54 15.81% 0.00% * *55 to 64 11.10% 0.00% * *65 and over 16.88% 0.00% * *
Income Less than $15,000 15.57% 4.84% 6.08% 25.07%$15,000 to $24,999 21.06% 5.32% 10.64% 31.49%$25,000 to $34,999 6.28% 2.37% 1.63% 10.92%$35,000 to $49,999 17.71% 3.77% 10.32% 25.09%$50,000 to $74,999 21.29% 3.63% 14.18% 28.40%$75,000 or more 18.09% 3.93% 10.39% 25.80%
Gender Male 58.42% 0.00% * *Female 41.58% 0.00% * *
Employment Employed 63.50% 3.81% 56.03% 70.96%Unemployed 4.85% 1.85% 1.22% 8.49%A homemaker 10.12% 2.10% 5.99% 14.24%A student 7.13% 2.93% 1.37% 12.88%Retired 11.97% 1.86% 8.32% 15.62%Unable to work 2.44% 1.31% ‐0.13% 5.00%
Education Never attended school * * * *Grade 1‐8 4.34% 2.56% ‐0.68% 9.37%Grades 9‐11 (some high school) 6.63% 2.86% 1.04% 12.23%Grade 12 or GED (high school graduate) 53.94% 5.41% 43.34% 64.54%College 1‐3 years (some college) 15.10% 3.46% 8.32% 21.89%College 4 or more (college graduate) 19.98% 4.02% 12.10% 27.87%
Ethnicity White 96.72% 1.90% 93.00% 100.44%Black or African American 0.80% 0.76% ‐0.70% 2.29%Asian * * * *Native Hawaiian or Pacific Islander * * * *American Indian or Alaskan Native 1.67% 1.56% ‐1.39% 4.72%Other 0.81% 0.77% ‐0.69% 2.31%
*Denotes cells without observations. When a standard error rounds to zero, accurate confidence intervals cannot be calculated.
APPALACHIAN RURAL HEALTH INSTITUTE (ARHI) Health Needs Assessment Survey III ∙ Research Report 112

Appendix C. Weighted and Unweighted Sample Demographics
APPALACHIAN RURAL HEALTH INSTITUTE (ARHI) Health Needs Assessment Survey III ∙ Research Report 113
Demographics: Weighted Unweighted Percent N Percent N
County Belmont 15.03% 54,942 15.13% 581 Columbiana 23.20% 84,807 21.24% 816 Gallia 6.37% 23,298 7.39% 284 Harrison 3.34% 12,209 3.18% 122 Jefferson 15.89% 58,073 15.49% 595 Lawrence 12.87% 47,049 15.05% 578 Monroe 3.17% 11,599 2.97% 114 Muskingum 17.14% 62,655 16.95% 651 Noble 2.98% 10,878 2.60% 100
Gender Male 48.09% 175,792 43.24% 1,661 Female 51.91% 189,718 56.76% 2,180
Ethnicity White 96.19% 351,596 96.56% 3,676 Black or African American 1.80% 6,563 1.60% 61 Asian 0.11% 405 0.13% 5 Native Hawaiian or Pacific Islander 0.03% 91 0.03% 1 American Indian or Alaskan Native 0.74% 2,718 0.74% 28 Other 1.13% 4,136 0.95% 36
Age 18 to 24 11.12% 40,649 5.81% 223 25 to 34 16.04% 58,612 14.14% 543 35 to 44 20.15% 73,661 19.50% 749 45 to 54 18.75% 68,546 20.98% 806 55 to 64 13.22% 48,313 15.70% 603 65 and over 20.72% 75,729 23.87% 917
Education Never attended school 0.05% 171 0.05% 2 Grade 1‐8 1.56% 5,719 1.62% 62 Grades 9‐11 (some high school) 6.91% 25,257 6.61% 253 Grade 12 or GED (high school graduate) 43.00% 157,157 42.92% 1,644 College 1‐3 years (some college) 27.09% 99,014 27.21% 1,042 College 4 or more (college graduate) 21.39% 78,192 21.59% 827
Household income Less than $15,000 17.49% 63,926 16.07% 471 $15,000 to $24,999 15.79% 57,717 15.05% 441 $25,000 to $34,999 13.65% 49,895 13.72% 402 $35,000 to $49,999 14.25% 52,093 14.67% 430 $50,000 to $74,999 20.08% 73,377 20.74% 608 $75,000 or more 18.74% 68,502 19.75% 579
Employment Employed 54.21% 198,160 52.63% 2,009 Unemployed 11.35% 41,502 10.56% 403 A homemaker 5.80% 21,194 6.24% 238 A student 3.68% 13,458 2.31% 88 Retired 20.60% 75,292 23.68% 904 Unable to work 4.35% 15,903 4.58% 175

Appendix D. Statistical Limitations: A Tutorial Appendix D1. Cross‐Tabulated Variables at the County Level
The examples below provide a step‐by‐step explanation of why cross‐tabulated variables cannot be analyzed at the county level. Below are the simple, unweighted, frequencies for each variable:
Diabetes Status Frequency Percent
Yes 529 13.78 No 3,310 86.22 Total 3,839 100.00
Vigorous Exercise Frequency Percent
Less than 3 Days/Week 572 38.31 3 or More Days/Week 921 61.69
Total 1,493 100.00 Once the two variables are cross‐tabulated, the frequencies in some of the cells become quite small in comparison to the other cells.
Diabetes Status by Vigorous Exercise Yes No Total
Less than 3 Days/Week 44 527 571 3 or More Days/Week 56 864 920
Total 100 1,391 1,491 Examining the cross‐tabulated variables at the county‐level creates further statistical problems because the low frequencies of some cells can lead to very wide confidence intervals, which have limited usefulness. Further, confidence intervals extending beyond plausible values (0 and 100%) are not interpretable. The estimates for Monroe County (below) illustrate such problems.
Diabetes Status by Vigorous Exercise by County Percent SE
LCL @ .95
UCL @ .95
Monroe (N = 114) Diabetes Status= Yes Less than 3 Days of Vigorous Exercise ‐5.03% 7.76% 6.52% 20.44%
3 or More Days of Vigorous Exercise 14.89% 7.14% 0.89% 28.89%
Diabetes Status = No Less than 3 Days of Vigorous Exercise 92.24% 6.52% 79.45% 105.03%
3 or More Days of Vigorous Exercise 85.11% 7.14% 71.11% 99.11%
APPALACHIAN RURAL HEALTH INSTITUTE (ARHI) Health Needs Assessment Survey III ∙ Research Report 114
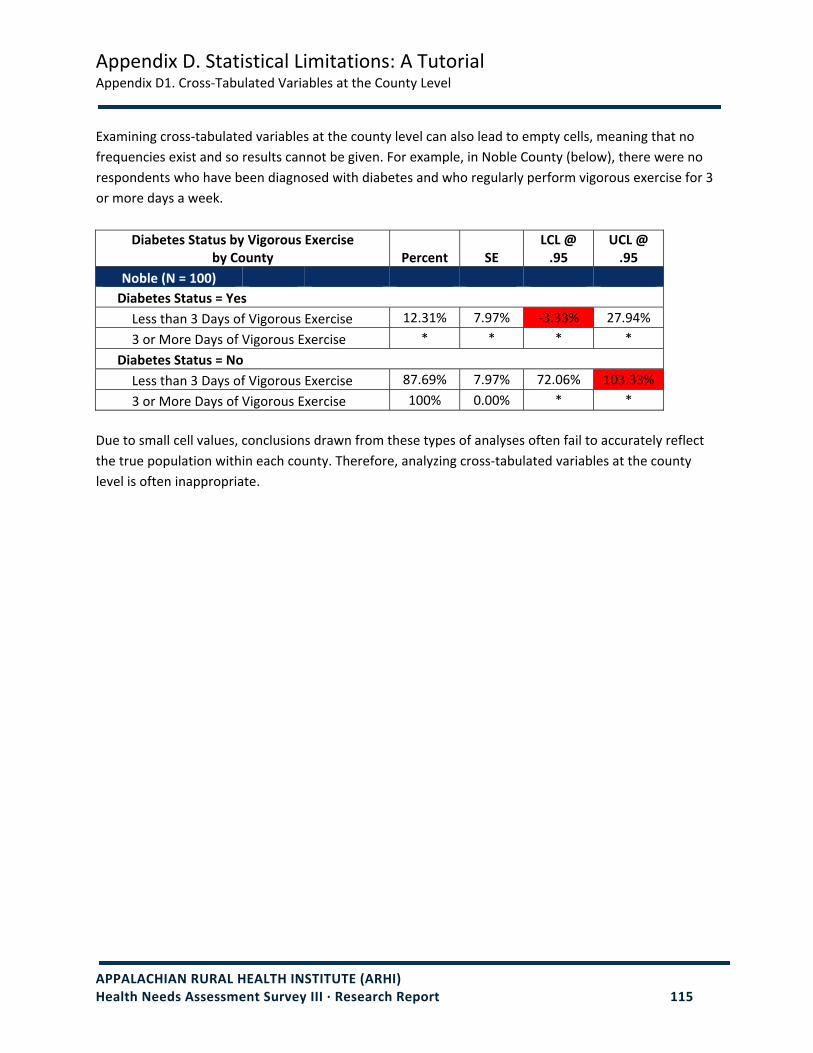
Appendix D. Statistical Limitations: A Tutorial Appendix D1. Cross‐Tabulated Variables at the County Level
APPALACHIAN RURAL HEALTH INSTITUTE (ARHI) Health Needs Assessment Survey III ∙ Research Report 115
Examining cross‐tabulated variables at the county level can also lead to empty cells, meaning that no frequencies exist and so results cannot be given. For example, in Noble County (below), there were no respondents who have been diagnosed with diabetes and who regularly perform vigorous exercise for 3 or more days a week.
Diabetes Status by Vigorous Exercise by County Percent SE
LCL @ .95
UCL @ .95
Noble (N = 100) Diabetes Status = Yes Less than 3 Days of Vigorous Exercise 12.31% 7.97% ‐3.33% 27.94%
3 or More Days of Vigorous Exercise * * * *
Diabetes Status = No Less than 3 Days of Vigorous Exercise 87.69% 7.97% 72.06% 103.33%
3 or More Days of Vigorous Exercise 100% 0.00% * * Due to small cell values, conclusions drawn from these types of analyses often fail to accurately reflect the true population within each county. Therefore, analyzing cross‐tabulated variables at the county level is often inappropriate.

Appendix D. Statistical Limitations: A Tutorial Appendix D2. Standard Errors Reported as Zero
The example below explains why standard errors with a value of 0.00% can provide different confidence interval values.
The first confidence interval calculated with a standard error of 0.00% has the same upper and lower limits as the relevant percentage. This is because the standard error is a true zero and so the confidence interval is capturing that percentage exactly.
Respondents living with diabetes: Percent SE LCL @ .95 UCL @ .95 Gallia County Age of diabetes diagnosis.
Under 18 years 18.75% 0.00% 18.75% 18.75%19 to 40 years 20.67% 1.67% 17.39% 23.95%41 to 49 years 16.45% 2.99% 10.58% 22.33%50 to 59 years 30.56% 3.90% 22.89% 38.22%Over 60 years 13.57% 2.85% 7.97% 19.17%
Diabetes related health care visits in the last 12 months.
None 3.30% 1.91% ‐0.45% 7.05%1 time 10.04% 3.52% 3.13% 16.95%
23.70% 4.22% 15.41% 31.98%2 or 3 times 35.97% 5.59% 24.98% 46.96%4-5 times 23.82% 0.00% * *6-10 times 3.17% 2.08% ‐0.92% 7.26%More than 10 times
For the second confidence interval calculated with a standard error of 0.00%, no interval estimates are provided. This is because this standard error is not a true zero, but is actually very small. When using conventional rounding rules, the standard error will round to zero; therefore, it is reported as zero. For such a small standard error, confidence interval values cannot be properly calculated.
APPALACHIAN RURAL HEALTH INSTITUTE (ARHI) Health Needs Assessment Survey III ∙ Research Report 116

Appendix E. Comprehensive Description of the Survey
APPALACHIAN RURAL HEALTH INSTITUTE (ARHI) Health Needs Assessment Survey III ∙ Research Report 117
Survey Design
As there was no single existing national health survey adequate in its assessment of the areas under consideration in this project, the research team determined that it would be optimal to develop a new survey. A telephone survey was chosen over other methodological approaches because it allows for the collection of data from a larger percentage of the population of interest at a faction of the cost of mail surveys or personal interviews. Additionally, mail surveys are notorious for having poor response rates, while personal interviews are time‐consuming and do not provide the level of statistical confidence that can be achieved with a telephone survey.
The telephone survey used in 2003 for the first ARHI Needs Assessment survey was developed by GVS in collaboration with Frank Schwartz, M.D., Director of the ARHI Diabetes Center and with ARHI Co‐Directors Christopher Simpson, D.O. and Brooke Hallowell, Ph.D. Revisions were made to this instrument by the GVS in collaboration with the remainder of the survey project team for the second ARHI. This second survey incorporated questions from the 2004 BRFSS and the 2004 National Health Information Survey for comparability with state and national data. When an equivalent question was unable to be located, all members of the research team provided input on the development of the question. The current ARHI survey (ARHI III) was altered to include all the questions in the diabetes module of the 2007 BRFSS, and to expand the number of questions related to exercise and health access. Finally, to keep the survey brief, questions related to emphysema, cancer, and age of smoking onset were omitted.
In an attempt to encourage participation and prevent respondents from discontinuing midway through the interview, the survey was developed to last no more than eight minutes, taking into consideration all possible skip patterns. Additionally, the survey was ordered such that all health‐related questions were posed at the beginning of the interview to ensure that the most important data would be acquired even in cases of discontinuation.
Data Collection and Sampling Plan
A telephone survey was conducted to maximize generalizability, increase response rates, and restrict possible errors in the data.1 Sample size was determined based on the population of each individual county, proportional to gender and age group. Random digit, as well as age and gender‐targeted, samples of household phone numbers were purchased from ASDE Survey Sampler Inc. for each of the nine counties. Post survey stratification was planned to address gaps in meeting the sampling plan.
The complete survey was administered by Ohio University’s Scripps Survey Research Center using a Computer‐Assisted Telephone Interviewing (CATI) software program. Telephone calls were placed by trained students at the center across 34 days, Monday through Thursday between the hours
1 Only households with landlines were included in this survey, and no adjustments were made post‐sampling to correct for respondents in wireless‐only homes.

Appendix E. Comprehensive Description of the Survey
APPALACHIAN RURAL HEALTH INSTITUTE (ARHI) Health Needs Assessment Survey III ∙ Research Report 118
of 5:00 and 9:00 p.m. and Sundays between 1:00 and 9:00 p.m., during November 2008 through the beginning of February 2009.
At the time of the placed call, respondents were asked to participate in a survey that ARHI was conducting to assess the presence of health‐related problems in the area. Individuals were told that all of the information that they provided would be confidential, and that the survey would only take about eight minutes to complete. Participants were also informed that they needed to be 18 years or older to take part in the survey. If there was no answer at the time of a call, numbers were re‐dialed up to six times in order to increase the likelihood of reaching every available participant.
Prior to the start of the survey, it was decided that the youngest person over the age of 18 would be asked to respond to the survey. This “youngest eligible person” approach was used as opposed to the “first birthday” approach sometimes implemented in survey research because lower response rates were anticipated within the younger age brackets. The “first birthday” method requires the person with the most recent birthday, over the age of 18, to respond to the survey. Historically, it has been argued that applying this latter method will help reduce sampling biases. However, the need to include younger respondents necessitated the “youngest eligible person” method.
Post‐Sampling Procedures
Weighting the Data
Survey sampling attempts to draw respondents from every social stratum so that, within the sample, all existing respondent profiles are represented. Achieving this goal is difficult in practice; even the best survey samples end up either oversampling or undersampling (by accident or by design) some respondent profiles. Non‐response may also generate a discrepancy between population proportions for certain types of respondents and the proportions actually sampled. Potential disparities between what is sampled and what exists in the population are a direct reflection of four underlying factors associated with telephone‐interview surveys.
The first factor relates to household non‐response, which includes households that could not be contacted – due to the answering machine picking up, no answer, or a busy signal – and those that opted not to participate. Although non‐response is a typical problem associated with all telephone surveys, it can potentially lead to a misrepresentation of the population. For instance, research has indicated that younger adults and those who work evening shifts or hold multiple jobs are less likely to be sampled due to the time of day that the calls were made. Overall, within this study, there was a 10% response rate,2 a 20% cooperation rate, and a 37% refusal rate.3
2 The use of stratified sampling methods suppressed response rates by limiting the number of eligible survey participants. 3 Cooperation and refusal rates were calculated using the methods outlined by AAPOR. The American Association for Public Opinion Research. 2008. Standard Definitions: Final Dispositions of Case Codes and Outcome Rates for Surveys. 5th edition. Lenexa, Kansas: AAPOR.

Appendix E. Comprehensive Description of the Survey
APPALACHIAN RURAL HEALTH INSTITUTE (ARHI) Health Needs Assessment Survey III ∙ Research Report 119
A second factor that can influence the representativeness of the sample is the selection probability of individuals within a household. Aspects that can affect selection probability include a participant’s gender, age, and size of the household. Women are more likely to answer the phone, assuming that both a man and woman are home to take the call. Age also has an effect – younger adults tend to have busier schedules and are, therefore, less likely to answer the phone. Finally, the relative number of eligible respondents within a household can impact selection probability. For example, individuals who live alone have a higher likelihood of being sampled than those that live with multiple people over the age of 18.
The final two factors capable of influencing the accuracy of a sample relate to the presence or absence of a landline telephone in the home. The first factor is the inability to contact households without landline telephones. The number of wireless telephones has been rapidly expanding, and with this expansion comes a decrease in landline telephones within the home.4 As of 2008, 1 out of every 6 American homes had only wireless telephones, making these households ineligible to participate in a landline telephone survey. Further influencing the representativeness of telephone surveys is the geographic and ethnic differences in homes with landline telephones. Finally, the number of landlines in a home influences the likelihood of a home being sampled; homes with multiple landlines have a higher probability of being sampled in comparison with homes that have a single landline.
In sum, various uncontrollable factors invariably force survey analysts to adjust the weights as needed to deliver sample respondent profiles that mimic those known to exist in the true population. For the ARHI III, post‐stratified weights were computed on the basis of the within‐stratum population counts drawn from the 2000 U.S. Census of Population and Housing. Post‐stratification weighting is commonly used with telephone survey data to bring the sampled data in agreement with population figures. For the ARHI III survey, this adjustment was specifically useful because health conditions vary as a function of demographic characteristics such as age and gender.
When reviewing findings contained in this report, it is critical to note that despite over‐sampling in each of the nine counties, there were still relatively large standard errors for some items. In particular, this occurred with questions that were asked of a subset of the entire survey sample, such as persons who have diabetes. In these cases, the percentages may not accurately capture the population overall, especially when only considering data for a given county.
Computing the Weights
A stratified sample was attempted. This sampling methodology requires that the population of interest first be divided into meaningful categories (e.g., county, gender and age) from which a random sample is obtained. The number of respondents needed from each category is a percentage of the whole sample (the target ARHI III sample was 4,000) that reflects the proportion that same category makes up out of the true population. If, for example, 10% of the true population in a county is
4 http://www.cdc.gov/nchs/data/nhsr/nhsr014.pdf

Appendix E. Comprehensive Description of the Survey
APPALACHIAN RURAL HEALTH INSTITUTE (ARHI) Health Needs Assessment Survey III ∙ Research Report 120
comprised of females between 25 and 34 years of age, then 10% of the county level sample should match these characteristics.
However, target quotas from certain categories were not obtained; therefore, the current ARHI data were post‐stratified to more accurately reflect the population of interest. Post‐stratification compares the number of respondents obtained from each category to the population demographic breakdown, obtained from the U.S. Census in this instance, to ascertain how accurately the sample reflects the true population. Thus, if a given subgroup of the population is underrepresented within the sample (i.e., males between 18 and 24), then a greater weight is given to those responses. Whereas, if a subgroup is well represented in the survey data, such as Caucasians over 65, a lower weight is applied to these responses.
The computed weights were based on aggregated composites of gender and age, as reported for each of the nine counties (Belmont, Columbiana, Gallia, Harrison, Jefferson, Lawrence, Monroe, Muskingum, and Noble) in the 2000 U.S. Census. Ethnicity was not included as a category given that the ARHI III counties are predominantly Caucasian (over 95%). For the purposes of weighting, age was broken down into the six categories used in the BRFSS (18‐24, 25‐34, 35‐44, 45‐54, 55‐64, and 65+) to increase the likelihood that each subgroup would be adequately represented within the sample. In total, weights were computed for 12 subgroups for each of the nine ARHI III counties. Weights were calculated for each demographic group by dividing the U.S. Census 2000 population for each group by the number of actual respondents in that category that were surveyed. A comparison of the weighted versus unweighted demographic data from the survey is provided in Appendix C.