are we overbuilding? - texas a&m university · 4 bangalore 243.8 5 guangzhou 241.0 6 delhi-ncr...
TRANSCRIPT
A Cushman & Wakefield Research Publication
ARE WE
OVERBUILDING?Office Forecasts for over 100 Global Cities2017 - 2019

AMERICAS EUROPE APACGLOBAL APPENDIX
Global
Occupier Conditions World Map
Economic Drivers
Employment Forecast
Supply and Demand
Rent Growth
Americas
Europe
APAC / Greater China
City Rankings (Appendix)
Contributors
4 - 5
6 - 7
8 - 9
10 - 11
12 - 13
14 - 23
24 -33
34 - 47
48 - 59
60 - 61
Table Contents
of

IntroductionThe economic outlook is brightening in the major regions of the world. Whether due to low interest rate policies finally having their intended effect, stabilized commodity prices in some countries (Argentina, Brazil, Canada and Russia), state-led efforts (China), or soaring equity markets and rising confidence (the U.S. and Europe), the uptick in near-term growth points to healthy demand for office space in most markets around the world. Still, in most countries, labor markets in major cities are tight, putting pressure on job creation. In others, a new economic cycle is just beginning, with demand for office space lagging behind. As overall global construction of office space has gained significant traction in recent years, the risk of overbuilding in some markets is real. In this report, we investigate how office market conditions will evolve over the rest of the decade and highlight some of the nuances underlying it all.

4 / Cushman & Wakefield
AMERICAS EUROPE APACGLOBAL APPENDIXGLOBAL
Tenant Favorable
Neutral
Landlord Favorable
GlobalOccupier ConditionsMarket Outlook 2017 - 2019
BERLIN DUBLIN
ROME
MILAN
MOSCOW
MADRID
LONDON
Tenant/Neutral/Landlord methodology is a combination of forecasts for rent growth, demand momentum and supply momentum.
ATLANTADALLAS
DENVER, CO
LOS ANGELES
MIAMI
NEW JERSEYPHILADELPHIA
PHOENIX
PORTLAND
SAN DIEGO
SAN FRANCISCO SILICON VALLEY
SEATTLE
TAMPA
TORONTO
MEXICO CITY
MONTREAL
VANCOUVER
EDMONTON
CALGARY
SÃO PAULORIO DE JANEIRO
BUENOS AIRES
OSLO STOCKHOLM
WARSAW
LISBON
ISTANBUL
FRANKFURT
BUDAPESTVIENNAMUNICH
WASHINGTON, DC METRO
PRAGUE
AHMEDABAD
BOSTON
OAKLAND
AMSTERDAM
NEW YORKCHICAGO
BALTIMORE
COPENHAGEN
BRUSSELSLUXEMBOURG
PARIS
BUCHAREST
ZURICH

cushmanwakefield.com / 5
“The world will build over 700 msf of office space over the next 3 years ... is it needed?”
SYDNEY
MELBORNE
BEIJING
SHANGHAI
GUANGZHOU SHENZHEN
JAKARTA
TOKYO
SINGAPORE
BANGKOK
DELHI-NCR
MUMBAI
SEOUL
CHENGDU
HANOI HONG KONG
MANILA
HO CHI MINH CITY
KUALA LUMPUR
HYDERABAD
CHENNAIBENGALURU
PUNE
TAIPEI
BRISBANE
KOLKATA
cushmanwakefield.com / 5

6 / Cushman & Wakefield
AMERICAS EUROPE APACGLOBAL APPENDIXGLOBAL
ECONOMIC DRIVERSAfter several years of mostly disappointing growth, the global economy is finally showing clear signs of momentum. Although the growth spurts vary greatly from one country/city to the next, the economic upswing in mid-2017 is more ubiquitous than at any other point in the current cycle. From the U.S. to Continental Europe to Asia Pacific, in mature markets as well as emerging ones, from Tier-1 to Tier-2 cities, from commodity-producing to commodity-consuming nations—a multitude of signs indicate that the world economy is set to grow faster. World GDP growth is projected to rise from 3.1% in 2016—the nadir of the current cycle—to 3.5% in 2017 and 3.6% in 2018. If these developments come to fruition, those would be the strongest back-to-back years for global growth since the initial rebound years of 2010 and 2011. Moreover, there are still significant tailwinds and scenarios that may push growth rates even higher in the near term; fiscal policy-easing in the U.S.,
The economic momentum is more ubiquitous now, in mid-2017, than it has been at any other point in the current cycle.
Global
soaring equity prices and rebounds in confidence may translate into higher consumption and business investment than is currently assumed.
A number of developments could still derail the momentum. Global equity markets have been riding the euphoria wave of a still very hypothetical fiscal stimulus scenario in the U.S. If policymakers don’t deliver, a negative wealth effect could very well ensue, ultimately dragging economic and real estate conditions down. Another downside risk to the expansion comes from protectionist movements. A policy shift towards more isolationism and greater trade warfare would certainly impact capital and trade flows, and thus harm economic growth. Another threat comes from diverging global monetary policy conditions at a time when many central banks are in uncharted territory: e.g., negative interest rates, asset purchase
SYNCHRONIZED GROWTHREAL GDP, Yr/Yr%
Source: U.S. BEA, Oxford Economics, Cushman & Wakefield Research
0
2
4
6
8
China World Eurozone UnitedKingdom
UnitedStates
Canada Japan
2016Q1 2017Q1

cushmanwakefield.com / 7
programs, etc. In the U.S. the Federal Reserve (the Fed) does have a history of raising rates too quickly and a number of times in the past that has resulted in derailing growth.
Yes, the list of downside risks remains long, but not uncomfortably so. Most of these threats are slow moving, sitting on the tails of normal probability curves. The consensus of most economists is that the probability that the economic expansion will continue at least for the next 6-12 months hovers in the 80% range. Moreover, most central banks around the globe are maintaining an aggressive stance with respect to monetary policy. In the U.S., the Fed has slowly begun to raise rates, and it is now hinting at unwinding its balance sheet. Still, the fed funds target rate is in the 1% to 1.25% range—well below the normalized rate and, therefore, highly supportive of near-term growth. In many other countries—including Switzerland, Japan and Germany—short- and long-term rates are closer to 0% than to 1%. From a real estate perspective, the combination of an accelerating global economy and low interest rates is a recipe for healthy office market conditions.
cushmanwakefield.com / 7
-100
-50
0
50
100
150
200
250
-1%
0%
1%
2%
3%
4%
5%
6%
200
6
200
8
2010
2012
2014
2016
2018
2020
GDP (% Yr/Yr, LHS) Global Net Absorption (MSF, RHS)
GLOBAL GDP GROWTH VS. NET ABSORPTION
Source: IMF, Cushman & Wakefield Research
2020

8 / Cushman & Wakefield
AMERICAS EUROPE APACGLOBAL APPENDIXGLOBAL
IT’S ALL ABOUT JOBSIronically, in some areas, the prolonged consistency in the labor markets might ultimately be what slows demand for office space. After eight years of continued expansion, albeit a slow one, some of the world’s labor markets have tightened substantially, making it difficult for businesses to fill open positions. In the U.S., the unemployment rate fell to 4.4% in June of 2017, fully back to pre-recession levels. At the same time, wage pressures are rising. The unemployment rate in Canada is expected to decline from 7.0% in 2016 to 6.6% in 2017—the best year of the cycle by far. Mexico’s unemployment rate is expected to register 3.5% (nationally) in 2017 and remain below 4% through 2018. In the Asia Pacific
OFFICE-USING JOB GROWTH
Source: Oxford Economics, Moody’s Analytics, Cushman & Wakefield Research
*Greater China cities include new full-time employees in the services sector.
region, unemployment is now 20 BP lower than at the peak of the last cycle. Europe’s recovery, which has generally lagged that of the other regions, has a bit more labor slack. But even so, certain cities such as London and Berlin have unemployment rates that are at near record lows. Thus, many parts of the world are nearing fuller employment.
This does not mean that job creation will end. Many cities still have room to run until full employment is achieved. Even at that point, population growth and migration will continue to support employment growth in most places. But tighter labor markets does mean that job growth will generally be on a decelerating path from this point forward, particularly in tech and Tier-1 cities, where labor shortages are the most acute.
With this in mind, a changing of the guard should be expected: Tier-2 cities will emerge as the new growth leaders in the cycle as businesses expand into markets where workers are easier to find and less expensive to hire. To be clear, Tier-1 cities will still continue to contribute the lion’s share of all jobs created worldwide due to their sheer size. But it is the Tier-2 cities that are still generally accelerating. When we add it all up, the world economy will create 9.9 million net new office-using jobs over the next three years, down from the 10.7 million created in the prior three years, but still solid.
0
2
4
6
8
10
12
Europe Americas *APAC Global
Mill
ions
Last 3 Years (2014-2016) Next 3 Years (2017-2019)

cushmanwakefield.com / 9Climbing in the rankings
RANK CITY JOB GROWTH (000’s)2014 - 2016
1 Shanghai 818.6
2 Beijing 549.2
3 Istanbul 259.6
4 Shenzhen 248.8
5 Guangzhou 247.9
6 London 236.1
7 Bangalore 191.7
8 Manila 156.8
9 New York City 149.5
10 Tokyo 133.5
11 Delhi-NCR 121.7
12 Jakarta 99.8
13 Dallas 98.0
14 Budapest 97.8
15 Madrid 94.6
16 Los Angeles 93.9
17 Moscow 92.5
18 San Francisco 90.2
19 Toronto 89.7
20 Hong Kong 88.5
21 Paris 84.6
22 Sydney 82.8
23 Singapore 80.1
24 Atlanta 78.8
25 Mexico City 78.4
RANK CITY JOB GROWTH (000’s)2017 - 2019
1 Beijing 531.8
2 Shanghai 454.5
3 Shenzhen 305.9
4 Bangalore 243.8
5 Guangzhou 241.0
6 Delhi-NCR 220.6
7 Istanbul 157.5
8 São Paulo 142.3
9 Manila 139.4
10 Paris 119.4
11 Mexico City 109.3
12 New York City 99.4
13 Jakarta 96.3
14 Dallas 92.7
15 Rio de Janeiro 86.8
16 London 78.3
17 Tokyo 71.3
18 Madrid 70.0
19 Hong Kong 69.1
20 Los Angeles 68.8
21 Ho Chi Minh City 63.3
22 Atlanta 61.0
23 Chicago 58.2
24 Phoenix 47.6
25 Washington, DC Metro 46.7
GLOBAL TOP 25: OFFICE-USING JOB GROWTH
Previously Not in Top 25
Source: Oxford Economics, Moody’s Analytics
City definitions vary by region but generally represent the metro area.
For full list of global rankings, see appendix.

10 / Cushman & Wakefield
AMERICAS EUROPE APACGLOBAL APPENDIXGLOBAL
SUPPLY AND DEMANDThe world economy will need to create every single one of those new jobs, and then some, because a building boom is upon us. Around the globe, over 700 million square feet (msf) of office space is under construction which will deliver between mid-July 2017 and the end of 2019. That’s the equivalent of five good-sized cities worth of office inventory (e.g., Washington, DC, Dallas, London, Singapore and Shanghai). That new construction will come online in the span of just three years. Although demand will remain robust over that same time period—totaling approximately 520 msf—it will fall far short of supply. That will cause vacancy to rise in most cities around the world. From that perspective, the world is overbuilding.
Or maybe it isn’t. Throughout this global expansion it is clear that occupiers have generally favored newly-built-high-quality space over older, Grade B & C product. In the U.S., for example,
newly built space has accounted for 65% of all of the office space absorption since 2012. More often than not, developers have been rewarded throughout this cycle for delivering prime product, even in markets where vacancy is elevated.
Nevertheless, vacancy will generally be on the rise in most cities around world. The development boom will be led by Asia Pacific, particularly Greater China. In fact, nearly 60% of the world’s new construction will be concentrated in the Asia Pacific region. Within the region, new supply is concentrated in a handful of markets: Beijing, Shenzen, Shanghai, Manila and Bangalore. Indeed, those five markets account for 55% of construction taking place in Asia Pacific and over one-third of construction worldwide.
Much like the supply side, the demand side of the equation is strongest in Asia Pacific. Beijing will have the distinction of leading the world in both supply and demand growth. The Americas region is also in midst of a robust construction cycle, although construction will likely taper off somewhat after 2017. Still, the U.S., Canada, and Latin America will all build more space than they will absorb over the next few years. Again, it varies greatly from one city to the next (see the Americas section for detailed rankings).
The development pipeline is also ramping up throughout Europe, but not nearly to the same degree. Some European cities—Paris, Vienna, London and Brussels—will hit a cyclical high in new construction over the next two years. Again, those cities report vacancy rates lower than pre-recession levels. It could be argued that they are the most in need of new space. Broadly speaking, supply and demand seem to be the most balanced in Europe relative to the other global regions.
GLOBAL SUPPLY VS. DEMAND2017 - 2019
Source: Cushman & Wakefield Research
0
100
200
300
400
500
600
700
800
Americas Europe APAC Global
MS
F
Supply Demand

cushmanwakefield.com / 11
GLOBAL TOP 25: OFFICE VACANCY
MARKET RANK 2016
AVERAGEVACANCY
2016
RANK 2019
AVERAGE VACANCY
2019Manila 1 2.3% 12 6.9%
Vienna 2 3.0% 10 6.7%
Berlin 3 3.3% 2 3.1%
Tokyo 4 3.9% 11 6.7%
Munich 5 4.3% 3 3.3%
Toronto 6 4.3% 4 3.9%
Winnipeg 7 4.3% 15 7.4%
London 8 4.4% 7 4.8%
Luxembourg 9 4.9% 8 5.9%
Vancouver 10 5.2% 9 6.3%
Nashville 11 5.4% 32 10.3%
Ho Chi Minh City 12 5.7% 75 17.6%
Bangkok 13 6.0% 6 4.5%
Singapore 14 6.1% 21 8.5%
Sydney 15 6.2% 1 2.4%
Bengaluru 16 6.3% 5 4.3%
Melbourne 17 6.4% 17 7.8%
Ottawa 18 6.5% 14 7.3%
Beijing 19 6.6% 74 16.8%
Hong Kong 20 7.0% 45 11.5%
Seattle 21 7.8% 50 12.4%
San Francisco 22 8.0% 31 10.2%
Raleigh/Durham 23 8.1% 16 7.7%
Hyderabad 24 8.1% 43 11.5%
Paris 25 8.6% 20 8.2%
For full list of global rankings, see appendix.
60% of world’s construction will take place in APAC
12 / Cushman & Wakefield
AMERICAS EUROPE APACGLOBAL APPENDIXGLOBAL
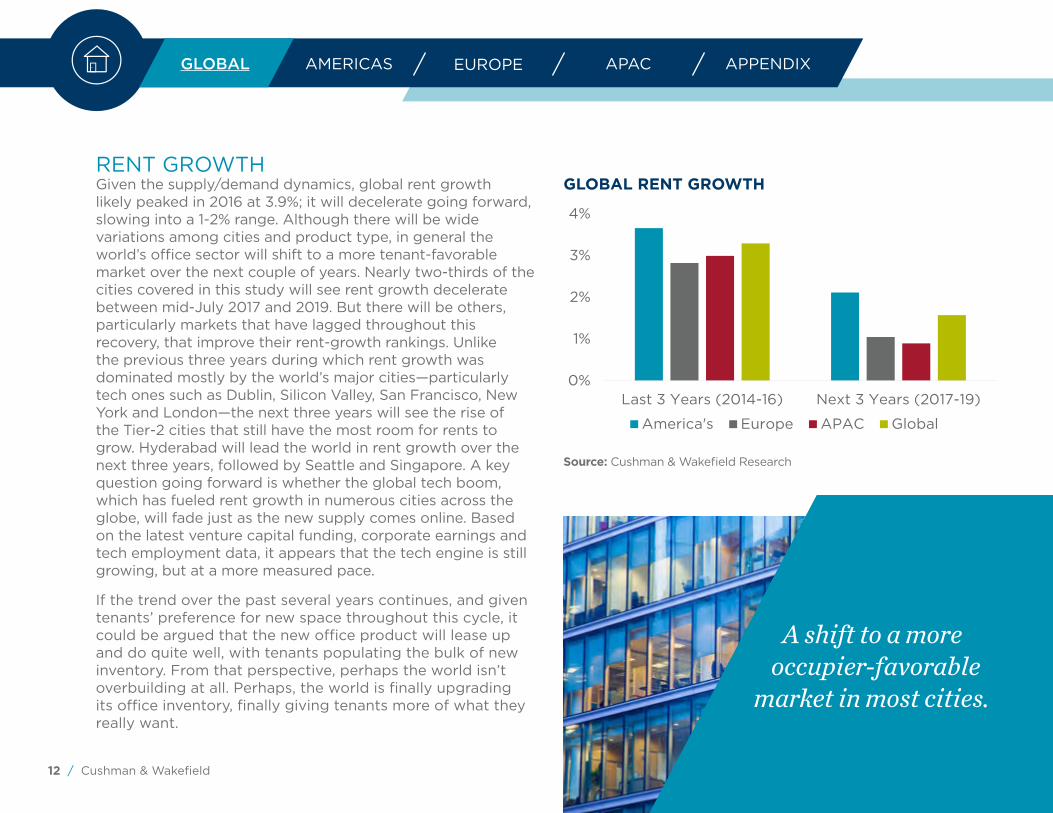
RENT GROWTHGiven the supply/demand dynamics, global rent growth likely peaked in 2016 at 3.9%; it will decelerate going forward, slowing into a 1-2% range. Although there will be wide variations among cities and product type, in general the world’s office sector will shift to a more tenant-favorable market over the next couple of years. Nearly two-thirds of the cities covered in this study will see rent growth decelerate between mid-July 2017 and 2019. But there will be others, particularly markets that have lagged throughout this recovery, that improve their rent-growth rankings. Unlike the previous three years during which rent growth was dominated mostly by the world’s major cities—particularly tech ones such as Dublin, Silicon Valley, San Francisco, New York and London—the next three years will see the rise of the Tier-2 cities that still have the most room for rents to grow. Hyderabad will lead the world in rent growth over the next three years, followed by Seattle and Singapore. A key question going forward is whether the global tech boom, which has fueled rent growth in numerous cities across the globe, will fade just as the new supply comes online. Based on the latest venture capital funding, corporate earnings and tech employment data, it appears that the tech engine is still growing, but at a more measured pace.
If the trend over the past several years continues, and given tenants’ preference for new space throughout this cycle, it could be argued that the new office product will lease up and do quite well, with tenants populating the bulk of new inventory. From that perspective, perhaps the world isn’t overbuilding at all. Perhaps, the world is finally upgrading its office inventory, finally giving tenants more of what they really want.
GLOBAL RENT GROWTH
Source: Cushman & Wakefield Research
A shift to a more occupier-favorable
market in most cities.
0%
1%
2%
3%
4%
Last 3 Years (2014-16) Next 3 Years (2017-19)
America's Europe APAC Global

cushmanwakefield.com / 13
GLOBAL TOP 25: OFFICE RENTAL RATE GROWTH
MARKET RANK PAST 3 YEARS
RENT GROWTH2014 - 2016
RANK NEXT 3 YEARS
RENT GROWTH 2017 - 2019
Dublin 1 22.3% 26 2.8%
Oakland 2 16.1% 8 4.3%
Orange County 3 10.7% 18 3.6%
Bengaluru 4 10.6% 57 0.8%
Stockholm 5 10.4% 11 4.2%
Dallas 6 9.9% 48 1.5%
Silicon Valley 7 9.7% 22 3.3%
Seattle 8 9.0% 3 6.8%
San Francisco 9 8.9% 27 2.8%
Shenzhen 10 8.7% 72 -0.4%
Portland 11 7.8% 10 4.2%
Madrid 12 7.0% 5 4.8%
Tampa 13 6.4% 25 2.9%
Sydney 14 6.3% 14 3.8%
London 15 6.0% 83 -1.7%
Charlotte 16 5.8% 68 -0.1%
Chennai 17 5.6% 39 2.0%
Bangkok 18 5.6% 13 3.9%
Berlin 19 5.4% 9 4.3%
Ahmedabad 20 5.4% 44 1.9%
Houston 21 5.2% 23 3.1%
Philadelphia 22 5.1% 19 3.6%
Manhattan 23 5.1% 41 2.0%
San Diego 24 5.0% 40 2.0%
Tokyo 25 4.8% 85 -3.4%
For full list of global rankings, see appendix.
cushmanwakefield.com / 13
*Average annual growth rate, Class A Rank out of 85 markets

14 / Cushman & Wakefield
AMERICAS EUROPE APACGLOBAL APPENDIXAMERICAS
ECONOMIC DRIVERSThe economic outlook is generally brightening in the Americas, but the trajectory does hide considerable variation from one country to the next. In the United States, soaring equity markets, rising consumer and business confidence and steady job growth have all contributed to a healthy economic backdrop that is expected to improve further over the next few years. A tight labor market is putting upward pressure on wage growth—and it appears a virtuous cycle is within reach. Although political risk remains elevated, some fiscal policy stimulus is likely to create additional short-term momentum, with real GDP accelerating from 1.6% in 2016 to 2.1% in 2017 and 2.3% in 2018.
Although modest, this stronger growth does come at a cost. On the heels of eight years of continued expansion and now the expectation of stronger growth, the U.S. 10-year treasury yield has pushed upwards some 50 basis points (BP) since Trump’s election, and labor markets have tightened substantially which is impacting job creation. The FOMC is anticipating a less gradual path towards normalizing interest rates, and it may start to unwind its balance sheet as early as this year. Nevertheless, even after the latest rate hike in June, monetary policy remains highly stimulative and supportive of an expansionary environment. All told, the U.S. economy remains solid and is pulsed to accelerate.
Commodity-exporting Canada is also expected to see its economic growth accelerate in 2017, fueled by the forces of accommodative policy, firming oil prices, and stronger
Americas
global demand. Downside risks remain, most notably elevated home prices (particularly in Toronto and Vancouver) and record household debt. The provincial governments of British Columbia and Ontario have taken measures to slow home price growth in these markets, including instituting a foreign buyers’ tax. Exports account for one-third of the Canadian economy and about three-quarters of Canadian exports are bound for the U.S. Assuming trade negotiations do not swing towards barriers and tariffs, a stronger U.S. outlook would also strengthen economic growth, supporting strong real estate fundamentals within Canada.
Prospects in Latin America look less promising recently, but improvement is anticipated as commodity prices remain steady and policy becomes more accommodative to growth. Mexico, the second largest economy in Latin America, is projected to grow in the neighborhood of 2% for the next few years. But again, the future trajectory hinges on U.S.-Mexico trade relations. After two consecutive years of contraction (-3.8% in 2015 and -3.6% in 2016), the region’s largest economy, Brazil, is showing signs of emerging from one of its deepest recessions. It’s a similar story for other parts of the region—Argentina, Peru, and Columbia—the worst appears to be over. In fact, many of the strongest job growth cities within the Americas over the next few years will come from markets in Latin America.

cushmanwakefield.com / 15
UNITED STATES SOME ASSUMED FISCAL POLICY STIMULUS WILL CREATE ADDITIONAL SHORT-TERM MOMENTUM, WITH REAL GDP ACCELERATING FROM 1.6% IN 2016 TO 2.1% IN 2017 AND 2.3% IN 2018
THE U.S. 10-YEAR TREASURY YIELD HELD STEADY AT 2.2% IN THE SECOND QUARTER
CANADA IS BEING FUELED BY THE FORCES OF ACCOMMODATIVE POLICY, FIRMING OIL PRICES, AND STRONGER GLOBAL DEMAND. DOWNSIDE RISKS REMAIN, MOST NOTABLY ELEVATED HOME PRICES
MEXICO, THE SECOND LARGEST ECONOMY IN LATIN AMERICA, IS PROJECTED TO GROW IN THE NEIGHBORHOOD OF 2% FOR THE NEXT FEW YEARS
BRAZIL IS SHOWING SIGNS OF EMERGING FROM ONE OF ITS DEEPEST RECESSIONS; REAL GDP SHOULD EXPAND MODESTLY THIS YEAR (0.2%) AND MORE SUBSTANTIALLY NEXT YEAR (2.8%)
cushmanwakefield.com / 15
CANADA DOWNSIDE RISKS REMAIN, MOST NOTABLY ELEVATEDHOME PRICES (PARTICULARLY IN TORONTO AND VANCOUVER) AND RECORD HOUSEHOLD DEBT.

16 / Cushman & Wakefield
AMERICAS EUROPE APACGLOBAL APPENDIXAMERICAS
OFFICE SECTORBased on historic norms, the United States is generally not overbuilding office space. For instance, there is currently more than 100 msf of new completions expected for 2017 and 2018—30% lower than the peak levels observed prior to the Great Financial Crisis (GFC) and 60% lower than the levels observed during the Dot-com Boom. But the bulk of what is under construction is highly concentrated in a handful of markets (e.g. Dallas, Washington, DC, Manhattan, and San Francisco). Arguably, these are also the cities that need new space the most, as they have been some of the strongest absorbers throughout this cycle. Nevertheless, this new wave of space will challenge the leasing fundamentals as it delivers at a time when broader job growth is decelerating, due in part to labor shortages. Certain pockets of Manhattan and Washington, DC, are already seeing concessions and TI’s push higher to help lease available space. But by and large, the Sunbelt markets and most other secondary/tertiary markets are seeing measured construction levels, and in many cases, are underbuilding relative to job creation. Overall, U.S. asking rents likely peaked in the first half of 2016; year-end asking rents grew 4.8%
AMERICAS KEY FACTS
Secondary market comeback
Secondary markets will see the clearest move up in office-using job growth rates and rankings.
Tech markets slowing
Tech hubs peaked earliest in the cycle and many are now bumping up against labor shortages and housing affordability challenges.
Rise in deliveries
In Canada, 34% of deliveries in markets with highest vacancy (Calgary and Edmonton).
Mexico, uptick in deliveries to outpace demand in 2018.
Rent growth
Notable increase 2017 - 2019: Seattle 6.8%Toronto 6.6%Winnipeg 6.4%Raleigh/Durham 4.8%Oakland 4.2%
What to watch
Headwinds and tailwinds vary greatly across North America and its Latin American neighbors, but the region is poised to expand over the coming years.
U.S. construction activity
50% of new office buildings delivering in 10 markets.
Secondary/tertiary markets: measured construction levels and underbuilding relative to job creation.
cushmanwakefield.com / 17
0200400600800
1,0001,2001,4001,600
2014 2015 2016 2017 2018 2019
00
0’s
in 2016. Over the next few years, asking rents will continue to grow but at a slower pace, decelerating into the 1-3% range most likely.
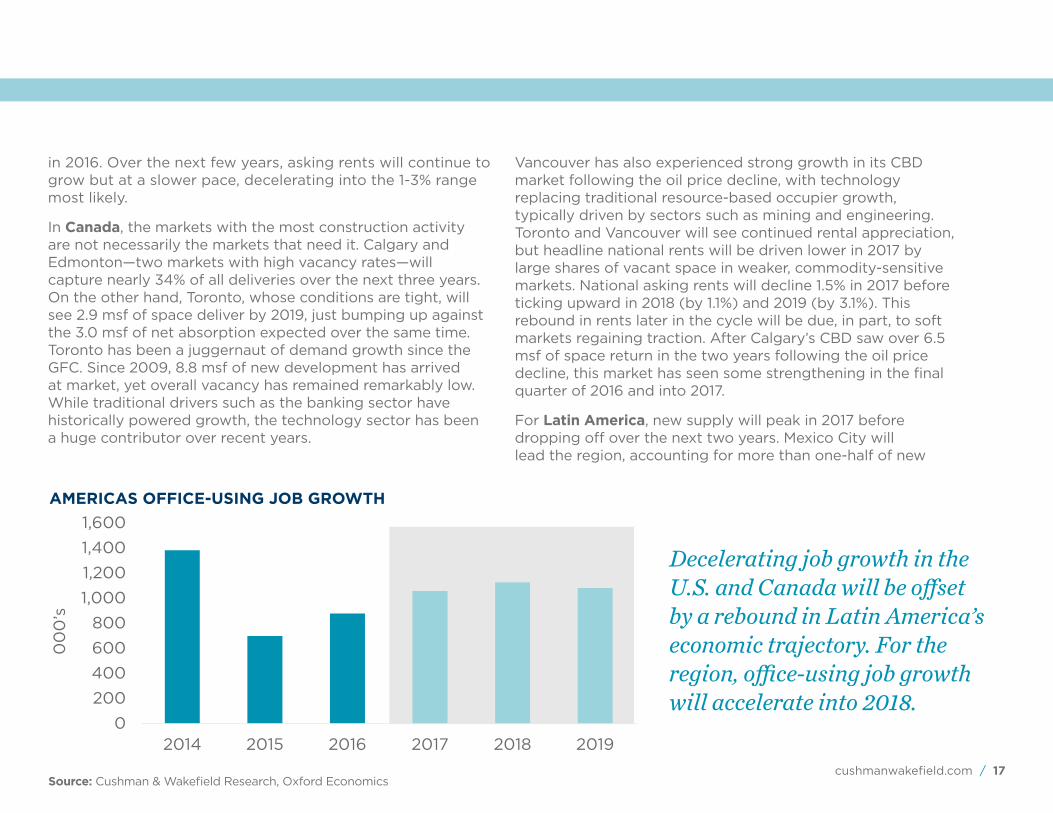
In Canada, the markets with the most construction activity are not necessarily the markets that need it. Calgary and Edmonton—two markets with high vacancy rates—will capture nearly 34% of all deliveries over the next three years. On the other hand, Toronto, whose conditions are tight, will see 2.9 msf of space deliver by 2019, just bumping up against the 3.0 msf of net absorption expected over the same time. Toronto has been a juggernaut of demand growth since the GFC. Since 2009, 8.8 msf of new development has arrived at market, yet overall vacancy has remained remarkably low. While traditional drivers such as the banking sector have historically powered growth, the technology sector has been a huge contributor over recent years.
Vancouver has also experienced strong growth in its CBD market following the oil price decline, with technology replacing traditional resource-based occupier growth, typically driven by sectors such as mining and engineering. Toronto and Vancouver will see continued rental appreciation, but headline national rents will be driven lower in 2017 by large shares of vacant space in weaker, commodity-sensitive markets. National asking rents will decline 1.5% in 2017 before ticking upward in 2018 (by 1.1%) and 2019 (by 3.1%). This rebound in rents later in the cycle will be due, in part, to soft markets regaining traction. After Calgary’s CBD saw over 6.5 msf of space return in the two years following the oil price decline, this market has seen some strengthening in the final quarter of 2016 and into 2017.
For Latin America, new supply will peak in 2017 before dropping off over the next two years. Mexico City will lead the region, accounting for more than one-half of new
Decelerating job growth in the U.S. and Canada will be offset by a rebound in Latin America’s economic trajectory. For the region, office-using job growth will accelerate into 2018.
AMERICAS OFFICE-USING JOB GROWTH
Source: Cushman & Wakefield Research, Oxford Economics

18 / Cushman & Wakefield
AMERICAS EUROPE APACGLOBAL APPENDIXAMERICAS
Top 5 U.S. Cities Ranked by Office-using Job Growth (000’s)
1 New York City2014-2016: 149.52017-2019: 99.4
2 Dallas2014-2016: 98.02017-2019: 92.7
3 Los Angeles2014-2016: 93.92017-2019: 68.8
4 Atlanta2014-2016: 78.82017-2019: 61.0
5 Chicago2014-2016: 56.52017-2019: 58.2
For full list of city rankings, see appendix.
Office-using job growth will remain healthy in most U.S. cities but will grow at a decelerating rate as full employment nears.
18 / Cushman & Wakefield
U.S. OFFICE-USING JOB GROWTH BY CITY2017 - 2019
Source: Moody’s Analytics
0
20
40
60
80
100
00
0’s

cushmanwakefield.com / 19
construction. A growing awareness among landlords of the upcoming pipeline has led to competitive markets with growing concessions. Currency fluctuations and a stronger U.S. dollar relative to the peso is also negatively impacting rent growth in certain parts of the region.
In South America, most office markets are now seeing better demand for office space; however, high construction levels will keep vacancy elevated. In Brazil, vacancy rates have finally topped out and will fall slightly between 2017 and 2019. Supply-driven vacancy rates in São Paulo and Rio de Janeiro will keep rents soft. As economic conditions stabilize, São Paulo’s relative strength will allow vacancy rates to decline more rapidly relative to most other South American cities. Other markets have been more resilient to the economic turmoil, showing balanced vacancies and only small rent decreases, such as Colombia.
JOBS The largest cities will continue to lead the region in terms of the sheer number of jobs created, but it is the secondary markets that will see the clearest move-up in growth rates and rankings. New York City, Los Angeles and Mexico City remain in the top five, and other major cities—Dallas, Atlanta, Chicago, Boston, and the Washington, DC Metro—improve or hold strong in the rankings. Rio de Janeiro and São Paulo make the most dramatic move upwards from 2016 to 2018 as the region exits a recession.
Still growing, but at a slower rate, are tech markets: San Francisco, Silicon Valley, Seattle, Austin and Denver in the U.S., and Canadian markets Toronto, Vancouver and Montreal. U.S. tech hubs peaked earliest in the cycle and many are now bumping up against labor shortages and housing affordability challenges. Canadian markets will likely see net migration and job growth suffer if affordability continues to deteriorate.
LATIN AMERICA: ON THE MENDOffice-using Job Growth
Source: Oxford Economics
-50
0
50
100
150
Rio de Janeiro São Paulo Mexico City
00
0’s
2014-2016 2017-2019
CANADA’S TOP 5: OFFICE-USING JOB GROWTH2017-2019
Source: Oxford Economics
0 5 10 15 20
Calgary
Ottawa
Montreal
Toronto
Vancouver
000’s

20 / Cushman & Wakefield
AMERICAS EUROPE APACGLOBAL APPENDIXAMERICAS
SUPPLY & DEMANDIn the U.S., the bulk of the new construction is concentrated in the country’s largest cities, for example San Jose/Silicon Valley, Dallas, the Washington, DC Metro, San Francisco and New York. In all of these cities, supply will outstrip demand and vacancy will inch up, but not dramatically so. Some smaller markets are also ramping up construction. Nashville has the lowest vacancy rate in the U.S. at the moment and developers seem to be keenly aware. Nashville will see new completions nearly quadruple over the next 3 years relative to the prior 3 years. The construction pipeline is also heating up in Charlotte, Raleigh/Durham, and Denver—all generally healthy absorption markets, but new supply will likely outstrip demand, resulting in
higher vacancy. Outside of the U.S., Montreal and Mexico City fall into a similar category—where completions look relatively high to net absorption.
On the other end of the spectrum, developers in some markets appear to be underestimating future demand. This includes Orlando, Phoenix, Portland and Philadelphia—in all of these markets, office-using job growth remains solid, and in some, is shifting into a higher gear. These markets stand out as some of the strongest opportunities for future development.

cushmanwakefield.com / 21
+230BP
+290BP
+450BP
+490BP
Construction Activity Snapshot 2017 - 2019
NASHVILLE MEXICO CITY
See appendix for full list of city rankings.
DALLAS MONTREAL
-470BP
ORLANDO PHOENIX
-400BP
-250BP
PORTLAND
-120BP
PHILADELPHIA
Completions Net Absorption Change in Vacancy Rate Q4 2019 vs. Q4 2016
WHERE VACANCY WILL INCREASE
WHERE VACANCY WILL DECREASE
22 / Cushman & Wakefield
AMERICAS EUROPE APACGLOBAL APPENDIXAMERICAS
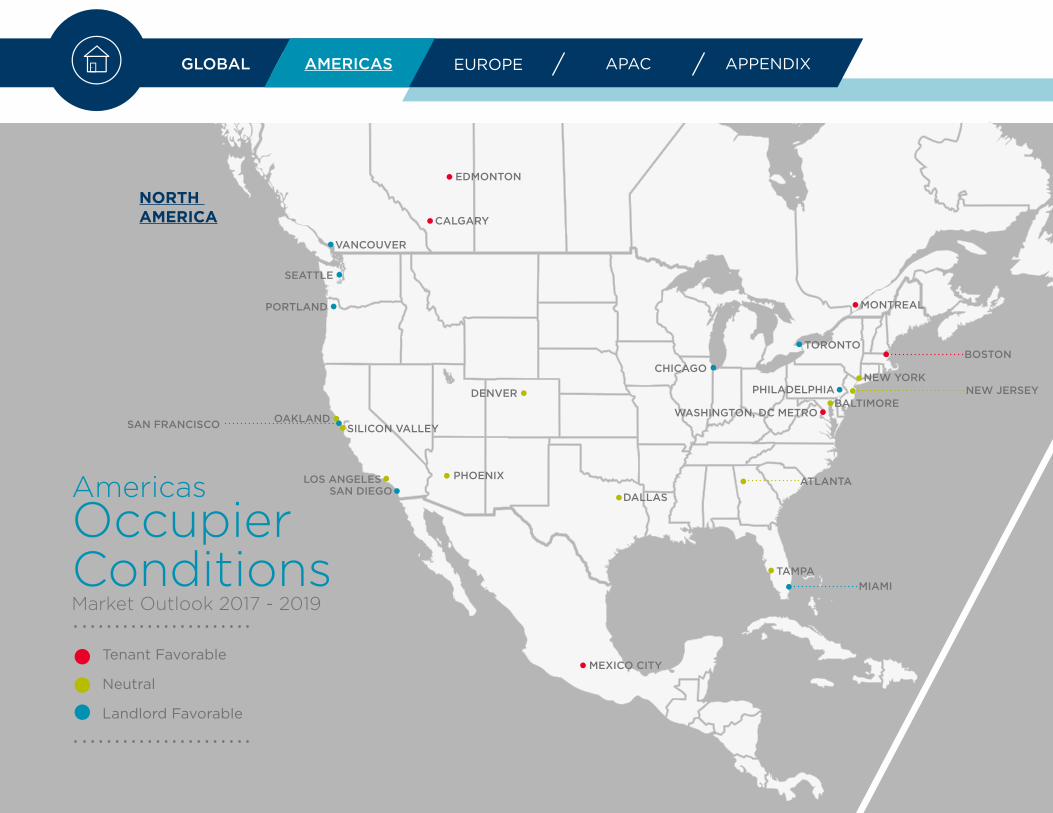
Tenant Favorable
Neutral
Landlord Favorable
AmericasOccupierConditionsMarket Outlook 2017 - 2019
NORTH AMERICA
ATLANTA
BALTIMORE
BOSTONCHICAGO
DALLAS
DENVER
LOS ANGELES
MIAMI
NEW YORK
OAKLAND
PHILADELPHIA
PHOENIX
PORTLAND
SAN DIEGO
SAN FRANCISCO SILICON VALLEY
SEATTLE
TAMPA
WASHINGTON, DC METRO
MEXICO CITY
CALGARY
EDMONTON
VANCOUVER
TORONTO
MONTREAL
NEW JERSEY

cushmanwakefield.com / 23
SOUTH AMERICA
“Outside the U.S., Canadian and energy-dependent markets will see rent growth stabilize and, in some cases, accelerate sharply.”
As most cities in the Americas enter into the mature phase of the real estate cycle,
market conditions are moderating by and large, and rent increases will become smaller
for most markets. In the U.S., rent growth leaders throughout this cycle, such New York
and San Francisco, will cool off as supply finally catches up with demand. Others, such as Chicago
and Philadelphia, which have lagged, will now see rental growth accelerate. Outside the U.S., Canadian
and energy-dependent markets (including Calgary, Edmonton, Rio de Janeiro, Toronto and Vancouver) will
see rent growth stabilize and, in some cases, accelerate sharply. Houston is also among the latter.
cushmanwakefield.com / 23
BOSTON
SÃO PAULORIO DE JANEIRO
BUENOS AIRES
NEW JERSEY

24 / Cushman & Wakefield
AMERICAS EUROPE APACGLOBAL APPENDIXEUROPE
ECONOMIC DRIVERSThe economic recovery in the Eurozone continues to gain momentum as political risk recedes following the French presidential election. Although unemployment continues to fall, there is little upward pressure on wages which should mean the recent rise in inflation, due to energy prices, is temporary. The lack of underlying inflationary pressure so far has led the European Central Bank (ECB) to conclude that it is unlikely to make any meaningful policy changes anytime soon but the recent run of positive survey data, if sustained, could change their view. In particular, there is no plan to increase interest rates before further adjusting the pace of asset purchases, which could taper as early as Q4 this year, and there are no expectations of further liquidity operations – all of which is supportive of growth in the near term.
Europe
The UK economy has performed better than expected since the EU referendum in mid-2016, supported by healthy consumer demand. However, there is growing concern over how long this consumer resilience can continue given the political uncertainty caused by the snap election in June— which resulted in a weakened Conservative government—and the commencement of Brexit negotiations. In addition, the main impact from Brexit to date has been the 10% depreciation in pound sterling which is helping to improve UK exporters’ competitive advantage relative to their European counterparts. But Brexit is also pushing up inflation as costs get passed on through the supply chain. Higher inflation is eating into real wages which are now declining for the first time since 2014. Even so, consumer spending still remains resilient although there are concerns over how long this can continue.
24 / Cushman & Wakefield

cushmanwakefield.com / 25cushmanwakefield.com / 25
THE ECONOMIC RECOVERY IN THE EUROZONE CONTINUES TO GAIN MOMENTUM AS POLITICAL RISK RECEDES FOLLOWING THE FRENCH PRESIDENTIAL ELECTION
NO PLAN TO INCREASE INTEREST RATES BEFORE ADJUSTING THE PACE OF ASSET PURCHASES, WHICH COULD BEGIN TAPERING AS EARLY AS Q4 THIS YEAR
THE MAIN IMPACT FROM BREXIT TO DATE HAS BEEN THE 10% DEPRECIATION IN STERLING WHICH IS HELPING TO IMPROVE THE COMPETITIVENESS OF UK EXPORTERS RELATIVE TO THEIR EUROPEAN COUNTERPARTS
HIGHER INFLATION IS EATING INTO REAL WAGES IN THE UK WHICH ARE NOW FALLING FOR THE FIRST TIME SINCE 2014
THE COMBINATION OF LOW DEVELOPMENT AND MODERATE DEMAND HAS LED TO AN UNPRECEDENTED 7-YEAR PERIOD OF POSITIVE AND STABLE, YET MODEST, RENTAL GROWTH
OFFICE COMPLETIONS HAVE BEEN GRADUALLY INCREASING YEAR BY YEAR SINCE 2013 AND ARE SET TO MOVE ABOVE THE 10-YEAR AVERAGE IN 2017 AND 2018
€
%

26 / Cushman & Wakefield
AMERICAS EUROPE APACGLOBAL APPENDIXEUROPE
OFFICE SECTORThe shortage of high quality office space in Europe’s major office markets has intensified which is continuing to push development activity higher, albeit still considerably more restrained than the peak of the last two cycles. Since 2009, office completions have been consistently below the 10-year historic average as the process of deleveraging and the unwinding of non-performing loans restricted development finance in the early part of the cycle. This was followed by a risk-off investment and business environment due to continued economic, financial and political uncertainty in subsequent years. The combination of low development and moderate demand has led to an unprecedented seven-year period of positive and stable, yet modest, rental growth which has gradually improved the viability of development. This is especially true now in a period of sustained employment growth and low interest rates, and so there is a greater willingness by investors to target higher risk opportunities. As such, office
EUROPE KEY FACTS
Slower office-based employment growth
We expect office-based employment growth to slow to just 1.5% per annum by 2019.
Importance of information and communications sectors
Budapest, Dublin, Copenhagen and Madrid are expected to have the strongest growth rates in this sector over the next 3 years.
Stockholm, Amsterdam and Helsinki
Less than 2.5% of stock is expected to be completed in the majority of these markets offering the potential for reduced vacancy and rental growth.
Limited rent growth
Warsaw, Sofia, Prague and Budapest are expected to see high levels of completions which will push vacancy rates upwards and limit rental growth for all but the very best space.
What to watch
Brexit-related uncertainty is expected to inhibit office-based job growth in the near term, particularly attracting and retaining European workers.
Significant rise in completions
Over the next 3 years, development completions are expected to increase significantly in Istanbul, London, Brussels, Vienna and Dublin.

cushmanwakefield.com / 27
completions have been gradually increasing year by year since 2013 and are set to move above the 10-year average in 2017 and 2018. This is likely to reduce the rental growth potential for Europe as a whole over the next few years, but there will still be variation by location.
Broadly speaking, office-based employment growth across the Eurozone and the UK should support office occupier demand over the next two years, but it is not expected to match development completions in the aggregate. As the unemployment rate declines, the ability of markets to add jobs at the same rate also decreases; that will impact net absorption. However, there will be differences in performance with Macron’s France expecting employment growth to pick up in 2017-18, while near full employment will slow job creation and net absorption in Germany and the UK.
Office employment growth is set to slow from 2.5% pa over 2014-16 to 1.5% pa over 2017-19.
EUROPE OFFICE-USING JOB GROWTH
Source: Oxford Economics
0
200
400
600
800
1,000
1,200
2014 2015 2016 2017 2018 2019
00
0’s

28 / Cushman & Wakefield
AMERICAS EUROPE APACGLOBAL APPENDIXEUROPE
Top 5 Cities Ranked by Office-using Job Growth (% Increase)
OFFICE-USING JOB GROWTH BY CITY2017 - 2019
1 Istanbul2014-2016: 31.6%2017-2019: 14.6%
2 Budapest2014-2016: 24.2%2017-2019: 8.9%
3 Madrid2014-2016: 10.8%2017-2019: 7.2%
4 Milan2014-2016: 8.3%2017-2019: 6.4%
5 Amsterdam2014-2016: 7.7%2017-2019: 6.4%
For full list of city rankings, see appendix.
London’s low unemployment rate coupled with Brexit driven uncertainty, particularly for EU workers, will reduce office-based job growth over the next 3 years.
Source: Oxford Economics
28 / Cushman & Wakefield
02468
10121416
%
cushmanwakefield.com / 29
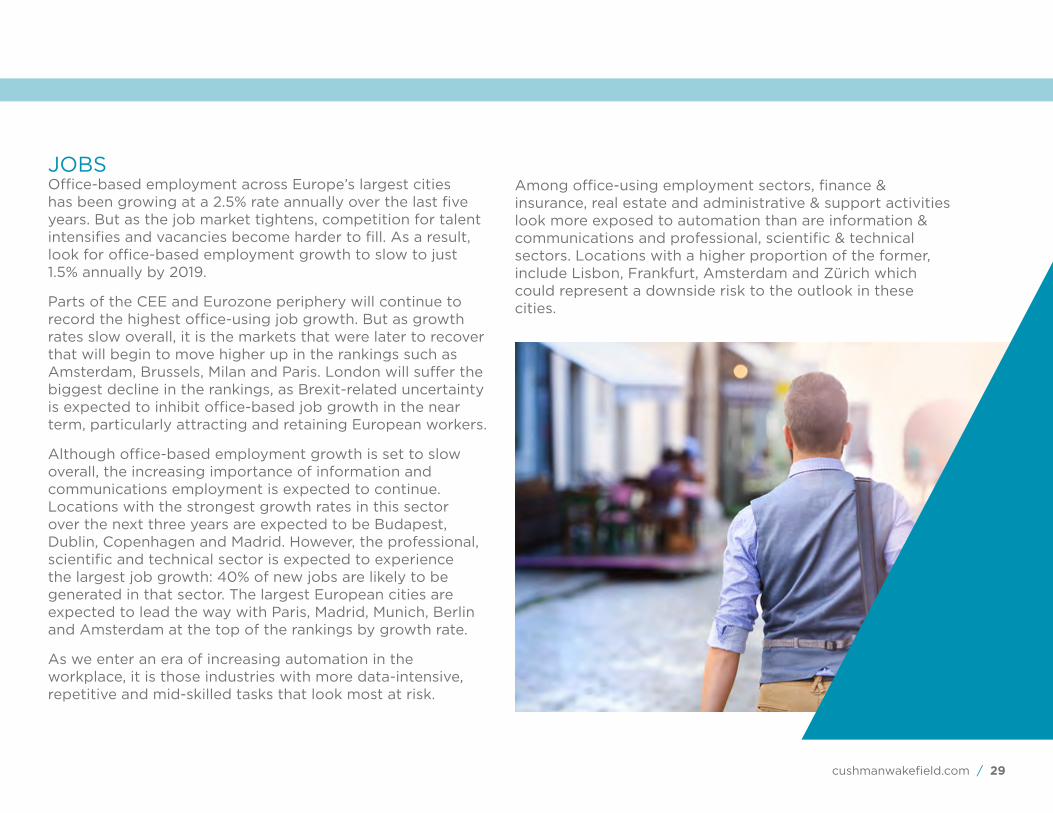
JOBS Office-based employment across Europe’s largest cities has been growing at a 2.5% rate annually over the last five years. But as the job market tightens, competition for talent intensifies and vacancies become harder to fill. As a result, look for office-based employment growth to slow to just 1.5% annually by 2019.
Parts of the CEE and Eurozone periphery will continue to record the highest office-using job growth. But as growth rates slow overall, it is the markets that were later to recover that will begin to move higher up in the rankings such as Amsterdam, Brussels, Milan and Paris. London will suffer the biggest decline in the rankings, as Brexit-related uncertainty is expected to inhibit office-based job growth in the near term, particularly attracting and retaining European workers.
Although office-based employment growth is set to slow overall, the increasing importance of information and communications employment is expected to continue. Locations with the strongest growth rates in this sector over the next three years are expected to be Budapest, Dublin, Copenhagen and Madrid. However, the professional, scientific and technical sector is expected to experience the largest job growth: 40% of new jobs are likely to be generated in that sector. The largest European cities are expected to lead the way with Paris, Madrid, Munich, Berlin and Amsterdam at the top of the rankings by growth rate.
As we enter an era of increasing automation in the workplace, it is those industries with more data-intensive, repetitive and mid-skilled tasks that look most at risk.
Among office-using employment sectors, finance & insurance, real estate and administrative & support activities look more exposed to automation than are information & communications and professional, scientific & technical sectors. Locations with a higher proportion of the former, include Lisbon, Frankfurt, Amsterdam and Zürich which could represent a downside risk to the outlook in these cities.

30 / Cushman & Wakefield
AMERICAS EUROPE APACGLOBAL APPENDIXEUROPE
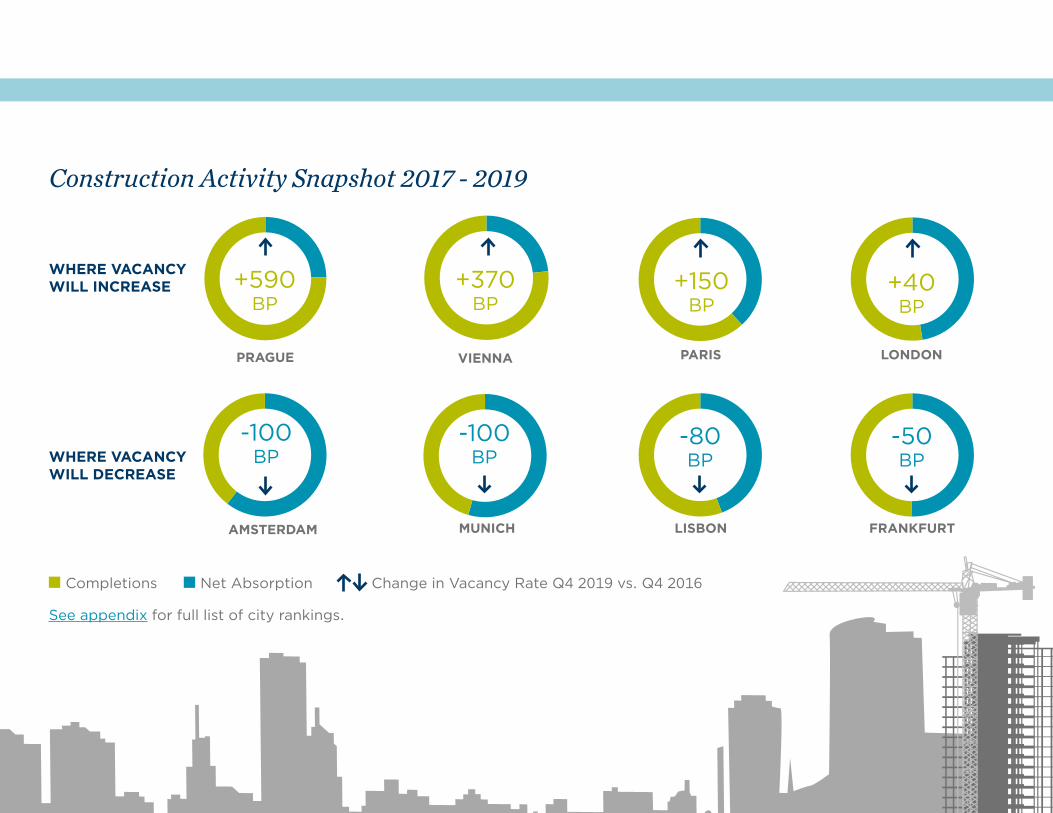
SUPPLY & DEMANDOver the next three years, the number of development completions is expected to increase significantly in Istanbul, London, Brussels, Vienna and Dublin. In fact, over 2017-18, Istanbul, Copenhagen and the City of London will see the highest level of completions so far this cycle. Paris completions also look high relative to net absorption, due to a number of larger schemes that are expected to complete in La Defense in 2019.
Parts of the CEE region may also be at risk from oversupply in the near term as developers and investors back the positive long-term economic growth story, and the continued strength of office-occupying sectors such as business process outsourcing and IT. Warsaw, Sofia, Prague
and Budapest are expected to see high levels of completions which will push vacancy rates upwards and limit rental growth for all but the very best space.
At the opposite end of the spectrum, the number of development completions will be low over the next few years in the key German and Italian office markets, Stockholm, Amsterdam and Helsinki. Less than 2.5% of stock is expected to be completed in the majority of these markets, offering the potential for reduced vacancy and rental growth.
cushmanwakefield.com / 31
+40BP
+150BP
+370BP
+590BP
Construction Activity Snapshot 2017 - 2019
PRAGUE VIENNA
See appendix for full list of city rankings.
Completions Net Absorption
PARIS LONDON
-100BP
AMSTERDAM MUNICH
-100BP
-80BP
LISBON
-50BP
FRANKFURT
Change in Vacancy Rate Q4 2019 vs. Q4 2016
WHERE VACANCY WILL INCREASE
WHERE VACANCY WILL DECREASE

32 / Cushman & Wakefield
AMERICAS EUROPE APACGLOBAL APPENDIXEUROPE
Tenant Favorable
Neutral
Landlord Favorable
EuropeOccupierConditionsMarket Outlook 2017 - 2019
PARIS
BERLIN
DUBLIN
ROME
MILAN
AMSTERDAM
MADRID
LONDON
VIENNA
BRUSSELS
PRAGUEFRANKFURT
MUNICH
BUDAPEST
OSLO
LISBON
STOCKHOLM
COPENHAGEN
LUXEMBOURG
ZURICH
cushmanwakefield.com / 33
“The European outlook is broadly landlord-favorable or neutral. Locations classified as tenant-friendly typically have rising development activity impacting vacancy and rental growth.”
The duration of a typical real estate cycle is estimated to range from 7 to
10 years which would place the current cycle at an advanced stage. Office rents
in many European property markets are now above previous cyclical highs while
employment growth is set to moderate going forwards. The combination of these
factors coupled with an uptick in new supply for certain locations means that rental growth
is set to slow over the forecast period. The best rental growth performers will continue to be the
peripheral European economies of Ireland and Spain plus Portugal, still befitting from a cyclical upswing
after being impacted the most during the GFC and Eurozone crisis.
MOSCOW
WARSAW
ISTANBUL
cushmanwakefield.com / 33
BUCHAREST

34 / Cushman & Wakefield
AMERICAS EUROPE APACGLOBAL APPENDIXAPAC
ECONOMIC DRIVERSEconomic conditions will continue to improve throughout Asia Pacific, with the region’s powerhouses anchoring growth for the foreseeable future. In China, look for a steady near-term outlook to persist, with consumption as the main growth driver, aided by fiscal and monetary support, as well as economic reform (special feature on Greater China highlighted on pg. 42). In Japan, the improving external sector, ultra-loose monetary policy, and strengthening labor market will support economic activity. A resurgence in external demand will buttress regional trade and, in turn, spur export-oriented economies in the region. While a boom is not in the cards, stronger global and regional trade will support better economic growth in Singapore and Hong Kong. In South Korea, newly elected President Moon Jae-In has plans to boost job growth and support consumption, improve relations with North Korea, and address the concentration of power in large conglomerates, or chaebols. Australia’s economy also stands to get a lift from a promising investment outlook, supported, in part, by the government’s infrastructure program along with healthy fundamentals.
APAC
In the emerging markets, the Philippine and Vietnamese economies will remain among the fastest-growing in Asia Pacific. Favorable demographics, a stable business process outsourcing (BPO) industry and overseas foreign worker (OFW) income—as well as an infrastructure boom—will be key to the Philippines’ positive outlook. Vietnam’s young population, surging export manufacturing and robust construction activities are likely to underpin solid growth in its economy over the next few years
Investor confidence in Indonesia received a shot in the arm after Standard & Poor’s (S&P) returned the country’s government debt to investment grade (BBB-), after a tax amnesty boosted the nation’s coffers. Reforms are spurring a turnaround in the Indonesian economy after growth hit a six-year low in 2015. The upgrade should help raise investor confidence across most asset classes, including real estate. Similarly in India, the introduction of the long-awaited goods and services tax (GST) on July 1, along with other reforms, have also enhanced the investment climate. These policies will help India maintain its status as the world’s fastest growing large economy, with GDP growth north of 7%, although China will not be far behind.

cushmanwakefield.com / 35cushmanwakefield.com / 35
HONG KONG WILL LIKELY BENEFIT FROM A RECOVERY IN GLOBAL TRADE DYNAMICS ALTHOUGH THERE IS LIKELIHOOD OF SLOWER GROWTH IN DEMAND FROM MAINLAND CHINA IMPORTS
EMPLOYMENT GROWTH IN HONG KONG WILL EXPERIENCE CHALLENGES AS AN AGING POPULATION PUTS LIMITATIONS ON JOB CREATION
FOLLOWING DOWN YEARS IN 2015 AND 2016, TAIWAN’S ECONOMY IS EXPECTED TO PICK UP IN THE YEARS AHEAD
IN JAPAN, THE IMPROVING EXTERNAL SECTOR, ULTRA-LOOSE MONETARY POLICY, AND STRENGTHENING LABOR MARKET WILL SUPPORT ECONOMIC ACTIVITY
STRONGER GLOBAL AND REGIONAL TRADE WILL SUPPORT BETTER ECONOMIC GROWTH IN SINGAPORE AND HONG KONG
AUSTRALIA’S ECONOMY STANDS TO GET A LIFT FROM A PROMISING INVESTMENT OUTLOOK, SUPPORTED, IN PART, BY THE GOVERNMENT’S INFRASTRUCTURE PROGRAM

36 / Cushman & Wakefield
AMERICAS EUROPE APACGLOBAL APPENDIXAPAC
OFFICE SECTORGlobal banks are once again on a hiring spree in key Asian markets—reversing the trend of aggressive job cutbacks of recent years—in an attempt to capitalize on the region’s growth. In the last 12 months through May 2017, the banking, financial services and insurance (BFSI) sector was the biggest driver of leasing activity. The majority of leases over 100,000 square feet (SF) were sealed by prominent financial institutions which expanded their footprints by more than 30%. Tokyo’s governor, Yuriko Koike, also announced plans to make the Japanese capital a “global financial city,” using tax cuts and special incentives to lure 40 foreign financial technology (fin-tech) or asset management companies by fiscal 2020.
Radical advances in e-commerce and mobile applications, breakthroughs in artificial intelligence (AI), robotics and automation (just to name a few) continue
APAC KEY FACTS
Job growthleaders
Shenzhen and Guangzhou are expected to have impressive job growth rates due to the rise of fin-tech and e-commerce.
Global bankhiring spree
In the last 12 months through May 2017, the BFSI sector was the biggest driver of leasing activity in APAC.
Rise in Beijing vacancy
70 msf is scheduled to deliver between 2017 and 2019. Overall vacancy could climb from 6.6% to 16.8% over the next three years.
Mildrent growth
Expect tenant-favorable conditions in core locations through 2019, except Sydney, Hong Kong’s Greater Central, and Singapore, where vacancies are expected to tighten.
What to watch
In India, the introduction of the long-awaited GST on July 1, along with other reforms, will continue to enhance the investment climate.
Record developmentin 2017
In APAC there is nearly 150 msf of new office projects slated for completion across the 25 major cities we monitored.

cushmanwakefield.com / 37
02468
1012141618
2015 2016 2017 2018 2019
Mill
ions
to reshape office growth drivers in the region. Indeed, while rapid advances have displaced some workers, ongoing technological changes will generate at least 300,000 net new jobs across the region led by Bengaluru, Manila and Hyderabad.
Over the last 12 months through May 2017, new economy companies have also been among the most active tenants, accounting for nearly 20% of significant leases (over 50,000 SF) in the region. Ride-hailing companies Uber and Grab have been at the forefront of this recent tech space leasing explosion, showing a preference for brand-new buildings in India and Southeast Asia. More deals are in the works and are expected to contribute to further growth in this sector. Notably, Southeast Asia is evolving into a pivotal battleground
for Chinese companies, not only due to significant opportunities arising from deepening mobile penetration and an emergent middle-class, but also because of the draw of a large ethnic Chinese population.
The co-working business, meanwhile, continues to gain traction in the region; it accounts for 10% of leasing activity over the last 12 months, with U.S.-based WeWork the most aggressive operator in the region. As competition heats up, most co-working operators are luring big corporations to try their “hip” workspaces. Nearly 10,000 seats were leased across the region by companies including Microsoft, HSBC, BNP Paribas, Boeing and Alibaba.
Global banks are once again on a hiring spree in key Asian markets—reversing the trend of aggressive job cutbacks of recent years—in an attempt to capitalize on the region’s growth.
APAC OFFICE-USING JOB GROWTH
Source: Oxford Economics

38 / Cushman & Wakefield
AMERICAS EUROPE APACGLOBAL APPENDIXAPAC
Top 5 Cities Ranked by Office-using Job Growth (000’s)
OFFICE-USING JOB GROWTH BY CITYSelect Cities 2017 - 2019
1Beijing*2014-2016: 549.22017-2019: 531.8
2 Shanghai*2014-2016: 818.62017-2019: 454.5
3 Shenzhen*2014-2016: 248.82017-2019: 305.9
4 Guangzhou*2014-2016: 247.92017-2019: 241.0
5 Delhi-NCR2014-2016: 121.72017-2019: 220.6
For full list of city rankings, see appendix.*full-time services sector employees only
The region as a whole will see office employment increase by 2.3% in 2017 as economic conditions remain conducive, with China contributing 80% of new employment in the region.
Note: China cities include new full-time employees in the services sector; Hong Kong & Taipei City include employment gains in the financial and business services sector
Source: Oxford Economics
38 / Cushman & Wakefield
0
100
200
300
400
500
600
00
0’s

cushmanwakefield.com / 39
JOBSThe region as a whole will see office employment increase by 2.3% this year as economic conditions remain conducive, with China contributing 80% of new employment in the region. Excluding China, the region’s emerging markets remains the chief source of gains, with Indonesia and the outsourcing hubs of India and Philippines expected to register the highest jobs created this year. Ongoing investments in infrastructure is likely to sustain continued employment gains in the emerging economies. Australia will buck the region-wide trend with
office employment expected to remain largely flat. However, the Victoria state remains a bright spark and is expected to be the chief source of job creation amongst the Australian states and territories over the next five years. In particular, the state’s capital city, Melbourne, has seen record interstate migration as a number of corporate and public agencies set up headquarters there, the most recent being Chinese e-commerce giant Alibaba.
Global banks are once again on a hiring spree in key Asian
markets in an attempt to capitalize on growth in the region.

40 / Cushman & Wakefield
AMERICAS EUROPE APACGLOBAL APPENDIXAPAC
SUPPLY & DEMANDThis growth potential in the BFSI and technology industries, along with other office-using sectors, bodes well for the office sector. We estimate that this could translate to a record annual average of over 100 msf of new office space requirements across the region through 2019. This comes at an opportune time as development surges; 2017 will be a record year, with nearly 150 msf of new office projects slated for completion across the 25 major cities that we track.
While there is likely to be a surplus of space in select markets1, the growing obsolescence of office stock in gateway cities like Singapore, Melbourne and Tokyo, and even in emerging locations like Manila, means new projects remain attractive to high-quality tenants looking for efficiency and modern facilities, and so these markets boast strong pre-leasing activity. Notably, nearly half of the projects coming online this year are already pre-committed in some of these markets.
1 Markets with office vacancies exceeding 14%: Ahmedabad, Chengdu, Hanoi, Jakarta, Kolkata, Mumbai, New Delhi, Adelaide and Perth

cushmanwakefield.com / 41
+102BP
+280BP
+620BP
+1900BP
Construction Activity Snapshot 2017 - 2019
SHENZHEN JAKARTA
See appendix for full list of city rankings.
Completions Net Absorption
TOKYO BEIJING
-620BP
GUANGZHOU BANGKOK
-150BP
-380BP
SYDNEY
-200BP
BENGALURU
Change in Vacancy Rate Q4 2019 vs. Q4 2016
WHERE VACANCY WILL INCREASE
WHERE VACANCY WILL DECREASE
42 / Cushman & Wakefield
AMERICAS EUROPE APACGLOBAL APPENDIXAPAC
ECONOMIC DRIVERSAs China’s economy slowed to a 6.7% growth rate in 2016, one bright spot was the continued expansion of the services sector. Growth in this sector is a key feature of the country’s ongoing transition from dependency on foreign investment, traditional manufacturing and heavy industry to a greater emphasis on a domestically driven economy with higher value-added products, technology growth, innovation and robust domestic consumption. As of Q1 2017, China’s services sector accounted for 57% of GDP, up from a 43% share a decade ago. The multi-billion dollar financial services sector, medical services and modern transportation networks are solid examples of services industries that have achieved triple-digit growth over the last decade, and benefited from strong government policy support.
Growth on the financial services sector has been particularly impressive considering stock market volatility. The sector has been increasingly liberalized to support the country’s financial development, with the central government calling for Shanghai to become an international financial center by 2020 and establishing new free trade zones in both Shanghai and Shenzhen to further drive services growth and investment. Medical services is another strong growth industry that has emerged to support an increasingly aging population and rising demand from a wealthier middle class.
Hong Kong will likely benefit from recovery in global trade dynamics although slower growth in demand from
Closer Look at Greater China
mainland China imports is a possibility. Nonetheless, the city’s finance and banking sector will likely remain resilient thanks to its well-regulated financial system. Employment growth in Hong Kong will face challenges as an aging population limits job creations. According to Oxford Economics, Hong Kong’s GDP is expected to grow between 2.2% and 2.6% annually from 2017 to 2019, up from 2.0% in 2016, whereas its office employment growth may likely soften from 3.9% in 2016 to 2.1% by 2019.
Following down years in 2015 and 2016, Taiwan’s economy is expected to pick up. Oxford Economics forecasts the island’s GDP to improve from 1.5% in 2016 to north of 2% annually between 2017 and 2019 on expectations for rising global demand for electronics and manufacturing goods. Nonetheless, the financial and business services sector will likely experience more modest growth of sub-1% with domestic demand remaining relatively sluggish as a result of flat income growth.
OFFICE SECTORNearly 200 msf of new office supply is expected to enter China’s four Tier-1 cities, Hong Kong and Taiwan over the next three years, raising the total stock of the six markets to 564 msf. The flood of new deliveries is likely to create tension in the markets despite current strong demand for office space. Net absorption is forecasted to total about 133 msf from 2017 through 2019—roughly two-thirds of the new supply. In 2015 and 2016, the six markets combined have absorbed a total of 60 msf of new supply since the construction boom in China started. Most of the take-up was driven by pent-up demand as

cushmanwakefield.com / 43
the average vacancy rate remained quite low (below 7%) between 2011 and 2015. Consequently, overall vacancy in the six Tier-1 markets was 10% at the end of 2016 and is projected to increase to a record 17% in 2019.
Higher vacancy rates will inevitably place downward pressure on rental growth, which is expected to gradually soften from 1.6% in 2016 to sub-1% by 2019 across Greater China. Still, the market is not likely to experience a notable rental drop. This is due in large part to the quality of new projects set to come online and replacement of some existing lower-quality buildings raising the profile of China’s Class A office market. Worth noting is that the majority of upcoming office projects are located in decentralized or emerging areas as part of wider city government plans
CHINA’S ECONOMIC GROWTH RATE HAS SLOWED, BUT IS STILL ABOVE 6.5% AND THE SERVICES SECTOR REMAINS A BRIGHT SPOT.
NEARLY 200 MSF OF NEW OFFICE SUPPLY IS EXPECTED TO ENTER CHINA’S FOUR TIER-1 CITIES, HONG KONG AND TAIWAN OVER THE NEXT THREE YEARS, RAISING THE TOTAL STOCK OF THE SIX MARKETS TO 564 MSF.
HIGHER VACANCY RATES WILL INEVITABLY PLACE DOWNWARD PRESSURE ON RENTAL GROWTH, WHICH IS EXPECTED TO GRADUALLY SOFTEN FROM 1.6% IN 2016 TO SUB-1% BY 2019 ACROSS GREATER CHINA.
A NOTABLE RENTAL DROP IS NOT LIKELY TO BE EXPERIENCED DUE TO THE QUALITY OF NEW PROJECTS SET TO COME ONLINE. THE NEW PROJECTS WILL REPLACE EXISTING LOWER-QUALITY BUILDINGS AND RAISE THE PROFILE OF CHINA’S CLASS A OFFICE MARKET.
THE MAJORITY OF UPCOMING OFFICE PROJECTS ARE LOCATED IN DECENTRALIZED OR EMERGING AREAS AS PART OF WIDER CITY GOVERNMENT PLANS TO CREATE AND/OR GROW FUTURE BUSINESS DISTRICTS.
cushmanwakefield.com / 43
GREATER CHINA OFFICE VACANCY
Source: Cushman & Wakefield Research
0%
3%
6%
9%
12%
15%
18%
2010 2011 2012 2013 2014 2015 2016 2017 2018 2019
44 / Cushman & Wakefield
AMERICAS EUROPE APACGLOBAL APPENDIXAPAC
Shenzhen and Guangzhou are expected to benefit from the rise of fintech and e-commerce and leverage advantages in their developed technology infrastructure.
SUPPLY & DEMANDBeijing currently enjoys the lowest office vacancy rate of the six Tier-1 markets—6%— but is due to receive the largest amount of new supply among the major Greater China markets at nearly 70 msf between 2017 and 2019. Despite a relatively high preleasing rate in some locations and approximately one-third of the city’s new supply to be owner-occupied, Beijing’s overall vacancy rate is likely to increase to 16.8% by the end of 2019. The vacancy rate in Guangzhou, on the other hand, is projected to decline to 8.1% by 2019, the lowest vacancy forecasted in Greater China and down from 14.3% currently. Factors in Guangzhou’s favor include a relatively low volume of scheduled future supply, especially in 2018 and 2019, and a high proportion of owner-occupied space at approximately 60% of the new deliveries.
Elsewhere, Shenzhen’s vacancy rate is likely to jump above 30% by 2019 despite the strong demand seen in recent quarters. The city will be under considerable pressure to absorb a massive 57.5 msf of new office supply in three years, eclipsing the relatively small size of a Class A stock of only 37 msf at year-end 2016. The remaining markets of Shanghai, Hong Kong and Taipei are expected to remain relatively steady with moderate increases in vacancy rates.
Demand for quality office space continues to rise in both mainland China and Hong Kong. Among Tier-1 Chinese cities, roughly 78% of leasing demand is now driven by by People’s Republic of China (PRC)-based companies compared to 68% one year ago. More significantly, in Hong Kong PRC companies accounted for approximately 60% of new leases or expansions in 2016, nearly double the 31% share in 2015. Among notable transactions, both Alibaba and HNA expanded their office presence in central locations to
to create and/or grow future business districts. Examples of these emerging CBDs include Qiantan in Shanghai, Qianhai in Shenzhen, Pazhou in Guangzhou and Kowloon East in Hong Kong. As a result, some cities may see polarization of market performance. The core central markets will likely continue to remain tight and produce optimal rental growth, whereas new emerging markets likely face extensive vacancies and slower rental growth in the short run as they mature.
JOBSAs the two most-populous cities in China, Shanghai and Beijing are expected to add the largest number of new services jobs over the next three years. In terms of the rate of the sector’s job growth over the same period, Oxford Economics forecasts Shenzhen and Guangzhou to lead the way at a 5.2% and 3.5% clip, respectively, compared to the national average of 2.7%. The two southern Chinese cities are expected to benefit from the rise of fintech and e-commerce and leverage advantages in their developed technology infrastructure.

cushmanwakefield.com / 45
around 100,000 SF. PRC office demand is expected to remain relatively strong over the next three years, particularly in Hong Kong’s Greater Central area as more PRC companies seek to “go global.”
Elsewhere, Shenzhen’s newly developed Qianhai area will also continue to attract many domestic and multinational companies. As of March 2017, Qianhai had 133,000 registered companies of which 41% opened offices—a significant
increase from the 250 companies four years ago, according to data from the Qianhai Authority. Moreover, in March 2017, the Chinese government announced a new “Greater Bay” plan to press forward with development of a city cluster in the Guangdong-Hong Kong-Macao Greater Bay Area, which includes Hong Kong, Shenzhen and Guangzhou. The South China economy is expected to strength further when execution of the Greater Bay plan is implemented in five years’ time.
GREATER CHINA: OFFICE SUPPLY VS. DEMAND2017 - 2019
Source: Cushman & Wakefield Research
132.7
199.4
0
50
100
150
200
250
2017-2019
MS
F
Net Absorption Completions

46 / Cushman & Wakefield
AMERICAS EUROPE APACGLOBAL APPENDIXAPAC
Tenant Favorable
Neutral
Landlord Favorable
APACOccupierConditionsMarket Outlook 2017 - 2019
SHENZHENGUANGZHOUHONG KONG
SHANGHAI
JAKARTA
SINGAPORE
BANGKOK
DELHI-NCR
MUMBAI
BEIJING
AHMEDABAD
PUNE
BENGALURU CHENNAI
HYDERABAD
KOLKATA
CHENGDU
HANOI
HO CHI MINH CITY
SEOUL
MANILA
KUALA LUMPUR

cushmanwakefield.com / 47
“Tenant-favorable conditions are expected in core locations through 2019, except Sydney, Hong Kong’s Greater Central, and Singapore - where vacancies will tighten going forward.”
With more than half of the emerging markets expecting vacancies to rise more
than 14%, deceleration in rent growth will continue through 2019. Thus, conditions are
likely to remain tenant-favorable, with the exceptions of Manila, Bangkok, Bengaluru, and
Hyderabad. Rents in core markets are expected to pick up pace in 2018, except Tokyo and Seoul.
In Tokyo, a market correction will continue through 2020 eroding huge rental gains recorded over the
last five years. Overall, we expect tenant-favorable conditions in core locations through 2019, except Sydney,
Hong Kong’s Greater Central, and Singapore, where vacancies will tighten going forward.
cushmanwakefield.com / 47
SHANGHAI
MELBOURNE
SYDNEY
TOKYO
TAIPEI
SEOUL
BRISBANE

48 / Cushman & Wakefield
AMERICAS EUROPE APACGLOBAL APPENDIXAPPENDIX
City Ranks (Appendix)GLOBAL: VACANCY FORECAST FOR 2019
RANK CITY 2019
1 Sydney 2.4%
2 Berlin 3.1%
3 Munich 3.3%
4 Toronto 3.9%
5 Bengaluru 4.3%
6 Bangkok 4.5%
7 London 4.8%
8 Luxembourg 5.9%
9 Vancouver 6.3%
10 Vienna 6.7%
11 Tokyo 6.7%
12 Manila 6.9%
13 Orlando 7.2%
14 Ottawa 7.3%
15 Winnipeg 7.4%
16 Raleigh/Durham 7.7%
17 Melbourne 7.8%
18 Lisbon 8.0%
19 Guangzhou 8.1%
20 Paris 8.2%
21 Singapore 8.5%
22 Portland 8.6%
RANK CITY 2019
23 Frankfurt 8.6%
24 Boston 8.8%
25 Brussels 9.0%
26 Oakland 9.6%
27 Bucharest 9.7%
28 San Diego 9.8%
29 Silicon Valley 10.0%
30 San Francisco 10.2%
31 Nashville 10.3%
32 Pune 10.3%
33 Manhattan 10.4%
34 Stockholm 10.4%
35 Taipei City 10.5%
36 Orange County 10.7%
37 Philadelphia 10.7%
38 Charlotte 10.8%
39 Sacramento 11.3%
40 Hyderabad 11.5%
41 Budapest 11.5%
42 Hong Kong 11.5%
43 Brisbane 11.6%
44 Montreal 11.9%
RANK CITY 2019
45 Tampa 11.9%
46 Amsterdam 12.1%
47 Seattle 12.4%
48 Miami 12.5%
49 Seoul 12.6%
50 Kuala Lumpur 12.7%
51 Dublin 12.7%
52 Milan 12.8%
53 Washington, DC 13.1%
54 Shanghai 13.2%
55 Phoenix 13.4%
56 Rome 13.4%
57 Los Angeles 13.8%
58 Baltimore 13.9%
59 Warsaw 14.5%
60 Madrid 14.5%
61 Denver 14.9%
62 Chicago 15.0%
63 Mexico City 15.6%
64 Chennai 15.6%
65 Prague 16.5%
66 Beijing 16.8%
RANK CITY 2019
67 Ho Chi Minh City 17.6%
68 Houston 17.7%
69 Mumbai Overall 18.8%
70 Atlanta 19.2%
71 Mumbai Core 19.4%
72 Dallas 20.3%
73 Edmonton 20.9%
74 Calgary 21.4%
75 São Paulo 22.0%
76 Delhi-NCR 26.4%
77 Jakarta 28.5%
78 Shenzhen 32.3%
79 Kolkata 36.4%
80 Rio de Janeiro 36.7%
81 Ahmedabad 53.6%
cushmanwakefield.com / 49
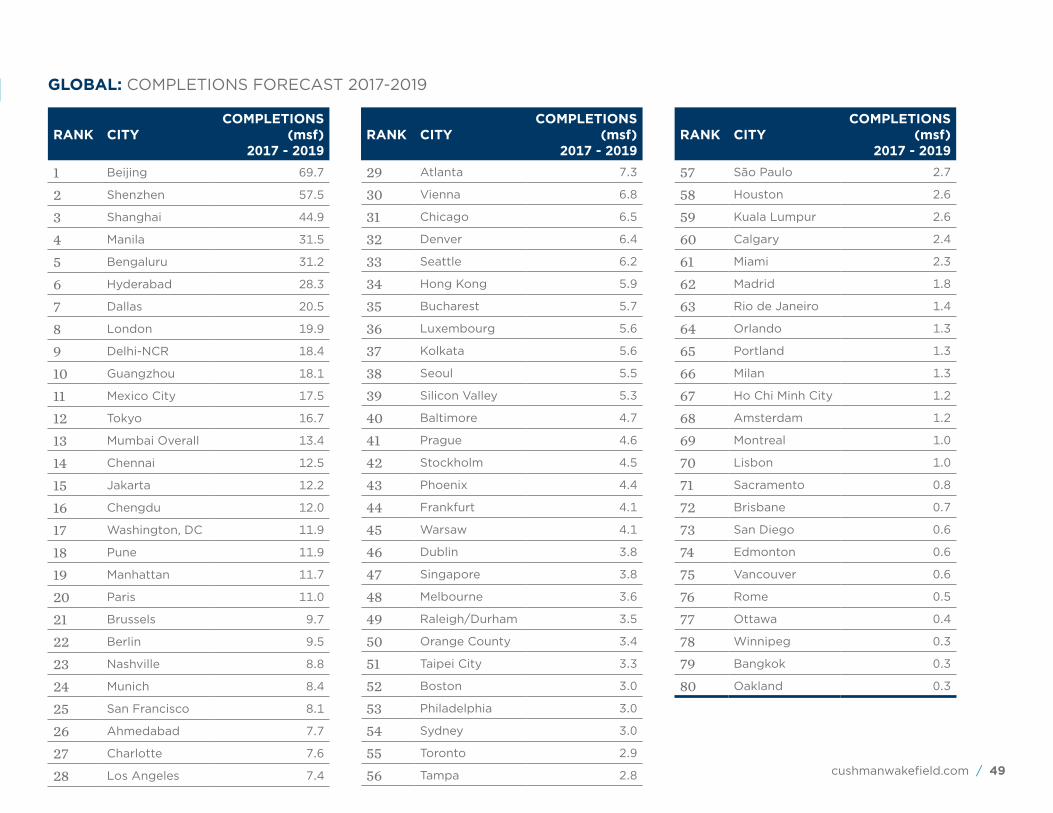
GLOBAL: COMPLETIONS FORECAST 2017-2019
RANK CITYCOMPLETIONS
(msf)2017 - 2019
1 Beijing 69.7
2 Shenzhen 57.5
3 Shanghai 44.9
4 Manila 31.5
5 Bengaluru 31.2
6 Hyderabad 28.3
7 Dallas 20.5
8 London 19.9
9 Delhi-NCR 18.4
10 Guangzhou 18.1
11 Mexico City 17.5
12 Tokyo 16.7
13 Mumbai Overall 13.4
14 Chennai 12.5
15 Jakarta 12.2
16 Chengdu 12.0
17 Washington, DC 11.9
18 Pune 11.9
19 Manhattan 11.7
20 Paris 11.0
21 Brussels 9.7
22 Berlin 9.5
23 Nashville 8.8
24 Munich 8.4
25 San Francisco 8.1
26 Ahmedabad 7.7
27 Charlotte 7.6
28 Los Angeles 7.4
RANK CITYCOMPLETIONS
(msf)2017 - 2019
29 Atlanta 7.3
30 Vienna 6.8
31 Chicago 6.5
32 Denver 6.4
33 Seattle 6.2
34 Hong Kong 5.9
35 Bucharest 5.7
36 Luxembourg 5.6
37 Kolkata 5.6
38 Seoul 5.5
39 Silicon Valley 5.3
40 Baltimore 4.7
41 Prague 4.6
42 Stockholm 4.5
43 Phoenix 4.4
44 Frankfurt 4.1
45 Warsaw 4.1
46 Dublin 3.8
47 Singapore 3.8
48 Melbourne 3.6
49 Raleigh/Durham 3.5
50 Orange County 3.4
51 Taipei City 3.3
52 Boston 3.0
53 Philadelphia 3.0
54 Sydney 3.0
55 Toronto 2.9
56 Tampa 2.8
RANK CITYCOMPLETIONS
(msf)2017 - 2019
57 São Paulo 2.7
58 Houston 2.6
59 Kuala Lumpur 2.6
60 Calgary 2.4
61 Miami 2.3
62 Madrid 1.8
63 Rio de Janeiro 1.4
64 Orlando 1.3
65 Portland 1.3
66 Milan 1.3
67 Ho Chi Minh City 1.2
68 Amsterdam 1.2
69 Montreal 1.0
70 Lisbon 1.0
71 Sacramento 0.8
72 Brisbane 0.7
73 San Diego 0.6
74 Edmonton 0.6
75 Vancouver 0.6
76 Rome 0.5
77 Ottawa 0.4
78 Winnipeg 0.3
79 Bangkok 0.3
80 Oakland 0.3

50 / Cushman & Wakefield
AMERICAS EUROPE APACGLOBAL APPENDIXAPPENDIX
GLOBAL: AVERAGE ANNUAL RENT GROWTH FORECAST
RANK CITY *RENT GROWTH2017 - 2019
1 Hyderabad 8.2%
2 Seattle 6.8%
3 Singapore 6.8%
4 Toronto 6.6%
5 Winnipeg 6.4%
6 Madrid 4.8%
7 Raleigh/Durham 4.8%
8 Moscow 4.6%
9 Berlin 4.3%
10 Oakland 4.2%
11 Portland 4.2%
12 Stockholm 4.2%
13 Edmonton 4.0%
14 Bangkok 3.9%
15 Sydney 3.8%
16 Chicago 3.8%
17 Budapest 3.7%
18 Vancouver 3.7%
19 Orange County 3.6%
20 Philadelphia 3.6%
21 São Paulo 3.4%
22 Brisbane 3.3%
23 Silicon Valley 3.3%
RANK CITY *RENT GROWTH2017 - 2019
24 Houston 3.1%
25 Milan 2.9%
26 Tampa 2.9%
27 Dublin 2.8%
28 San Francisco 2.8%
29 Nashville 2.8%
30 Frankfurt 2.7%
31 Los Angeles 2.6%
32 Kolkata 2.6%
33 Oslo 2.5%
34 Washington, DC 2.4%
35 Denver 2.4%
36 Phoenix 2.2%
37 Manila 2.1%
38 Melbourne 2.1%
39 Chennai 2.0%
40 San Diego 2.0%
41 Manhattan 2.0%
42 Orlando 1.9%
43 Munich 1.9%
44 Ahmedabad 1.9%
45 Lisbon 1.7%
46 Miami 1.6%
RANK CITY *RENT GROWTH2017 - 2019
47 Beijing 1.5%
48 Sacramento 1.5%
49 Dallas 1.5%
50 Shanghai 1.4%
51 Delhi-NCR 1.3%
52 Ottawa 1.3%
53 Brussels 1.2%
54 Baltimore 1.0%
55 Bucharest 0.9%
56 Mexico City 0.9%
57 Bengaluru 0.8%
58 Rome 0.8%
59 Luxembourg 0.7%
60 Guangzhou 0.6%
61 Zurich 0.5%
62 Montreal 0.4%
63 Amsterdam 0.4%
64 Hong Kong 0.3%
65 Atlanta 0.3%
66 Warsaw 0.0%
67 Copenhagen 0.0%
68 Charlotte -0.1%
69 Ho Chi Minh City -0.1%

cushmanwakefield.com / 51
RANK CITY *RENT GROWTH2017 - 2019
70 Taipei City -0.3%
71 Vienna -0.3%
72 Shenzhen -0.4%
73 Calgary -0.7%
74 Seoul -0.8%
75 Rio de Janeiro -0.8%
76 Pune -0.9%
77 Mumbai Overall -0.9%
78 Boston -1.1%
79 Paris -1.2%
80 Kuala Lumpur -1.4%
81 Prague -1.6%
82 Jakarta -1.7%
83 London -1.7%
84 Istanbul -2.5%
85 Tokyo -3.4%
*Average annual growth rate, CBD Class A

52 / Cushman & Wakefield
AMERICAS EUROPE APACGLOBAL APPENDIXAPPENDIX
GLOBAL: TOTAL OFFICE JOBS CREATED 2017-2019
RANK CITY 2017 - 2019 (000’s)
1 Beijing* 531.8
2 Shanghai* 454.5
3 Shenzhen* 305.9
4 Bangalore* 243.8
5 Guangzhou* 241.0
6 Delhi-NCR 220.6
7 Istanbul 157.5
8 São Paulo 142.3
9 Manila 139.4
10 Paris 119.4
11 Mexico City 109.3
12 New York City 99.4
13 Jakarta 96.3
14 Dallas/Fort Worth 92.7
15 Rio de Janeiro 86.8
16 London 78.3
17 Tokyo 71.3
18 Madrid 70.0
19 Hong Kong 69.1
20 Los Angeles 68.8
21 Ho Chi Minh City 63.3
22 Atlanta 61.0
23 Chicago 58.2
24 Phoenix 47.6
RANK CITY 2017 - 2019 (000’s)
25 Washington, DC Metro 46.7
26 Houston 46.7
27 Singapore 46.0
28 Seoul 45.0
29 Budapest 44.5
30 Milan 43.5
31 Miami 40.5
32 Boston 40.2
33 Rome 38.1
34 Seattle 37.8
35 San Francisco 34.9
36 Orlando 31.1
37 Munich 31.0
38 Detroit 30.0
39 Warsaw 29.6
40 Philadelphia 29.6
41 Tampa 29.1
42 Berlin 28.1
43 Amsterdam 25.5
44 Brisbane 25.0
45 Charlotte 24.9
46 Melbourne 22.9
47 Minneapolis 22.7
48 Portland 22.0
RANK CITY 2017 - 2019 (000’s)
49 Austin 21.7
50 Zurich 21.4
51 Sydney 20.8
52 Denver 20.6
53 Lisbon 20.1
54 San Diego 19.5
55 Nashville 19.1
56 Kuala Lumpur 19.0
57 Stockholm 18.9
58 Silicon Valley 18.9
59 Brussels 18.1
60 Las Vegas 17.9
61 Bangkok 17.6
62 Vancouver 17.5
63 Kansas City 17.5
64 Bucharest 17.4
65 Baltimore 17.0
66 Copenhagen 16.9
67 Raleigh/Durham 20.4
68 Cincinnati 15.7
69 Toronto 15.6
70 Cleveland 15.2
71 Moscow 15.2
72 San Antonio 15.1
cushmanwakefield.com / 53
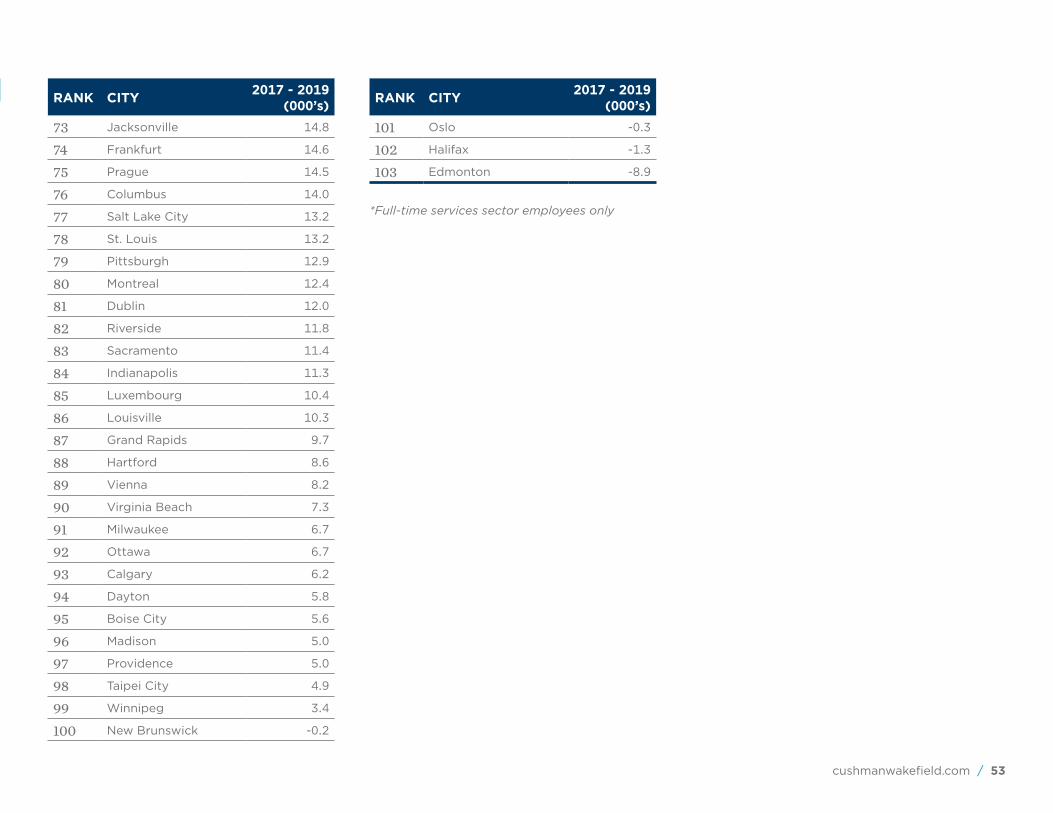
RANK CITY 2017 - 2019 (000’s)
73 Jacksonville 14.8
74 Frankfurt 14.6
75 Prague 14.5
76 Columbus 14.0
77 Salt Lake City 13.2
78 St. Louis 13.2
79 Pittsburgh 12.9
80 Montreal 12.4
81 Dublin 12.0
82 Riverside 11.8
83 Sacramento 11.4
84 Indianapolis 11.3
85 Luxembourg 10.4
86 Louisville 10.3
87 Grand Rapids 9.7
88 Hartford 8.6
89 Vienna 8.2
90 Virginia Beach 7.3
91 Milwaukee 6.7
92 Ottawa 6.7
93 Calgary 6.2
94 Dayton 5.8
95 Boise City 5.6
96 Madison 5.0
97 Providence 5.0
98 Taipei City 4.9
99 Winnipeg 3.4
100 New Brunswick -0.2
*Full-time services sector employees only
RANK CITY 2017 - 2019 (000’s)
101 Oslo -0.3
102 Halifax -1.3
103 Edmonton -8.9

54 / Cushman & Wakefield
AMERICAS EUROPE APACGLOBAL APPENDIXAPPENDIX
AMERICAS: VACANCY FORECAST FOR 2019
RANK CITY 2019
1 Toronto 3.9%
2 Vancouver 6.3%
3 Orlando 7.2%
4 Ottawa 7.3%
5 Winnipeg 7.4%
6 Raleigh/Durham 7.7%
7 Portland 8.6%
8 Boston 8.8%
9 Oakland 9.6%
10 San Diego 9.8%
11 Silicon Valley 10.0%
12 San Francisco 10.2%
13 Nashville 10.3%
14 Manhattan 10.4%
15 Orange County 10.7%
16 Philadelphia 10.7%
17 Charlotte 10.8%
18 Sacramento 11.3%
19 Montreal 11.9%
20 Tampa 11.9%
21 Seattle 12.4%
22 Miami 12.5%
23 Washington, DC 13.1%
RANK CITY 2019
24 Phoenix 13.4%
25 Los Angeles 13.8%
26 Baltimore 13.9%
27 Denver 14.9%
28 Chicago 15.0%
29 Mexico City 15.6%
30 Houston 17.7%
31 Atlanta 19.2%
32 Dallas 20.3%
33 Edmonton 20.9%
34 Calgary 21.4%
35 São Paulo 22.0%
36 Rio de Janeiro 36.7%
RANK CITY COMPLETIONS (msf)2017 - 2019
1 Dallas 20.5
2 Mexico City 17.5
3 Washington, DC 11.9
4 Manhattan 11.7
5 Nashville 8.8
6 San Francisco 8.1
7 Charlotte 7.6
8 Los Angeles 7.4
9 Atlanta 7.3
10 Chicago 6.5
11 Denver 6.4
12 Seattle 6.2
13 Silion Valley 5.3
14 Baltimore 4.7
15 Phoenix 4.4
16 Raleigh/Durham 3.5
17 Orange County 3.4
18 Boston 3.0
19 Philadelphia 3.0
20 Toronto 2.9
21 Tampa 2.8
22 São Paulo 2.7
*Most U.S. cities show overall vacancy rate
*Overall CBD vacancy rate for DC and LA
*Latin America and Canada markets are CBD Class A Vacancy Rates
AMERICAS: COMPLETIONS FORECAST 2017-2019

cushmanwakefield.com / 55
RANK CITY COMPLETIONS (msf)2017 - 2019
23 Houston 2.6
24 Calgary 2.4
25 Miami 2.3
26 Rio de Janeiro 1.4
27 Orlando 1.3
28 Portland 1.3
29 Montreal 1.0
30 Sacramento 0.8
31 San Diego 0.6
32 Edmonton 0.6
33 Vancouver 0.6
34 Ottawa 0.4
35 Winnipeg 0.3
36 Oakland 0.3
*Non-U.S. cities are CBD Class A demand/new supply. U.S. cities are overall market statistics.
RANK CITY *RENT GROWTH2017 - 2019
1 Seattle 6.8%
2 Toronto 6.6%
3 Winnipeg 6.4%
4 Raleigh/Durham 4.8%
5 Oakland 4.2%
6 Portland 4.2%
7 Edmonton 4.0%
8 Chicago 3.8%
9 Vancouver 3.7%
10 Orange County 3.6%
11 Philadelphia 3.6%
12 São Paulo 3.4%
13 Silicon Valley 3.3%
14 Houston 3.1%
15 Tampa 2.9%
16 San Francisco 2.8%
17 Nashville 2.8%
18 Los Angeles 2.6%
19 Washington, DC 2.4%
20 Denver 2.4%
21 Phoenix 2.2%
22 San Diego 2.0%
23 Manhattan 2.0%
24 Orlando 1.9%
25 Miami 1.6%
26 Sacramento 1.5%
AMERICAS: AVERAGE ANNUAL RENT GROWTH FORECAST
RANK CITY *RENT GROWTH2017 - 2019
27 Dallas 1.5%
28 Ottawa 1.3%
29 Baltimore 1.0%
30 Mexico City 0.8%
31 Montreal 0.4%
32 Atlanta 0.3%
33 Charlotte -0.1%
34 Calgary -0.7%
35 Rio de Janeiro -0.8%
36 Boston -1.1%
*Average annual growth rate, CBD Class A
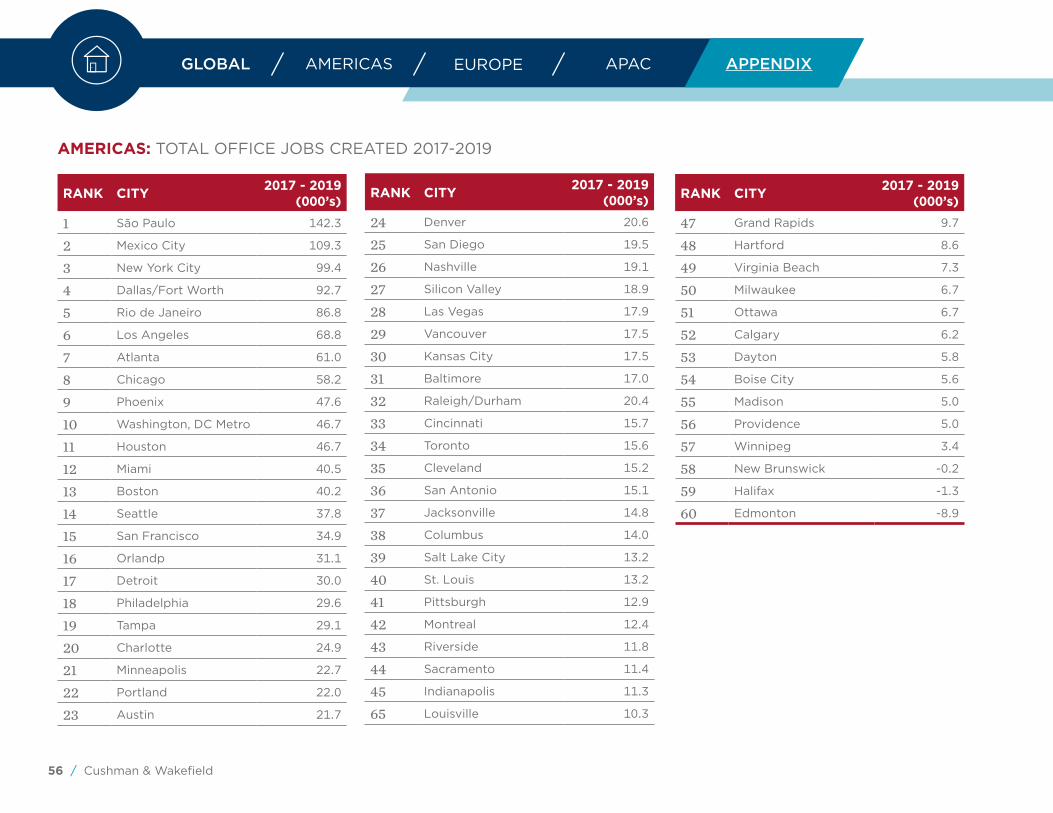
56 / Cushman & Wakefield
AMERICAS EUROPE APACGLOBAL APPENDIXAPPENDIX
AMERICAS: TOTAL OFFICE JOBS CREATED 2017-2019
RANK CITY 2017 - 2019 (000’s)
1 São Paulo 142.3
2 Mexico City 109.3
3 New York City 99.4
4 Dallas/Fort Worth 92.7
5 Rio de Janeiro 86.8
6 Los Angeles 68.8
7 Atlanta 61.0
8 Chicago 58.2
9 Phoenix 47.6
10 Washington, DC Metro 46.7
11 Houston 46.7
12 Miami 40.5
13 Boston 40.2
14 Seattle 37.8
15 San Francisco 34.9
16 Orlandp 31.1
17 Detroit 30.0
18 Philadelphia 29.6
19 Tampa 29.1
20 Charlotte 24.9
21 Minneapolis 22.7
22 Portland 22.0
23 Austin 21.7
RANK CITY 2017 - 2019 (000’s)
24 Denver 20.6
25 San Diego 19.5
26 Nashville 19.1
27 Silicon Valley 18.9
28 Las Vegas 17.9
29 Vancouver 17.5
30 Kansas City 17.5
31 Baltimore 17.0
32 Raleigh/Durham 20.4
33 Cincinnati 15.7
34 Toronto 15.6
35 Cleveland 15.2
36 San Antonio 15.1
37 Jacksonville 14.8
38 Columbus 14.0
39 Salt Lake City 13.2
40 St. Louis 13.2
41 Pittsburgh 12.9
42 Montreal 12.4
43 Riverside 11.8
44 Sacramento 11.4
45 Indianapolis 11.3
65 Louisville 10.3
RANK CITY 2017 - 2019 (000’s)
47 Grand Rapids 9.7
48 Hartford 8.6
49 Virginia Beach 7.3
50 Milwaukee 6.7
51 Ottawa 6.7
52 Calgary 6.2
53 Dayton 5.8
54 Boise City 5.6
55 Madison 5.0
56 Providence 5.0
57 Winnipeg 3.4
58 New Brunswick -0.2
59 Halifax -1.3
60 Edmonton -8.9

cushmanwakefield.com / 57
EUROPE: VACANCY FORECAST FOR 2019
RANK CITY 2019
1 Berlin 3.1%
2 Munich 3.3%
3 London 4.8%
4 Luxembourg 5.9%
5 Vienna 6.7%
6 Lisbon 8.0%
7 Paris 8.2%
8 Frankfurt 8.6%
9 Brussels 9.0%
10 Bucharest 9.7%
11 Stockholm 10.4%
12 Budapest 11.5%
13 Amsterdam 12.1%
14 Dublin 12.7%
15 Milan 12.8%
16 Rome 13.4%
17 Warsaw 14.5%
18 Madrid 14.5%
19 Prague 16.5%
RANK CITY COMPLETIONS (msf)2017 - 2019
1 London 19.9
2 Paris 11.0
3 Brussels 9.7
4 Berlin 9.5
5 Munich 8.4
6 Vienna 6.8
7 Bucharest 5.7
8 Luxembourg 5.6
9 Prague 4.6
10 Stockholm 4.5
11 Frankfurt 4.1
12 Warsaw 4.1
13 Dublin 3.8
14 Madrid 1.8
15 Milan 1.3
16 Amsterdam 1.2
17 Lisbon 1.0
18 Rome 0.5
EUROPE: COMPLETIONS FORECAST 2017-2019
RANK CITY *RENT GROWTH2017 - 2019
1 Madrid 4.8%
2 Moscow 4.6%
3 Berlin 4.3%
4 Stockholm 4.2%
5 Budapest 3.7%
6 Milan 2.9%
7 Dublin 2.8%
8 Frankfurt 2.7%
9 Oslo 2.4%
10 Munich 1.9%
11 Lisbon 1.7%
12 Brussels 1.2%
13 Bucharest 0.9%
14 Rome 0.8%
15 Luxembourg 0.7%
16 Zurich 0.4%
17 Amsterdam 0.4%
18 Warsaw 0.0%
19 Copenhagen 0.0%
20 Vienna -0.3%
21 Paris -1.2%
22 Prague -1.6%
23 London -1.7%
24 Istanbul -2.5%
EUROPE: AVERAGE ANNUAL RENT GROWTH FORECAST
*Average annual growth rate, Class A

58 / Cushman & Wakefield
AMERICAS EUROPE APACGLOBAL APPENDIXAPPENDIX
EUROPE: TOTAL OFFICE JOBS CREATED 2017-2019
RANK CITY 2017 - 2019 (000’s)
1 Istanbul 157.5
2 Paris 119.4
3 London 78.3
4 Madrid 70.0
5 Budapest 44.5
6 Milan 43.5
7 Rome 38.1
8 Munich 31.0
9 Warsaw 29.6
10 Berlin 28.1
11 Amsterdam 25.5
12 Zurich 21.4
13 Lisbon 20.1
14 Stockholm 18.9
15 Brussels 18.1
16 Bucharest 17.4
17 Copenhagen 16.9
18 Moscow 15.2
19 Frankfurt 14.6
20 Prague 14.5
21 Dublin 12.0
RANK CITY 2017 - 2019 (000’s)
22 Luxembourg 10.4
23 Vienna 8.2
24 Oslo -0.3
APAC: VACANCY FORECAST FOR 2019
RANK CITY 2019
1 Sydney 2.4%
2 Bengaluru 4.3%
3 Bangkok 4.5%
4 Tokyo 6.7%
5 Manila 6.9%
6 Melbourne 7.8%
7 Guangzhou 8.1%
8 Singapore 8.5%
9 Pune 10.3%
10 Taipei City 10.5%
11 Hyderabad 11.5%
12 Hong Kong 11.5%
13 Brisbane 11.6%
14 Seoul 12.6%
15 Kuala Lumpur 12.7%
16 Shanghai 13.2%
17 Chennai 15.6%
18 Beijing 16.8%
19 Ho Chi Minh City 17.6%
20 Mumbai Overall 18.8%
21 Mumbai Core 19.4%
22 Delhi-NCR 26.4%
23 Jakarta 28.5%
24 Shenzhen 32.3%
25 Kolkata 36.4%
26 Ahmedabad 53.6%

cushmanwakefield.com / 59
RANK CITY COMPLETIONS (msf)2017 - 2019
1 Beijing 69.7
2 Shenzhen 57.5
3 Shanghai 44.9
4 Manila 31.5
5 Bengaluru 31.2
6 Hyderabad 28.3
7 Delhi-NCR 18.4
8 Guangzhou 18.1
9 Tokyo 16.7
10 Mumbai Overall 13.4
11 Chennai 12.5
12 Jakarta 12.2
13 Chengdu 12.0
14 Pune 11.9
15 Ahmedabad 7.7
16 Hong Kong 5.9
17 Kolkata 5.6
18 Seoul 5.5
19 Singapore 3.8
20 Melbourne 3.6
21 Taipei City 3.3
22 Sydney 3.0
23 Kuala Lumpur 2.6
24 Ho Chi Minh City 1.2
25 Brisbane 0.7
26 Bangkok 0.3
APAC: COMPLETIONS FORECAST 2017-2019
RANK CITY *RENT GROWTH2017 - 2019
1 Hyderabad 8.2%
2 Singapore 6.8%
3 Bangkok 3.9%
4 Sydney 3.8%
5 Brisbane 3.3%
6 Kolkata 2.6%
7 Manila 2.1%
8 Melbourne 2.1%
9 Chennai 2.0%
10 Ahmedabad 1.9%
11 Beijing 1.5%
12 Shanghai 1.4%
13 Delhi-NCR 1.3%
14 Bengaluru 0.8%
15 Guangzhou 0.6%
16 Hong Kong 0.3%
17 Ho Chi Minh City -0.1%
18 Taipei City -0.3%
19 Shenzhen -0.4%
20 Seoul -0.8%
21 Pune -0.9%
22 Mumbai Overall -0.9%
23 Kuala Lumpur -1.4%
24 Jakarta -1.7%
25 Tokyo Prefecture -3.4%
APAC: AVERAGE ANNUAL RENT GROWTH FORECAST
*Average annual growth rate, Class A
APAC: TOTAL OFFICE JOBS CREATED 2017-2019
RANK CITY 2017 - 2019 (000’s)
1 Beijing* 531.8
2 Shanghai* 454.5
3 Shenzhen* 305.9
4 Bangalore 243.8
5 Guangzhou* 241.0
6 Delhi-NCR 220.6
7 Manila 139.4
8 Jakarta 96.3
9 Tokyo 71.3
10 Hong Kong 69.1
11 Ho Chi Minh City 63.3
12 Singapore 46.0
13 Seoul 45.0
14 Brisbane 25.0
15 Melbourne 22.9
16 Sydney 20.8
17 Kuala Lumpur 19.0
18 Bangkok 17.6
19 Taipei City 4.9
*Full-time services sector employees only

AMERICAS EUROPE APACGLOBAL APPENDIX
Report Contributors
KEVIN THORPEChief Economist, Global Head of Research
Americas
REBECCA ROCKEYEconomist, Head of Forecasting Americas
STUART BARRONNational Director of ResearchCanada
JOSE LUIS RUBIMarket Research ManagerMexico
GUSTAVO GARCIAHead of Market Research and Business IntelligenceSouth America

APAC
SIGRID G. ZIALCITAManaging Director, ResearchAsia Pacific
KAPIL KANALA, AITP Associate Director, ResearchAsia Pacific
WYAI KAY LAIAssociate Director, ResearchAsia Pacific
CATHERINE CHENHead of Forecasting & Capital Markets ResearchGreater China
JAMES SHEPHERD, MRICS Managing Director, Research Greater China
EMEA
MARK UNSWORTH Head of ForecastingEMEA
ELISABETH TRONIHead of ResearchEMEA
cushmanwakefield.com / 61
GREATER CHINA

cushmanwakefield.comCopyright © 2017 Cushman & Wakefield. All rights reserved. The information contained within this report is gathered from multiple sources considered to be reliable. The information may contain errors or omissions and is presented without any warranty or representations as to its accuracy.
Cushman & Wakefield is a leading global realestate services firm that helps clients transformthe way people work, shop, and live.
Our 45,000 employees in more than 70 countries help occupiers and investors optimize the value of their real estate by combining our global perspective and deep local knowledge with an impressive platform of real estate solutions. Cushman & Wakefield is among the largest commercial real estate services firms with revenue of $6 billion across core services of agency leasing, asset services, capital markets, facility services (C&W Services), global occupier services, investment & asset management (DTZ Investors), project & development services, tenant representation, and valuation & advisory. 2017 marks the 100-year anniversary of the Cushman & Wakefield brand. 100 years of taking our clients’ ideas and putting them into action. To learn more, visit www.cushwakecentennial.com, www.cushmanwakefield.com or follow @CushWake on Twitter.