are up to the challenge
TRANSCRIPT

Weare Up to
the Challenge
HITA
CH
I Annual R
epo
rt 2009
Annual Report 2009Year ended March 31, 2009

Cautionary Statement Certain statements found in this document may constitute “forward-looking statements” as defined in the U.S. Private Securities Litigation Reform Act of 1995. Such “forward-looking statements” reflect management’s current views with respect to certain future events and financial performance and include any statement that does not directly relate to any historical or current fact. Words such as “anticipate,” “believe,” “expect,” “estimate,” “forecast,” “intend,” “plan,” “project” and similar expressions which indicate future events and trends may identify “forward-looking statements.” Such statements are based on currently available information and are subject to various risks and uncertainties that could cause actual results to differ materially from those projected or implied in the “forward-looking statements” and from historical trends. Certain “forward-looking statements” are based upon current assumptions of future events which may not prove to be accurate. Undue reliance should not be placed on “forward-looking statements,” as such statements speak only as of the date of this document.
Factors that could cause actual results to differ materially from those projected or implied in any “forward-looking statement” and from historical trends include, but are not limited to:• economicconditionsincludingconsumerspendingandplantandequipmentinvestmentsinHitachi’smajormarkets,particularlyJapan,Asia,theUnitedStatesandEurope,aswellaslevelsofdemandinthemajorindustrialsectorswhichHitachiserves,including,withoutlimitation,theinformation,electronics,automotive,constructionandfinancialsectors;
• fluctuationsinproductdemandandindustrycapacity,particularlyintheInformation&TelecommunicationSystemssegment,ElectronicDevicessegmentandDigitalMedia&ConsumerProductssegment;• increasedcommoditizationofinformationtechnologyproductsanddigitalmediarelatedproductsandintensifyingpricecompetitionforsuchproducts,particularlyintheInformation&TelecommunicationSystemssegment,ElectronicDevicessegmentandDigitalMedia&ConsumerProductssegment;
• uncertaintyastoHitachi’sabilitytocontinuetodevelopandmarketproductsthatincorporatenewtechnologyonatimelyandcost-effectivebasisandtoachievemarketacceptanceforsuchproducts;• rapidtechnologicalinnovation,particularlyintheInformation&TelecommunicationSystemssegment,ElectronicDevicessegmentandDigitalMedia&ConsumerProductssegment;• exchangeratefluctuationfortheyenandothercurrenciesinwhichHitachimakessignificantsalesorinwhichHitachi’sassetsandliabilitiesaredenominated,particularlyagainsttheU.S.dollarandtheeuro;
• fluctuationsinthepriceofrawmaterialsincluding,withoutlimitation,petroleumandothermaterials,suchascopper,steel,aluminumandsyntheticresins;• uncertaintyastoHitachi’sabilitytoimplementmeasurestoreducethepotentialnegativeimpactoffluctuationsinproductdemand,exchangerateand/orthepriceofrawmaterials;• generalsocio-economicandpoliticalconditionsandtheregulatoryandtradeenvironmentofHitachi’smajormarkets,particularlyJapan,Asia,theUnitedStatesandEurope,including,withoutlimitation,directorindirectrestrictionsbyothernationsonimports,ordifferencesincommercialandbusinesscustomsincluding,withoutlimitation,contracttermsandconditionsandlaborrelations;
• uncertaintyastoHitachi’saccessto,orabilitytoprotect,certainintellectualpropertyrights,particularlythoserelatedtoelectronicsanddataprocessingtechnologies;• uncertaintyastotheoutcomeoflitigation,regulatoryinvestigationsandotherlegalproceedingsofwhichtheCompany,itssubsidiariesoritsequitymethodaffiliateshavebecomeormaybecomeparties;• thepossibilityofincurringexpensesresultingfromanydefectsinproductsorservicesofHitachi;• uncertaintyastothesuccessofrestructuringeffortstoimprovemanagementefficiencyandtostrengthencompetitiveness;• uncertaintyastothesuccessofalliancesuponwhichHitachidepends,someofwhichHitachimaynotcontrol,withothercorporationsinthedesignanddevelopmentofcertainkeyproducts;• uncertaintyastoHitachi’sabilitytoaccess,oraccessonfavorableterms,liquidityorlong-termfinancing;and• uncertaintyastogeneralmarketpricelevelsforequitysecuritiesinJapan,declinesinwhichmayrequireHitachitowritedownequitysecuritiesitholds.
Thefactorslistedabovearenotall-inclusiveandareinadditiontootherfactorscontainedinHitachi’speriodicfilingswiththeU.S.SecuritiesandExchangeCommissionandinothermaterialspublishedbyHitachi.
Corporate Social Responsibility ReportPleaserefertotheHitachiGroupCorporateSocialResponsibilityReport2009forinformationonHitachi’sCSRactivities.HitachihasalsoproducedtheHitachiGroupCorporateSocialResponsibilityReport2009Digest,acompilationofthemainpoints,particularlytheactivitiesthatHitachiisfocusingon.
Environmental Sustainability ReportPleaserefertotheHitachiGroupEnvironmentalSustainability Report 2009 for information concerning theHitachiGroup’senvironmentalprotectionmea-sures and policy, details of fiscal 2008 activities and data, as well as future plans and targets.
R&D and Intellectual Property ReportPleaserefertotheR&DandIntellectualPropertyReport2009forinformationontheHitachiGroup’sR&Dorganizationandapproach,thestatusofintellectualproperty(IP)stemmingfromR&D,andthe IP exploitation policy, etc.
Hitachi Financial HighlightsPleaserefertoHitachiFinancialHighlights2009for financial data for the past 10 years.
ContentS
2 to our ShareholderS
4 reSurreCting a Strong hitaChi
10 highlightS of the Year, Segment information
12 review of operationS
12 Information & Telecommunication Systems14 Electronic Devices16 Power & Industrial Systems18 Digital Media & Consumer Products20 High Functional Materials & Components22 Logistics, Services & Others23 Financial Services
24 reSearCh and development
25 intelleCtual propertY
26 Corporate SoCial reSponSibilitY
28 Corporate governanCe
30 board of direCtorS
31 exeCutive offiCerS
33 finanCial SeCtion
96 five-Year SummarY
97 Corporate data

Hitachi wi l l mark i ts centennia l of i ts founding in 2010.
As we approach th is mi lestone and look beyond,
we wi l l cont inue to develop the Socia l Innovat ion Business g lobal ly
by focusing on the creat ion of env i ronmenta l va lue unique to Hi tachi .
We wi l l promote business strongly and cont inuously in order to ensure steady growth moving forward.
Hi tachi wi l l t ru ly br ing to f ru i t ion i ts corporate statement “Inspire the Next”
by combin ing “the col lect ive strengths” of the Hi tachi Group’s wide range of businesses,
technologies and expert ise
to generate opt imal va lue for the d iverse issues among customers and society at large.
1Hitachi, Ltd.Annual Report 2009

The world economy faced unprecedented difficulties
in the past fiscal year as the financial crisis triggered
by the U.S. subprime loan problem threw the econ-
omy into disarray in the latter part of 2008.
The market shockwaves spread to the Hitachi
Group’s businesses, causing a large drop in demand
in auto-related and other businesses that were viewed
as growth fields. The impacts were particularly acute
during the second half of the fiscal year. Even now as I
write this letter, the outlook is unclear, with concerns
about further restrictions on lending, the risk of shrink-
ing IT investment and persistent sluggishness in con-
sumer spending. The picture for the economic
environment is far from rosy as things stand today.
Under these bleak conditions, Hitachi saw consoli-
dated revenues fall 11% from the previous fiscal year,
to ¥10,000.3 billion, and operating income fell 63%,
to ¥127.1 billion. Furthermore, we posted a net loss of
¥787.3 billion, ¥729.2 billion worse than our fiscal
2007 result. One of the main reasons for this wider
loss was business structure reform expenses in flat-
panel TV, automotive systems and certain other busi-
nesses, including impairment losses relating to fixed
assets. Higher net equity in losses of the affiliated
semiconductor company and the write-off of deferred
tax assets were among other factors that also brought
about this bottom-line result.
To our ShareholderS
2 Hitachi, Ltd.Annual Report 2009

In terms of our financial condition, the large net
loss significantly eroded stockholders’ equity. As a
result, the debt-to-equity ratio (interest-bearing debt/
(minority interests + stockholders’ equity)) worsened
by 0.53 points from March 31, 2008 to 1.29 at March
31, 2009. The annual cash dividend per share appli-
cable to fiscal 2008 was ¥3.0, as we decided to
suspend the year-end dividend.
I deeply regret that we were unable to live up
to shareholders’ expectations with our fiscal
2008 performance.
We have positioned fiscal 2009 as a year to make
a fresh start at the Hitachi Group. Hitachi has many
years of experience and know-how in the Social
Innovation Business, which includes social infrastruc-
ture and information infrastructure. Indeed, this is one
of the sources of our strength and we will therefore
concentrate business resources on the Social Inno-
vation Business going forward. In this way, we will
proceed with efforts to transform Hitachi into a com-
pany that can generate stable profit growth.
We will pursue further growth in the Social Innova-
tion Business as a matter of great importance. This
field includes such areas as information and telecom-
munication systems, power systems, environmental,
industrial and transportation systems, and urban
systems. Concurrent with these growth-driving steps,
we will quickly improve and drastically reform busi-
nesses currently making losses. Key components
and materials that underpin all businesses is another
focus. We will concentrate resources here on growth
fields, including the Social Innovation Business.
Despite the difficult economic times, social infrastruc-
ture continues to be built around the world. By play-
ing a greater role in building this infrastructure, we
aim to create a stable profit structure. We are deter-
mined to strengthen the core domains of the Social
Innovation Business, including by restructuring Group
companies operating in these domains.
Eyeing growth several years ahead, we will con-
tinue efforts to differentiate Hitachi on the global
stage through the ongoing combination of busi-
nesses and technologies in the Social Innovation
Business. Three goals are key in this context: fusing
information and telecommunication systems and
power and industrial systems, transforming into a
truly global company, and expanding environmental
businesses. Achieving these goals should create a
more stable profit base and lead to further growth. In
short, the Hitachi Group is seeking to create a new
business model that leverages its unique capabilities
and takes into consideration the environment to help
build safe and highly reliable infrastructure around the
world. We are committed to meeting your expecta-
tions by steadily executing this vision.
The Hitachi Group’s history attests to the fact
that it has not always been plain sailing over the
years. Successive generations of management
have had to contend with many different crises.
But history also shows that we have surmounted
all of these crises with the trust of customers and
our founding spirit encapsulated by the words
“Harmony,” “Sincerity” and “Pioneering spirit,” and
gone on to grow immensely. We view the current
management crisis with a positive mindset and will
draw on our pioneering spirit again to drive growth.
Takashi KawamuraRepresentative Executive Officer, Chairman, President and Chief Executive Officer
3Hitachi, Ltd.Annual Report 2009

The world is in the midst of major structural changes,
both socially and economically. These changes are
spawning new demand for the construction of infra-
structure with a lower environmental footprint. And I
think this demand will come not only from emerging
economies that are working to build infrastructure,
but also industrialized economies. Amid this drastic
change and the subsequent recovery in the economic
environment since the latter half of 2008, many coun-
tries have to invest heavily in environment-related
fields as part of massive economic measures.
Meeting these market needs will require further
technological advances as well as the establish-
ment and enhancement of infrastructure fused with
information and telecommunications technologies.
I believe this era of change is a good opportunity for
us to take the lead in the world by displaying our
capabilities. This is because Hitachi boasts global
experience in power and industrial systems and
environmental systems, and cutting-edge information
and telecommunications technologies. I am commit-
ted to creating a strong company that can support
the demands of this new era. That’s why we decided
to focus more on the Social Innovation Business.
The Social Innovation Business centers on fields
that Hitachi has always excelled in. These include
information and telecommunication systems, power
systems, environmental, industrial and transportation
systems, and social and urban systems. And we
Greater Focus on the Social Innovation Business
reSurrecTInG a STronG hITachI
The mission entrusted to me when I was appointed Chairman, President and Chief Executive Officer of Hitachi, Ltd. was to build a new foundation for Hitachi for future growth. First, I will review Hitachi’s business approach as part of the process of rebuilding our business portfolio and optimizing our organization. This is the way that we will transform the company, so that it is able to steadily generate stable profit. To achieve this, I will not hesitate to implement bold structure reforms of our business including each business division and Group companies.
Hitachi faces extremely difficult conditions at present. However, we will draw on the fundamental strengths built up over the past 100 or so years as well as the strong will and spirit of challenge of each and every employee, to grow going forward. I am determined to lead from the front to accomplish my mission and thereby meet your expectations.
In order for Hitachi to capitalize fully on its strengths, we plan to focus more than ever on the Social
Innovation Business. The Social Innovation Business is supported by highly reliable and highly
efficient information and telecommunications technology and by social infrastructure technology,
which I see as an unrivaled strength and a core competency for Hitachi.
Takashi KawamuraRepresentative Executive Officer, Chairman,President and Chief Executive Officer
4 Hitachi, Ltd.Annual Report 2009

can use our experiences and expertise in these
business areas to grow them more as well as to
create entirely new businesses. I’m convinced our
Social Innovation Business is a strength that no
other company can match.
In concentrating more on the Social Innovation
Business, we intend to strategically allocate R&D,
human and other resources to these fields and the
key devices that support them. Our R&D capabilities,
which underpin MONOZUKURI (manufacturing), and
our ability to integrate systems that interface with
customers are major strengths that enable us to
capitalize on our collective capabilities. Refocusing on
what we have always done well in the past should
spur our growth in the future.
We intend to place even greater emphasis on
the Social Innovation Business in three key areas:
fusing information and telecommunication systems
and power and industrial systems; transforming into
a truly global company; and expanding environmen-
tal businesses. The goal is to build a more stable
profit structure.
Fusing the Information and Telecommunication Systems and the Power and Industrial SystemsI intend to utilize the project management and system
integration expertise we have built in our information
and telecommunication systems business for large-
scale infrastructure projects, including power genera-
tion and railways. At the same time, we will leverage
our global industrial system operations as a spring-
board for developing worldwide our information and
telecommunication systems business, which includes
eco-friendly data centers.
Moreover, we will create new added value by
promoting the advanced development of smart grid
systems, which are expected to be in greater
demand, by fusing power generation and control
system technologies.
Transforming Into a Truly Global CompanyOver the past few years, we have substantially
increased our power plant and transportation system
operations, and we expect to expand overseas in
these areas going forward. These large-scale over-
seas projects harbor enormous potential, despite the
fact that the business risks are not insignificant.
The information and telecommunication systems
business is one of Hitachi’s core businesses. But
while the business continues to grow steadily in
Japan, global development of this business will be an
issue for us to address going forward.
Looking ahead, in order to engineer a transforma-
tion into a truly global company, in addition to pursuing
business expansion overseas, we must team up with
local partners, use personnel familiar with regional
conditions and develop more locally based operations.
Expanding Environmental BusinessesWe also plan to accelerate the development of busi-
nesses that offer environmental and energy-saving
solutions based on our storehouse of technologies.
There are two main pillars to this drive. One is what
we call “green mobility,” namely, railway systems,
automotive systems, logistics solutions and other
systems and solutions that lower environmental
impact. The second pillar is nuclear power generation,
highly efficient coal-fired thermal power generation,
smart grids and renewable energy and eco-friendly
data centers. We will also strengthen key devices
such as high-performance motors and inverters, and
highly reliable industrial- and automotive-use lithium-ion
rechargeable batteries, where we expect to capture
significant synergies with the Social Innovation Busi-
ness and in environmental and energy-saving fields. By
strengthening these key devices, we aim to differentiate
and expand our environment-related businesses. This
will also help us to achieve the goal set forth in our
“Environmental Vision 2025” of reducing CO2 emissions
by 100 million tons by 2025 through Hitachi products
and services. Furthermore, we intend to make all Hitachi
Group products Eco-Products by fiscal 2025, by vigor-
ously pursuing product development based on the
Assessment for DFE (Design for Environment) system.
5Hitachi, Ltd.Annual Report 2009

reSurrecTInG a STronG hITachI
Strengthening Initiatives in Key FieldsIn order to accelerate the pace of our structural reforms, five supervisory offices, each spearheaded by
an executive vice president, will take the lead in business operations.
A number of elements are essential to reestablish
Hitachi as a high-profit company: united manage-
ment, faster structural reforms and global develop-
ment, optimization of resources and stronger cost
competitiveness on a global basis. Since April 2009,
we have been implementing initiatives in these areas,
spearheaded by five executive vice presidents.
1. Supervisory Office for Management Reforms
(General Manager: Takashi Kawamura,
Chairman, President and CEO
Deputy General Manager: Takashi Miyoshi, EVP)
This office will implement business structure reforms
and structural reforms of group management. We
aim to resurrect a strong Hitachi by optimizing the
business portfolio and channeling business resources
to key fields.
2. Supervisory Office for Sales and Promotion
(General Manager: Kazuhiro Mori, EVP)
This office aims to expand orders and improve oper-
ating cash flows in all business fields based on a
stronger market-driven approach on a global scale. In
this way, we will build a globally competitive sales and
marketing structure.
3. Supervisory Office for Overseas Plant
Construction Business
(General Manager: Hiroaki Nakanishi, EVP)
This office aims to create a stable profit structure for
significant projects overseas by rigorously managing
large overseas projects such as nuclear power plants
in the U.S., power systems in the Near and Middle
East and large-scale railway systems, as well as by
cooperating with local partners and bolstering engi-
neering procurement, among others.
4. Supervisory Office for Business Infrastructure
(General Manager: Takashi Hatchoji, EVP)
This office will build even greater trust in Hitachi with
customers and all other stakeholders by strengthen-
ing the management base and risk responsiveness
through reforms in areas such as quality assurance,
the environment, manufacturing, purchasing, IT and
Japanese and global human resources.
5. Supervisory Office for Business Coordination
(General Manager: Naoya Takahashi, EVP)
This office will strengthen the Social Innovation Busi-
ness by fusing information and telecommunication
systems and power systems and industrial systems,
as well as by upgrading the role of research divisions
that support these businesses. In specific terms, we
will look at developing the eco-friendly green data
center business, railway information systems busi-
ness and smart grid-related businesses, among other
areas. By promoting these businesses, Hitachi will
drive the 21st century as an age of the environment,
information and energy.
6 Hitachi, Ltd.Annual Report 2009
optimizing Business resourcesIn the course of concentrating on the Social Innovation Business, we will review the relationship with
Group companies and optimize the organization, with the goal of maximizing Group synergies.
Hitachi aims to establish a more stable profit base by
strengthening relationships within the Group in informa-
tion and telecommunication systems, power systems,
environmental, industrial and transportation systems,
and social and urban systems, which are at the core of
the Social Innovation Business, as well as the key
devices and components that support them.
Hitachi has taken steps to rebuild its business
portfolio to strengthen the Social Innovation Business.
For example, we established a DRAM joint venture
with NEC Corporation, and joint ventures with
Mitsubishi Electric Corporation for system LSIs and
with Casio Computer Co., Ltd. for mobile phones.
Other structural reform measures have included
transferring the printer business to Ricoh Co., Ltd.,
exiting the consumer PC business, and initiating
collaborative creation with Canon Inc. and Panasonic
Corporation in LCD panels.
Furthermore, in July 2009 we split off the Consumer
Business Group, which is engaged in the digital
home appliances business, and the Automotive
Systems Group, which is engaged in the automotive
related business, and established them as wholly
owned subsidiaries. In addition to promoting fast
decision-making and responsive business operations,
these corporate separations should strengthen
competitiveness through greater cooperation with
other companies. In another move in July 2009,
Hitachi merged wholly owned subsidiary Hitachi
Communication Technologies, Ltd. with the aim of
strengthening the networking business, which is posi-
tioned as an important area in the Social Innovation
Business. We are also currently in negotiations to
integrate business operations at Renesas Technology
Corp. and NEC Electronics Corporation.
To accelerate these moves with an even stronger
resolve, at the end of July 2009 we announced plans
to convert five publicly listed companies into wholly
owned subsidiaries. The five companies are Hitachi
Information Systems, Ltd., Hitachi Software
Engineering Co., Ltd., Hitachi Systems & Services,
Ltd., Hitachi Plant Technologies, Ltd. and Hitachi
Maxell, Ltd. The aim is to improve competitiveness
through the pursuit of greater synergies across the
Hitachi Group.
By steadily executing these initiatives, I believe
that we can optimize the organization of Hitachi as a
whole and maximize Group synergies.
7Hitachi, Ltd.Annual Report 2009

reSurrecTInG a STronG hITachI
an In-house company SystemTo further clarify business unit responsibility and authority, business units will be treated in the same
way as Group companies and held accountable individually for their earnings. Each Group company
has grown driven by independence and responsiveness. Now we want to instill this throughout the
entire company. Besides accelerating decision-making within the Group, this move should enable Head
Office to optimally allocate business resources.
Hitachi has adopted the in-house company system
to further reinforce its operating base. Specifically, we
will establish “companies” as virtual companies inside
Hitachi with the same independence and responsive-
ness as Group companies. Hitachi’s Group manage-
ment structure will thus center on approximately 40
companies, with these virtual companies and Group
companies positioned and managed in parallel. This
should establish a high profit structure across the
entire Hitachi Group and create Group synergies.
This will also further clarify Hitachi’s position as a
business holding company whose role is to leverage
the advantages of owning these businesses itself to
enhance the value of the Group as a whole.
Hitachi, Ltd. (Business Holding Company)
Management support functions:Structural reforms, Optimized allocation of Group resources
Use of common Group resources:R&D, Sales, Human Resource, Manufacturing Technologies Procurements, IT and others
Group Corporate
Seven Companies• Information &
Telecommunication System Company
• Power Systems Company• Industrial & Social
Infrastructure Systems Company
• Information & Control Systems Company
• Urban Planning and Development Systems Company
• Battery Systems Company• Defense Systems Company
Major Subsidiaries (Group companies)
Continue to implement the most appropriate business structure reforms along with other reforms aimed improving holistic
strengthen of the social innovation business as Hitachi group.
Enhance Group Consolidated Management
Approximately 40 “Companies”
8 Hitachi, Ltd.Annual Report 2009

Strengthening FinancesHitachi aims to create a business base that can generate earnings even when demand is lackluster by
cutting fixed expenses and costs on a Group-wide basis and improving business segment earnings.
Furthermore, Hitachi will continue to monitor improvements in cash flows and asset efficiency as
important management indicators as it works to build a robust financial base and steadily improve
net income and its balance sheet. The Company’s overriding goal is to be soon once again known for
its financial strength.
At the end of March 2009, stockholders’ equity stood
at ¥1,049.9 billion, a decrease of ¥1,120.6 billion
from a year earlier due to the recording of the biggest
consolidated net loss in our history. As a result, the
stockholders’ equity ratio dropped 9.4 points to 11.2%
year over year. This erosion in the strength of our
balance sheet has caused considerable concern to all
stakeholders, and strengthening our financial position
as soon as we can is of the utmost importance.
To improve our financial strength, we must restore
our earnings power. We plan to do this by focusing
more on the Social Innovation Business, and quickly
improving the profitability and undertaking fundamen-
tal reviews of loss-making businesses. First, though,
we are rigorously paring fixed expenses and costs.
By adjusting our workforce and withdrawing from
unprofitable businesses, among other actions, we
are looking to cut fixed expenses by ¥200.0 billion
compared with fiscal 2008, thereby creating a profit
structure appropriate for the contracted market.
Furthermore, by making greater use of materials from
overseas and in other ways, we plan to cut procure-
ment costs by approximately ¥300.0 billion com-
pared with fiscal 2008. In terms of cash flows, in
addition to strictly selecting capital expenditures, we
are reducing inventories and expediting the collection
of accounts receivable, as we work to improve asset
efficiency and generate cash.
Fiscal 2009 is an important year for establishing a
resilient base, so that we can hold our ground and
then go forward from there. The management team is
firmly resolved to reforming Hitachi. We want to meet
your expectations with a solid profit achieved by
steadily executing our various reforms in fiscal 2010,
which is our centenary.
9Hitachi, Ltd.Annual Report 2009

hIGhlIGhTS oF The YearHitachi, Ltd. and Subsidiaries
Years ended March 31, 2009, 2008 and 2007
SeGmenT InFormaTIon (Year ended March 31, 2009)
Industry segments (millions of yen)
Information & Telecommunication Systems
Revenues ¥2,594,450
Operating Income ¥176,629
Consolidated Revenues (billions of yen)
¥10,000
23%
10%
11%
9%4%
14%
29%
Electronic Devices
Revenues ¥1,151,066
Operating Income ¥27,322
Power & Industrial Systems
Revenues ¥3,310,544
Operating Income ¥24,245
Digital Media & Consumer Products
Revenues ¥1,261,501
Operating Loss ¥(105,563)
High Functional Materials & Components
Revenues ¥1,556,886
Operating Income ¥27,777
Logistics, Services & Others
Revenues ¥1,089,971
Operating Income ¥23,063
Financial Services
Revenues ¥412,040
Operating Income ¥10,210
10 Hitachi, Ltd.Annual Report 2009
Millions of yenMillions of
U.S. dollars2009 2008 2007 2009
For the year: Revenues . . . . . . . . . . . . . . . . . . . . . . . . . . . . . . . . . . . . . . . ¥10,000,369 ¥11,226,735 ¥10,247,903 $102,045 Operating income . . . . . . . . . . . . . . . . . . . . . . . . . . . . . . . . . 127,146 345,516 182,512 1,297 Net loss . . . . . . . . . . . . . . . . . . . . . . . . . . . . . . . . . . . . . . . . (787,337) (58,125) (32,799) (8,034) Cash dividends declared . . . . . . . . . . . . . . . . . . . . . . . . . . . . 9,971 19,947 19,974 102 Capital investment (Property, plant and equipment) . . . . . . . . 788,466 969,087 1,048,572 8,046 Depreciation (Property, plant and equipment) . . . . . . . . . . . . 478,759 541,470 472,175 4,885 R&D expenditures . . . . . . . . . . . . . . . . . . . . . . . . . . . . . . . . 416,517 428,171 412,534 4,250
At year-end: Total assets . . . . . . . . . . . . . . . . . . . . . . . . . . . . . . . . . . . . . . ¥ 9,403,709 ¥10,530,847 ¥10,644,259 $ 95,956 Stockholders’ equity . . . . . . . . . . . . . . . . . . . . . . . . . . . . . . . 1,049,951 2,170,612 2,442,797 10,714 Number of employees . . . . . . . . . . . . . . . . . . . . . . . . . . . . . 400,129 389,752 384,444 –
Yen U.S. dollars
Per share data: Net loss: Basic . . . . . . . . . . . . . . . . . . . . . . . . . . . . . . . . . . . . . . . . . ¥(236.86) ¥ (17.48) ¥ (9.84) $(2.42) Diluted . . . . . . . . . . . . . . . . . . . . . . . . . . . . . . . . . . . . . . . . (236.87) (17.77) (9.87) (2.42) Net loss per ADS (representing 10 shares): Basic . . . . . . . . . . . . . . . . . . . . . . . . . . . . . . . . . . . . . . . . . (2,369) (175) (98) (24.17) Diluted . . . . . . . . . . . . . . . . . . . . . . . . . . . . . . . . . . . . . . . . (2,369) (178) (99) (24.17) Cash dividends declared . . . . . . . . . . . . . . . . . . . . . . . . . . . . 3.0 6.0 6.0 0.03 Cash dividends declared per ADS (representing 10 shares) . . . 30 60 60 0.31 Stockholders’ equity . . . . . . . . . . . . . . . . . . . . . . . . . . . . . . . 315.86 652.95 734.66 3.22

11Hitachi, Ltd.Annual Report 2009
Geographic SegmentsMillions of yen
Millions of U.S. dollars
2009 2008 2007 2009
RevenuesJapan Outside customer sales . . . . . . . . . . . . . . . . . . . ¥ 6,683,143 ¥ 7,436,999 ¥ 7,010,181 $ 68,195
Intersegment transactions . . . . . . . . . . . . . . . . . 1,302,509 1,459,260 1,274,048 13,291Total . . . . . . . . . . . . . . . . . . . . . . . . . . . . . . . . . . 7,985,652 8,896,259 8,284,229 81,486
Asia Outside customer sales . . . . . . . . . . . . . . . . . . . 1,542,526 1,771,600 1,459,549 15,740Intersegment transactions . . . . . . . . . . . . . . . . . 591,611 637,719 561,208 6,037Total . . . . . . . . . . . . . . . . . . . . . . . . . . . . . . . . . . 2,134,137 2,409,319 2,020,757 21,777
North America Outside customer sales . . . . . . . . . . . . . . . . . . . 852,100 962,267 981,098 8,695Intersegment transactions . . . . . . . . . . . . . . . . . 121,325 123,841 89,912 1,238Total . . . . . . . . . . . . . . . . . . . . . . . . . . . . . . . . . . 973,425 1,086,108 1,071,010 9,933
Europe Outside customer sales . . . . . . . . . . . . . . . . . . . 738,662 826,188 645,354 7,537Intersegment transactions . . . . . . . . . . . . . . . . . 51,318 60,650 37,454 524Total . . . . . . . . . . . . . . . . . . . . . . . . . . . . . . . . . . 789,980 886,838 682,808 8,061
Other Areas Outside customer sales . . . . . . . . . . . . . . . . . . . 183,938 229,681 151,721 1,877Intersegment transactions . . . . . . . . . . . . . . . . . 8,367 39,841 21,574 85Total . . . . . . . . . . . . . . . . . . . . . . . . . . . . . . . . . . 192,305 269,522 173,295 1,962Subtotal . . . . . . . . . . . . . . . . . . . . . . . . . . . . . . . 12,075,499 13,548,046 12,232,099 123,219Eliminations & Corporate items . . . . . . . . . . . . . . (2,075,130) (2,321,311) (1,984,196) (21,175)Total . . . . . . . . . . . . . . . . . . . . . . . . . . . . . . . . . . 10,000,369 11,226,735 10,247,903 102,045
Operating income (loss)Japan . . . . . . . . . . . . . . . . . . . . . . . . . . . . . . . . . . . . . . . . . . . . . . . ¥ 74,370 ¥ 299,632 ¥ 212,316 $ 759Asia . . . . . . . . . . . . . . . . . . . . . . . . . . . . . . . . . . . . . . . . . . . . . . . . . 76,742 33,020 (3,664) 783North America . . . . . . . . . . . . . . . . . . . . . . . . . . . . . . . . . . . . . . . . 7,182 23,087 25,310 73Europe . . . . . . . . . . . . . . . . . . . . . . . . . . . . . . . . . . . . . . . . . . . . . . (17,129) 21,575 23,312 (175)Other Areas . . . . . . . . . . . . . . . . . . . . . . . . . . . . . . . . . . . . . . . . . . 9,434 13,394 8,647 96
Subtotal . . . . . . . . . . . . . . . . . . . . . . . . . . . . . . . 150,599 390,708 265,921 1,537Eliminations & Corporate items . . . . . . . . . . . . . . (23,453) (45,192) (83,409) (239)Total . . . . . . . . . . . . . . . . . . . . . . . . . . . . . . . . . . 127,146 345,516 182,512 1,297
Revenues by MarketMillions of yen
Millions of U.S. dollars
2009 2008 2007 2009
Japan Revenues ¥5,861,448 ¥ 6,484,496 ¥ 6,093,627 $59,811Percentage of Total Revenues (%) . . . . . . . . . . . . 59 58 59
Outside Japan Asia . . . . . . . . . . . . . . . . . . . . . . . . . . . . . . . . . . 1,911,290 2,167,171 1,859,664 19,503Percentage of Total Revenues (%) . . . . . . . . . . . . 19 19 18North America . . . . . . . . . . . . . . . . . . . . . . . . . 899,550 1,023,713 1,057,389 9,179Percentage of Total Revenues (%) . . . . . . . . . . . . 9 9 10Europe . . . . . . . . . . . . . . . . . . . . . . . . . . . . . . . 904,425 1,073,877 869,022 9,229Percentage of Total Revenues (%) . . . . . . . . . . . . 9 10 9Other Areas . . . . . . . . . . . . . . . . . . . . . . . . . . . 423,656 477,478 368,201 4,323Percentage of Total Revenues (%) . . . . . . . . . . . . 4 4 4Subtotal . . . . . . . . . . . . . . . . . . . . . . . . . . . . . . 4,138,921 4,742,239 4,154,276 42,234Percentage of Total Revenues (%) . . . . . . . . . . . . 41 42 41Total . . . . . . . . . . . . . . . . . . . . . . . . . . . . . . . . . 10,000,369 11,226,735 10,247,903 102,045
Notes: 1. Operating income and Segment information are disclosed in accordance with financial reporting principles and practices generally accepted in Japan. 2. The consolidated figures in this annual report are expressed in yen and, solely for the convenience of the reader, have been translated into United States dollars at the rate of ¥98=U.S.$1,
the approximate exchange rate prevailing on the Tokyo Foreign Exchange Market as of March 31, 2009. See note 3 of the accompanying notes to consolidated financial statements. 3. In order to be consistent with financial reporting principles and practices generally accepted in Japan, operating income (loss) is presented as total revenues less cost of sales and selling,
general and administrative expenses. The Company believes that this is useful to investors in comparing the Company’s financial results with those of other Japanese companies. Under accounting principles generally accepted in the United States of America, restructuring charges, net gain or loss on sale and disposal of rental assets and other property and impairment losses are included as part of operating income (loss). See the consolidated statements of operations and notes 18, 19 and 20 to the consolidated financial statements. The restructuring charges mainly represent special termination benefits incurred with the reorganization of our business structures, and as the result of the Company and its subsidiaries reviewing and reshaping the business portfolio.
4. Share of revenues for each segment is calculated based on amounts before the elimination of inter-segment transactions. 5. Revenues, operating income (loss), capital investment, depreciation, and assets include “Eliminations & Corporate items.” R&D expenditures include Corporate items. Number of employees
includes Corporate.
Years ended March 31, 2009, 2008 and 2007

Millions of yenMillions of
U.S. dollars
FY2008 FY2007 FY2006 FY2008
Revenues . . . . . . . . . . . . . . . . . . . . . . . . . . . . . . . . . . . . . . . . . ¥2,594,450 ¥2,761,137 ¥2,472,227 $26,474Operating income . . . . . . . . . . . . . . . . . . . . . . . . . . . . . . . . . . . 176,629 116,105 60,343 1,802Capital investment (Property, plant and equipment) . . . . . . . . . . 65,001 103,568 155,675 663Depreciation (Property, plant and equipment) . . . . . . . . . . . . . . 96,551 111,802 93,285 985R&D expenditures . . . . . . . . . . . . . . . . . . . . . . . . . . . . . . . . . . . 154,854 155,209 157,858 1,580Assets . . . . . . . . . . . . . . . . . . . . . . . . . . . . . . . . . . . . . . . . . . . 1,839,101 1,906,166 1,987,603 18,766Number of employees . . . . . . . . . . . . . . . . . . . . . . . . . . . . . . . 109,333 102,010 100,088 –
12 Hitachi, Ltd.Annual Report 2009
revIew oF operaTIonS
Data Center (Unification Control Center)
Hitachi’s unification control center helps customers increase the value of their businesses by operating and monitoring IT equipment, servers, storage systems and other systems around the clock.
Information & Telecommunication SystemsMain Products and Services• Systems Integration• Outsourcing Services• Software• Hard Disk Drives• Disk Array Subsystems• Servers• Mainframes• Telecommunications Equipment• ATMs
2.5-inch Hard Disk Drive by Hitachi Global Storage Technologies
Hitachi Global Storage Technologies draws on its technological capabilities to provide highly reliable hard disk drives for use in a wide range of applications, including notebook and desktop PCs and servers.
Compact Finger Vein Authentication Systems
Finger vein authentication systems identify individuals simply by detecting the finger vein pattern in a finger held on a scanner. These systems are already used in ATMs for authenticating users, for logging into PCs and for room access control. Because of the convenience they offer, they are expected to be used in a wide range of fields going forward.
Large Disk Array Subsystems
Hitachi’s large disk array subsystems command a top global market share. Hitachi also provides storage solutions that mesh with customer needs in a broad range of industries, from finance to manufacturing, based on high reliability and industry-leading virtualization technology.

Revenues(Billions of yen)
Operating income(Billions of yen)
Capital investment (Property, plant and equipment) and Depreciation(Billions of yen)
n n Capital investment (Property, plant and equipment)
Depreciation
Assets(Billions of yen)
n Software and ServicesIn software and services, sales declined year over
year. Software sales decreased from the previous
fiscal year due to lower sales of platform software for
mainframes and middleware such as system opera-
tion management software.
Services also recorded lower year-over-year sales
despite ongoing strong sales in the outsourcing and
consulting businesses. The overall drop was attribut-
able to lower sales in system integration, particularly
for financial institutions.
Earnings increased year over year due to rigorous
project management focused on profitability in the
system integration business, although software earn-
ings were lower.
06FY 07 08
2,472.2 2,761.1 2,594.4
06FY 07 08
60.3 116.1 176.6
06FY 07 08
155.6 103.5 65.093.2 111.8 96.5
06FY 07 08
1,987.6 1,906.1 1,839.1
n hardwareHardware sales decreased from the previous fiscal
year. Telecommunications networks saw sales rise
due to strong growth in optical transmission systems
for next-generation networks, as well as in mobile
phone base stations for the Japanese market. In
contrast, storage product sales dropped for both
HDDs and disk array subsystems due mainly to a
stronger yen. Server operations also recorded lower
sales because of decreased sales of blade servers
and mainframes in line with deterioration in market
conditions. PC operations too posted lower sales,
due to the impact of business structure reforms in
business PC operations and other factors.
Earnings in hardware operations improved greatly
from the previous fiscal year. HDD earnings improved
sharply, returning to profitability on the back of prog-
ress with cost cutting and the contribution of new
products. Higher earnings in telecommunications
networks and servers also supported the large overall
increase in hardware earnings as a whole.
This segment recorded a 6% year-over-year decrease in revenues, to ¥2,594.4 billion (U.S.$26,474 million), the result of lower revenues mainly in software, services and storage products. Operating income, however, climbed 52%, to ¥176.6 billion (U.S.$1,802 million). In addition to HDDs (Hard Disk Drives) returning to profitability, this result reflected higher earnings predominantly in services and telecommunications networks.
13Hitachi, Ltd.Annual Report 2009

Millions of yenMillions of
U.S. dollars
FY2008 FY2007 FY2006 FY2008
Revenues . . . . . . . . . . . . . . . . . . . . . . . . . . . . . . . . . . . . . . . . . ¥1,151,066 ¥1,293,517 ¥1,287,492 $11,746Operating income . . . . . . . . . . . . . . . . . . . . . . . . . . . . . . . . . . . 27,322 54,046 45,755 279Capital investment (Property, plant and equipment) . . . . . . . . . . 30,688 26,476 34,614 313Depreciation (Property, plant and equipment) . . . . . . . . . . . . . . 33,152 36,026 37,871 338R&D expenditures . . . . . . . . . . . . . . . . . . . . . . . . . . . . . . . . . . . 44,809 46,739 46,003 457Assets . . . . . . . . . . . . . . . . . . . . . . . . . . . . . . . . . . . . . . . . . . . 653,329 814,541 840,986 6,667Number of employees . . . . . . . . . . . . . . . . . . . . . . . . . . . . . . . 31,763 33,124 32,253 –
14 Hitachi, Ltd.Annual Report 2009
revIew oF operaTIonS
Electronic DevicesMain Products and Services• LCDs• Semiconductor Manufacturing Equipment• Test and Measurement Equipment• Medical Electronics Equipment• Semiconductors
Hitachi Displays’ 3.2-inch Wide IPS LCDs for Mobile TV Phones
Hitachi Displays, Ltd. has earned high marks from a wide range of customers for high picture quality and high definition IPS LCDs used in mobile phones, digital single lens reflex cameras, and other applications.
Hitachi High-Technologies’ Scanning Electron Microscope
Hitachi High-Technologies Corporation’s scanning electron microscopes (SEMs) are used to evaluate and analyze minute semi-conductors, and have also contributed to the research and development of cutting-edge nanotechnology-based materials, biotechnology and drugs.
Hitachi Medical’s Superconductive Magnet High-Field Open MRI System
In 2008, Hitachi Medical Corporation launched on the U.S. market a superconductive magnet High-Field Open Mag-netic Resonance Imaging (MRI) system that delivers a high magnetic field and high image quality. The company plans to expand the sales to Japan and Europe going forward, while pursuing further advances in diagnosis in answer to customer needs.

Revenues(Billions of yen)
Operating income(Billions of yen)
Capital investment (Property, plant and equipment) and Depreciation(Billions of yen)
n n Capital investment (Property, plant and equipment)
Depreciation
Assets(Billions of yen)
n displaysSales were lower year over year. Although efforts
were made to expand sales in small and medium-
sized TFT (Thin Film Transistor) LCD panels, centered
on high-value-added IPS (In-Plane Switching) panels
for touch screen and high-resolution products, a
sharp decline in demand accompanying the world-
wide economic downturn hurt overall display sales.
Earnings declined from the previous fiscal year
due to the impact of lower sales prices and foreign
currency movements in small and medium-sized
TFT LCD panels. Hitachi also recognized an
expense related to a TFT LCD pricing-fixing cartel in
the United States.
n hitachi high-Technologies corporationSales were lower year over year. Life sciences saw
sales rise on firm growth in demand for chemical
analyzers for customers in the U.S. and Europe.
Sales fell sharply, however, in electronic device sys-
tems due to customers postponing capital expendi-
tures in CD-SEMs (Critical-Dimension Scanning
06FY 07 08
1,287.4 1,293.5 1,151.0
06FY 07 08
45.7 54.0 27.3
06FY 07 08
34.6 26.4 30.637.8 36.0 33.1
06FY 07 08
840.9 814.5 653.3
Electron Microscope) and other semiconductor man-
ufacturing equipment. Information systems & elec-
tronic components saw lower sales as customers cut
production in response to flagging demand for con-
sumer electronics, information devices and other
products. Advanced industrial products recorded
lower sales due mainly to falling sales of silicon
wafers, LCD-related components and automotive-
related components.
Earnings declined year over year, mainly due to
much lower earnings in electronic device systems.
n hitachi medical corporationSales were higher year over year. Although sales of
X-ray systems and some other products in Japan
shrank, the company logged strong sales growth in
MRI (Magnetic Resonance Imaging) systems in
Japan, the U.S. and Europe.
Earnings increased from the previous fiscal year as
a result of improvement in MRI systems and X-ray
systems segments as well as progress of reducing
fixed costs.
Segment revenues decreased 11% year over year, to ¥1,151.0 billion (U.S.$11,746 million), reflecting lower sales at Hitachi High-Technologies Corporation and in the LCD displays business, as well as the impact of selling Hitachi Semiconductor Singapore Pte. Ltd. on March 31, 2008. Operating income fell 49%, to ¥27.3 billion (U.S.$279 million) mainly because of lower earnings at Hitachi High-Technologies and the impact of selling Hitachi Semiconductor Singapore.
15Hitachi, Ltd.Annual Report 2009

Millions of yenMillions of
U.S. dollars
FY2008 FY2007 FY2006 FY2008
Revenues . . . . . . . . . . . . . . . . . . . . . . . . . . . . . . . . . . . . . . . . . ¥3,310,544 ¥3,568,151 ¥3,022,299 $33,781Operating income . . . . . . . . . . . . . . . . . . . . . . . . . . . . . . . . . . . 24,245 138,455 36,391 247Capital investment (Property, plant and equipment) . . . . . . . . . . 175,803 163,039 151,964 1,794Depreciation (Property, plant and equipment) . . . . . . . . . . . . . . 121,450 117,481 91,706 1,239R&D expenditures . . . . . . . . . . . . . . . . . . . . . . . . . . . . . . . . . . . 114,754 110,450 95,065 1,171Assets . . . . . . . . . . . . . . . . . . . . . . . . . . . . . . . . . . . . . . . . . . . 3,052,176 3,075,509 2,728,817 31,145Number of employees . . . . . . . . . . . . . . . . . . . . . . . . . . . . . . . 116,009 106,994 105,512 –
16 Hitachi, Ltd.Annual Report 2009
revIew oF operaTIonS
Power & Industrial SystemsMain Products and Services• Nuclear Power Plants• Thermal Power Plants• Hydroelectric Power Plants• Industrial Machinery and Plants• Automotive Products• Construction Machinery• Elevators• Escalators• Railway Vehicles• Power Tools
Hitachi Vehicle Energy’s High-Output Lithium-Ion Batteries for Hybrid Vehicles
Hitachi Vehicle Energy, Ltd. has developed a lithium-ion battery for hybrid vehicles that delivers 4,500 W/kg, the world’s highest output* for a battery of this class. This company also offers optimal solutions to customers in the form of battery systems combining batteries and electronic control.
*As of May 19, 2009
Construction of Chugoku Electric’s Shimane Nuclear Power Station Unit No. 3
Hitachi is working on construction of advanced boiling water reactors (ABWR), nuclear power plants that have an outstanding safety, reliability, operational and economic profile such as The Chugoku Electric Power Co., Inc.’s Shimane Nuclear Power Station Unit No. 3, which is scheduled to commence operations in December 2011.
Hitachi Construction Machinery’s Hydraulic Excavator
Hitachi Construction Machinery Co., Ltd.’s hydraulic excavators are not only highly durable and reliable, but are also energy efficient and easy to operate thanks to the use of electronic control.
Class 395 High-Speed Trains for the UK
Hitachi is responding to increasing demand around the world for constructing and upgrading railways by developing the A-train, a unique aluminum vehicle system that has a lower envi-ronmental impact, for use in Japan and overseas.

Revenues(Billions of yen)
Operating income(Billions of yen)
Capital investment (Property, plant and equipment) and Depreciation(Billions of yen)
n n Capital investment (Property, plant and equipment)
Depreciation
Assets(Billions of yen)
n power SystemsSales were significantly higher year over year, thanks
to growth in coal-fired thermal power plants over-
seas, especially in Europe, and nuclear power plants
in Japan.
Earnings improved from the previous fiscal year
because of fewer unprofitable projects and better
project management.
n automotive SystemsSales were down considerably year over year due to
the impact of sluggish auto sales worldwide, as well
as the impact of the sale of the mobile communica-
tions equipment business of the former Hitachi
Mobile Co., Ltd. (now Hitachi Auto Parts & Service
Co., Ltd.).
Earnings deteriorated sharply on account of lower
capacity utilization as demand dropped off, and the
impact of soaring raw materials expenses and foreign
currency movements.
06FY 07 08
3,022.2 3,568.1 3,310.5
06FY 07 08
36.3 138.4 24.2
06FY 07 08
151.9 163.0 175.891.7 117.4 121.4
06FY 07 08
2,728.8 3,075.5 3,052.1
n urban planning and development SystemsSales rose year over year due to strong growth in
elevators and escalators, mainly in China, in addition
to the effect of the security monitoring video camera
system business being transferred from the Digital
Media & Consumer Products segment.
Earnings were also up on the back of the strong
performance by elevators and escalators in China
and the Japanese market.
n hitachi construction machinery co., ltd.Both sales and earnings were down sharply year over
year due to falling global demand for construction
machinery and the impact of the stronger yen.
n hitachi plant Technologies, ltd.Sales were flat compared with the previous fiscal
year, as higher sales in nuclear power plant construc-
tion and maintenance inspections were negated by
the impact of lower capital expenditures in private-
sector projects and in public works.
However, earnings improved due to rigorous cost
cutting and fixed cost reductions, as well as better
project management.
Segment revenues decreased 7%, to ¥3,310.5 billion (U.S.$33,781 million), despite brisk sales of elevators and esca-lators and railway vehicles and systems, as well as higher sales in power systems. The main factor behind the overall decline in segment revenues was much lower sales in automotive systems and at Hitachi Construction Machinery Co., Ltd. Operating income tumbled 82%, to ¥24.2 billion (U.S.$247 million), reflecting a sharp deterioration in automo-tive systems earnings and lower earnings at Hitachi Construction Machinery.
17Hitachi, Ltd.Annual Report 2009

Millions of yenMillions of
U.S. dollars
FY2008 FY2007 FY2006 FY2008
Revenues . . . . . . . . . . . . . . . . . . . . . . . . . . . . . . . . . . . . . . . . . ¥1,261,501 ¥1,504,692 ¥1,506,073 $12,872Operating loss . . . . . . . . . . . . . . . . . . . . . . . . . . . . . . . . . . . . . (105,563) (109,914) (58,435) (1,077)Capital investment (Property, plant and equipment) . . . . . . . . . . 43,286 91,689 83,144 442Depreciation (Property, plant and equipment) . . . . . . . . . . . . . . 46,904 59,181 43,513 479R&D expenditures . . . . . . . . . . . . . . . . . . . . . . . . . . . . . . . . . . . 30,614 37,007 35,859 312Assets . . . . . . . . . . . . . . . . . . . . . . . . . . . . . . . . . . . . . . . . . . . 669,856 889,112 971,187 6,835Number of employees . . . . . . . . . . . . . . . . . . . . . . . . . . . . . . . 39,792 41,988 41,690 –
Hitachi Maxell’s Prismatic Lithium-Ion Rechargeable Batteries
Hitachi Maxell is working to expand sales of highly safe, thin type and large-capacity lithium-ion batteries that draw on its proprietary technologies. Accumulated over many years, these technologies include mixing and dispersion technology and coating technology in magnetic tapes.
High-Definition UT (Ultra-thin) LCD TVs
Hitachi’s ultra-thin LCD TVs measure only 35 mm thick (thinnest part) and boast a sleek back, enabling them to be hung on the wall or placed in the center of a room. A built-in HDD allows for simple recording, and Internet connectivity enables access to a range of services.
18 Hitachi, Ltd.Annual Report 2009
revIew oF operaTIonS
Digital Media & Consumer ProductsMain Products and Services• Optical Disk Drives• Plasma TVs• LCD TVs• LCD Projectors• Mobile Phones• Room Air Conditioners• Refrigerators• Washing Machines• Information Storage Media• Batteries• Air-Conditioning Equipment
Hitachi Appliances’ Drum-Type Washer-Dryer
Hitachi Appliances, Inc.’s Drum-Type Washer-Dryer blows air through clothing at a speed of 360 km per hour to smooth out wrinkles while clothes are drying. This eliminates the time-consuming task of ironing clothes afterwards. This product achieves a further reduction in electricity consumption by collecting heat generated by the motor for drying.

Revenues(Billions of yen)
Operating loss(Billions of yen)
Capital investment (Property, plant and equipment) and Depreciation(Billions of yen)
n n Capital investment (Property, plant and equipment)
Depreciation
Assets(Billions of yen)
n digital mediaSales fell year over year. Besides the reduction of
sales units and lower prices of flat-panel TVs over-
seas, this reflected lower sales of optical disc drives
and optical pickups in line with a rapid drop-off in
demand for PCs worldwide.
The sector narrowed the operating loss from the
previous fiscal year. Earnings of LCD projectors,
optical disc drives and optical pickups were impacted
by lower sales prices. The overall improvement was
the result of procuring plasma panels from outside
the Hitachi Group, reducing overseas sales channels
of flat-panel TVs and other initiatives.
n comprehensive air conditioning and home appliances
Sales were on a par with the previous fiscal year, with
growth mainly in room air-conditioners, refrigerators
and washing machines in Japan, centered on high-
end models, which offset lower room air-conditioner
sales overseas.
06FY 07 08
1,506.0 1,504.6 1,261.5
06FY 07 08
(58.4) (109.9) (105.5)
06FY 07 08
83.1 91.6 43.243.5 59.1 46.9
06FY 07 08
971.1 889.1 669.8
The sector reported lower earnings year over year,
despite improved earnings in refrigerators due to
growth in high-end models. This overall result reflected
lower earnings in room air conditioners and commer-
cial packaged air conditioners, as earnings fell mainly
because of the impact of the economic recession in
Japan, as well as sluggish market conditions and the
impact of foreign currency fluctuations overseas.
n hitachi maxell, ltd.Sales decreased year over year, reflecting lower sales
because of a decline in demand and lower prices for
optical discs and computer tapes.
Earnings decreased from the previous fiscal year,
despite improved optical disc earnings. The overall
decline was mainly due to lower sales prices, which
affected computer tape earnings, and lower earnings
in prismatic lithium-ion rechargeable batteries and
pickup lenses for optical disc drives.
Segment revenues dropped 16% year over year, to ¥1,261.5 billion (U.S.$12,872 million), the result of the reduction of sales volumes and falling prices of flat-panel TVs overseas, as well as lower sales of optical disc drives, room air-conditioners and some other products. The segment posted an operating loss of ¥105.5 billion (U.S.$1,077 million), a ¥4.3 billion improvement on the previous fiscal year. The improvement was the result of switching to procuring plasma panels from outside the Hitachi Group and limiting overseas sales units of flat-panel TVs, among other measures.
19Hitachi, Ltd.Annual Report 2009

Millions of yenMillions of
U.S. dollars
FY2008 FY2007 FY2006 FY2008
Revenues . . . . . . . . . . . . . . . . . . . . . . . . . . . . . . . . . . . . . . . . . ¥1,556,886 ¥1,875,018 ¥1,794,506 $15,887Operating income . . . . . . . . . . . . . . . . . . . . . . . . . . . . . . . . . . . 27,777 141,007 132,399 283Capital investment (Property, plant and equipment) . . . . . . . . . . 104,319 106,687 91,893 1,064Depreciation (Property, plant and equipment) . . . . . . . . . . . . . . 81,884 81,019 65,910 836R&D expenditures . . . . . . . . . . . . . . . . . . . . . . . . . . . . . . . . . . . 50,973 50,766 50,179 520Assets . . . . . . . . . . . . . . . . . . . . . . . . . . . . . . . . . . . . . . . . . . . 1,231,562 1,525,754 1,503,733 12,567Number of employees . . . . . . . . . . . . . . . . . . . . . . . . . . . . . . . 52,921 56,998 59,235 –
20 Hitachi, Ltd.Annual Report 2009
revIew oF operaTIonS
High Functional Materials & ComponentsMain Products and Services• Wires and Cables• Copper Products• Semiconductor Materials• Circuit Boards and Materials• Organic and Inorganic Chemical Products• Synthetic Resin Products• Display Related Materials• Specialty Steels• Magnetic Materials and Components• High Grade Casting Components and Materials
Hitachi Metals’ Heat Resistant Exhaust Castings—Manifturbo® by Hercunite®
Manifturbo® is an automotive exhaust casting made from heat-resistant cast iron and steel. Able to withstand temperatures exceeding 1,000 degrees centigrade, it helps improve engine fuel economy.
Hitachi Chemical’s Adhesive Films for Protection of Optical Sheets
These films for protecting optical sheets in displays lose little adhesive strength over time, minimizing damage to the fine surface of optical sheets. They also possess outstanding transparency, enabling easy inspection for foreign objects.
Hitachi Cable’s Halogen-Free, 150-Degree Heat-Resistant Harnesses for Hybrid Vehicles
Power supply harnesses are used as cables to connect motors, inverters and batteries in hybrid vehicles. This harness employs a proprietary halogen-free material that contains no chlorine or bromine in the coating material, and boasts outstanding flexibility and heat resistance, as well as complies with regulations on hazardous substances.

Revenues(Billions of yen)
Operating income(Billions of yen)
Capital investment (Property, plant and equipment) and Depreciation(Billions of yen)
n n Capital investment (Property, plant and equipment)
Depreciation
Assets(Billions of yen)
n hitachi cable, ltd.Sales declined year over year. In wires and cables,
sales fell on account of the impact of a sharp fall in
prices for copper, a key material for wires and cables,
as well as lower sales of electronic wires and wiring
devices. In information and telecommunications
networking, sales declined from the previous fiscal
year. This was attributable to lower sales in the infor-
mation and communications networking devices
business resulting from the economic recession,
although optical submarine cables registered strong
growth in sales. Sales in sophisticated materials were
down year over year, as sales of semiconductor-
related products and auto parts languished.
Earnings fell sharply due to lower sales, most
notably of products for the semiconductor and auto
markets, and revaluation losses on inventory assets
stemming from the copper price decline.
n hitachi chemical co., ltd.Sales were lower year over year. Sales of electronics
related products decreased from the previous fiscal
year, owing to lower sales of semiconductor-related
materials such as die bonding materials and epoxy
molding compounds, as well as printed wiring boards
and printed wiring board materials. In advanced
06FY 07 08
1,794.5 1,875.0 1,556.8
06FY 07 08
132.3 141.0 27.7
06FY 07 08
91.8 106.6 104.365.9 81.0 81.8
06FY 07 08
1,503.7 1,525.7 1,231.5
performance products, sales dropped year over year
due mainly to falling demand for industrial materials
and automotive parts. The company’s sales also
dropped considerably due to the January 2008 sale
of Hitachi Housetec Co., Ltd. and its subsequent
elimination from the scope of consolidation.
Earnings fell substantially year over year, reflecting
the lower sales in addition to the impact of foreign
currency movements and run-up of materials prices.
n hitachi metals, ltd.Sales declined year over year. High-grade metal
products and materials posted a year-over-year
decline, mainly in materials for molds and metal tools
and other automotive-related products. In electronics
and IT devices, sales also declined, with lower sales
of rare earth magnets and ferrite magnets outweigh-
ing firm sales growth in amorphous alloys. In high-
grade functional components and equipment, sales
declined year over year because of decreased sales
of ductile iron products, heat-resistant exhaust cast-
ing components, aluminum wheels and other
automotive-related components.
Earnings decreased sharply due to the lower sales
and production cutbacks to rightsize inventory levels.
Segment revenues dropped 17%, to ¥1,556.8 billion (U.S.$15,887 million), the result of lower revenues at Hitachi Cable, Ltd., Hitachi Chemical Co., Ltd., and Hitachi Metals, Ltd. due to the effect of falling demand in the automo-bile and electronics markets. Operating income dropped 80%, to ¥27.7 billion (U.S.$283 million) due to the lower revenues.
21Hitachi, Ltd.Annual Report 2009

Segment revenues decreased 14%, to ¥1,089.9 billion (U.S.$11,122 million), the result of lower sales at overseas general trading companies in North America and Europe, although Hitachi Transport System, Ltd. registered strong sales growth. Operating income declined 17% year over year, to ¥23.0 billion (U.S.$235 million), mainly due to the lower sales at overseas general trading companies. Hitachi Transport System, however, recorded firm earnings growth.
n hitachi Transport System, ltd.Sales increased year over year. In the domestic logistics busi-
ness, sales were on a par with the previous fiscal year, due to
strong growth in new contracts of third party logistics with fields
such as retailing, information and telecommunications, food and
lifestyle-related areas, despite the collapse in load volume from
existing customers. Sales in the global logistics business were
up, due in part to the addition of ESA s.r.o., based in the Czech
Republic, as a consolidated subsidiary. Hitachi Transport System
invested in this company in December 2007.
Earnings rose year over year mainly due to higher sales in the
third party logistics solutions business, the efficient operation of
business projects, and rigorous initiatives to cut operating
expenses.
n othersSales and earnings decreased at overseas general trading compa-
nies, mainly in North America and Europe.
Revenues(Billions of yen)
Operating income(Billions of yen)
Capital investment (Property, plant and equipment) and Depreciation(Billions of yen)
n n Capital investment (Property, plant and equipment)
Depreciation
Assets(Billions of yen)
Millions of yenMillions of
U.S. dollars
FY2008 FY2007 FY2006 FY2008
Revenues . . . . . . . . . . . . . . . . . . . . . . . . . . . . . . . . . . . . . . . . . ¥1,089,971 ¥1,271,465 ¥1,213,529 $11,122Operating income . . . . . . . . . . . . . . . . . . . . . . . . . . . . . . . . . . . 23,063 27,870 20,233 235Capital investment (Property, plant and equipment) . . . . . . . . . . 31,458 38,518 28,296 321Depreciation (Property, plant and equipment) . . . . . . . . . . . . . . 26,903 25,006 23,341 275R&D expenditures . . . . . . . . . . . . . . . . . . . . . . . . . . . . . . . . . . . 3,016 4,654 2,561 31Assets . . . . . . . . . . . . . . . . . . . . . . . . . . . . . . . . . . . . . . . . . . . 1,030,098 981,447 1,049,916 10,511Number of employees . . . . . . . . . . . . . . . . . . . . . . . . . . . . . . . 41,577 40,213 37,347 –
06FY 07 08
1,213.5 1,271.4 1,089.9
06FY 07 08
20.2 27.8 23.0
06FY 07 08
28.2 38.5 31.423.3 25.0 26.9
06FY 07 08
1,049.9 981.4 1,030.0
22 Hitachi, Ltd.Annual Report 2009
revIew oF operaTIonS
Logistics, Services & OthersMain Products and Services• General Trading• Logistics• Property Management
Hitachi Transport System’s Keihin Distribution Center Boasts Extensive Security
January 2009 saw the completion of Hitachi Transport System, Ltd.’s Keihin Distribution Center. With enhanced security features, this facility is a core base for the provision of third-party logistics solutions and information and telecommunication solution services in the Keihin area, and mainly handles customers’ computers and medical equip-ment. The six-story center has a total floor area of approximately 29,500 m2 on a site of approximately 9,800 m2 and uses room access control, a networked surveillance system and other security measures to provide customers with safe and secure distribution services.

Segment revenues decreased 7% year over year, to ¥412.0 billion (U.S.$4,204 million), due mainly to lower transaction volumes at Hitachi Capital Corporation. Operating income dropped 60%, to ¥10.2 billion (U.S.$104 million), mainly on account of increased bad debt expenses at Hitachi Capital.
n hitachi capital corporationVolume declined year over year. Earnings also declined due to
increased bad debt expenses and a reduction in used asset
prices in Europe and North America.
In the finance sector, lease demand declined as economic
conditions worsened in the past fiscal year. Revenues from com-
mission services were affected by a decline in affiliated loan sales
transactions because of the slump in auto sales. In the supply
and sales services, Hitachi Capital recorded lower new volume in
auto leasing and gains on sale of leased assets that were off
contract. Overseas business, meanwhile, was affected by the
economic downturn, particularly in North America and Europe,
and the impact of foreign currency movements. As a result,
business volume and earnings were lower year over year in all
four divisions.
Revenues(Billions of yen)
Operating income(Billions of yen)
Capital investment (Property, plant and equipment) and Depreciation(Billions of yen)
n n Capital investment (Property, plant and equipment)
Depreciation
Assets(Billions of yen)
Millions of yenMillions of
U.S. dollars
FY2008 FY2007 FY2006 FY2008
Revenues . . . . . . . . . . . . . . . . . . . . . . . . . . . . . . . . . . . . . . . . . ¥412,040 ¥ 445,400 ¥ 500,065 $4,204Operating income . . . . . . . . . . . . . . . . . . . . . . . . . . . . . . . . . . . 10,210 25,481 23,534 104Capital investment (Property, plant and equipment) . . . . . . . . . . 361,549 495,389 554,853 3,689Depreciation (Property, plant and equipment) . . . . . . . . . . . . . . 69,719 108,418 113,886 711R&D expenditures . . . . . . . . . . . . . . . . . . . . . . . . . . . . . . . . . . . 295 1,287 1,513 3Assets . . . . . . . . . . . . . . . . . . . . . . . . . . . . . . . . . . . . . . . . . . . 2,366,909 2,294,020 2,442,066 24,152Number of employees . . . . . . . . . . . . . . . . . . . . . . . . . . . . . . . 4,834 4,605 4,554 –
06FY 07 08
500.0 445.4 412.0
06FY 07 08
23.5 25.4 10.2
06FY 07 08
554.8 495.3 361.5113.8 108.4 69.7
06FY 07 08
2,442.0 2,294.0 2,366.9
23Hitachi, Ltd.Annual Report 2009
Financial ServicesMain Products and Services• Leasing• Loan Guarantees• Insurance Services
Hitachi Capital’s Multifunctional IC Card
Hitachi Capital Corporation provides IC card solu-tions according to the needs of companies and employees, including employee identification cards.

R&D in the Hitachi Group encompasses activities undertaken by the Research &
Development Group, a corporate R&D organization, as well as the product develop-
ment divisions in business groups and Hitachi Group companies (some of which have
independent research organizations). Overall, approximately 6,000 people are
involved in R&D activities within the Hitachi Group (as of March 31, 2009). The Hitachi
Group conducts R&D across many fields, ranging from information and telecommuni-
cation systems to financial services. R&D expenditure for the entire Group was
¥416.5 billion in fiscal 2008. This figure was 3% lower than in the previous year and
represented 4.2% of fiscal 2008 consolidated revenues.
Hitachi’s Research & Development Group operates 6 corporate research laborato-
ries in Japan and research facilities overseas: employing about 3,000 people in total.
Its mission is to help expand current businesses, generate new businesses and
create innovative technology. These organizations serve as the core of the Hitachi
Group, establishing a research framework called “Technology platforms across the
Hitachi Group,” and assembling R&D personnel from across the Group. Further,
employees of business divisions as well as customers may also participate in projects.
The purpose of this research scheme is to generate innovative technology to revolu-
tionize MONOZUKURI as well as foster human resources that will contribute to the
development of the Hitachi Group’s businesses.
In the Research & Development Group, 70% of R&D resources are allocated to
expanding priority businesses, with a further 10% earmarked for innovation research
and 20% for platform research. Furthermore, a special R&D scheme, Tokken, is
utilized to facilitate Hitachi Group synergies, and Group CTO meetings are held to
coordinate businesses and technology roadmaps.
Moreover, the Hitachi Group is concentrating its efforts in R&D to expand the
Social Innovation Business. Specifically, the Company will strengthen R&D in nuclear
and coal-fired thermal power plants, new energy, “green mobility” (railway, construc-
tion machinery and automotive systems), eco-friendly data centers, security products
and solutions, as well as key devices supporting these businesses, such as high-
performance motors and inverters, lithium-ion batteries, and environment and energy-
conscious materials.
From 1989, Hitachi has established R&D centers in North America, Europe, China
and Singapore. The mission of the overseas R&D centers is to; 1) contribute to local
business operations, 2) cooperate with world leading research centers, and 3) deploy
global staff. In each region, cooperation with universities and corporate research organi-
zations is being strengthened to promote market-oriented research on a global basis.
R&D Expenditure and R&D Expenditure as a Percentage of Consolidated Revenues(billions of yen)
04FY 05 06 07 08
388.6 405.0 412.5 428.1 416.5
4.3% 4.3%
4.0%3.8%
4.2%
Global Market-Oriented R&D Initiatives
Europe• Joint global research for low-CO2 coal-fired thermal power
• Technology development for the UK railway business
North America
• Joint research with IBM for beyond-32nm node semiconductor
manufacturing technology
• Collaborative creation with North American customers in the storage
business
中China
• Energy-conserving electric system project in Yunnan Province
• Development for a railway wireless communication system in
Chongqing
中Asia• Establishment of the R&D Office in India
• Hitachi lecture series at the Indian Institute of Technology
Allocation of research resources
Expansion of priority businesses (70%)
Platform research (20%)
Innovation research (10%)
Allocation of Research Resources
nn R&D Expenditure Percentage of Consolidated Revenues
24 Hitachi, Ltd.Annual Report 2009
reSearch and developmenT

Hitachi’s Intellectual Property Group supports business strategy from an intellectual
property (IP) standpoint. Hitachi’s fundamental IP policy is “building a world-class
patent portfolio” and “strategic IP use.”
Hitachi is currently pursuing a patent filing plan that calls for the number of over-
seas patent applications of the Hitachi Group to surpass domestic patent applica-
tions by fiscal 2010, Hitachi’s centennial year. As a result, in fiscal 2008, the ratio of
overseas applications to total applications increased 2 percentage points from fiscal
2007 to 47%. In fiscal 2009, Hitachi is planning to raise this ratio further by strictly
selecting domestic applications and filing more overseas applications by reducing the
unit cost of overseas filings.
According to internal data, the Hitachi Group placed third in 2008 in terms of the
number of U.S. issued patents for the third straight year. Hitachi expects to maintain
its high ranking in 2009 as well.
To build an internationally competitive patent portfolio, patent quality is just as
important as the number of patents filed or registered. For instance, Hitachi promotes
flagship patent activities to leverage the Hitachi Group’s strengths and at the same
time is concentrating on inventing technologies that can differentiate the Hitachi
Group. Patent portfolio management activities try to cultivate patents related to
selected themes worldwide with the aim of creating an internationally competitive IP
portfolio. In fiscal 2008, Hitachi focused on themes such as high-efficiency thermal
power generation and storage. In fiscal 2009, we will continue to create a patent
portfolio for supporting the Social Innovation Business, including Green IT.
Regarding patent royalty income, Hitachi moved into the black in 1985 in terms of
the difference between income and payments related to technology licenses. Hitachi
also actively pursues global IP licensing. The percentage of overseas patent royalty
income to overall patent royalty income increased to 69% in fiscal 2008, compared to
35% in fiscal 2000.
Hitachi is promoting a Hitachi Group Patent Pool Model for the strategic utilization
of patents. This model integrates management of invention creation, patent filing and
patent utilization within the Hitachi Group. Moreover, in August 2008, Hitachi estab-
lished the Hitachi Group Standardization Committee, and the International Standard-
ization Office in the Intellectual Property Group. These new bodies are strengthening
cooperation among business divisions and Group companies in international stan-
dardization activities. Specifically, they are supporting business divisions and Group
companies in defining shared strategic themes such as environmental technology. In
addition, they are formulating guidelines, sharing information and conducting educa-
tional activities relating to standardization on a Group-wide basis.
Royalty Income by Region
InTellecTual properTY
Japan:
less than 50%
Japan:
53%
Japan:
31%
Europe/USA:
11%
U.S.: 18%
Overseas:
47%
Europe:
15%
Asia and other regions:
58%
China: 11%
Others (incl. India):
over 6%
FY2010 Target
FY2008
FY2008
Hitachi Group Domestic/ Overseas Patent Applications
(FY2008 Results and FY2010 Targets)
25Hitachi, Ltd.Annual Report 2009

The hitachi Group’s approach to cSrOur corporate credo is to contribute to society through the development of superior,
original technology and products, and we have long cherished Hitachi’s founding
spirit encapsulated by the words “Harmony,” “Sincerity” and “Pioneering spirit.”
As defined by the Hitachi Group, CSR means promoting activities that increase
social, economic, environmental and human value. This requires a clear commitment
from top management and ongoing efforts to strengthen corporate governance,
based on a culture of compliance and high ethical values.
Our vision and mission is to harness the Hitachi Group’s collective knowledge and
technologies to address fundamental issues affecting the global community with the
aim of providing a safer and more pleasant life for all. To realize this philosophy and
mission and fulfill society’s expectations, we formulated the CSR Policy of the Hitachi
Group in March 2005 as a common policy platform to support the global CSR pro-
motion framework of the Hitachi Group.
cSr promotionAchieving the Three-Year Roadmap
The Hitachi Group established the Three-Year CSR Roadmap, a medium-term plan
for CSR, in fiscal 2006. Based on this roadmap, we set fiscal year targets and are
promoting various activities to achieve those targets.
In fiscal 2008, Hitachi developed a CSR self-assessment tool with the aim of
assessing its position and the appropriate direction for CSR activities. By using this
tool, Hitachi, Ltd. found that the structures and systems required for effective CSR
are mostly in place. However, we also discovered areas that need improvement:
linking CSR and corporate strategy; disclosing information about the whole Hitachi
Group; and sharing, educating and informing Group employees about global stan-
dards. This tool is being used in 22 Hitachi Group companies at present and the
results are being utilized as the basis for formulating action plans at each company.
In March 2009, Hitachi held a dialogue with stakeholders in New York, U.S. We
exchanged a broad range of opinions with various stakeholders, reviewing and
assessing management issues that are important at Hitachi for ensuring the sustain-
able development of management and society.
European CSR Project Launched
In order to implement CSR activities best suited for Europe, Hitachi Group companies
in Europe have launched a CSR project to look at what the Hitachi Group as a
whole—as well as Hitachi Group businesses in Europe—must focus on, and the level
of interest of stakeholders in the region. The main themes to promote are implement-
ing environmental projects, encouraging diversity, respecting human rights, and pro-
moting CSR procurement.
The Hitachi Group believes corporate social responsibility (CSR) is founded on the understanding and actions of each individual employee. A common CSR Policy of the Hitachi Group has been instituted since March 2005 to support practical implementation of this approach across the Hitachi Group. With the aim of being an advanced global enter-prise in this field, we have also established the Three-Year CSR Roadmap as a medium-term CSR action plan.
CSR Policy of the Hitachi Group
1. Commitment to Corporate Social Responsibility (CSR)
2. Contribution to Society through Our Business
3. Disclosure of Information and Stakeholder Engagement
4. Corporate Ethics and Human Rights
5. Environmental Conservation
6. Corporate Citizenship Activities
7. Working Environment
8. Responsible Partnership with Business Partners
(Adopted March 2005)
corporaTe SocIal reSponSIBIlITY
26 Hitachi, Ltd.Annual Report 2009

The focus in fiscal 2008 was on identifying common concerns of the Hitachi Group
in Europe, and determining measures that the Group as a whole could implement.
While working to develop these measures from 2009, we will emphasize communica-
tion with European stakeholders.
promoting environmental activitiesThe key pillars of the Hitachi Group’s Environmental Vision are the prevention of global
warming, the conservation of resources, and the preservation of the eco-system.
Based on this vision, Hitachi is working to practice environmental management, and
has set progressive targets for fiscal 2010, 2015 and 2025. Hitachi is aiming to
achieve specific targets in its Environmental Vision to prevent global warming, which it
views as a particularly urgent mission for realizing a sustainable society.
Environmental Activity Topics
The Three Pillars of Hitachi’s Environmental Vision
Next-Generation Products and Services—46 Eco-Products Newly Registered—The Hitachi Group designates products that achieve at least a certain standard based on a quantita-
tive assessment of environmental performance over the entire product life cycle in terms of energy
conservation, recycling and other criteria.
In fiscal 2008, the number of Hitachi Eco-Products rose to 1,103 products (6,961 models), repre-
senting an increase of 46 products (745 models) from the previous fiscal year.
Preservation of Ecosystem
Reduce negativeeffect on air,
water, and soil
Conservation of Resources
Collect products for reuse or recycling
Prevention of Global Warming
Reduce CO2 emissionsin energy production
Enhance energy efficiency
of our products
Towards a Sustainable Society
Drum-Type Washer-Dryer
Narashino Division, Hitachi Industrial Equipment Systems Co., Ltd.(Above) The new production building uses high-insulation glass and energy-
saving equipment.(Right) Solar panels installed on the roof of the production building.
Super Eco-Factories & Offices—9 More Super Eco-Factories & Offices Certified—The Hitachi Group internally certifies as Super-Eco Factories & Offices facilities
that achieve outstanding results and take pioneering steps in reducing their envi-
ronmental impact. The performance of previously certified facilities is reassessed
yearly to determine whether they should retain their status. Based on fiscal 2008
assessments, 9 more facilities were certified, meaning that 26 facilities are now
recognized as Super-Eco Factories & Offices. Our goal is to have 30 facilities
certified across the Hitachi Group by the end of fiscal 2010.
Global Warming Prevention Toward 2025
Fiscal 2010 Goal
n 12% reduction in Hitachi Group CO2 emissions (from FY1990 for Japan domestically)
n 5% reduction in CO2 emissions per unit of production (from FY2003 for outside Japan)
Fiscal 2015 Goal: “Medium-Term
Environmental Vision 2015”
n Achieve “Emission Neutral”
* “Emission Neutral” means reducing CO2 emissions from material production, manufacturing and distribution (the direct burden) and reducing CO2 emissions by making energy- and resource-saving products (the social burden) to make the two environmental burdens equal.
Fiscal 2025 Goal: “Long-Term Environmental
Vision 2025”
n To help reduce annual CO2 emissions by 100 million tons by 2025 through Hitachi Products and Services*
* With fiscal 2005 as the base year, Hitachi plans to produce more environmentally efficient products and services
27Hitachi, Ltd.Annual Report 2009

corporate GovernanceHitachi, Ltd. (the “Company”) and its 16 publicly owned group
companies have adopted the Committee Systems under the
Company Law of Japan. By demarcating responsibilities for man-
agement oversight and those for the execution of business opera-
tions, Hitachi is working to create a framework for quick business
operation, while making management highly transparent by having
outside directors on the Board of Directors. In terms of the basic
policy for corporate governance of the Hitachi Group, Hitachi,
Ltd.’s Standards of Corporate Conduct is positioned as the basis
for the Hitachi brand and CSR activities. Underpinned by this basic
policy, Hitachi aims to foster shared values throughout the group
as well as a shared understanding of the social responsibilities a
corporation must fulfill. In accordance with this policy, some of
Hitachi’s directors and executive officers serve concurrently as
directors and committee members at group companies. In addi-
tion, through the Hitachi Group Headquarters, Hitachi is strength-
ening integrated management of the group, improving
management oversight of group companies and executing busi-
ness strategies formulated to enable the Hitachi Group to demon-
strate its collective strengths. The goal is higher corporate value.
Board of directorsThe Board of Directors determines basic management policies and
supervises executive officers in the performance of their duties
while entrusting to executive officers considerable authority to
make decisions with respect to Hitachi’s business affairs. As of
June 23, 2009, the Board of Directors was made up of 12 direc-
tors, five of whom are from outside Hitachi. Two directors serve
concurrently as executive officers. The Chairman of the Board
does not concurrently serve as an executive officer. Executive
officers execute Hitachi’s business affairs and decide on matters
pertaining to the same in accordance with the division of duties
stipulated by resolutions of the Board of Directors.
Within the Board of Directors, there are three statutory commit-
tees—the Nominating Committee, Audit Committee and Compen-
sation Committee—with outside directors accounting for the
majority of members of each committee. The Board of Directors
met on 9 separate occasions during the fiscal year ended March
31, 2009, and the attendance rate of directors at those meetings
was 96%. Full-time staff, who do not take orders from executive
officers, have been assigned to assist the activities of the Board of
Directors and these committees.
(1) Nominating CommitteeThe Nominating Committee has the authority to decide on the
particulars of proposals submitted to the General Meeting of
Shareholders for the appointment and dismissal of directors. The
Nominating Committee consists of four directors, three of whom
are outside directors.
The Nominating Committee met 6 times during the fiscal year
ended March 31, 2009.
(2) Audit CommitteeThe Audit Committee audits the performance of directors and
executive officers and has the authority to decide on proposals
submitted to the General Meeting of Shareholders for the appoint-
ment and dismissal of accounting auditors. The Audit Committee
consists of five directors: three outside directors and two other
directors who are full-time Audit Committee members.
The Audit Committee met 12 times during the fiscal year ended
March 31, 2009.
(3) Compensation CommitteeThe Compensation Committee has the authority to determine remu-
neration policies for directors and executive officers and remunera-
tion for individuals based on them. The Compensation Committee
consists of four directors, three of whom are outside directors.
The Compensation Committee met 8 times during the fiscal
year ended March 31, 2009.
director and executive officer compensationThe compensation of directors and executive officers is set com-
mensurate with the ability required of, and the responsibilities to be
borne by these executives, after taking into consideration compen-
sation packages at other companies.
The compensation of directors consists of a monthly salary and
a year-end allowance. The year-end allowance is a pre-determined
amount equivalent to about 20% of the director’s annual income
based on the monthly salary, although this amount may be
reduced depending on the Company’s performance. Directors
serving concurrently as executive officers are not paid compensa-
tion as directors.
The compensation of executive officers consists of a monthly
salary and a performance-linked component. The performance-
linked component is set within a range equivalent to about 30% of
the executive officer’s annual income, adjusted based on Company
and individual performance.
The compensation structure for directors and executive officers
was re-examined starting with the compensation for the fiscal year
ended March 31, 2009 and the retirement allowance was abolished.
Director and executive officer compensation for the fiscal year
ended March 31, 2009 was as follows:
Compensation for Directors and Executive Officers
NumberAmount
(Millions of yen)
Directors
(Outside directors)
13
(5)
408
(95)
Executive officers 26 1,133
Total 39 1,542
Notes 1. The number of directors excludes the two directors who serve concurrently as executive officers.
2. The compensation of directors includes the monthly salary of the two directors who retired due to the expiration of their terms in office at the close of the 139th Ordinary General Meeting of Shareholders held on June 20, 2008, for their terms of office in the fiscal year ended March 31, 2009.
corporaTe Governance
28 Hitachi, Ltd.Annual Report 2009

risk management and Internal auditsRegarding risk management, each division implements counter-
measures, such as the formulation of rules and guidelines. Further-
more, internal audits are conducted to monitor and assess the
status of business operations, including efficiency in the execution
of day-to-day operations and legal compliance, so that improve-
ments can be made. Moreover, to ensure strict legal compliance,
Hitachi has various committees and a whistle-blower system.
Internal control over Financial reportingHitachi’s shares are listed on the New York Stock Exchange (the
“NYSE”) in the form of American Depositary Shares (“ADSs”) and
are registered with the U.S. Securities and Exchange Commission.
Therefore, Hitachi is subject to the U.S. Sarbanes-Oxley Act,
which requires a company’s management to establish, maintain,
assess and report on internal control over financial reporting.
Effective from fiscal 2008, pursuant to the Financial Instruments
and Exchange Law of Japan, the reporting and assessment of
internal control over financial reporting is also required. The Hitachi
Group will endeavor to improve the transparency and reliability of
its business affairs and strengthen its management base by put-
ting in place internal control over financial reporting not only for
meeting legal and regulatory requirements, but also as an impor-
tant social responsibility of a corporation. This will be done by
establishing frameworks for clarifying, examining and visualizing
management and operations.
Please refer to page 92 for a management report concerning
the Company’s internal control over financial reporting.
* The New York Stock Exchange Corporate Governance Listing Standards Hitachi’s ADSs are listed on the NYSE. Hitachi is therefore required to comply with
certain of the NYSE’s corporate governance listing standards (the “NYSE Standards”). As a foreign private issuer, Hitachi may follow its home country’s corporate gover-nance practices in lieu of most of the NYSE Standards. Hitachi’s corporate gover-nance practices differ in certain significant respects from those that U.S. companies must adopt in order to maintain NYSE listing and, in accordance with Section 303A.11 of NYSE’s Listed Company Manual, a brief, general summary of those differences is provided as follows.
(a) Director independence The NYSE Standards require a majority of the membership of NYSE-listed company
boards to be composed of independent directors. Hitachi’s Board of Directors consists of 12 members, five of whom are “outside directors,” as defined under the Company Law of Japan (the “Company Law”). The Company Law defines an outside director as a director who is not and has not been an executive director (a represen-tative director or a director who executes such company’s business), executive officer, manager or any other employee of such company or its subsidiaries.
(b) Non-management directors’ executive sessions The NYSE Standards require non-management directors of NYSE-listed companies
to meet at regularly scheduled executive sessions without management. Neither the Company Law nor Hitachi’s Articles of Incorporation require Hitachi’s non-management directors to hold such meetings.
Hitachi Group Internal Control Assessment Framework
SEC
Financial Services Agency
Hitachi, Ltd. CEO and CFO*
Internal Control Committee
Internal Control Committee Office
Hitachi Group HQs(Hitachi Group HQs and
Hitachi, Ltd. Business Groups)
Board of Directors
Audit Committee
Internal Auditing Office
Independent auditors
Managementassessment
report
Internal audit report
Internal audit report
Report Report
Certification, Management Assessment Report
Report
Audit
Monitoring
* CFO: Chief Financial Officer
(c) Committee member composition The NYSE Standards require NYSE-listed companies to have a nominating/corpo-
rate governance committee, audit committee and compensation committee that are composed entirely of independent directors. Hitachi’s nominating committee, audit committee and compensation committee are composed of a majority of outside directors in accordance with the Company Law, while Hitachi’s Audit Committee complies with the NYSE standards.
(d) Miscellaneous In addition to the above differences, Hitachi is not required: to make its nominating,
audit and compensation committees prepare a written charter that addresses either purposes and responsibilities or performance evaluations in a manner that would satisfy the NYSE’s requirements; to acquire shareholder approval of equity compen-sation plans in certain cases, such as issuing stock acquisition rights as stock options without “specially favorable” conditions; to make publicly available one or more documents which purport to summarize all aspects of its corporate gover-nance guidelines; or to adopt a code of business conduct and ethics for its directors, officers and employees that would comply fully with the NYSE’s requirements.
29Hitachi, Ltd.Annual Report 2009

Board oF dIrecTorS(As of July 1, 2009)
Board director (chair) Tadamichi Sakiyama
directors Takashi Kawamura* Representative Executive Officer, Chairman, President and Chief Executive Officer
Michiharu Nakamura
Takashi Miyoshi* Representative Executive Officer, Executive Vice President and Executive Officer
Yoshie Ota Outside Director, Advisor, Japan Institute of Workers’ Evolution
Mitsuo Ohashi Outside Director, Chairman of the Board, Showa Denko K.K.
Akihiko Nomiyama Outside Director, Special Advisor, NIPPON MINING HOLDINGS, INC.
Kenji Miyahara Outside Director, Special Advisor, Sumitomo Corporation
Tohru Motobayashi Outside Director, Lawyer, Partner, Ihara & Motobayashi
Takeo Ueno Advisor, Hitachi Via Mechanics, Ltd.
Shungo Dazai Chairman of the Board, Hitachi Construction Machinery Co., Ltd.
Michihiro Honda Chairman of the Board, Hitachi Metals, Ltd.
* Denotes directors who serve concurrently as executive officers.
Each committee is composed of the following members (Chairman underlined)
Nominating Committee: Takashi Kawamura, Yoshie Ota, Mitsuo Ohashi, Tohru Motobayashi
Audit Committee: Tadamichi Sakiyama, Yoshie Ota, Akihiko Nomiyama, Kenji Miyahara, Michiharu Nakamura
Compensation Committee: Takashi Kawamura, Akihiko Nomiyama, Kenji Miyahara, Tohru Motobayashi
Yoshie Ota Mitsuo Ohashi Akihiko Nomiyama Kenji Miyahara
Michihiro Honda
Michiharu Nakamura Takashi Miyoshi
Takeo Ueno
Tadamichi Sakiyama Takashi Kawamura
Shungo Dazai
Tohru Motobayashi
30 Hitachi, Ltd.Annual Report 2009

execuTIve oFFIcerS(As of July 1, 2009)
representative executive officer, chairman, president and chief executive officer
Takashi Kawamura General Manager of Supervisory Officer for Management Reforms
representative executive officers, executive vice presidents and executive officers
Kazuhiro Mori Sales, Global Group Management and Business Incubation, General Manager of Supervisory Office for Sales and Promotion and Corporate Export Regulation Division
Hiroaki Nakanishi Power Systems Business, Industrial Systems Business, Automo-tive Systems Business and Production Technology, General Manager of Supervisory Office for Overseas Plant Construction Business, Supervisory Office for MONOZUKURI, Supervisory Office for Transportation Systems and Corporate Quality Assur-ance Division, Chairman of the Board of Hitachi Global Storage Technologies, Inc.
Takashi Hatchoji Corporate Planning & Development, Environmental Strategy, Human Capital, Legal & Corporate Communications, Brand Management and Management Audit, General Manager of Supervisory Office for Business Infrastructure and Supervisory Office for Product Environmental Information, Hitachi Group Chief Environmental Strategy Officer
Takashi Miyoshi Management Reforms, Finance, Pension, Group Management, Business Development and Consumer Business, Deputy General Manager of Supervisory Office for Management Reforms and Chief Hitachi Group Headquarters
Naoya Takahashi Information Business, Research & Development and Information Systems, General Manager of Supervisory Office for Business Coordination, Hitachi Group Chief Technology Officer, Hitachi Group Chief Innovation Officer and Hitachi Group Chief Informa-tion Security Officer
Senior vice presidents and executive officersJunzo Nakajima President & Chief Executive Officer of Information & Telecommuni-
cation Systems Group
Koichiro Nishikawa Business Development
representative executive officers, Senior vice presidents and executive officers
Toyoaki Nakamura Finance, Pension and Group Management
Taiji Hasegawa Procurement, General Manager of Battery Systems Division and Motor Power Systems Division
Senior vice presidents and executive officersShozo Saito Environmental Strategy, Quality Assurance, Production Technol-
ogy and Power Technology, General Manager of Investment Planning Office
Tadahiko Ishigaki Chief Executive for the Americas
Stephen Gomersall Chief Executive for Europe
vice presidents and executive officersKoji Tanaka President & Chief Executive Officer of Power Systems Group,
General Manager of Renewable Energy & Smart Grid Division
Akira Maru Chief Executive Officer of Nuclear Systems, Power Systems Group and General Manager of Nuclear System Division
Hitoshi Isa Chief Executive Officer of Thermal Power Systems, Power Systems Group
Gaku Suzuki President & Chief Executive Officer of Industrial Systems Group, Deputy General Manager of Supervisory Office for Transportation Systems
Hideaki Takahashi President & Chief Executive Officer of Urban Planning and Development Systems Group
Shinjiro Iwata Chief Executive Officer of Service & Global Business, Information & Telecommunication Systems Group
Kaichiro Sakuma Chief Executive Officer of System Solutions Business, Information & Telecommunication Systems Group
Masahiro Kitano Chief Executive Officer of Platform Business, Information & Telecommunication Systems Group
Koushi Nagano General Manager of Corporate Marketing Group and Customer Satisfaction Promotion Center
Masao Hisada Export Regulation, Deputy General Manager of Corporate Marketing Group, General Manager of Global Business Division
Takao Koyama Deputy General Manager of Corporate Marketing Group, General Manager of Kansai Area Operation
Shigeru Azuhata General Manager of Research & Development Group, Environ-mental Strategy Office and Medical Systems Business Division
Kenji Ohno Human Capital, General Manager of Head Office Business Support Division
Toshiaki Kuzuoka Legal & Corporate Communications, Corporate Brand Manage-ment and Management Audit, General Manager of Legal Division, Compliance Division and Centennial Project Division
Makoto Ebata Procurement
Nobuyuki Ohno Chief Executive and Chief Innovation Officer for China
Osamu Ohno General Manager of Information Technology Division, Chief Innovation Officer of Power Systems Group
Takashi Miyoshi Naoya Takahashi
Koichiro Nishikawa Toyoaki Nakamura
Tadahiko Ishigaki
Kazuhiro Mori Takashi HatchojiHiroaki Nakanishi
Taiji Hasegawa
Shozo Saito Stephen Gomersall
Junzo Nakajima
Takashi Kawamura
31Hitachi, Ltd.Annual Report 2009

We Wi l l Cont inue to Take Up the Cha l l enge
32 Hitachi, Ltd.Annual Report 2009

Contents
Consolidated Balance sheets 34
Consolidated statements of operations 36
Consolidated statements of stockholders’ equity 37
Consolidated statements of Cash Flows 39
notes to Consolidated Financial statements 40
Management’s Report on Internal Control over Financial Reporting 92
Report of Independent Registered Public Accounting Firm 93
Five-Year summary 96
FInAnCIAl seCtIon
33Hitachi, Ltd.Annual Report 2009

Consolidated Balance sheetsHitachi, Ltd. and Subsidiaries March 31, 2009 and 2008
Millions of yenThousands of
U.S. dollars (note 3)
Assets 2009 2008 2009
Current assets:
Cash and cash equivalents . . . . . . . . . . . . . . . . . . . . . . . . . . . . . . . . . . . . ¥ 807,926 ¥ 560,960 $ 8,244,143 Short-term investments (note 4) . . . . . . . . . . . . . . . . . . . . . . . . . . . . . . . . . 8,654 61,289 88,306
Trade receivables, net of allowance for doubtful receivables of ¥46,486 million ($474, 347 thousand) for 2009 and ¥40,847 million for 2008:
Notes (notes 7 and 17) . . . . . . . . . . . . . . . . . . . . . . . . . . . . . . . . . . . . . . 105,218 163,962 1,073,653 Accounts (note 7) . . . . . . . . . . . . . . . . . . . . . . . . . . . . . . . . . . . . . . . . . . 2,028,060 2,365,823 20,694,490
Investments in leases (notes 6 and 7) . . . . . . . . . . . . . . . . . . . . . . . . . . . . . 170,340 136,119 1,738,163 Inventories (note 5) . . . . . . . . . . . . . . . . . . . . . . . . . . . . . . . . . . . . . . . . . . . 1,456,271 1,441,024 14,859,908 Prepaid expenses and other current assets (note 9) . . . . . . . . . . . . . . . . . . 488,930 672,578 4,989,082 Total current assets . . . . . . . . . . . . . . . . . . . . . . . . . . . . . . . . . . . . . . . 5,065,399 5,401,755 51,687,745
Investments and advances, including affiliated companies (note 4) . . . . . . . . 693,487 1,042,657 7,076,398Property, plant and equipment (note 6):
Land . . . . . . . . . . . . . . . . . . . . . . . . . . . . . . . . . . . . . . . . . . . . . . . . . . . . . 464,935 478,620 4,744,235 Buildings . . . . . . . . . . . . . . . . . . . . . . . . . . . . . . . . . . . . . . . . . . . . . . . . . . 1,915,992 1,848,105 19,550,939 Machinery and equipment . . . . . . . . . . . . . . . . . . . . . . . . . . . . . . . . . . . . . 5,640,623 5,770,457 57,557,377 Construction in progress . . . . . . . . . . . . . . . . . . . . . . . . . . . . . . . . . . . . . . 86,842 93,137 886,143
8,108,392 8,190,319 82,738,694 Less accumulated depreciation . . . . . . . . . . . . . . . . . . . . . . . . . . . . . . . . . 5,714,446 5,536,401 58,310,674 Net property, plant and equipment . . . . . . . . . . . . . . . . . . . . . . . . . . . 2,393,946 2,653,918 24,428,020
Other assets (notes 6, 8, 9 and 11) . . . . . . . . . . . . . . . . . . . . . . . . . . . . . . . . 1,250,877 1,432,517 12,764,051 Total assets . . . . . . . . . . . . . . . . . . . . . . . . . . . . . . . . . . . . . . . . . . . . . ¥9,403,709 ¥10,530,847 $95,956,214
See accompanying notes to consolidated financial statements.
34 Hitachi, Ltd.Annual Report 2009

Millions of yenThousands of
U.S. dollars (note 3)
Liabilities and Stockholders’ Equity 2009 2008 2009
Current liabilities:
Short-term debt (note 10) . . . . . . . . . . . . . . . . . . . . . . . . . . . . . . . . . . . . . ¥ 998,822 ¥ 723,020 $10,192,061 Current portion of long-term debt (notes 6 and 10) . . . . . . . . . . . . . . . . . . 531,635 386,879 5,424,847
Trade payables:
Notes . . . . . . . . . . . . . . . . . . . . . . . . . . . . . . . . . . . . . . . . . . . . . . . . . . . 39,811 66,265 406,235 Accounts . . . . . . . . . . . . . . . . . . . . . . . . . . . . . . . . . . . . . . . . . . . . . . . . 1,138,770 1,601,413 11,620,102 Accrued expenses (notes 11 and 17) . . . . . . . . . . . . . . . . . . . . . . . . . . . . . 878,454 901,546 8,963,816 Income taxes (note 9) . . . . . . . . . . . . . . . . . . . . . . . . . . . . . . . . . . . . . . . . . 24,689 101,599 251,929 Advances received . . . . . . . . . . . . . . . . . . . . . . . . . . . . . . . . . . . . . . . . . . . 386,519 412,642 3,944,071 Other current liabilities (note 9) . . . . . . . . . . . . . . . . . . . . . . . . . . . . . . . . . . 623,204 559,535 6,359,225 Total current liabilities . . . . . . . . . . . . . . . . . . . . . . . . . . . . . . . . . . . . . 4,621,904 4,752,899 47,162,286
Long-term debt (notes 6 and 10) . . . . . . . . . . . . . . . . . . . . . . . . . . . . . . . . . . 1,289,652 1,421,607 13,159,714Retirement and severance benefits (note 11) . . . . . . . . . . . . . . . . . . . . . . . . . 1,049,597 822,440 10,710,173Other liabilities (note 9) . . . . . . . . . . . . . . . . . . . . . . . . . . . . . . . . . . . . . . . . . . 263,204 220,781 2,685,755 Total liabilities . . . . . . . . . . . . . . . . . . . . . . . . . . . . . . . . . . . . . . . . . . . 7,224,357 7,217,727 73,717,928
Minority interests . . . . . . . . . . . . . . . . . . . . . . . . . . . . . . . . . . . . . . . . . . . . . . 1,129,401 1,142,508 11,524,500
Stockholders’ equity:
Common stock
3,368,126,056 shares issued (notes 10 and 12) . . . . . . . . . . . . . . . . . . . 282,033 282,033 2,877,888 Capital surplus (note 12) . . . . . . . . . . . . . . . . . . . . . . . . . . . . . . . . . . . . . . 560,066 555,410 5,714,959 Legal reserve and retained earnings (note 13) . . . . . . . . . . . . . . . . . . . . . . 820,440 1,626,497 8,371,837 Accumulated other comprehensive loss (note 15) . . . . . . . . . . . . . . . . . . . (586,351) (267,198) (5,983,173) Treasury stock, at cost (note 14) . . . . . . . . . . . . . . . . . . . . . . . . . . . . . . . . (26,237) (26,130) (267,725) Total stockholders’ equity . . . . . . . . . . . . . . . . . . . . . . . . . . . . . . . . . . 1,049,951 2,170,612 10,713,786
Commitments and contingencies (note 17)
Total liabilities and stockholders’ equity . . . . . . . . . . . . . . . . . . . . . . . . ¥9,403,709 ¥10,530,847 $95,956,214
See accompanying notes to consolidated financial statements.
35Hitachi, Ltd.Annual Report 2009

Consolidated statements of operationsHitachi, Ltd. and Subsidiaries Years ended March 31, 2009, 2008 and 2007
Millions of yenThousands of
U.S. dollars (note 3)
2009 2008 2007 2009
Revenues:
Product sales . . . . . . . . . . . . . . . . . . . . . . . . . . . . . . . . . . . ¥ 9,076,913 ¥10,262,690 ¥ 9,271,456 $ 92,621,561 Financial and other services . . . . . . . . . . . . . . . . . . . . . . . . 923,456 964,045 976,447 9,423,021 Total revenues . . . . . . . . . . . . . . . . . . . . . . . . . . . . . . . . 10,000,369 11,226,735 10,247,903 102,044,582Cost of sales:
Product sales . . . . . . . . . . . . . . . . . . . . . . . . . . . . . . . . . . . (7,153,228) (8,080,728) (7,392,146) (72,992,123) Financial and other services . . . . . . . . . . . . . . . . . . . . . . . . (662,952) (696,929) (696,225) (6,764,816) Total cost of sales . . . . . . . . . . . . . . . . . . . . . . . . . . . . . . (7,816,180) (8,777,657) (8,088,371) (79,756,939)Selling, general and administrative expenses . . . . . . . . . . . . . (2,057,043) (2,103,562) (1,977,020) (20,990,235)
Impairment losses for long-lived assets (note 18) . . . . . . . . . . (128,400) (87,549) (9,918) (1,310,204)Restructuring charges (note 19) . . . . . . . . . . . . . . . . . . . . . . . (22,927) (18,110) (3,983) (233,949)Interest income . . . . . . . . . . . . . . . . . . . . . . . . . . . . . . . . . . . 19,177 31,501 25,914 195,684Dividends income . . . . . . . . . . . . . . . . . . . . . . . . . . . . . . . . . 8,544 6,031 6,063 87,184Gains on sales of stock by subsidiaries or affiliated companies (note 21) . . . . . . . . . . . . . . . . . . . . . . . . 360 3,846 12,034 3,673Other income (note 20) . . . . . . . . . . . . . . . . . . . . . . . . . . . . . 5,203 101,169 47,687 53,092Interest charges . . . . . . . . . . . . . . . . . . . . . . . . . . . . . . . . . . . (33,809) (42,448) (37,794) (344,990)Other deductions (note 20) . . . . . . . . . . . . . . . . . . . . . . . . . . (102,960) (37,760) (31,466) (1,050,612)Equity in net earnings (loss) of affiliated companies . . . . . . . . (162,205) 22,586 11,289 (1,655,153) Income (loss) before income taxes and minority interests . . (289,871) 324,782 202,338 (2,957,867)
Income taxes (note 9) . . . . . . . . . . . . . . . . . . . . . . . . . . . . . . (505,249) (272,163) (162,814) (5,155,602) Income (loss) before minority interests . . . . . . . . . . . . . . . . (795,120) 52,619 39,524 (8,113,469)
Minority interests . . . . . . . . . . . . . . . . . . . . . . . . . . . . . . . . . . 7,783 (110,744) (72,323) 79,418 Net loss . . . . . . . . . . . . . . . . . . . . . . . . . . . . . . . . . . . . . . . ¥ (787,337) ¥ (58,125) ¥ (32,799) $ (8,034,051)
Net loss per share (note 22): Yen U.S. dollars (note 3)
Basic . . . . . . . . . . . . . . . . . . . . . . . . . . . . . . . . . . . . . . . . . ¥(236.86) ¥(17.48) ¥(9.84) $(2.42) Diluted . . . . . . . . . . . . . . . . . . . . . . . . . . . . . . . . . . . . . . . . (236.87) (17.77) (9.87) (2.42)
See accompanying notes to consolidated financial statements.
36 Hitachi, Ltd.Annual Report 2009

Millions of yenThousands of
U.S. dollars (note 3)
2009 2008 2007 2009
Common stock (notes 10 and 12):
Balance at beginning and end of year . . . . . . . . . . . . . . . . . . . . ¥ 282,033 ¥ 282,033 ¥ 282,033 $ 2,877,888
Capital surplus (note 12):
Balance at beginning of year . . . . . . . . . . . . . . . . . . . . . . . . . . . ¥ 555,410 ¥ 560,796 ¥ 561,484 $ 5,667,449 Change in capital surplus:
Increase (decrease) arising from equity transactions, net transfer of minority interests, and other . . . . . . . . . . . . . . 4,843 (5,457) (3,293) 49,418 Sales of treasury stock . . . . . . . . . . . . . . . . . . . . . . . . . . . . . . (187) 71 153 (1,908) Stock exchange for acquisition (note 14) . . . . . . . . . . . . . . . . – – 2,452 – Total change in capital surplus . . . . . . . . . . . . . . . . . . . . . . 4,656 (5,386) (688) 47,510 Balance at end of year . . . . . . . . . . . . . . . . . . . . . . . . . . . . . . . . ¥ 560,066 ¥ 555,410 ¥ 560,796 $ 5,714,959
Legal reserve and retained earnings (note 13):
Balance at beginning of year . . . . . . . . . . . . . . . . . . . . . . . . . . . ¥1,626,497 ¥1,713,757 ¥1,778,203 $16,596,908 Change in legal reserve and retained earnings:
Increase (decrease) arising from equity transactions, net transfer of minority interests, and other . . . . . . . . . . . . . . 1,224 (9,186) (3,329) 12,490 Net loss . . . . . . . . . . . . . . . . . . . . . . . . . . . . . . . . . . . . . . . . . (787,337) (58,125) (32,799) (8,034,051) Cash dividends . . . . . . . . . . . . . . . . . . . . . . . . . . . . . . . . . . . . (19,944) (19,949) (28,318) (203,510) Total change in legal reserve and retained earnings . . . . . . . (806,057) (87,260) (64,446) (8,225,071) Balance at end of year . . . . . . . . . . . . . . . . . . . . . . . . . . . . . . . . ¥ 820,440 ¥1,626,497 ¥1,713,757 $ 8,371,837
Accumulated other comprehensive loss (note 15):
Balance at beginning of year . . . . . . . . . . . . . . . . . . . . . . . . . . . ¥ (267,198) ¥ (88,450) ¥ (95,997) $ (2,726,510) Change in accumulated other comprehensive loss:
Increase arising from equity transactions, net transfer of minority interests, and other . . . . . . . . . . . . . . 785 376 720 8,010 Other comprehensive income (loss), net of reclassification adjustments . . . . . . . . . . . . . . . . . . . . (319,938) (179,124) 29,246 (3,264,673) Adjustment to initially apply SFAS No. 158 (note 11) . . . . . . . . – – (22,419) – Total change in accumulated other comprehensive loss . . . (319,153) (178,748) 7,547 (3,256,663) Balance at end of year . . . . . . . . . . . . . . . . . . . . . . . . . . . . . . . . ¥ (586,351) ¥ (267,198) ¥ (88,450) $ (5,983,173)
Treasury stock, at cost (note 14):
Balance at beginning of year . . . . . . . . . . . . . . . . . . . . . . . . . . . ¥ (26,130) ¥ (25,339) ¥ (17,950) $ (266,633) Change in treasury stock, at cost:
Acquisition of treasury stock . . . . . . . . . . . . . . . . . . . . . . . . . . (858) (1,145) (12,000) (8,755) Sales of treasury stock . . . . . . . . . . . . . . . . . . . . . . . . . . . . . . 751 354 748 7,663 Stock exchange for acquisition . . . . . . . . . . . . . . . . . . . . . . . . – – 3,863 – Total change in treasury stock, at cost . . . . . . . . . . . . . . . . (107) (791) (7,389) (1,092) Balance at end of year . . . . . . . . . . . . . . . . . . . . . . . . . . . . . . . . ¥ (26,237) ¥ (26,130) ¥ (25,339) $ (267,725)
(Continued on following page.)
Consolidated statements of stockholders’ equityHitachi, Ltd. and Subsidiaries Years ended March 31, 2009, 2008 and 2007
37Hitachi, Ltd.Annual Report 2009

Millions of yenThousands of
U.S. dollars (note 3)
2009 2008 2007 2009
Total stockholders’ equity:
Balance at beginning of year . . . . . . . . . . . . . . . . . . . . . . . . . ¥ 2,170,612 ¥2,442,797 ¥2,507,773 $ 22,149,102 Change in total stockholders’ equity:
Increase (decrease) arising from equity transactions, net transfer of minority interests, and other . . . . . . . . . . . . 6,852 (14,267) (5,902) 69,918 Net loss . . . . . . . . . . . . . . . . . . . . . . . . . . . . . . . . . . . . . . . (787,337) (58,125) (32,799) (8,034,051) Other comprehensive income (loss), net of reclassification adjustments . . . . . . . . . . . . . . . . . . (319,938) (179,124) 29,246 (3,264,673) Adjustment to initially apply SFAS No. 158 (note 11) . . . . . . – – (22,419) – Cash dividends . . . . . . . . . . . . . . . . . . . . . . . . . . . . . . . . . . (19,944) (19,949) (28,318) (203,510) Acquisition of treasury stock . . . . . . . . . . . . . . . . . . . . . . . . (858) (1,145) (12,000) (8,755) Sales of treasury stock . . . . . . . . . . . . . . . . . . . . . . . . . . . . 564 425 901 5,755 Stock exchange for acquisition . . . . . . . . . . . . . . . . . . . . . . – – 6,315 – Total change in total stockholders’ equity . . . . . . . . . . . . (1,120,661) (272,185) (64,976) (11,435,316) Balance at end of year . . . . . . . . . . . . . . . . . . . . . . . . . . . . . . ¥ 1,049,951 ¥2,170,612 ¥2,442,797 $ 10,713,786
Comprehensive loss (note 15):
Net loss . . . . . . . . . . . . . . . . . . . . . . . . . . . . . . . . . . . . . . . . . ¥ (787,337) ¥ (58,125) ¥ (32,799) $ (8,034,051) Other comprehensive income (loss) arising during the year:
Foreign currency translation adjustments . . . . . . . . . . . . . . (110,899) (48,605) 21,764 (1,131,622) Minimum pension liability adjustments . . . . . . . . . . . . . . . . – – 22,030 – Pension liability adjustments . . . . . . . . . . . . . . . . . . . . . . . . (184,153) (74,758) – (1,879,112) Net unrealized holding gain on available-for-sale securities . . (22,855) (55,310) (14,744) (233,214) Cash flow hedges . . . . . . . . . . . . . . . . . . . . . . . . . . . . . . . . (2,031) (451) 196 (20,725) Total other comprehensive income (loss) arising during the year . . . . . . . . . . . . . . . . . . . . . . . . . . . . . . . (319,938) (179,124) 29,246 (3,264,673) Comprehensive loss . . . . . . . . . . . . . . . . . . . . . . . . . . . . . . . . ¥(1,107,275) ¥ (237,249) ¥ (3,553) $(11,298,724)
See accompanying notes to consolidated financial statements.
38 Hitachi, Ltd.Annual Report 2009

Millions of yenThousands of
U.S. dollars (note 3)
2009 2008 2007 2009
Cash flows from operating activities (note 24): Net loss . . . . . . . . . . . . . . . . . . . . . . . . . . . . . . . . . . . . . . . . . . . . . . . . . . ¥(787,337) ¥ (58,125) ¥ (32,799) $(8,034,051) Adjustments to reconcile net loss to net cash provided by operating activities: Depreciation . . . . . . . . . . . . . . . . . . . . . . . . . . . . . . . . . . . . . . . . . . . . . 478,759 541,470 472,175 4,885,296 Amortization . . . . . . . . . . . . . . . . . . . . . . . . . . . . . . . . . . . . . . . . . . . . . 178,164 146,136 149,823 1,818,000 Impairment losses for long-lived assets . . . . . . . . . . . . . . . . . . . . . . . . 128,400 87,549 9,918 1,310,204 Deferred income taxes . . . . . . . . . . . . . . . . . . . . . . . . . . . . . . . . . . . . . 403,968 84,587 20,514 4,122,122 Equity in net (earnings) loss of affiliated companies . . . . . . . . . . . . . . . . 162,205 (22,586) (11,289) 1,655,153 Gain on sale of investments and subsidiaries’ common stock . . . . . . . (1,353) (94,798) (53,240) (13,806) Impairment of investments in securities . . . . . . . . . . . . . . . . . . . . . . . . 45,016 14,411 8,309 459,347 Loss on disposal of rental assets and other property . . . . . . . . . . . . . . 24,483 13,424 31,590 249,826 Income (loss) applicable to minority interests . . . . . . . . . . . . . . . . . . . . (7,783) 110,744 72,323 (79,418) Decrease in receivables . . . . . . . . . . . . . . . . . . . . . . . . . . . . . . . . . . . . 342,008 47,843 52,599 3,489,878 Increase in inventories . . . . . . . . . . . . . . . . . . . . . . . . . . . . . . . . . . . . . (57,206) (107,546) (212,028) (583,735) (Increase) decrease in prepaid expenses and other current assets . . . . 12,772 (32,763) (80,172) 130,327 Increase (decrease) in payables . . . . . . . . . . . . . . . . . . . . . . . . . . . . . . (359,230) 42,453 104,987 (3,665,612) Decrease in accrued expenses and retirement and severance benefits . (27,050) (38,303) (21,166) (276,020) Increase (decrease) in accrued income taxes . . . . . . . . . . . . . . . . . . . . (76,343) 12,841 18,623 (779,010) Increase in other liabilities . . . . . . . . . . . . . . . . . . . . . . . . . . . . . . . . . . . 39,711 61,041 38,470 405,214 Net change in inventory-related receivables from financial services . . . . 2,117 (11,392) (9,819) 21,602 Other . . . . . . . . . . . . . . . . . . . . . . . . . . . . . . . . . . . . . . . . . . . . . . . . . . 57,646 (5,149) 56,224 588,224 Net cash provided by operating activities . . . . . . . . . . . . . . . . . . . . . 558,947 791,837 615,042 5,703,541
Cash flows from investing activities (note 24): (Increase) decrease in short-term investments . . . . . . . . . . . . . . . . . . . . . 50,811 (25,437) 25,054 518,480 Capital expenditures . . . . . . . . . . . . . . . . . . . . . . . . . . . . . . . . . . . . . . . . (422,109) (474,344) (497,771) (4,307,235) Purchase of assets to be leased . . . . . . . . . . . . . . . . . . . . . . . . . . . . . . . (307,314) (365,989) (441,614) (3,135,857) Collection of investments in leases . . . . . . . . . . . . . . . . . . . . . . . . . . . . . . 234,984 311,321 318,063 2,397,796 Proceeds from disposal of rental assets and other property . . . . . . . . . . . 46,511 63,067 43,982 474,602 Proceeds from sale of investments and subsidiaries’ common stock . . . . . 58,260 161,442 69,842 594,490 Purchase of investments and subsidiaries’ common stock . . . . . . . . . . . . (56,637) (254,569) (169,530) (577,929) Purchase of software . . . . . . . . . . . . . . . . . . . . . . . . . . . . . . . . . . . . . . . . (132,181) (126,453) (123,876) (1,348,786) Other . . . . . . . . . . . . . . . . . . . . . . . . . . . . . . . . . . . . . . . . . . . . . . . . . . . . (22,333) 73,344 (10,320) (227,888) Net cash used in investing activities . . . . . . . . . . . . . . . . . . . . . . . . . (550,008) (637,618) (786,170) (5,612,327)
Cash flows from financing activities (note 24): Increase (decrease) in short-term debt, net . . . . . . . . . . . . . . . . . . . . . . . 314,899 (200,018) 93,917 3,213,255 Proceeds from long-term debt . . . . . . . . . . . . . . . . . . . . . . . . . . . . . . . . . 467,341 404,190 380,646 4,768,786 Payments on long-term debt . . . . . . . . . . . . . . . . . . . . . . . . . . . . . . . . . . (441,550) (381,069) (309,204) (4,505,612) Proceeds from sale of common stock by subsidiaries . . . . . . . . . . . . . . . 900 42,307 23,078 9,183 Dividends paid to stockholders . . . . . . . . . . . . . . . . . . . . . . . . . . . . . . . . (19,826) (19,889) (28,243) (202,306) Dividends paid to minority stockholders of subsidiaries . . . . . . . . . . . . . . (28,406) (25,787) (20,761) (289,857) Acquisition of subsidiaries’ common stock for treasury . . . . . . . . . . . . . . (8,693) (4,570) (7,075) (88,704) Acquisition of common stock for treasury . . . . . . . . . . . . . . . . . . . . . . . . . (841) (1,145) (12,000) (8,582) Proceeds from sales of treasury stock . . . . . . . . . . . . . . . . . . . . . . . . . . . 564 425 901 5,755 Net cash provided by (used in) financing activities . . . . . . . . . . . . . . . 284,388 (185,556) 121,259 2,901,918
Effect of exchange rate changes on cash and cash equivalents . . . . . . . . . . (46,361) (25,569) 9,480 (473,071)Net increase (decrease) in cash and cash equivalents . . . . . . . . . . . . . . . . . 246,966 (56,906) (40,389) 2,520,061Cash and cash equivalents at beginning of year . . . . . . . . . . . . . . . . . . . . . 560,960 617,866 658,255 5,724,082Cash and cash equivalents at end of year . . . . . . . . . . . . . . . . . . . . . . . . . . ¥ 807,926 ¥ 560,960 ¥ 617,866 $ 8,244,143
See accompanying notes to consolidated financial statements.
Consolidated statements of Cash FlowsHitachi, Ltd. and Subsidiaries Years ended March 31, 2009, 2008 and 2007
39Hitachi, Ltd.Annual Report 2009

1. NAturE of opErAtioNS
Hitachi, Ltd. (the Company) is a Japanese corporation, whose principal office is located in Japan. The Company’s and its subsidiaries’ businesses are diverse, and include information and telecommunication systems, electronic devices, power and industrial systems, digital media and consumer products, high functional materials and components, and other services including financial services and logistics services.
2. BASiS of prESENtAtioN ANd SummAry of SigNificANt AccouNtiNg poLiciES
(a) Basis of PresentationThe Company and its domestic subsidiaries keep their books of account in accordance with the financial accounting standards of Japan, and its foreign subsidiaries in accordance with those of the countries of their domicile.
The consolidated financial statements presented herein have been prepared in a manner and reflect the adjustments which are necessary to conform them with accounting principles generally accepted in the United States of America. Management of the Company has made a number of estimates and assumptions relating to the reporting of assets and liabilities and the disclosure of contingent assets and liabilities to prepare these financial statements. Actual results could differ from those estimates.
(b) Principles of ConsolidationThe consolidated financial statements include the accounts of the Company, its majority-owned subsidiaries and all variable interest entities (VIEs) for which the Company or any of its consolidated entities is the primary beneficiary. A VIE is defined in Financial Accounting Standards Board (FASB) Interpretation No. 46 (revised December 2003), “Consolidation of Variable Interest Entities, an interpretation of Accounting Research Bulletin No. 51.” This interpretation addresses how a business enterprise should evaluate whether it has a controlling financial interest in an entity through means other than voting rights and accordingly should consolidate the entity. The consolidated financial statements include accounts of certain subsidiaries whose fiscal year-end differs from March 31 by 93 days or less to either comply with local statutory requirements or facilitate timely reporting. There have been no significant transactions, which would materially affect the Company’s financial position and results of operations, with such subsidiaries during the period from their fiscal year-end to March 31. Intercompany accounts and significant intercompany transactions have been eliminated in consolidation.
Investments in corporate joint ventures and affiliated companies, where the Company has the ability to exercise significant influence over operational and financial policies generally by holding 20–50% ownership, are accounted for under the equity method. Investments where the Company does not have significant influence are accounted for under the cost method.
(c) Cash EquivalentsFor the purpose of the statement of cash flows, the Company considers all highly liquid investments with insignificant risk of changes in value which have initial maturities of three months or less when purchased to be cash equivalents.
(d) Allowance for Doubtful ReceivablesAllowance for doubtful receivables, including both trade receivables and investments in leases, is the Company’s and subsidiaries’ best estimate of the amount of probable credit losses in their existing receivables. The allowance is determined based on, but not limited to, historical collection experience adjusted for the effects of the current economic environment, assessment of inherent risks, aging and financial performance of debtors. Account balances are charged off against the allowance after all means of collection have been exhausted and the potential for recovery is considered remote.
(e) Foreign Currency TranslationForeign currency financial statements have been translated in accordance with Statement of Financial Accounting Standards (SFAS) No. 52, “Foreign Currency Translation.” Under this standard, the assets and liabilities of the Company’s subsidiaries located outside Japan are translated into Japanese yen at the rates of exchange in effect at the balance sheet date. Income and expense items are translated at the average exchange rates prevailing during the year. Gains and losses resulting from foreign currency transactions are included in other income (deductions), and those resulting from translation of financial statements are excluded from the consolidated statements of operations and included in accumulated other comprehensive loss as part of stockholders’ equity.
notes to Consolidated Financial statementsHitachi, Ltd. and Subsidiaries
40 Hitachi, Ltd.Annual Report 2009

(f) Investments in Securities and Affiliated CompaniesEquity securities that do not have readily determinable fair values, except for equity-method investments, are accounted for under the cost method. The Company classifies investments in equity securities that have readily determinable fair values and all investments in debt securities in three categories: held-to-maturity securities, trading securities and available-for-sale securities.
Held-to-maturity securities are debt securities that the Company has the positive intent and ability to hold to maturity. Trading securities are debt and equity securities that are bought and held principally for the purpose of selling them in the near term. Available-for-sale securities are debt and equity securities not classified as either held-to-maturity securities or trading securities.
Held-to-maturity securities are reported at amortized cost. Trading securities are reported at fair value, with unrealized gains and losses included in earnings. Available-for-sale securities are reported at fair value, with unrealized gains and losses reported in other comprehensive income.
A decline in fair value of any available-for-sale security, held-to-maturity security or cost-method investment below the cost basis or the amortized cost basis that is deemed to be other-than-temporary results in a write-down of the cost basis or the amortized cost basis to fair value as a new cost basis and the amount of the write-down is included in earnings. On a continuous basis, but no less frequently than at the end of each quarter period, the Company evaluates an available-for-sale security, a held-to-maturity security and a cost-method investment for possible impairment. Fair value is determined based on quoted market prices, projected discounted cash flows or other valuation techniques as appropriate. For certain cost-method investments for which it is not practicable to estimate the fair value, if an event or change in circumstances has occurred that may have a significant adverse effect on the fair value of the investment, the Company estimates the fair value of the investments. Factors considered in determining whether an impairment of an available-for-sale security or cost-method investment is other-than-temporary include: the length of time and extent to which the fair value of the investment has been less than cost, the financial condition and near-term prospect of the issuer, and the intent and ability to retain the investment in the issuer for a period of time sufficient to allow for any anticipated recovery in fair value. Factors considered in assessing whether an impairment of a held-to-maturity security is other-than-temporary include the financial condition, business prospects and credit worthiness of the issuer.
On a continuous basis, but no less frequently than at the end of each quarter period, the Company evaluates the carrying amount of its ownership interests in equity-method investees for possible impairment. Factors considered in assessing whether an indication of other-than-temporary impairment exists include the achievement of business plan objectives and milestones including cash flow projections and the results of planned financing activities, the financial condition and prospects of each investee company, the fair value of the ownership interest relative to the carrying amount of the investment, the period of time during which the fair value of the ownership interest has been below the carrying amount of the investment and other relevant factors. Impairment to be recognized is measured based on the amount by which the carrying amount of the investment exceeds the fair value of the investment. Fair value is determined based on quoted market prices, projected discounted cash flows or other valuation techniques as appropriate.
The cost of a security sold or the amount reclassified out of accumulated other comprehensive loss into earnings is determined by the average cost method.
(g) SecuritizationsThe Company and certain subsidiaries have a number of securitization programs. Under those programs, certain financial assets such as lease receivables, trade receivables and others are sold to Special Purpose Entities (SPEs) which are mainly funded through the issuance of asset-backed securities to investors. When a transfer of financial assets is eligible to be accounted for as a sale under SFAS No. 140, “Accounting for Transfers and Servicing of Financial Assets and Extinguishments of Liabilities,” the carrying amount of the financial assets is allocated based on relative fair values to the portions to be retained and sold. The Company and its subsidiaries recognize a gain or loss for the difference between the net proceeds received and the allocated carrying amount of the assets sold when the transaction is consummated. Initially recorded at allocated carrying amount in the period of securitizations, the amount of retained interests that can contractually be prepaid or otherwise settled in such a way that the holder would not recover all of its recorded interests is subsequently recorded at fair value as of the balance sheet date in the same manner for the available-for-sale securities.
41Hitachi, Ltd.Annual Report 2009

Fair values are based on the present value of estimated future cash flows which take into consideration various factors such as expected credit loss and others.
(h) InventoriesInventories are stated at the lower of cost or market. Cost is determined by the specific identification method for job order inventories and generally by the average cost method for raw materials and other inventories.
(i) Property, Plant and EquipmentProperty, plant and equipment are stated at cost. Property, plant and equipment are principally depreciated by the declining-balance method, except for some assets which are depreciated by the straight-line method, mainly over the following estimated useful lives:
Buildings Buildings and building equipment . . . . . . . . . . . . . . . . . . . . . . . . . . . . . . . . . . . . . . . . . . . . . . 3 to 50 years Structures . . . . . . . . . . . . . . . . . . . . . . . . . . . . . . . . . . . . . . . . . . . . . . . . . . . . . . . . . . . . . . . 7 to 60 yearsMachinery and equipment Machinery . . . . . . . . . . . . . . . . . . . . . . . . . . . . . . . . . . . . . . . . . . . . . . . . . . . . . . . . . . . . . . . 4 to 12 years Vehicles . . . . . . . . . . . . . . . . . . . . . . . . . . . . . . . . . . . . . . . . . . . . . . . . . . . . . . . . . . . . . . . . . 4 to 7 years Tools, furniture and fixtures . . . . . . . . . . . . . . . . . . . . . . . . . . . . . . . . . . . . . . . . . . . . . . . . . . . 2 to 20 years
Effective April 1, 2007, the Company and its domestic subsidiaries elected to change the fixed-percentage-on-declining base application to the 250% declining balance application primarily for machinery and equipment used for manufacturing. Under the fixed-percentage-on-declining base application, the fixed percentage was a function of the estimated useful life of the asset and the estimated salvage value. Estimated salvage values were also reduced in connection with this change. This change resulted from changes in the pattern of usage of long-lived depreciable assets concluded by a study about such usage. The Company and its domestic subsidiaries believe that the new method is preferable because it better reflects the pattern of consumption of the future benefits derived from those assets and makes a better cost allocation to match revenues generated by those assets during their estimated useful lives.
In accordance with the “Change in Accounting Estimate” provisions of SFAS No. 154, “Accounting Changes and Error Corrections, a replacement of Accounting Principles Board (APB) Opinion No. 20 and FASB Statement No. 3,” the change in depreciation method is accounted for on a prospective basis from the beginning of the period of change and results for prior periods have not been restated.
The effect of the change was to reduce income before income taxes and minority interests by ¥38,379 million and increase net loss by ¥20,316 million, or ¥6.11 per share (basic) for the year ended March 31, 2008.
(j) Goodwill and Other Intangible AssetsThe Company tests goodwill and indefinite-lived intangible assets for impairment at least annually. The Company performs its annual impairment test mainly during the fourth quarter after the annual forecasting process is completed. Furthermore, goodwill is reviewed for impairment whenever events or changes in circumstances indicate that the carrying value may not be recoverable. The impairment test consists of two steps. In the first step, the Company compares the fair value of each reporting unit to its carrying value. The Company has certain operating segments and, in identifying the reporting unit for the purpose of testing goodwill for impairment, considers disaggregating those operating segments into economically dissimilar components based on specific facts and circumstances, especially the level at which performance of the operating segments are reviewed, how many businesses are included in the operating segments, and the economic similarity of those businesses. In assigning goodwill to reporting units, the Company considers which reporting units are expected to benefit from the synergies of the combination in a manner similar to how the amount of goodwill is recognized in a business combination. The Company determines the fair value of its reporting units mainly using an income approach (i.e., present value technique). When determining such fair value, the Company may, however, also use the fair value of that unit based on a comparison of comparable publicly traded companies or based on that unit’s stand-alone market capitalization. If the carrying value of the net assets assigned to the reporting unit exceeds the fair value of the reporting unit, then the Company performs the second step of the impairment test in order to determine the implied fair value of the reporting unit’s goodwill. If the carrying value of a reporting unit’s goodwill exceeds its implied fair value, the Company records an impairment loss equal to the difference. Intangible assets with finite
42 Hitachi, Ltd.Annual Report 2009

useful lives are amortized over their respective estimated useful lives on either a straight-line basis or the method that reflects the pattern in which the economic benefits of the intangible assets are consumed or otherwise used up. The principal estimated useful lives are as follows:
Software . . . . . . . . . . . . . . . . . . . . . . . . . . . . . . . . . . . . . . . . . . . . . . . . . . . . . . . . . . . . . . . . 1 to 10 years Software for internal use . . . . . . . . . . . . . . . . . . . . . . . . . . . . . . . . . . . . . . . . . . . . . . . . . . . . 2 to 10 years Patents . . . . . . . . . . . . . . . . . . . . . . . . . . . . . . . . . . . . . . . . . . . . . . . . . . . . . . . . . . . . . . . . . 4 to 8 years Other . . . . . . . . . . . . . . . . . . . . . . . . . . . . . . . . . . . . . . . . . . . . . . . . . . . . . . . . . . . . . . . . . . . 5 to 20 years
(k) Capitalized Software CostsCosts incurred for computer software developed or obtained for internal use are capitalized and amortized on a straight-line basis over their estimated useful lives in accordance with Statement of Position (SOP) 98-1, “Accounting for the Costs of Computer Software Developed or Obtained for Internal Use.” In addition, the Company and its subsidiaries develop certain computer software to be sold where related costs are capitalized after establishment of technological feasibility in accordance with SFAS No. 86, “Accounting for the Costs of Computer Software to Be Sold, Leased, or Otherwise Marketed.” The annual amortization of such capitalized costs is the greater of the amount computed using the ratio of each software’s current year gross revenues to the total of current and anticipated future gross revenues or the straight-line method over the remaining estimated economic life of each software.
(l) Impairment of Long-lived AssetsThe Company reviews the carrying value of long-lived assets or a related group of assets to be held and used, including intangible assets with finite useful lives, for impairment whenever events or circumstances occur that indicate that the carrying value of the assets may not be recoverable. The assets are considered to be impaired when estimated undiscounted cash flows expected to result from the use of the assets and their eventual disposition is less than their carrying values. The impairment losses are measured as the amount by which the carrying value of the asset or asset group exceeds the fair value. In determining the fair value, the Company uses available quoted market prices and present value techniques, if appropriate, based on the estimated future cash flows expected to result from the use of the assets and their eventual disposition.
(m) Retirement and Severance BenefitsThe Company accounts for retirement and severance benefits in accordance with SFAS No. 87, “Employers’ Accounting for Pensions,” and SFAS No. 158, “Employers’ Accounting for Defined Benefit Pension and Other Postretirement Plans, an amendment of FASB Statements No. 87, 88, 106, and 132(R).” Actuarial gains and losses and prior service benefit and cost included in accumulated other comprehensive loss are amortized using the straight-line method over the average remaining service period of active employees. Prior to the adoption of the recognition provisions of SFAS No. 158 on March 31, 2007, unrecognized actuarial gains and losses and unrecognized prior service benefit and cost were amortized using the straight-line method over the average remaining service period of active employees.
(n) Environmental LiabilitiesThe cost for environmental remediation liabilities is accrued when it is probable that the Company incurs environmental assessments or cleanup costs and the amounts can be reasonably estimated. The cost for liabilities is estimated based on the circumstances, the available information and current law, and the liabilities are not discounted to their present values.
(o) Derivative Financial InstrumentsThe Company accounts for derivative financial instruments in accordance with SFAS No. 133, “Accounting for Derivative Instruments and Hedging Activities,” as amended. SFAS No. 133 requires that all derivative financial instruments, such as forward exchange and interest rate swap contracts, be recognized in the financial statements as either assets or liabilities and measured at fair value regardless of the purpose or intent for holding them.
The Company designates and accounts for hedging derivatives as follows:
• “Fairvalue”hedge:ahedgeofthefairvalueofarecognizedassetorliabilityorofanunrecognizedfirmcommitment.Thechanges in fair value of the recognized assets or liabilities or unrecognized firm commitments and the related derivatives are both recorded in earnings if the hedge is considered highly effective.
43Hitachi, Ltd.Annual Report 2009

• “Cashflow”hedge:ahedgeofaforecastedtransactionorofthevariabilityofcashflowstobereceivedorpaidrelatedtoa recognized asset or liability. The changes in the fair value of the derivatives designated as cash flow hedges are recorded as other comprehensive income if the hedge is considered highly effective. This treatment is continued until earnings are affected by the variability in cash flows or the unrecognized firm commitment of the designated hedged item, at which point changes in fair value of the derivative are recognized in income.
• “Foreigncurrency”hedge:ahedgeofforeign-currencyfairvalueorcashflow.Thechangesinfairvalueoftherecognizedassets or liabilities or unrecognized firm commitments and the derivatives are recorded as either earnings or other comprehensive income if the hedge is considered highly effective. Recognition as earnings or other comprehensive income is dependent on the treatment of foreign currency hedges as either fair value or cash flow hedges.
The Company follows the documentation requirements as prescribed by the standard, which includes risk management objective and strategy for undertaking various hedge transactions. In addition, a formal assessment is made at the hedge’s inception and periodically on an ongoing basis, as to whether the derivative used in hedging activities is highly effective in offsetting changes in fair values or cash flows of hedged items. Hedge accounting is discontinued for ineffective hedges, if any. Subsequent changes in the fair value of derivatives related to discontinued hedges are recognized in earnings immediately.
(p) Revenue RecognitionThe Company recognizes revenue when persuasive evidence of an arrangement exists, delivery has occurred or services have been rendered, the sales price is fixed or determinable, and collectibility is reasonably assured.
The Company offers multiple solutions to its customers’ needs. Those solutions may involve the delivery or performance of multiple elements, such as products, services, or rights to use assets, and performance may occur at different points in time or over different periods of time. When one element is delivered prior to the other in an arrangement, revenue is deferred until the delivery of the last element, unless transactions are such that the delivered item has value to the customer on a standalone basis, there is objective and reliable evidence of the fair value of the undelivered item, and delivery or performance of the undelivered item is considered probable and substantially in the control of the Company if the arrangement includes a general right of return relative to the delivered item. If all conditions described above are met, each element in an arrangement is considered a separate unit of accounting, and the arrangement consideration is allocated to the separate units of accounting based on the relative fair values provided that there is objective and reliable evidence of the fair values of all units of accounting in the arrangement. The Company allocates revenue for software arrangements involving multiple elements to each element based on its relative fair value, as evidenced by vendor specific objective evidence (VSOE), or in the absence of VSOE of the delivered elements, the residual method. VSOE is the price charged by the Company to an external customer for the same element when such an element is sold separately.
Product Sales:
Revenue from sales of products is recognized when title and risk of loss have been transferred to the customer depending upon the terms of the contract or arrangement with the customer. The Company’s policy is not to accept product returns unless the products are defective. The conditions of delivery are governed by the terms of the contract or customer arrangement and those not meeting the predetermined specification are not recorded as revenue. When the final payment is subject to customer acceptance, a portion of revenue for the amount of the final payment is deferred until an enforceable claim has become effective. Product warranties are offered on the Company’s and certain subsidiaries’ products (in certain cases separately priced) and a warranty accrual is established when sales are recognized based on estimated future costs of repair and replacement principally using historical experience of warranty claims.
Price protection is provided to retailers of the Company’s consumer products business and others to compensate the customer retailers for a decline in the product’s value due mainly to competition. Price protection granted to the customers is classified as a reduction of revenue in the consolidated statements of operations. In addition, it is the Company’s policy to accrue reasonably and reliably estimated price adjustments at the later of the date at which the related sales are recognized, or the date at which price protection is offered. The estimate is made based primarily upon historical experience or agreement on the adjustment rate and the number of units that are subject to such adjustment (e.g., units in distribution channels).
Product revenues which are recognized upon delivery, installation or acceptance by the customer are information technology system products, construction equipment, displays, disk drives, televisions, air conditioners, batteries, magnetic tapes, high functional materials, cable products, automotive equipment, semiconductor manufacturing equipment, test and measurement equipment, railway vehicles, medical electronic devices, industrial machinery and equipment, elevators and escalators.
44 Hitachi, Ltd.Annual Report 2009

Revenue from sales of tangible products under long-term construction type arrangements, in connection with the construction of nuclear, thermal and hydroelectric power plants, are recognized under the percentage-of-completion method. Under the percentage-of-completion method, revenue is recognized as a percentage of estimated total revenue that incurred costs to date bear to estimated total costs after giving effect to estimates of costs to complete based upon the most recent information. Any anticipated losses on fixed price contracts are charged to operations when such losses can be estimated. Provisions are made for contingencies (i.e. performance penalty, benchmarking, etc.) in the period in which they become known pursuant to specific contract terms and conditions and are estimable. When reasonably dependable estimates of contract revenues and costs and the extent of progress toward completion do not exist, the completed-contract method of accounting is applied. A contract is complete when either acceptance by the customer is given or compliance with performance specification is achieved, whichever is appropriate under the relevant contractual terms.
The Company recognizes software revenue in accordance with the provisions of SOP 97-2, “Software Revenue Recognition,” as amended. Revenue from software consists primarily of software licensing, customized software development and post contract customer support. Revenues from software license arrangements are recognized upon delivery of the software if evidence of the arrangement exists, pricing is fixed or determinable and collectibility is reasonably assured. Revenue from a software arrangement that requires significant production, modification or customization of software is recognized using the percentage-of-completion method provided that reasonably dependable estimates related to contract revenue, cost and the extent of progress toward completion exist. Otherwise, the completed-contract method is applied. Customization of software is considered substantially completed when an acceptance by the customer occurs. Revenue from post contract customer support is amortized over the period of the post contract customer support. Consulting and training services revenues are recognized when the services are rendered.
Service Revenues:
Service revenues from maintenance and distribution services are recognized upon completion of service delivery. Revenue from time-based service contracts is recognized as services are rendered. Revenue from long-term fixed price service contracts such as support or maintenance contracts is recognized ratably over the contractual period. If historical data shows that the accrual of service cost is not fixed and the service is rendered in proportion to the accrual of the cost for the service, revenue is recognized based on the pattern of the cost accrual. Finance lease income is recognized at level rates of return over the term of the leases. Operating lease income is recognized on a straight-line basis over the term of the lease.
(q) Shipping and Handling CostsShipping and handling costs are expensed as incurred and included in selling, general and administrative expenses.
(r) AdvertisingAdvertising costs are expensed as incurred.
(s) Research and Development CostsResearch and development costs are expensed as incurred. Costs incurred in connection with the development of software products for sale or lease to others are accounted for in accordance with SFAS No. 86, “Accounting for the Costs of Computer Software to Be Sold, Leased or Otherwise Marketed.” Development costs incurred in the research and development of new software products and enhancements to existing products are expensed as incurred until technological feasibility has been established.
(t) Income TaxesThe Company adopted FASB Interpretation No. 48, “Accounting for Uncertainty in Income Taxes, an interpretation of FASB Statement No. 109,” as of April 1, 2007, resulting in a cumulative effect of adoption of ¥3,667 million included in “Increase (decrease) arising from equity transaction, net transfer of minority interest, and other” in the consolidated statements of stockholders’ equity as an adjustment to the opening balance of retained earnings.
Tax positions that are more likely than not to be sustained upon examination by tax authorities are recognized in the financial statements. Tax positions that meet the more-likely-than-not recognition threshold are measured as the largest amount of tax benefit that is greater than 50 percent likely of being realized upon ultimate settlement with tax authorities. Interest accrued related to unrecognized tax benefits and penalties are included in income taxes in the consolidated statements of operations.
45Hitachi, Ltd.Annual Report 2009

Deferred income taxes are accounted for under the asset and liability method in accordance with SFAS No. 109, “Accounting for Income Taxes.” Deferred tax assets and liabilities are recognized for the future tax consequences attributable to differences between the financial statement carrying amounts of existing assets and liabilities and their respective tax bases and operating losses and tax credit carryforwards. Under this method, deferred tax assets and liabilities are measured using enacted tax rates expected to apply to taxable income in the years in which those temporary differences are expected to be recovered or settled. Under SFAS No. 109, the effect on deferred tax assets and liabilities of a change in tax rates is recognized in income in the period that includes the enactment date. Valuation allowances are established to reduce deferred tax assets to their net realizable value if it is more likely than not that some portion or all of the deferred tax assets will not be realized.
(u) Sales of Stock by SubsidiariesThe change in the Company’s proportionate share of a subsidiary’s equity resulting from issuance of stock by the subsidiary is recognized in the accompanying consolidated statements of operations.
(v) Consumption TaxConsumption tax collected and remitted to taxing authorities is excluded from revenues, cost of sales and expenses in the consolidated statements of operations.
(w) Net Income Per ShareNet income per share is computed in accordance with SFAS No. 128, “Earnings per Share.” This standard requires a dual presentation of basic and diluted net income per share amounts on the face of the statements of operations. Under this standard, basic net income per share is computed based upon the weighted average number of shares of common stock outstanding during each year. Diluted net income per share reflects the potential dilution that could occur if securities or other contracts to issue common stock were exercised or converted into common stock or resulted in the issuance of common stock that then shared in the earnings of the Company.
(x) Stock-Based CompensationThe Company and certain subsidiaries have stock-based compensation plans. Effective April 1, 2006, the Company adopted the fair value recognition provisions of SFAS No. 123 (revised 2004), “Share-Based Payment,” which is a revision of SFAS No. 123, “Accounting for Stock-Based Compensation.” This statement requires all share-based payments to employees, including grants of employee stock options, to be recognized in the income statement based on their fair values. Adoption of this statement had no material effect on the consolidated results of operations of the Company and subsidiaries, and their cash flows for the year ended March 31, 2007.
(y) Disclosures about Segments of an Enterprise and Related InformationSFAS No. 131, “Disclosures about Segments of an Enterprise and Related Information,” establishes standards about how a public business enterprise is required to report financial and descriptive information about its operating segments. This standard defines operating segments as components of an enterprise for which separate financial information is available and evaluated regularly as a means for assessing segment performance and allocating resources to segments. Measures of profit or loss, total assets and other related information are required to be disclosed for each operating segment. Furthermore, this standard requires the disclosure of information concerning revenues derived from the enterprise’s products or services, countries in which it earns revenue or holds assets and major customers. Certain foreign private issuers (FPIs) are presently exempted from the segment disclosure requirements of SFAS No. 131 in filings with the United States Securities and Exchange Commission (SEC) under the Securities Exchange Act of 1934, and the Company has not presented the segment information required to be disclosed in the footnotes to the consolidated financial statements based on the provisions of SFAS No. 131. However, in September 2008, SEC issued its “Foreign Issuer Reporting Enhancements” (FIRE) rule. The FIRE rule eliminates an instruction to the Form 20-F that is filed under the Securities Exchange Act of 1934 that permitted certain FPIs to omit segment disclosures required by SFAS No. 131, as well as other enhancements. This aspect of the FIRE rule regarding elimination of ability to omit segment disclosures is effective for fiscal years ending on or after December 15, 2009.
(z) GuaranteesThe Company recognizes, at the inception of the guarantee, a liability for the fair value of the obligation undertaken in issuing the guarantee in accordance with the FASB Interpretation No. 45, “Guarantor’s Accounting and Disclosure Requirements for Guarantees, Including Indirect Guarantees of Indebtedness of Others, an interpretation of SFAS No. 5, 57, and 107 and rescission of FASB Interpretation No. 34.”
46 Hitachi, Ltd.Annual Report 2009

(aa) Sabbatical Leave and Other Similar BenefitsThe Company adopted the provisions of Emerging Issues Task Force (EITF) Issue No. 06-2, “Accounting for Sabbatical Leave and Other Similar Benefits Pursuant to FASB Statement No. 43” on April 1, 2007, with no material effect included in “Increase (decrease) arising from equity transaction, net transfer of minority interest, and other” in the consolidated statements of stockholders’ equity as a cumulative-effect adjustment to the opening balance of retained earnings.
(ab) Fair Value MeasurementThe Company adopted the provisions of SFAS No. 157, “Fair Value Measurements” on April 1, 2008. SFAS No. 157 defines fair value as the price that would be received to sell an asset or paid to transfer a liability (an exit price) in an orderly transaction between market participants at the measurement date. For the determination of fair value, the Company considers the principal or most advantageous market where the Company would transact and considers assumptions that market participants would use in pricing the asset or liability. In February 2008, the FASB issued FASB Staff Position (FSP) No. FAS 157-2, “Effective Date of FASB Statement No. 157” (FSP 157-2). FSP 157-2 defers the effective date of SFAS No. 157 for all non-financial assets and non-financial liabilities, except for items that are recognized or disclosed at fair value in the financial statements on a recurring basis (at least annually), to fiscal years beginning after November 15, 2008, and interim periods within those fiscal years.
(ac) New Accounting StandardsIn December 2007, the FASB issued SFAS No. 141 (revised 2007), “Business Combinations,” and SFAS No. 160, “Noncontrolling Interests in Consolidated Financial Statements.” These statements will improve and simplify the accounting for business combinations and the reporting of noncontrolling interests in consolidated financial statements. SFAS No. 141 requires an acquiring entity in a business combination to recognize all the assets acquired, liabilities assumed and any noncontrolling interest in an acquiree at the full amount of their fair values as of the acquisition date. Also, SFAS No. 160 clarifies that a noncontrolling interest in a subsidiary should be reported as equity in the consolidated financial statements and all the transactions for changes in a parent’s ownership interest in a subsidiary that do not result in deconsolidation are equity transactions. These statements are required to be adopted simultaneously and are effective for the first annual reporting period beginning on or after December 15, 2008. The Company is currently evaluating the effect of adopting these statements on the consolidated financial position and results of operations.
SFAS No. 157, “Fair Value Measurements” is effective for fiscal years beginning after November 15, 2008 and interim periods within those fiscal years for non-recurring valuations of non-financial assets and non-financial liabilities such as those used in measuring impairments of goodwill, other intangible assets, other long-lived assets and fair value measurements of non-financial assets acquired and non-financial liabilities assumed in business combinations consummated after the effective date. The Company is currently evaluating the effect of adopting this statement on the consolidated financial position and results of operations.
In May 2008, the FASB issued FSP No. APB 14-1, “Accounting for Convertible Debt Instruments That May Be Settled in Cash upon Conversion (including Partial Cash Settlement).” This FSP requires that issuers of convertible debt instruments that may be settled in cash or other assets upon conversion separately account for the liability and equity components in a manner that reflects the entity’s nonconvertible debt borrowing rate when interest cost is recognized in subsequent periods. This statement is effective for financial statements issued for fiscal years beginning after December 15, 2008, and interim periods within those fiscal years. The requirements must be applied retrospectively to all periods presented. The Company is currently evaluating the effect of adopting this statement on the consolidated financial position and results of operations.
In April 2009, the FASB issued FSP No. FAS 115-2 and FAS 124-2, “Recognition and Presentation of Other-Than-Temporary Impairments.” This FSP modifies the existing model for recognition and measurement of impairment for debt securities. Under this FSP, an other-than-temporary impairment is triggered when there is an intent to sell the impaired debt security, it is more likely than not that the impaired debt security will be required to be sold before recovery, or the holder is not expected to recover the entire amortized cost basis of the security. Additionally, this FSP changes the presentation of an other-than-temporary impairment in the statement of operations for those impairments involving credit losses when the holder does not intend to sell the security and it is not more likely than not that the holder will be required to sell the security before recovery of its amortized cost basis. The credit loss component will be recognized in earnings and the remainder of the impairment will be recorded in other comprehensive income or loss. This FSP is effective for interim and annual reporting periods ending after June 15, 2009, with early adoption permitted for periods ending after March 15, 2009. The Company is currently evaluating the effect of adopting this statement on the consolidated financial position and results of operations, but has not elected to early adopt its provisions.
47Hitachi, Ltd.Annual Report 2009

In April 2009, the FASB issued FSP No. FAS 157-4, “Determining Fair Value When the Volume and Level of Activity for the Asset or Liability Have Significantly Decreased and Identifying Transactions That Are Not Orderly.” This FSP provides additional guidance for estimating fair value in accordance with SFAS No. 157, “Fair Value Measurements,” when the volume and level of activity for the asset or liability have significantly decreased in relation to normal market activity. This FSP also includes guidance on identifying circumstances that indicate a transaction is not orderly. This FSP is effective for interim and annual reporting periods ending after June 15, 2009 and applied prospectively, with early adoption permitted for periods ending after March 15, 2009. The Company is currently evaluating the effect of adopting this statement on the consolidated financial position and results of operations, but has not elected to early adopt its provisions.
In May 2009, the FASB issued SFAS No. 165, “Subsequent Events.” This statement provides general standards of accounting for and disclosure of events or transactions that occur after the balance sheet date but before the financial statements are issued or are available to be issued. This statement also requires the disclosure of the date through which an entity has evaluated subsequent events and the basis for that date. This statement is effective for interim or annual reporting periods ending after June 15, 2009. SFAS No. 165 is not expected to have a material effect on the consolidated financial position or results of operations.
In June 2009, the FASB issued SFAS No. 166, “Accounting for Transfers of Financial Assets, an amendment of FASB Statement No. 140.” This statement removes the concept of a qualifying special-purpose entity from SFAS No. 140 and the exception from applying FASB Interpretation No. 46 (revised December 2003) to qualifying special-purpose entities. This statement modifies the financial-components approach used in SFAS No. 140, limits the circumstances in which a transferor derecognizes a portion or component of a financial asset when the transferor has not transferred the original financial asset to an entity and/or when the transferor has continuing involvement with the financial asset, and establishes the “participating interests” conditions for reporting a transfer. This statement also requires enhanced disclosures to provide financial statement users with greater transparency about transfers of financial assets and a transferor’s continuing involvement. This statement is effective for financial statements issued for fiscal years beginning after November 15, 2009, and interim periods within those fiscal years. The Company is currently evaluating the effect of adopting this statement on the consolidated financial position and results of operations.
In June 2009, the FASB issued SFAS No. 167, “Amendments to FASB Interpretation No. 46(R).” This statement amends FASB Interpretation No. 46 (revised December 2003) and establishes how a company determines when an entity that is insufficiently capitalized or is not controlled through voting or similar rights should be consolidated. The determination of whether a company is required to consolidate an entity is based on qualitative information such as an entity’s purpose and design and a company’s ability to direct the activities of the entity that most significantly impact the entity’s economic performance. This statement also requires enhanced disclosures that will provide users of financial statements with more transparent information about an enterprise’s involvement in a variable interest entity. This statement is effective for financial statements issued for fiscal years beginning after November 15, 2009, and interim periods within those fiscal years. The Company is currently evaluating the effect of adopting this statement on the consolidated financial position and results of operations.
(ad) ReclassificationsCertain reclassifications have been made to prior year balances in order to conform to the current year presentation.
Equity in net earnings (loss) of affiliated companies, which was previously included in other income and other deductions in the consolidated statements of operations, has been reclassified to be presented separately to conform to the current year presentation.
48 Hitachi, Ltd.Annual Report 2009
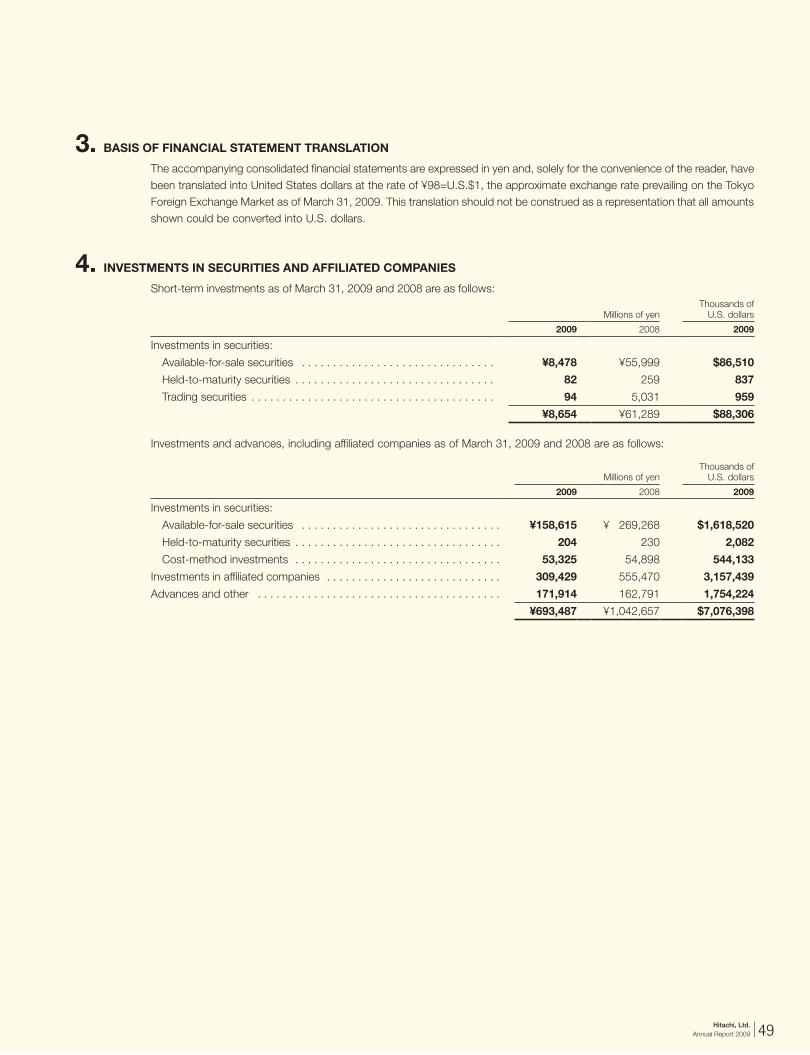
3. BASiS of fiNANciAL StAtEmENt trANSLAtioN
The accompanying consolidated financial statements are expressed in yen and, solely for the convenience of the reader, have been translated into United States dollars at the rate of ¥98=U.S.$1, the approximate exchange rate prevailing on the Tokyo Foreign Exchange Market as of March 31, 2009. This translation should not be construed as a representation that all amounts shown could be converted into U.S. dollars.
4. iNvEStmENtS iN SEcuritiES ANd AffiLiAtEd compANiES
Short-term investments as of March 31, 2009 and 2008 are as follows:
Millions of yenThousands of
U.S. dollars
2009 2008 2009
Investments in securities:
Available-for-sale securities . . . . . . . . . . . . . . . . . . . . . . . . . . . . . . . ¥8,478 ¥55,999 $86,510
Held-to-maturity securities . . . . . . . . . . . . . . . . . . . . . . . . . . . . . . . . 82 259 837
Trading securities . . . . . . . . . . . . . . . . . . . . . . . . . . . . . . . . . . . . . . . 94 5,031 959
¥8,654 ¥61,289 $88,306
Investments and advances, including affiliated companies as of March 31, 2009 and 2008 are as follows:
Millions of yenThousands of
U.S. dollars
2009 2008 2009
Investments in securities:
Available-for-sale securities . . . . . . . . . . . . . . . . . . . . . . . . . . . . . . . . ¥158,615 ¥ 269,268 $1,618,520
Held-to-maturity securities . . . . . . . . . . . . . . . . . . . . . . . . . . . . . . . . . 204 230 2,082
Cost-method investments . . . . . . . . . . . . . . . . . . . . . . . . . . . . . . . . . 53,325 54,898 544,133
Investments in affiliated companies . . . . . . . . . . . . . . . . . . . . . . . . . . . . 309,429 555,470 3,157,439
Advances and other . . . . . . . . . . . . . . . . . . . . . . . . . . . . . . . . . . . . . . . 171,914 162,791 1,754,224
¥693,487 ¥1,042,657 $7,076,398
49Hitachi, Ltd.Annual Report 2009
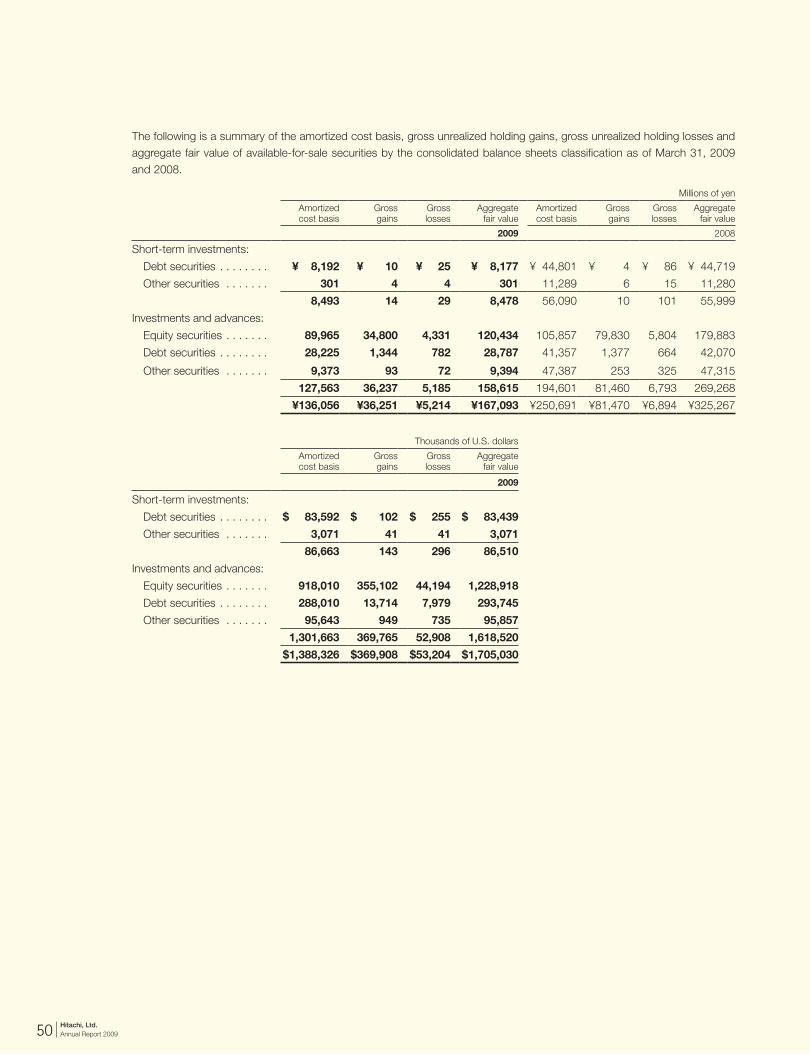
The following is a summary of the amortized cost basis, gross unrealized holding gains, gross unrealized holding losses and aggregate fair value of available-for-sale securities by the consolidated balance sheets classification as of March 31, 2009 and 2008.
Millions of yen
Amortized cost basis
Gross gains
Gross losses
Aggregate fair value
Amortized cost basis
Gross gains
Gross losses
Aggregate fair value
2009 2008
Short-term investments:
Debt securities . . . . . . . . ¥ 8,192 ¥ 10 ¥ 25 ¥ 8,177 ¥ 44,801 ¥ 4 ¥ 86 ¥ 44,719
Other securities . . . . . . . 301 4 4 301 11,289 6 15 11,280
8,493 14 29 8,478 56,090 10 101 55,999
Investments and advances:
Equity securities . . . . . . . 89,965 34,800 4,331 120,434 105,857 79,830 5,804 179,883
Debt securities . . . . . . . . 28,225 1,344 782 28,787 41,357 1,377 664 42,070
Other securities . . . . . . . 9,373 93 72 9,394 47,387 253 325 47,315
127,563 36,237 5,185 158,615 194,601 81,460 6,793 269,268
¥136,056 ¥36,251 ¥5,214 ¥167,093 ¥250,691 ¥81,470 ¥6,894 ¥325,267
Thousands of U.S. dollars
Amortized cost basis
Gross gains
Gross losses
Aggregate fair value
2009
Short-term investments:
Debt securities . . . . . . . . $ 83,592 $ 102 $ 255 $ 83,439
Other securities . . . . . . . 3,071 41 41 3,071
86,663 143 296 86,510
Investments and advances:
Equity securities . . . . . . . 918,010 355,102 44,194 1,228,918
Debt securities . . . . . . . . 288,010 13,714 7,979 293,745
Other securities . . . . . . . 95,643 949 735 95,857
1,301,663 369,765 52,908 1,618,520
$1,388,326 $369,908 $53,204 $1,705,030
50 Hitachi, Ltd.Annual Report 2009

The following is a summary of gross unrealized holding losses on available-for-sale securities and the fair value of the related securities, aggregated by investment category and length of time that individual securities have been in a continuous unrealized loss position, as of March 31, 2009 and 2008.
Millions of yen
Less than 12 months 12 months or longer Less than 12 months 12 months or longer
Aggregate fair value
Gross losses
Aggregate fair value
Gross losses
Aggregate fair value
Gross losses
Aggregate fair value
Gross losses
2009 2008
Short-term investments:
Debt securities . . . . . . . . . . . . . . . . ¥ 1,288 ¥ 9 ¥ 279 ¥ 16 ¥ 8,170 ¥ 17 ¥10,231 ¥ 69
Other securities . . . . . . . . . . . . . . . – – – 4 95 15 – –
1,288 9 279 20 8,265 32 10,231 69
Investments and advances:
Equity securities . . . . . . . . . . . . . . . 21,836 3,092 4,336 1,239 12,961 4,992 2,528 812
Debt securities . . . . . . . . . . . . . . . . 3,927 318 10,220 464 7,308 416 10,222 248
Other securities . . . . . . . . . . . . . . . 995 67 27 5 3,330 223 1,001 102
26,758 3,477 14,583 1,708 23,599 5,631 13,751 1,162
¥28,046 ¥3,486 ¥14,862 ¥1,728 ¥31,864 ¥5,663 ¥23,982 ¥1,231
Thousands of U.S. dollars
Less than 12 months 12 months or longer
Aggregate fair value
Gross losses
Aggregate fair value
Gross losses
2009
Short-term investments:
Debt securities . . . . . . . . . . . . . . . . $ 13,143 $ 92 $ 2,847 $ 163
Other securities . . . . . . . . . . . . . . . – – – 41
13,143 92 2,847 204
Investments and advances:
Equity securities . . . . . . . . . . . . . . . 222,816 31,551 44,245 12,643
Debt securities . . . . . . . . . . . . . . . . 40,071 3,245 104,286 4,734
Other securities . . . . . . . . . . . . . . . 10,153 684 276 51
273,040 35,480 148,807 17,428
$286,183 $35,572 $151,654 $17,632
Debt securities consist primarily of national, local and foreign governmental bonds, debentures issued by banks and corporate bonds. Other securities consist primarily of investment trusts.
The proceeds from the sale of available-for-sale securities for the years ended March 31, 2009, 2008 and 2007 were ¥60,063 million ($612,888 thousand), ¥38,264 million and ¥83,513 million, respectively. The gross realized gains on the sale of those securities for the years ended March 31, 2009, 2008 and 2007 were ¥2,017 million ($20,582 thousand), ¥10,137 million and ¥43,267 million, respectively, while the gross realized losses on the sale of those securities for the years ended March 31, 2009, 2008 and 2007 were ¥1,029 million ($10,500 thousand), ¥107 million and ¥176 million, respectively. In addition, during the year ended March 31, 2008, the Company contributed certain available-for-sale securities, with an aggregate fair value of ¥42,240 million, to a pension fund trust. Gross realized gain on the contribution for the year ended March 31, 2008 was ¥21,040 million, which has been included in other income in the accompanying consolidated statement of operations.
Trading securities consist mainly of investments in trust accounts. The portions of trading gains and losses for the years ended March 31, 2009, 2008 and 2007 that relate to trading securities still held at the balance sheet date were losses of ¥352 million ($3,592 thousand) and ¥144 million and a gain of ¥2,684 million, respectively, and were classified as other deductions for the years ended March 31, 2009 and 2008 and other income for the year ended March 31, 2007 in the consolidated statements of operations.
51Hitachi, Ltd.Annual Report 2009

The contractual maturities of debt securities and other securities classified as investments and advances in the consolidated balance sheet as of March 31, 2009 are as follows:
Millions of yen Thousands of U.S. dollars
Held-to- maturity
Available- for-sale Total
Held-to- maturity
Available- for-sale Total
2009 2009
Due within five years . . . . . . . . . . . . . . . . . . . . . ¥ 5 ¥15,058 ¥15,063 $ 51 $153,653 $153,704
Due after five years through ten years . . . . . . . . 199 3,923 4,122 2,031 40,031 42,062
Due after ten years . . . . . . . . . . . . . . . . . . . . . . – 19,200 19,200 – 195,918 195,918
¥204 ¥38,181 ¥38,385 $2,082 $389,602 $391,684
Expected redemptions may differ from contractual maturities because some of these securities are redeemable at the option of the issuers.
The aggregate carrying amounts of cost-method investments which were not evaluated for impairment as of March 31, 2009 and 2008 were ¥51,197 million ($522,418 thousand) and ¥51,131 million, respectively, mainly because it is not practicable to estimate the fair value of the investments due to lack of a market price and difficulty in estimating fair value without incurring excessive cost and the Company did not identify any events or changes in circumstances that might have had a significant adverse effect on their fair value.
The aggregate fair values of investments in affiliated companies, for which a quoted market price was available, as of March 31, 2009 and 2008, were ¥13,630 million ($139,082 thousand) and ¥130,018 million, respectively. The aggregate carrying amounts of such investments as of March 31, 2009 and 2008 were ¥13,452 million ($137,265 thousand) and ¥94,971 million, respectively.
As of March 31, 2009 and 2008, cumulative recognition of other-than-temporary declines in values of investments in certain affiliated companies resulted in the difference of ¥17,452 million ($178,082 thousand) and ¥17,230 million, respectively, between the carrying amount of the investment and the amount of underlying equity in net assets. In addition, as of March 31, 2009 and 2008, equity-method goodwill included in investments in certain affiliated companies aggregated ¥43,015 million ($438,929 thousand) and ¥49,414 million, respectively.
The major component of equity-method goodwill recorded during the year ended March 31, 2008 was related to the acquisition of the interests in GE-Hitachi Nuclear Energy Holdings, LLC.
Summarized combined financial information relating to affiliated companies, including Renesas Technology Corp. and IPS Alpha Technology, Ltd., accounted for by the equity method is as follows:
Millions of yenThousands of
U.S. dollars
2009 2008 2009
Current assets . . . . . . . . . . . . . . . . . . . . . . . . . . . . . . . . . ¥1,056,487 ¥1,531,596 $10,780,480
Non-current assets . . . . . . . . . . . . . . . . . . . . . . . . . . . . . 810,645 1,141,798 8,271,888
Current liabilities . . . . . . . . . . . . . . . . . . . . . . . . . . . . . . . 1,017,319 1,217,092 10,380,806
Non-current liabilities . . . . . . . . . . . . . . . . . . . . . . . . . . . . 313,891 367,009 3,202,969
Millions of yenThousands of
U.S. dollars
2009 2008 2007 2009
Revenues . . . . . . . . . . . . . . . . . . . . . . . . . . . . . . . . . . . . ¥2,442,987 ¥2,816,109 ¥2,574,034 $24,928,439
Gross profit . . . . . . . . . . . . . . . . . . . . . . . . . . . . . . . . . . . 203,343 478,634 394,762 2,074,929
Net income (loss) . . . . . . . . . . . . . . . . . . . . . . . . . . . . . . . (395,428) 49,659 24,664 (4,034,980)
52 Hitachi, Ltd.Annual Report 2009

The balances and transactions with affiliated companies accounted for by the equity method are as follows:
Millions of yenThousands of
U.S. dollars
2009 2008 2009
Trade receivables . . . . . . . . . . . . . . . . . . . . . . . . . . . . . . ¥99,074 ¥137,345 $1,010,959
Investments in leases . . . . . . . . . . . . . . . . . . . . . . . . . . . 15,977 6,903 163,031
Trade payables . . . . . . . . . . . . . . . . . . . . . . . . . . . . . . . 48,168 86,690 491,510
Millions of yenThousands of
U.S. dollars
2009 2008 2007 2009
Revenues . . . . . . . . . . . . . . . . . . . . . . . . . . . . . . . . . . . ¥469,629 ¥597,942 ¥589,103 $4,792,133
Purchases . . . . . . . . . . . . . . . . . . . . . . . . . . . . . . . . . . . 356,400 412,682 379,772 3,636,735
5. iNvENtoriES
Inventories as of March 31, 2009 and 2008 are summarized as follows:
Millions of yenThousands of
U.S. dollars
2009 2008 2009
Finished goods . . . . . . . . . . . . . . . . . . . . . . . . . . . . . . . . . . . . . . . . . . ¥ 617,526 ¥ 553,344 $ 6,301,286
Work in process . . . . . . . . . . . . . . . . . . . . . . . . . . . . . . . . . . . . . . . . . 610,297 665,106 6,227,520
Raw materials . . . . . . . . . . . . . . . . . . . . . . . . . . . . . . . . . . . . . . . . . . . 228,448 222,574 2,331,102
¥1,456,271 ¥1,441,024 $14,859,908
6. LEASES
The Company and certain subsidiaries are lessors of certain assets such as manufacturing machinery and equipment under financing and operating lease arrangements with terms ranging from 3 to 6 years, some of which are transacted with affiliated companies.
The amount of leased assets at cost under operating leases and accumulated depreciation as of March 31, 2009 amounted to ¥1,932,712 million ($19,721,551 thousand) and ¥1,646,206 million ($16,798,020 thousand), respectively. The leased assets are depreciated using the straight-line method over their estimated useful lives.
53Hitachi, Ltd.Annual Report 2009

The following table shows the future minimum lease receivables of financing and non-cancelable operating leases as of March 31, 2009 and the future minimum lease receivables of financing leases as of March 31, 2008:
Millions of yenThousands of
U.S. dollars
Financing leases
Operating leases
Financing leases
Operating leases
Years ending March 31 2009 2009
2010 . . . . . . . . . . . . . . . . . . . . . . . . . . . . . . . . . . . . . . . . . . . ¥174,713 ¥ 42,872 $1,782,785 $ 437,470
2011 . . . . . . . . . . . . . . . . . . . . . . . . . . . . . . . . . . . . . . . . . . . 139,693 29,662 1,425,439 302,673
2012 . . . . . . . . . . . . . . . . . . . . . . . . . . . . . . . . . . . . . . . . . . . 96,570 18,453 985,408 188,296
2013 . . . . . . . . . . . . . . . . . . . . . . . . . . . . . . . . . . . . . . . . . . . 59,505 9,192 607,194 93,796
2014 . . . . . . . . . . . . . . . . . . . . . . . . . . . . . . . . . . . . . . . . . . . 30,503 3,342 311,255 34,102
Thereafter . . . . . . . . . . . . . . . . . . . . . . . . . . . . . . . . . . . . . . . 74,366 3,287 758,837 33,541
Total minimum payments to be received . . . . . . . . . . . . . . . . 575,350 ¥106,808 5,870,918 $1,089,878
Unguaranteed residual values . . . . . . . . . . . . . . . . . . . . . . . . 74,870 763,979
Amount representing executory costs . . . . . . . . . . . . . . . . . . (32,803) (334,724)
Unearned income . . . . . . . . . . . . . . . . . . . . . . . . . . . . . . . . . (41,161) (420,010)
Allowance for doubtful receivables . . . . . . . . . . . . . . . . . . . . . (3,778) (38,551)
Net investment in financing leases . . . . . . . . . . . . . . . . . . . . . 572,478 5,841,612
Less current portion of net investment in financing leases, included in investments in leases . . . . . . . . . . . . . . . . . . . . . 170,340 1,738,163
Long-term net investment in financing leases, included in other assets . . . . . . . . . . . . . . . . . . . . . . . . . . . . ¥402,138 $4,103,449
Millions of yen
Financing Leases
2008
Total minimum payments to be received . . . . . . . . . . . . . . . . ¥447,766
Unguaranteed residual values . . . . . . . . . . . . . . . . . . . . . . . . 79,024
Amount representing executory costs . . . . . . . . . . . . . . . . . . (24,467)
Unearned income . . . . . . . . . . . . . . . . . . . . . . . . . . . . . . . . . (35,172)
Allowance for doubtful receivables . . . . . . . . . . . . . . . . . . . . . (3,765)
Net investment in financing leases . . . . . . . . . . . . . . . . . . . . . 463,386
Less current portion of net investment in financing leases, included in investments in leases . . . . . . . . . . . . . . . . . . . . . 136,119
Long-term net investment in financing leases, included in other assets . . . . . . . . . . . . . . . . . . . . . . . . . . . . ¥327,267
The Company and certain subsidiaries lease certain buildings, manufacturing machinery and equipment used in their operations. The amount of leased assets at cost under capital leases as of March 31, 2009 and 2008 amounted to ¥37,846 million ($386,184 thousand) and ¥41,017 million, respectively, and accumulated depreciation as of March 31, 2009 and 2008 amounted to ¥18,993 million ($193,806 thousand) and ¥22,151 million, respectively. Amortization of assets under capital leases is included in depreciation expense.
54 Hitachi, Ltd.Annual Report 2009

The following table shows the future minimum lease payments of capital and non-cancelable operating leases as of March 31, 2009:
Millions of yenThousands of
U.S. dollars
Capital leases
Operating leases
Capital leases
Operating leases
Years ending March 31 2009 2009
2010 . . . . . . . . . . . . . . . . . . . . . . . . . . . . . . . . . . . . . . . . . . . . . . . . . ¥13,180 ¥15,030 $134,490 $153,367
2011 . . . . . . . . . . . . . . . . . . . . . . . . . . . . . . . . . . . . . . . . . . . . . . . . . 9,004 10,409 91,877 106,214
2012 . . . . . . . . . . . . . . . . . . . . . . . . . . . . . . . . . . . . . . . . . . . . . . . . . 4,763 8,663 48,602 88,398
2013 . . . . . . . . . . . . . . . . . . . . . . . . . . . . . . . . . . . . . . . . . . . . . . . . . 2,722 7,485 27,775 76,378
2014 . . . . . . . . . . . . . . . . . . . . . . . . . . . . . . . . . . . . . . . . . . . . . . . . . 1,263 6,604 12,888 67,388
Thereafter . . . . . . . . . . . . . . . . . . . . . . . . . . . . . . . . . . . . . . . . . . . . . 4,869 24,255 49,684 247,500
Total minimum lease payments . . . . . . . . . . . . . . . . . . . . . . . . . . . . . 35,801 ¥72,446 365,316 $739,245
Amount representing executory costs . . . . . . . . . . . . . . . . . . . . . . . . (493) (5,031)
Amount representing interest . . . . . . . . . . . . . . . . . . . . . . . . . . . . . . . (1,762) (17,979)
Present value of net minimum lease payments . . . . . . . . . . . . . . . . . . 33,546 342,306
Less current portion of capital lease obligations . . . . . . . . . . . . . . . . . 12,549 128,051
Long-term capital lease obligations . . . . . . . . . . . . . . . . . . . . . . . . . . ¥20,997 $214,255
7. SEcuritizAtioNS
The Company and certain subsidiaries securitize certain financial assets, such as lease, trade and mortgage loans receivable, and arrange other forms of asset-backed financing for the purpose of providing diversified and stable fund raising as part of their ongoing securitization activities. Historically, they have used both Hitachi-supported and third-party Special Purpose Entities (SPEs) to execute securitization transactions funded with commercial paper and other borrowings. The securitization transactions they engage in are similar to those used by many financial institutions.
Investors in these entities only have recourse to the assets owned by the entity and not to their general credit, unless noted below. They do not provide non-contractual support to SPEs and do not have implicit support arrangements with any SPEs. The majority of their involvement with SPEs relate to the securitization activities: assisting in the formation and financing of an entity, providing recourse, servicing the assets and receiving fees for services provided.
A portion of these lease, trade and mortgage loans receivable is transferred to SPEs sponsored by financial institutions, which operate those SPEs as a part of their businesses. Accordingly, the amount of assets transferred by the Company and its subsidiaries is considerably small compared to the total assets of the SPEs sponsored by these financial institutions that purchase a large amount of assets from entities other than the Company and its subsidiaries. In certain transactions, the Company’s subsidiaries retain subordinated interests in the transferred assets. In other transactions, investors have recourse with a scope that is considerably limited.
Most of the transactions transferring lease and mortgage loans receivable utilize securitization trusts. In those transactions, certain subsidiaries initially transfer the receivables to trusts that satisfy the conditions of Qualifying SPEs (QSPEs), and receive the beneficial interests in trusts originated from the transferred assets. Subsequently, the subsidiaries transfer the interests to and receive cash as consideration from SPEs that are not QSPEs, as a part of off-balance sheet arrangements.
The rest of these financial assets, consisting mainly of trade receivables, are transferred to QSPEs established by certain of the Company’s subsidiaries in the Cayman Islands. In those transactions, the Company and certain subsidiaries receive cash as consideration from QSPEs that are funded through the issuance of asset-backed securities or other borrowings from investors that are secured by the transferred assets. The Company and certain subsidiaries retain subordinated interests in the transferred assets relating to these transactions, or otherwise investors have recourse with considerably limited scope. Furthermore, the Company and certain subsidiaries retain servicing responsibility, and certain of the Company’s subsidiaries provide credit facilities to QSPEs in accordance with the service agency business contracts from which temporary payments on behalf of such QSPEs are made.
55Hitachi, Ltd.Annual Report 2009

As of March 31, 2009, the Company and its subsidiaries have three QSPEs with outstanding balances of transferred receivables. The total amount of their assets was ¥164,863 million ($1,682,276 thousand) as of March 31, 2009. The Company and its subsidiaries do not hold any of the voting shares issued by those QSPEs, and none of the directors of those QSPEs are executives or employees of the Company or its subsidiaries. Additionally, the QSPEs also purchase receivables from third-party customers.
The transferred assets have similar risks and characteristics to the Company’s and subsidiaries’ receivables recorded on the consolidated balance sheets. Accordingly, the performance, such as collections or expected credit loss, of these transferred assets has been similar to the receivables recorded on the consolidated balance sheets; however, the blended performance of the pools of transferred assets reflects the eligibility screening requirements that the Company and subsidiaries apply to determine which receivables are selected for transfer. Therefore, the blended performance may differ from receivables recorded on the consolidated balance sheets.
Hitachi Capital Corporation and certain other financing subsidiaries sold lease receivables to SPEs that are not QSPEs. For the years ended March 31, 2009, 2008 and 2007, net gains recognized on the sale of these lease receivables amounted to ¥13,975 million ($142,602 thousand), ¥17,440 million and ¥17,475 million, respectively. The subsidiaries retained servicing responsibilities, but did not record a servicing asset or liability because the cost to service the receivables approximated the servicing income.
The table below summarizes cash flows received from and paid to the SPEs during the years ended March 31, 2009, 2008 and 2007:
Millions of yenThousands of
U.S. dollars
2009 2008 2007 2009
Proceeds from transfer of lease receivables . . . . . . . . . . . . . ¥254,211 ¥310,898 ¥327,741 $2,593,990
Servicing fees received . . . . . . . . . . . . . . . . . . . . . . . . . . . . 78 78 60 796
Purchases of delinquent or ineligible assets . . . . . . . . . . . . . (46,760) (26,610) (32,299) (477,143)
Quantitative information about delinquencies, net credit losses, and components of lease receivables subject to transfer and other assets managed together as of and for the years ended March 31, 2009 and 2008 is as follows:
Millions of yen Thousands of U.S. dollars
Total principal
amount of receivables
Principal amount of
receivables 90 days or
more past dueNet credit
loss
Total principal
amount of receivables
Principal amount of
receivables 90 days or
more past dueNet credit
loss
2009 2009
Total assets managed or transferred:
Lease receivables . . . . . . . . . . . . ¥1,172,350 ¥218 ¥1,779 $11,962,755 $2,224 $18,153
Assets transferred . . . . . . . . . . . . (599,872) (6,121,143)
Assets held in portfolio . . . . . . . . . . . ¥ 572,478 $ 5,841,612
Millions of yen
Total principal
amount of receivables
Principal amount of
receivables 90 days or
more past dueNet credit
loss
2008
Total assets managed or transferred:
Lease receivables . . . . . . . . . . . . ¥1,140,244 ¥183 ¥957
Assets transferred . . . . . . . . . . . . (676,858)
Assets held in portfolio . . . . . . . . . . . ¥ 463,386
As of March 31, 2009 and 2008, the amount of the subordinated interests measured at fair value relating to these securitizations of lease receivables was ¥87,247 million ($890,276 thousand) and ¥96,616 million, respectively.
56 Hitachi, Ltd.Annual Report 2009

Key economic assumptions used in measuring the fair value of the subordinated interests relating to securitizations of lease receivables as of March 31, 2009 and 2008 are as follows:
2009 2008
Weighted average life (in years) . . . . . . . . . . . . . . . . . . . . . . . . . . . . . . . . . . . . . . . . . . . 3.3 3.4
Expected credit loss . . . . . . . . . . . . . . . . . . . . . . . . . . . . . . . . . . . . . . . . . . . . . . . . . . . 0.00–0.03% 0.00–0.03%
Discount rate . . . . . . . . . . . . . . . . . . . . . . . . . . . . . . . . . . . . . . . . . . . . . . . . . . . . . . . . . 0.80–1.16% 0.80–1.00%
The sensitivity of the current fair value of the subordinated interests to an immediate 10 and 20 percent adverse change in the assumptions as of March 31, 2009 and 2008 is as follows:
Millions of yenThousands of
U.S. dollars
2009 2008 2009
Expected credit loss:
Impact on fair value of 10% adverse change . . . . . . . . . . . . . . . . . . ¥(234) ¥(219) $(2,388)
Impact on fair value of 20% adverse change . . . . . . . . . . . . . . . . . . (468) (439) (4,776)
Discount rate:
Impact on fair value of 10% adverse change . . . . . . . . . . . . . . . . . . (265) (200) (2,704)
Impact on fair value of 20% adverse change . . . . . . . . . . . . . . . . . . (528) (402) (5,388)
The Company and certain subsidiaries sold trade receivables excluding mortgage loans receivable mainly to QSPEs and SPEs that are not QSPEs. During the years ended March 31, 2009, 2008 and 2007, proceeds from the transfer of trade receivables excluding mortgage loans receivable were ¥884,953 million ($9,030,133 thousand), ¥1,097,778 million and ¥1,501,908 million, respectively, and net losses recognized on those transfers were ¥4,245 million ($43,316 thousand), ¥5,913 million and ¥7,030 million, respectively. The Company and certain subsidiaries retained servicing responsibilities, but did not record a servicing asset or liability because the cost to service the receivables approximated the servicing income.
Quantitative information about delinquencies, net credit loss, and components of trade receivables excluding mortgage loans receivable subject to transfer and other assets managed together as of and for the year ended March 31, 2009 is as follows:
Millions of yen Thousands of U.S. dollars
Total principal
amount of receivables
Principal amount of
receivables 90 days or
more past dueNet credit
loss
Total principal
amount of receivables
Principal amount of
receivables 90 days or
more past dueNet credit
loss
2009 2009
Total assets managed or transferred:
Trade receivables excluding mortgage loans receivable . . . . . ¥1,003,491 ¥11,079 ¥5,202 $10,239,704 $113,051 $53,082
Assets transferred . . . . . . . . . . . . (269,685) (2,751,888)
Assets held in portfolio . . . . . . . . . . . ¥ 733,806 $ 7,487,816
As of March 31, 2009, the amount of the subordinated interests relating to these securitizations of trade receivables excluding mortgage loans receivable was ¥20,807 million ($212,316 thousand).
A portion of these trade receivables excluding mortgage loans receivable was transferred to QSPEs. The aggregate cash received and paid from the QSPEs for the year ended March 31, 2009 and the outstanding balance as of March 31, 2009 are summarized as follows:
Millions of yenThousands of
U.S. dollars
2009 2009
Proceeds from transfer of trade receivables . . . . . . . . . . . . . . . . . . . . . . . . . . . . . . . . . . ¥490,647 $5,006,602
Net loss recognized on those transfers . . . . . . . . . . . . . . . . . . . . . . . . . . . . . . . . . . . . . (993) (10,133)
Outstanding balance of transferred receivables . . . . . . . . . . . . . . . . . . . . . . . . . . . . . . . 98,214 1,002,184
57Hitachi, Ltd.Annual Report 2009

Hitachi Capital Corporation sold mortgage loans receivable to SPEs that are not QSPEs. For the years ended March 31, 2009 and 2008, no proceeds from the transfer of mortgage loans receivable were recorded. For the year ended March 31, 2007, proceeds from the transfer of mortgage loans receivable was ¥32,600 million. The subsidiary retained servicing responsibilities but did not record a servicing asset or liability because the cost to service the receivables approximated the servicing income.
Quantitative information about delinquencies, net credit loss, and components of mortgage loans receivable subject to transfer and other assets managed together as of and for the year ended March 31, 2009 is as follows:
Millions of yen Thousands of U.S. dollars
Total principal
amount of receivables
Principal amount of
receivables 90 days or
more past dueNet credit
loss
Total principal
amount of receivables
Principal amount of
receivables 90 days or
more past dueNet credit
loss
2009 2009
Total assets managed or transferred:
Mortgage loans receivable . . . . . . ¥ 247,058 ¥0 ¥69 $ 2,521,000 $0 $704
Assets transferred . . . . . . . . . . . . (232,553) (2,372,990)
Assets held in portfolio . . . . . . . . . . . ¥ 14,505 $ 148,010
As of March 31, 2009, the amount of the subordinated interests measured at fair value and retained relating to securitizations of mortgage loans receivable was ¥36,218 million ($369,571 thousand).
Key economic assumptions used in measuring the fair value of the subordinated interests relating to securitizations of mortgage loans receivable as of March 31, 2009 are as follows:
2009
Weighted average life (in years) . . . . . . . . . . . . . . . . . . . . . . . . . . . . . . . . . . . . . . . . . . . . . . . . . . . . . . . . . 11.4
Expected credit loss . . . . . . . . . . . . . . . . . . . . . . . . . . . . . . . . . . . . . . . . . . . . . . . . . . . . . . . . . . . . . . . . . 0.01%
Discount rate . . . . . . . . . . . . . . . . . . . . . . . . . . . . . . . . . . . . . . . . . . . . . . . . . . . . . . . . . . . . . . . . . . . . . . . 1.76–2.03%
Prepayment rate . . . . . . . . . . . . . . . . . . . . . . . . . . . . . . . . . . . . . . . . . . . . . . . . . . . . . . . . . . . . . . . . . . . . 1.00%
The sensitivity of the current fair value of the subordinated interests to an immediate 10 and 20 percent adverse change in the assumptions are as follows:
Millions of yenThousands of
U.S. dollars
2009 2009
Expected credit loss:
Impact on fair value of 10% adverse change . . . . . . . . . . . . . . . . . . . . . . . . . . . . . . . ¥ (126) $ (1,286)
Impact on fair value of 20% adverse change . . . . . . . . . . . . . . . . . . . . . . . . . . . . . . . (253) (2,582)
Discount rate:
Impact on fair value of 10% adverse change . . . . . . . . . . . . . . . . . . . . . . . . . . . . . . . (619) (6,316)
Impact on fair value of 20% adverse change . . . . . . . . . . . . . . . . . . . . . . . . . . . . . . . (1,225) (12,500)
Prepayment rate:
Impact on fair value of 10% adverse change . . . . . . . . . . . . . . . . . . . . . . . . . . . . . . . (402) (4,102)
Impact on fair value of 20% adverse change . . . . . . . . . . . . . . . . . . . . . . . . . . . . . . . (756) (7,714)
The sensitivities presented in this note are hypothetical and should be used with caution. As the figures indicate, changes in fair value based on a 10 percent variation in assumptions generally cannot be extrapolated because the relationship of the change in assumption to the change in fair value may not be linear. Also, in the above tables, the effect of a variation in a particular assumption of the fair value of the interest is calculated without changing any other assumption; in reality, changes in one factor may result in changes in another, which might magnify or counteract the sensitivities.
58 Hitachi, Ltd.Annual Report 2009

8. goodwiLL ANd othEr iNtANgiBLE ASSEtS
Intangible assets other than goodwill acquired during the years ended March 31, 2009, 2008 and 2007 amounted to ¥168,911 million ($1,723,582 thousand), ¥167,397 million and ¥181,226 million, respectively, and related amortization expense during the years ended March 31, 2009, 2008 and 2007 amounted to ¥178,164 million ($1,818,000 thousand), ¥146,136 million and ¥149,823 million, respectively.
The main component of intangible assets subject to amortization was capitalized software. Amortization of capitalized costs for software to be sold, leased or otherwise marketed is charged to cost of sales. The amounts charged during the years ended March 31, 2009, 2008 and 2007 were ¥85,841 million ($875,929 thousand), ¥49,180 million and ¥58,043 million, respectively.
Intangible assets other than goodwill included in other assets as of March 31, 2009 and 2008 are as follows:
Millions of yen
2009 2008
Gross carrying amount
Accumulated amortization
Net carrying amount
Gross carrying amount
Accumulated amortization
Net carrying amount
Amortized intangible assets:
Software . . . . . . . . . . . . . . . . . . . ¥ 659,097 ¥ 549,079 ¥110,018 ¥ 511,091 ¥402,858 ¥108,233
Software for internal use . . . . . . . 445,098 311,220 133,878 537,258 346,812 190,446
Patents . . . . . . . . . . . . . . . . . . . . 103,489 75,456 28,033 120,429 70,990 49,439
Other . . . . . . . . . . . . . . . . . . . . . . 132,926 92,834 40,092 120,168 83,951 36,217
¥1,340,610 ¥1,028,589 ¥312,021 ¥1,288,946 ¥904,611 ¥384,335
Indefinite-lived intangible assets . . . . ¥ 8,644 ¥ – ¥ 8,644 ¥ 8,428 ¥ – ¥ 8,428
Thousands of U.S. dollars
2009
Gross carrying amount
Accumulated amortization
Net carrying amount
Amortized intangible assets:
Software . . . . . . . . . . . . . . . . . . . $ 6,725,480 $ 5,602,847 $1,122,633
Software for internal use . . . . . . . 4,541,816 3,175,714 1,366,102
Patents . . . . . . . . . . . . . . . . . . . . 1,056,010 769,959 286,051
Other . . . . . . . . . . . . . . . . . . . . . . 1,356,388 947,286 409,102
$13,679,694 $10,495,806 $3,183,888
Indefinite-lived intangible assets . . . . $ 88,204 $ – $ 88,204
The following table shows the estimated aggregate amortization expense of intangible assets for the next five years.
Years ending March 31 Millions of yenThousands of
U.S. dollars
2010 . . . . . . . . . . . . . . . . . . . . . . . . . . . . . . . . . . . . . . . . . . . . . . . . . . . . . . . . . . . . . . ¥93,628 $955,388
2011 . . . . . . . . . . . . . . . . . . . . . . . . . . . . . . . . . . . . . . . . . . . . . . . . . . . . . . . . . . . . . . 72,111 735,827
2012 . . . . . . . . . . . . . . . . . . . . . . . . . . . . . . . . . . . . . . . . . . . . . . . . . . . . . . . . . . . . . . 54,639 557,541
2013 . . . . . . . . . . . . . . . . . . . . . . . . . . . . . . . . . . . . . . . . . . . . . . . . . . . . . . . . . . . . . . 31,113 317,480
2014 . . . . . . . . . . . . . . . . . . . . . . . . . . . . . . . . . . . . . . . . . . . . . . . . . . . . . . . . . . . . . . 21,786 222,306
The changes in the carrying amount of goodwill, which is included in other assets, for the years ended March 31, 2009 and 2008 are as follows:
Millions of yenThousands of
U.S. dollars
2009 2008 2009
Balance at beginning of the year . . . . . . . . . . . . . . . . . . . . . . . . . . . . . ¥159,039 ¥148,431 $1,622,847
Acquired during the year . . . . . . . . . . . . . . . . . . . . . . . . . . . . . . . . . 8,859 26,154 90,398
Impairment loss . . . . . . . . . . . . . . . . . . . . . . . . . . . . . . . . . . . . . . . . (24,560) (7,448) (250,612)
Translation adjustment and other . . . . . . . . . . . . . . . . . . . . . . . . . . . (8,908) (8,098) (90,898)
Balance at end of the year . . . . . . . . . . . . . . . . . . . . . . . . . . . . . . . . . . ¥134,430 ¥159,039 $1,371,735
59Hitachi, Ltd.Annual Report 2009
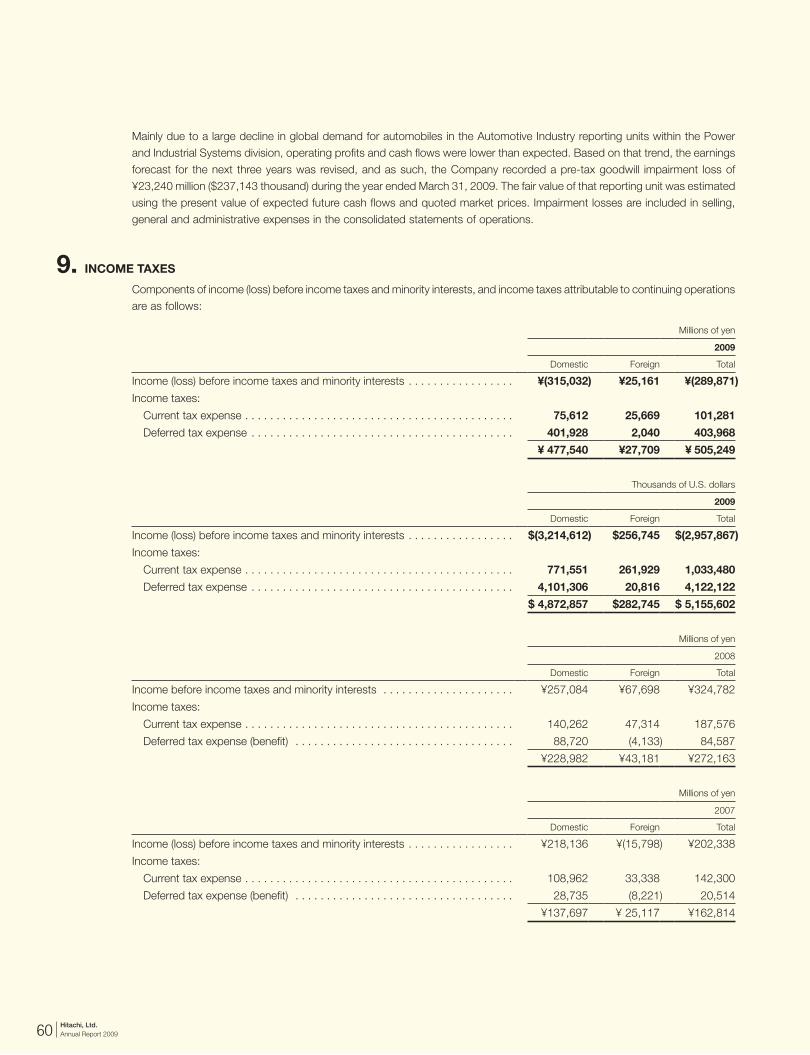
Mainly due to a large decline in global demand for automobiles in the Automotive Industry reporting units within the Power and Industrial Systems division, operating profits and cash flows were lower than expected. Based on that trend, the earnings forecast for the next three years was revised, and as such, the Company recorded a pre-tax goodwill impairment loss of ¥23,240 million ($237,143 thousand) during the year ended March 31, 2009. The fair value of that reporting unit was estimated using the present value of expected future cash flows and quoted market prices. Impairment losses are included in selling, general and administrative expenses in the consolidated statements of operations.
9. iNcomE tAxES
Components of income (loss) before income taxes and minority interests, and income taxes attributable to continuing operations are as follows:
Millions of yen
2009
Domestic Foreign Total
Income (loss) before income taxes and minority interests . . . . . . . . . . . . . . . . . ¥(315,032) ¥25,161 ¥(289,871)
Income taxes:
Current tax expense . . . . . . . . . . . . . . . . . . . . . . . . . . . . . . . . . . . . . . . . . . . 75,612 25,669 101,281
Deferred tax expense . . . . . . . . . . . . . . . . . . . . . . . . . . . . . . . . . . . . . . . . . . 401,928 2,040 403,968
¥ 477,540 ¥27,709 ¥ 505,249
Thousands of U.S. dollars
2009
Domestic Foreign Total
Income (loss) before income taxes and minority interests . . . . . . . . . . . . . . . . . $(3,214,612) $256,745 $(2,957,867)
Income taxes:
Current tax expense . . . . . . . . . . . . . . . . . . . . . . . . . . . . . . . . . . . . . . . . . . . 771,551 261,929 1,033,480
Deferred tax expense . . . . . . . . . . . . . . . . . . . . . . . . . . . . . . . . . . . . . . . . . . 4,101,306 20,816 4,122,122
$ 4,872,857 $282,745 $ 5,155,602
Millions of yen
2008
Domestic Foreign Total
Income before income taxes and minority interests . . . . . . . . . . . . . . . . . . . . . ¥257,084 ¥67,698 ¥324,782
Income taxes:
Current tax expense . . . . . . . . . . . . . . . . . . . . . . . . . . . . . . . . . . . . . . . . . . . 140,262 47,314 187,576
Deferred tax expense (benefit) . . . . . . . . . . . . . . . . . . . . . . . . . . . . . . . . . . . 88,720 (4,133) 84,587
¥228,982 ¥43,181 ¥272,163
Millions of yen
2007
Domestic Foreign Total
Income (loss) before income taxes and minority interests . . . . . . . . . . . . . . . . . ¥218,136 ¥(15,798) ¥202,338
Income taxes:
Current tax expense . . . . . . . . . . . . . . . . . . . . . . . . . . . . . . . . . . . . . . . . . . . 108,962 33,338 142,300
Deferred tax expense (benefit) . . . . . . . . . . . . . . . . . . . . . . . . . . . . . . . . . . . 28,735 (8,221) 20,514
¥137,697 ¥ 25,117 ¥162,814
60 Hitachi, Ltd.Annual Report 2009

Significant components of income tax expense (benefit) attributable to continuing operations and other comprehensive income (loss), net of reclassification adjustments, for the years ended March 31, 2009, 2008 and 2007 are as follows:
Millions of yenThousands of
U.S. dollars
2009 2008 2007 2009
Continuing operations:
Current tax expense . . . . . . . . . . . . . . . . . . . . . . . . . . . . . . . . ¥ 101,281 ¥ 187,576 ¥142,300 $ 1,033,480
Deferred tax benefit (exclusive of the effects of other components listed below) . . . . . . . . . . . . . . . . . . . . . . (187,751) (64,422) (25,298) (1,915,827)
Change in valuation allowance . . . . . . . . . . . . . . . . . . . . . . . . 591,719 149,009 45,812 6,037,949
505,249 272,163 162,814 5,155,602
Other comprehensive income (loss), net of reclassification adjustments:
Minimum pension liability adjustments . . . . . . . . . . . . . . . . . . – – 15,540 –
Pension liability adjustments . . . . . . . . . . . . . . . . . . . . . . . . . . (53,171) (61,538) – (542,561)
Net unrealized holding gain on available-for-sale securities . . . . . . . . . . . . . . . . . . . . . . . . . . (14,915) (39,318) (7,204) (152,194)
Cash flow hedges . . . . . . . . . . . . . . . . . . . . . . . . . . . . . . . . . (2,323) 205 474 (23,704)
(70,409) (100,651) 8,810 (718,459)
Adjustment to initially apply SFAS No. 158 . . . . . . . . . . . . . . . . . – – (16,847) –
¥ 434,840 ¥ 171,512 ¥154,777 $ 4,437,143
The Company and its domestic subsidiaries are subject to a national corporate tax of 30%, an inhabitant tax of between 17.3% and 20.7% and a deductible business tax between 3.8% and 10.1%, which in the aggregate resulted in a combined statutory income tax rate of approximately 40.6% for the years ended March 31, 2009, 2008 and 2007.
The Company adopted the consolidated taxation system in Japan effective from the year ended March 31, 2003. Under the consolidated taxation system, the Company consolidates, for Japanese tax purposes, all wholly-owned domestic subsidiaries.
Reconciliations between the combined statutory income tax rate and the effective income tax rate as a percentage of income (loss) before income taxes and minority interests are as follows:
2009 2008 2007
Combined statutory income tax rate . . . . . . . . . . . . . . . . . . . . . . . . . . . . . . . . . (40.6)% 40.6% 40.6%
Equity in net (earnings) loss of affiliated companies . . . . . . . . . . . . . . . . . . . . 22.7 (2.8) (2.3)
Change in excess amounts over the tax basis of investments in subsidiaries and affiliated companies . . . . . . . . . . . . . . . . . . . (18.3) 1.7 7.6
Adjustment on sale of investments in subsidiaries and affiliated companies . . . 0.5 (7.9) (0.4)
Expenses not deductible for tax purposes . . . . . . . . . . . . . . . . . . . . . . . . . . . 5.4 4.0 9.0
Impairment of goodwill . . . . . . . . . . . . . . . . . . . . . . . . . . . . . . . . . . . . . . . . . . 3.4 0.9 0.3
Change in valuation allowance . . . . . . . . . . . . . . . . . . . . . . . . . . . . . . . . . . . . 204.1 45.9 22.6
Difference in statutory tax rates of foreign subsidiaries . . . . . . . . . . . . . . . . . . (4.0) 2.2 2.8
Other, net . . . . . . . . . . . . . . . . . . . . . . . . . . . . . . . . . . . . . . . . . . . . . . . . . . . . 1.1 (0.8) 0.3
Effective income tax rate . . . . . . . . . . . . . . . . . . . . . . . . . . . . . . . . . . . . . . . . . . 174.3% 83.8% 80.5%
The Company recognized an additional valuation allowance during the year ended March 31, 2009 resulting from the reassessment of the realizabilitiy of the beginning of the year deferred tax assets mainly related to the deductible temporary differences associated with retirement benefits and net operating loss carryforwards. The Company concluded that the generation of significant taxable income of the Company and certain subsidiaries was not expected in near future and therefore increased the valuation allowance related to the deferred tax assets associated with those entities. An increase in valuation allowance for the year ended March 31, 2008 resulted mainly from a decline in profitability in the plasma TV business. An increase in valuation allowance for the year ended March 31, 2007 resulted mainly from provisions recorded for anticipated losses on certain long-term contracts.
61Hitachi, Ltd.Annual Report 2009

The tax effects of temporary differences and carryforwards that give rise to significant portions of the deferred tax assets and liabilities as of March 31, 2009 and 2008 are presented below:
Millions of yenThousands of
U.S. dollars
2009 2008 2009
Total gross deferred tax assets:
Retirement and severance benefits . . . . . . . . . . . . . . . . . . . . . . . . . . ¥ 467,356 ¥ 352,826 $ 4,768,939
Accrued expenses . . . . . . . . . . . . . . . . . . . . . . . . . . . . . . . . . . . . . . . 295,334 251,898 3,013,612
Property, plant and equipment, due to differences in depreciation . . . 56,522 41,974 576,755
Net operating loss carryforwards . . . . . . . . . . . . . . . . . . . . . . . . . . . . 214,017 157,346 2,183,847
Other . . . . . . . . . . . . . . . . . . . . . . . . . . . . . . . . . . . . . . . . . . . . . . . . . 368,682 326,047 3,762,061
1,401,911 1,130,091 14,305,214
Valuation allowance . . . . . . . . . . . . . . . . . . . . . . . . . . . . . . . . . . . . . . . . (1,067,145) (449,237) (10,889,235)
334,766 680,854 3,415,979
Total gross deferred tax liabilities:
Deferred profit on sale of properties . . . . . . . . . . . . . . . . . . . . . . . . . . (27,172) (31,230) (277,265)
Tax purpose reserves regulated by Japanese tax laws . . . . . . . . . . . . (7,658) (12,091) (78,143)
Net unrealized gain on securities . . . . . . . . . . . . . . . . . . . . . . . . . . . . – (27,808) –
Other . . . . . . . . . . . . . . . . . . . . . . . . . . . . . . . . . . . . . . . . . . . . . . . . . (50,501) (42,362) (515,316)
(85,331) (113,491) (870,724)
Net deferred tax asset . . . . . . . . . . . . . . . . . . . . . . . . . . . . . . . . . . . . ¥ 249,435 ¥ 567,363 $ 2,545,255
In addition to the above, income taxes paid on net intercompany profit on assets remaining within the group, which had been deferred in accordance with Accounting Research Bulletin No. 51, “Consolidated Financial Statements,” as of March 31, 2009 and 2008 are reflected in the accompanying consolidated balance sheets under the following captions:
Millions of yenThousands of
U.S. dollars
2009 2008 2009
Prepaid expenses and other current assets . . . . . . . . . . . . . . . . . . . . . . ¥19,164 ¥25,771 $195,551
Other assets . . . . . . . . . . . . . . . . . . . . . . . . . . . . . . . . . . . . . . . . . . . . . 52,044 55,486 531,061
¥71,208 ¥81,257 $726,612
Components of deferred tax assets as of March 31, 2009 and 2008 are reflected in the accompanying consolidated balance sheets under the following captions:
Millions of yenThousands of
U.S. dollars
2009 2008 2009
Prepaid expenses and other current assets . . . . . . . . . . . . . . . . . . . . . . ¥141,884 ¥279,378 $1,447,796
Other assets . . . . . . . . . . . . . . . . . . . . . . . . . . . . . . . . . . . . . . . . . . . . . 185,268 335,153 1,890,489
Other current liabilities . . . . . . . . . . . . . . . . . . . . . . . . . . . . . . . . . . . . . . (4,089) (1,774) (41,724)
Other liabilities . . . . . . . . . . . . . . . . . . . . . . . . . . . . . . . . . . . . . . . . . . . . (73,628) (45,394) (751,306)
Net deferred tax asset . . . . . . . . . . . . . . . . . . . . . . . . . . . . . . . . . . . . . . ¥249,435 ¥567,363 $2,545,255
62 Hitachi, Ltd.Annual Report 2009

A valuation allowance was recorded against deferred tax assets for deductible temporary differences, net operating loss carryforwards and tax credit carryforwards, taking into account the tax laws of various jurisdictions in which the Company and its subsidiaries operate. The net changes in the total valuation allowance for the years ended March 31, 2009 and 2008 were an increase of ¥617,908 million ($6,305,184 thousand) and ¥136,159 million, respectively.
In assessing the realizability of deferred tax assets, management of the Company considers whether it is more likely than not that some portion or all of the deferred tax assets will not be realized. The ultimate realization of deferred tax assets is dependent upon the generation of future taxable income in specific tax jurisdictions during the periods in which these deductible differences become deductible. Although realization is not assured, management considered the scheduled reversals of deferred tax liabilities and projected future taxable income, including the execution of certain available tax strategies if needed, in making this assessment. Based on these factors, management believes it is more likely than not the Company will realize the benefits of these deductible differences, net of the existing valuation allowance as of March 31, 2009.
As of March 31, 2009, the Company and various subsidiaries have operating loss carryforwards of ¥675,756 million ($6,895,469 thousand) which are available to offset future taxable income, if any. Operating loss carryforwards of ¥169,343 million ($1,727,990 thousand) expire by March 31, 2014, ¥481,407 million ($4,912,316 thousand) expire by March 31, 2019, and ¥25,006 million ($255,163 thousand) expire in various years thereafter or do not expire.
Deferred tax liabilities have not been recognized for excess amounts over the tax basis of investments in foreign subsidiaries that are considered to be reinvested indefinitely, because such differences will not reverse in the foreseeable future and those undistributed earnings, if remitted, generally would not result in material additional Japanese income taxes because of non-taxable dividends from foreign subsidiaries. Determination of such liabilities is not practicable.
10. Short-tErm ANd LoNg-tErm dEBt
The components of short-term debt as of March 31, 2009 and 2008 are summarized as follows:
Millions of yenThousands of
U.S. dollars
2009 2008 2009
Borrowings, mainly from banks . . . . . . . . . . . . . . . . . . . . . . . . . . . . . . ¥659,250 ¥522,947 $ 6,727,041
Commercial paper . . . . . . . . . . . . . . . . . . . . . . . . . . . . . . . . . . . . . . . . 325,852 149,461 3,325,020
Borrowings from affiliates . . . . . . . . . . . . . . . . . . . . . . . . . . . . . . . . . . . 13,720 50,612 140,000
¥998,822 ¥723,020 $10,192,061
The weighted average interest rate on short-term debt outstanding as of March 31, 2009 and 2008 was 0.6% and 0.8%, respectively.
63Hitachi, Ltd.Annual Report 2009

The components of long-term debt as of March 31, 2009 and 2008 are summarized as follows:
Millions of yenThousands of
U.S. dollars
2009 2008 2009
Unsecured notes and debentures:
Due 2013, interest 0.72% debenture . . . . . . . . . . . . . . . . . . . . . . . . ¥ 80,000 ¥ 80,000 $ 816,327
Due 2010, interest 0.7% debenture . . . . . . . . . . . . . . . . . . . . . . . . . 49,895 49,890 509,133
Due 2015, interest 1.56% debenture . . . . . . . . . . . . . . . . . . . . . . . . 49,984 49,982 510,041
Due 2008, interest 0.52% debenture . . . . . . . . . . . . . . . . . . . . . . . . – 5,000 –
Due 2010, interest 0.74% debenture . . . . . . . . . . . . . . . . . . . . . . . . 5,000 5,000 51,020
Due 2009–2018, interest 0.53–2.78%, issued by subsidiaries . . . . . 451,293 537,117 4,605,031
Unsecured convertible debentures:
Series A, due 2009, zero coupon . . . . . . . . . . . . . . . . . . . . . . . . . . . 50,000 50,000 510,204
Series B, due 2009, zero coupon . . . . . . . . . . . . . . . . . . . . . . . . . . . 50,000 50,000 510,204
Due 2016 and 2019, zero coupon, issued by a subsidiary . . . . . . . . 40,000 40,000 408,163
Loans, principally from banks and insurance companies:
Secured by various assets and mortgages on property, plant and equipment, maturing 2009–2018, interest 1.85–8% . . . . 45,081 43,004 460,010
Unsecured, maturing 2009–2026, interest 0.65–6.97% . . . . . . . . . . 966,488 879,227 9,862,122
Capital lease obligations . . . . . . . . . . . . . . . . . . . . . . . . . . . . . . . . . . . 33,546 19,266 342,306
1,821,287 1,808,486 18,584,561
Less current portion . . . . . . . . . . . . . . . . . . . . . . . . . . . . . . . . . . . . . . . 531,635 386,879 5,424,847
¥1,289,652 ¥1,421,607 $13,159,714
The aggregate annual maturities of long-term debt after March 31, 2010 are as follows:
Years ending March 31 Millions of yenThousands of
U.S. dollars
2011 . . . . . . . . . . . . . . . . . . . . . . . . . . . . . . . . . . . . . . . . . . . . . . . . . . . . . . . . . . . . . . . ¥ 258,487 $ 2,637,622
2012 . . . . . . . . . . . . . . . . . . . . . . . . . . . . . . . . . . . . . . . . . . . . . . . . . . . . . . . . . . . . . . . 341,866 3,488,429
2013 . . . . . . . . . . . . . . . . . . . . . . . . . . . . . . . . . . . . . . . . . . . . . . . . . . . . . . . . . . . . . . . 197,613 2,016,459
2014 . . . . . . . . . . . . . . . . . . . . . . . . . . . . . . . . . . . . . . . . . . . . . . . . . . . . . . . . . . . . . . . 169,317 1,727,724
Thereafter . . . . . . . . . . . . . . . . . . . . . . . . . . . . . . . . . . . . . . . . . . . . . . . . . . . . . . . . . . . 322,369 3,289,480
¥1,289,652 $13,159,714
Short-term and long-term debt above include secured borrowings resulting from the transfers of financial assets such as trade receivables which do not meet the criteria for a sale pursuant to SFAS No. 140 and are accounted for as secured borrowings with pledge of collateral. The transferred assets are restricted solely to satisfy the obligation of the pledge. Short-term debt above as of March 31, 2009 and 2008 includes such borrowings of ¥10,008 million ($102,122 thousand) and ¥61,778 million, and long-term debt above as of March 31, 2009 and 2008 includes such borrowings of ¥36,096 million ($368,327 thousand) and ¥38,029 million, respectively.
As is customary in Japan, both short-term and long-term bank loans are made under general agreements that provide that securities and guarantees for present and future indebtedness will be given upon request of the bank, and that the bank shall have the right, as the obligations become due, or in the event of their default, to offset cash deposits against such obligations.
Generally, the mortgage debenture trust agreements and certain secured and unsecured loan agreements provide, among other things, that the lenders or trustees shall have the right to have any distribution of earnings, including the payment of dividends and the issuance of additional capital stock, submitted to them for prior approval and also grant them the right to request additional securities or mortgages on property, plant and equipment.
64 Hitachi, Ltd.Annual Report 2009

In October, 2004, the Company issued Euroyen zero coupon convertible bonds. The bonds consist of ¥50,000 million series A zero coupon convertible bonds due 2009 and ¥50,000 million series B zero coupon convertible bonds due 2009. The bondholders are entitled to stock acquisition rights effective from November 2, 2004 to October 5, 2009. The initial conversion price was ¥1,009 per share for both bonds at which time the fair value of the Company’s common stock was ¥686. In accordance with the terms of the debenture, the conversion price was adjusted to ¥822 on October 19, 2005 and on October 19, 2007 for series A zero coupon convertible bonds and on April 19, 2006 and on April 19, 2008 for series B zero coupon convertible bonds. During the conversion period, the bondholders may exercise the stock acquisition rights anytime after the closing price of the Company’s shares at the Tokyo Stock Exchange on at least one trading day is 115 percent or more of the then applicable conversion price rounded down to the nearest yen.
In September, 2007, Hitachi Metals Ltd. (the issuer), a subsidiary of the Company, issued ¥20,000 million Euroyen zero coupon convertible bonds due 2016 (the 2016 bonds) and ¥20,000 million Euroyen zero coupon convertible bonds due 2019 (the 2019 bonds) (together, “the Bonds”). In the case of the 2016 bonds, the bondholders are entitled to stock acquisition rights effective from September 27, 2007 to August 30, 2016 and the initial conversion price is ¥2,056 per share. In the case of the 2019 bonds, the bondholders are entitled to stock acquisition rights effective from September 27, 2007 to August 30, 2019 and the initial conversion price is ¥2,042 per share. The closing price of the shares on August 28, 2007, as reported by Tokyo Stock Exchange, was ¥1,344 per share. The stock acquisition rights may be exercised by the holder of the bonds during any particular calendar quarter only if the closing price of the shares for any 20 trading days in a period of 30 consecutive trading days ending on the last trading day of the immediately preceding calendar quarter is more than 120% of the conversion price. The Bonds also contain other embedded features, none of which were required to be bifurcated, such as the issuer’s call option, the issuer’s cash-settlement option, and the investors’ put option. By giving notice to the bondholders on or after September 13, 2012 (in the case of the 2016 bonds), or on or after September 13, 2014 (in the case of the 2019 bonds), the issuer may acquire from all bondholders all of the relevant bonds under the cash-settlement option, and upon reacquiring the Bonds, the issuer is required to pay the bondholders cash equal to 100% of the principal amount and deliver common shares of the issuer with a fair value equivalent to the fair value of the stock acquisition rights. As for the put option, the bondholders are entitled, at their option, to require the issuer to redeem the Bonds at a redemption price of 100% of the principal amount on September 13, 2010 and September 13, 2013 (with respect to the 2016 bonds) and on September 13, 2011 and September 11, 2015 (with respect to the 2019 bonds).
11. rEtirEmENt ANd SEvErANcE BENEfitS
(a) Defined benefit plansThe Company and its subsidiaries have a number of contributory and noncontributory pension plans to provide retirement and severance benefits to substantially all employees.
Under unfunded defined benefit pension plans, employees are entitled to lump-sum payments based on their earnings and the length of service by retirement or termination of employment for reasons other than dismissal for cause.
In addition to unfunded defined benefit pension plans, the Company and certain subsidiaries make contributions to a number of defined benefit pension plans. The Company and certain subsidiaries adopted cash balance plans, and certain subsidiaries amended certain of their defined benefit plans to cash balance plans during the years ended March 31, 2009, 2008 and 2007.
Under the cash balance plans, each employee has a notional account which represents pension benefits. The balance in the notional account is based on principal credits, which are accumulated as employees render services, and interest credits, which are determined based on the market interest rates.
65Hitachi, Ltd.Annual Report 2009

On March 31, 2007, the Company adopted the recognition and disclosure provisions of SFAS No. 158. SFAS No. 158 requires the Company to recognize the funded status (i.e., the difference between the fair value of plan assets and the projected benefit obligations) of its pension plans in the consolidated balance sheet, with a corresponding adjustment to accumulated other comprehensive income (loss), net of tax. The adjustment to accumulated other comprehensive income (loss) represents the net unrecognized actuarial losses and unrecognized prior service costs. Prior to March 31, 2007, these amounts were netted against the plan’s funded status in the consolidated balance sheet pursuant to the provisions of SFAS No. 87. These amounts are subsequently recognized as net periodic benefit cost pursuant to the Company’s historical accounting policy for amortizing such amounts. Furthermore, actuarial gains and losses that are not recognized as net periodic benefit cost in the same periods are recognized as a component of other comprehensive income (loss). Those amounts are subsequently recognized as a component of net periodic benefit cost on the same basis.
The incremental effects of adopting the provisions of SFAS No. 158 on the Company’s consolidated balance sheet as of March 31, 2007 are presented in the following table. The adoption of SFAS No. 158 had no effect on the Company’s consolidated statement of operations for the year ended March 31, 2007 or for any prior period presented, and it will not effect the Company’s operating results in future periods. Had the Company not been required to adopt SFAS No. 158 as of March 31, 2007, it would have recognized an additional minimum liability pursuant to the provisions of SFAS No. 87. The effect of recognizing the additional minimum liability is included in the table below in the column labeled “Before Application of SFAS No. 158.”
Millions of yen
Before application of
SFAS No. 158 Adjustment
After application of
SFAS No. 158
2007
Prepaid expenses and other current assets . . . . . . . . . . . . . . . . . . . . . . . . . . ¥ 676,287 ¥11,267 ¥ 687,554
Investments and advances, including affiliated companies . . . . . . . . . . . . . . . 1,052,979 (3,255) 1,049,724
Other assets . . . . . . . . . . . . . . . . . . . . . . . . . . . . . . . . . . . . . . . . . . . . . . . . . 1,418,075 53,348 1,471,423
Accrued expenses . . . . . . . . . . . . . . . . . . . . . . . . . . . . . . . . . . . . . . . . . . . . . 870,107 32,057 902,164
Retirement and severance benefits . . . . . . . . . . . . . . . . . . . . . . . . . . . . . . . . 760,199 58,258 818,457
Minority interests . . . . . . . . . . . . . . . . . . . . . . . . . . . . . . . . . . . . . . . . . . . . . . 1,080,285 (6,536) 1,073,749
Accumulated other comprehensive loss . . . . . . . . . . . . . . . . . . . . . . . . . . . . . (66,031) (22,419) (88,450)
Net periodic benefit cost for the funded benefit pension plans and the unfunded lump-sum payment plans for the years ended March 31, 2009, 2008 and 2007 consists of the following components:
Millions of yenThousands of
U.S. dollars
2009 2008 2007 2009
Service cost . . . . . . . . . . . . . . . . . . . . . . . . . . . . . . . . . . . . . . . . ¥ 72,064 ¥ 71,577 ¥ 72,648 $ 735,347
Interest cost . . . . . . . . . . . . . . . . . . . . . . . . . . . . . . . . . . . . . . . 54,701 56,079 55,888 558,173
Expected return on plan assets for the period . . . . . . . . . . . . . . (45,804) (44,911) (40,253) (467,388)
Amortization of prior service benefit . . . . . . . . . . . . . . . . . . . . . . (21,103) (23,627) (18,571) (215,336)
Recognized actuarial loss . . . . . . . . . . . . . . . . . . . . . . . . . . . . . 71,857 58,326 56,388 733,235
Transfer to defined contribution pension plan . . . . . . . . . . . . . . . (1,289) (1,611) 1,039 (13,153)
Curtailment gain . . . . . . . . . . . . . . . . . . . . . . . . . . . . . . . . . . . . – (388) – –
Employees’ contributions . . . . . . . . . . . . . . . . . . . . . . . . . . . . . . (489) (346) (362) (4,990)
Net periodic benefit cost . . . . . . . . . . . . . . . . . . . . . . . . . . . . . . ¥129,937 ¥115,099 ¥126,777 $1,325,888
Prior to the adoption of the recognition provisions of SFAS No. 158 on March 31, 2007, unrecognized prior service benefit and cost and unrecognized actuarial gain and loss were amortized using the straight-line method over the average remaining service period of active employees.
66 Hitachi, Ltd.Annual Report 2009

The estimated prior service cost and actuarial loss for the defined benefit pension plans that will be amortized from accumulated other comprehensive income (loss) into net periodic benefit cost during the year ending March 31, 2010 are as follows:
Millions of yenThousands of
U.S. dollars
Prior service benefit . . . . . . . . . . . . . . . . . . . . . . . . . . . . . . . . . . . . . . . . . . . . . . . . . . . . . . ¥(22,381) $(228,378)
Actuarial loss . . . . . . . . . . . . . . . . . . . . . . . . . . . . . . . . . . . . . . . . . . . . . . . . . . . . . . . . . . . 97,187 991,704
Reconciliations of beginning and ending balances of the benefit obligation of the funded defined benefit pension plans and the unfunded defined benefit pension plans and the fair value of the plan assets are as follows:
Millions of yenThousands of
U.S. dollars
2009 2008 2009
Change in benefit obligation:
Benefit obligation at beginning of year . . . . . . . . . . . . . . . . . . . . . . . . ¥ 2,219,577 ¥2,262,258 $ 22,648,745
Service cost . . . . . . . . . . . . . . . . . . . . . . . . . . . . . . . . . . . . . . . . . . . . 72,064 71,577 735,347
Interest cost . . . . . . . . . . . . . . . . . . . . . . . . . . . . . . . . . . . . . . . . . . . . 54,701 56,079 558,173
Plan amendments . . . . . . . . . . . . . . . . . . . . . . . . . . . . . . . . . . . . . . . (2,155) (7,864) (21,990)
Actuarial (gain) loss . . . . . . . . . . . . . . . . . . . . . . . . . . . . . . . . . . . . . . (33,410) 11,192 (340,918)
Benefits paid . . . . . . . . . . . . . . . . . . . . . . . . . . . . . . . . . . . . . . . . . . . (155,712) (128,182) (1,588,898)
Acquisitions and divestitures . . . . . . . . . . . . . . . . . . . . . . . . . . . . . . . 90,984 (10,587) 928,408
Transfer to defined contribution pension plan . . . . . . . . . . . . . . . . . . . (28,643) (22,631) (292,275)
Curtailment . . . . . . . . . . . . . . . . . . . . . . . . . . . . . . . . . . . . . . . . . . . . – (736) –
Foreign currency exchange rate changes . . . . . . . . . . . . . . . . . . . . . . (11,947) (11,529) (121,908)
Benefit obligation at end of year . . . . . . . . . . . . . . . . . . . . . . . . . . . . . 2,205,459 2,219,577 22,504,684
Change in plan assets:
Fair value of plan assets at beginning of year . . . . . . . . . . . . . . . . . . . 1,381,049 1,468,924 14,092,337
Actual return on plan assets . . . . . . . . . . . . . . . . . . . . . . . . . . . . . . . . (295,345) (142,979) (3,013,724)
Employers’ contributions:
Cash . . . . . . . . . . . . . . . . . . . . . . . . . . . . . . . . . . . . . . . . . . . . . . . 106,826 125,876 1,090,061
Available-for-sale securities . . . . . . . . . . . . . . . . . . . . . . . . . . . . . . . – 42,240 –
Employees’ cash contributions . . . . . . . . . . . . . . . . . . . . . . . . . . . . . . 489 346 4,990
Benefits paid . . . . . . . . . . . . . . . . . . . . . . . . . . . . . . . . . . . . . . . . . . . (107,993) (93,236) (1,101,969)
Acquisitions and divestitures . . . . . . . . . . . . . . . . . . . . . . . . . . . . . . . 49,899 (5,385) 509,173
Transfer to defined contribution pension plan . . . . . . . . . . . . . . . . . . . (1,346) (5,068) (13,735)
Foreign currency exchange rate changes . . . . . . . . . . . . . . . . . . . . . . (9,933) (9,669) (101,357)
Fair value of plan assets at end of year . . . . . . . . . . . . . . . . . . . . . . . . 1,123,646 1,381,049 11,465,776
Funded status . . . . . . . . . . . . . . . . . . . . . . . . . . . . . . . . . . . . . . . . . . . . (1,081,813) (838,528) (11,038,908)
Amounts recognized in the consolidated balance sheets as of March 31, 2009 and 2008 are as follows:
Millions of yenThousands of
U.S. dollars
2009 2008 2009
Other assets . . . . . . . . . . . . . . . . . . . . . . . . . . . . . . . . . . . . . . . . . . . . . ¥ 6,282 ¥ 20,277 $ 64,102
Accrued expenses . . . . . . . . . . . . . . . . . . . . . . . . . . . . . . . . . . . . . . . . . (38,498) (36,365) (392,837)
Retirement and severance benefits . . . . . . . . . . . . . . . . . . . . . . . . . . . . (1,049,597) (822,440) (10,710,173)
¥(1,081,813) ¥(838,528) $(11,038,908)
67Hitachi, Ltd.Annual Report 2009

Amounts recognized in accumulated other comprehensive loss as of March 31, 2009 and 2008 consist of:
Millions of yenThousands of
U.S. dollars
2009 2008 2009
Prior service benefit . . . . . . . . . . . . . . . . . . . . . . . . . . . . . . . . . . . . . . . . ¥(175,964) ¥(194,027) $(1,795,551)
Actuarial loss . . . . . . . . . . . . . . . . . . . . . . . . . . . . . . . . . . . . . . . . . . . . . 862,629 611,645 8,802,337
¥ 686,665 ¥ 417,618 $ 7,006,786
The Company and all subsidiaries use their year-end as a measurement date. Weighted-average assumptions used to determine the year-end benefit obligations are as follows:
2009 2008
Discount rate . . . . . . . . . . . . . . . . . . . . . . . . . . . . . . . . . . . . . . . . . . . . . . . . . . . . . . . . . . . . . . 2.6% 2.5%
Rate of compensation increase . . . . . . . . . . . . . . . . . . . . . . . . . . . . . . . . . . . . . . . . . . . . . . . . 2.7% 2.7%
Weighted-average assumptions used to determine the net periodic pension cost for the years ended March 31, 2009, 2008 and 2007 are as follows:
2009 2008 2007
Discount rate . . . . . . . . . . . . . . . . . . . . . . . . . . . . . . . . . . . . . . . . . . . . . . . . . 2.5% 2.5% 2.5%
Expected long-term return on plan assets . . . . . . . . . . . . . . . . . . . . . . . . . . . 3.4% 3.1% 3.0%
Rate of compensation increase . . . . . . . . . . . . . . . . . . . . . . . . . . . . . . . . . . . 2.7% 2.7% 2.5%
The expected long-term rate of return on plan assets is developed for each asset class, and is determined primarily on historical returns on the plan assets and other factors.
The accumulated benefit obligation was ¥2,104,708 million ($21,476,612 thousand) as of March 31, 2009 and ¥2,116,141 million as of March 31, 2008.
Information for pension plans with accumulated benefit obligations in excess of plan assets and pension plans with projected benefit obligations in excess of plan assets is as follows:
Millions of yenThousands of
U.S. dollars
2009 2008 2009
Plans with accumulated benefit obligations in excess of plan assets:
Accumulated benefit obligations . . . . . . . . . . . . . . . . . . . . . . . . . . . . . ¥2,063,535 ¥1,725,275 $21,056,480
Plan assets . . . . . . . . . . . . . . . . . . . . . . . . . . . . . . . . . . . . . . . . . . . . 1,070,069 950,101 10,919,071
Plans with projected benefit obligations in excess of plan assets:
Projected benefit obligations . . . . . . . . . . . . . . . . . . . . . . . . . . . . . . . ¥2,189,327 ¥1,915,720 $22,340,071
Plan assets . . . . . . . . . . . . . . . . . . . . . . . . . . . . . . . . . . . . . . . . . . . . 1,101,232 1,056,915 11,237,061
Asset allocations for the pension plans as of March 31, 2009 and 2008 and target asset allocation by asset category are as follows:
2009 2008Target
allocation
Equity securities . . . . . . . . . . . . . . . . . . . . . . . . . . . . . . . . . . . . . . . . . . . . . . 30.6% 34.1% 37.8%
Debt securities . . . . . . . . . . . . . . . . . . . . . . . . . . . . . . . . . . . . . . . . . . . . . . . . 37.0 31.3 38.6
Investment trusts . . . . . . . . . . . . . . . . . . . . . . . . . . . . . . . . . . . . . . . . . . . . . . 12.2 12.6 16.3
Cash . . . . . . . . . . . . . . . . . . . . . . . . . . . . . . . . . . . . . . . . . . . . . . . . . . . . . . . 9.6 13.8 2.2
Life insurance company general accounts . . . . . . . . . . . . . . . . . . . . . . . . . . . 6.8 4.7 4.0
Other . . . . . . . . . . . . . . . . . . . . . . . . . . . . . . . . . . . . . . . . . . . . . . . . . . . . . . . 3.8 3.5 1.1
100.0% 100.0% 100.0%
68 Hitachi, Ltd.Annual Report 2009

The objective of the Company’s investment policy is to ensure a stable return from the plans’ investments over the long term, which allows the Company’s and certain subsidiaries’ pension funds to meet their future obligations. In order to achieve the above objective, a target rate of return is established, taking into consideration the composition of participants, level of funded status, the Company’s and certain subsidiaries’ capacity to absorb risks and the current economic environment. Also, a target asset allocation is established to achieve the target rate of return, based on expected rate of return by each asset class, standard deviation of rate of return and correlation coefficient among the assets. The investments are diversified primarily into domestic and foreign equity and debt securities according to the target asset allocation. Rebalancing will occur if markets fluctuate in excess of certain levels. The Company and certain subsidiaries periodically review actual returns on assets, economic environments and their capacity to absorb risk and realign the target asset allocation if necessary.
The Company and its subsidiaries expect to contribute ¥101,335 million ($1,034,031 thousand) to their defined benefit plans for the year ending March 31, 2010.
The following benefit payments, which reflect expected future service, as appropriate, are expected to be paid.
Years ending March 31 Millions of yenThousands of
U.S. dollars
2010 . . . . . . . . . . . . . . . . . . . . . . . . . . . . . . . . . . . . . . . . . . . . . . . . . . . . . . . . . . . . . . . . ¥139,731 $1,425,827
2011 . . . . . . . . . . . . . . . . . . . . . . . . . . . . . . . . . . . . . . . . . . . . . . . . . . . . . . . . . . . . . . . . 130,682 1,333,490
2012 . . . . . . . . . . . . . . . . . . . . . . . . . . . . . . . . . . . . . . . . . . . . . . . . . . . . . . . . . . . . . . . . 134,915 1,376,684
2013 . . . . . . . . . . . . . . . . . . . . . . . . . . . . . . . . . . . . . . . . . . . . . . . . . . . . . . . . . . . . . . . . 136,034 1,388,102
2014 . . . . . . . . . . . . . . . . . . . . . . . . . . . . . . . . . . . . . . . . . . . . . . . . . . . . . . . . . . . . . . . . 122,648 1,251,510
2015–2019 . . . . . . . . . . . . . . . . . . . . . . . . . . . . . . . . . . . . . . . . . . . . . . . . . . . . . . . . . . . 614,072 6,266,041
(b) Defined contribution plansThe Company and certain subsidiaries have a number of defined contribution plans. The amount of cost recognized for the Company’s and certain subsidiaries’ contributions to the plans for the years ended March 31, 2009, 2008 and 2007 were ¥18,059 million ($184,276 thousand), ¥15,749 million and ¥11,971 million, respectively.
12. commoN Stock
The Company has authorized issuance of 10 billion shares of common stock.
The number of issued shares and the amount of common stock for the years ended March 31, 2009, 2008, 2007 and 2006 are as follows:
Millions of yenThousands of
U.S. dollars
Issued shares Amount Amount
Balance as of March 31, 2009, 2008, 2007 and 2006 . . . . . . . . . . . 3,368,126,056 ¥282,033 $2,877,888
Conversions of convertible debt issued subsequent to October 1, 1982 into common stock were accounted for in accordance with the provisions of the Japanese Commercial Code, the former Japanese Company Law, by crediting one-half of the conversion price to each of the common stock accounts and the capital surplus accounts.
69Hitachi, Ltd.Annual Report 2009

13. LEgAL rESErvE ANd rEtAiNEd EArNiNgS, ANd dividENdS
The Japanese Company Law provides that earnings in an amount equal to 10 percent of appropriations of retained earnings to be paid as dividends should be appropriated as a capital surplus or a legal reserve until the total of capital surplus and legal reserve equals 25 percent of stated common stock. In addition to transfer from capital surplus to stated common stock, either capital surplus or legal reserve may be available for dividends by resolution of the shareholders’ meeting.
Dividends during the years ended March 31, 2009, 2008 and 2007 represent dividends declared during those years. On March 16, 2009, the Board of Directors decided not to pay the dividend for the second half of the year ended March 31, 2009.
Cash dividends per share for the years ended March 31, 2009, 2008 and 2007 were ¥3.0 ($0.03), ¥6.0 and ¥6.0, respectively, based on dividends declared with respect to earnings for the periods.
14. trEASury Stock
The Japanese Company Law (JCL) allows a company to acquire treasury stock upon shareholders’ approval to the extent that sufficient distributable funds are available. If the Board of Directors’ authority is stated in the articles of incorporation, a company is allowed to acquire treasury stock not upon shareholders’ approval but Board of Directors’ approval. Acquisition of treasury stock is allowed under the Company’s articles of incorporation.
Pursuant to the provisions of the JCL, shareholders may request the company to acquire their shares representing less than a minimum trading lot as shares less than a minimum trading lot cannot be publicly traded and such a shareholder holding less than a minimum trading lot cannot exercise a voting right and other shareholders’ rights except as provided in the JCL or the articles of incorporation. The JCL also states that a shareholder holding shares less than a minimum trading lot may request the company to sell its treasury stock, if any, to the shareholder up to a minimum trading lot if entitled under the articles of incorporation. Sale of treasury stock is allowed under the Company’s articles of incorporation.
The changes in treasury stock for the years ended March 31, 2009, 2008 and 2007 are summarized as follows:
Millions of yenThousands of
U.S. dollars
Shares Amount Amount
Balance as of March 31, 2006 . . . . . . . . . . . . . . . . . . . . . . . . . . . . . . . 37,281,295 ¥17,950
Acquisition for treasury . . . . . . . . . . . . . . . . . . . . . . . . . . . . . . . . . . . 14,974,117 12,000
Sales of treasury stock . . . . . . . . . . . . . . . . . . . . . . . . . . . . . . . . . . . (1,265,158) (748)
Stock exchange for acquisition . . . . . . . . . . . . . . . . . . . . . . . . . . . . (8,023,820) (3,863)
Balance as of March 31, 2007 . . . . . . . . . . . . . . . . . . . . . . . . . . . . . . . 42,966,434 25,339
Acquisition for treasury . . . . . . . . . . . . . . . . . . . . . . . . . . . . . . . . . . . 1,358,519 1,145
Sales of treasury stock . . . . . . . . . . . . . . . . . . . . . . . . . . . . . . . . . . . (597,224) (354)
Balance as of March 31, 2008 . . . . . . . . . . . . . . . . . . . . . . . . . . . . . . . 43,727,729 26,130 $266,633
Acquisition for treasury . . . . . . . . . . . . . . . . . . . . . . . . . . . . . . . . . . . 1,500,226 858 8,755
Sales of treasury stock . . . . . . . . . . . . . . . . . . . . . . . . . . . . . . . . . . . (1,253,991) (751) (7,663)
Balance as of March 31, 2009 . . . . . . . . . . . . . . . . . . . . . . . . . . . . . . . 43,973,964 ¥26,237 $267,725
In April 2006, the Board of Directors approved the acquisition of treasury stock up to 6,500,000 shares of the Company’s common stock for an aggregate acquisition amount not exceeding ¥5,000 million during May 2006. The Company acquired a total of 6,210,000 shares for ¥4,996 million during the period.
In December 2006, the Board of Directors approved the acquisition of treasury stock up to 30,000,000 shares of the Company’s common stock for an aggregate acquisition amount not exceeding ¥20,000 million by the end of March 2007. The Company acquired a total of 7,200,000 shares for ¥5,817 million during the period.
70 Hitachi, Ltd.Annual Report 2009

15. AccumuLAtEd othEr comprEhENSivE LoSS
Accumulated other comprehensive loss, net of related tax effects, displayed in the consolidated statements of stockholders’ equity is classified as follows:
Millions of yenThousands of
U.S. dollars
2009 2008 2007 2009
Foreign currency translation adjustments:
Balance at beginning of year . . . . . . . . . . . . . . . . . . . . . . . ¥ (69,222) ¥ (20,906) ¥ (43,426) $ (706,347)
Other comprehensive income (loss), net of reclassification adjustments . . . . . . . . . . . . . . . . . . (110,899) (48,605) 21,764 (1,131,622)
Net transfer from minority interests . . . . . . . . . . . . . . . . . . . 384 289 756 3,918
Balance at end of year . . . . . . . . . . . . . . . . . . . . . . . . . . . . ¥(179,737) ¥ (69,222) ¥ (20,906) $(1,834,051)
Minimum pension liability adjustments:
Balance at beginning of year . . . . . . . . . . . . . . . . . . . . . . . ¥(145,903)
Other comprehensive income . . . . . . . . . . . . . . . . . . . . . . 22,030
Net transfer to minority interests . . . . . . . . . . . . . . . . . . . . . (37)
Transfer to pension liability adjustments . . . . . . . . . . . . . . . 123,910
Balance at end of year . . . . . . . . . . . . . . . . . . . . . . . . . . . . ¥ –
Pension liability adjustments:
Balance at beginning of year . . . . . . . . . . . . . . . . . . . . . . . ¥(221,007) ¥(146,329) ¥ – $(2,255,174)
Other comprehensive loss, net of reclassification adjustments . . . . . . . . . . . . . . . . . . (184,153) (74,758) – (1,879,112)
Net transfer from minority interests . . . . . . . . . . . . . . . . . . . 78 80 – 796
Transfer from minimum pension liability adjustments . . . . . – – (123,910) –
Adjustment to initially apply SFAS No. 158 (note 11) . . . . . – – (22,419) –
Balance at end of year . . . . . . . . . . . . . . . . . . . . . . . . . . . . ¥(405,082) ¥(221,007) ¥(146,329) $(4,133,490)
Net unrealized holding gain on available-for-sale securities:
Balance at beginning of year . . . . . . . . . . . . . . . . . . . . . . . ¥ 22,581 ¥ 77,883 ¥ 92,626 $ 230,419
Other comprehensive loss, net of reclassification adjustments . . . . . . . . . . . . . . . . . . (22,855) (55,310) (14,744) (233,214)
Net transfer from minority interests . . . . . . . . . . . . . . . . . . . 286 8 1 2,918
Balance at end of year . . . . . . . . . . . . . . . . . . . . . . . . . . . . ¥ 12 ¥ 22,581 ¥ 77,883 $ 123
Cash flow hedges:
Balance at beginning of year . . . . . . . . . . . . . . . . . . . . . . . ¥ 450 ¥ 902 ¥ 706 $ 4,592
Other comprehensive income (loss), net of reclassification adjustments . . . . . . . . . . . . . . . . . . (2,031) (451) 196 (20,725)
Net transfer from (to) minority interests . . . . . . . . . . . . . . . . 37 (1) 0 378
Balance at end of year . . . . . . . . . . . . . . . . . . . . . . . . . . . . ¥ (1,544) ¥ 450 ¥ 902 $ (15,755)
Total accumulated other comprehensive loss:
Balance at beginning of year . . . . . . . . . . . . . . . . . . . . . . . ¥(267,198) ¥ (88,450) ¥ (95,997) $(2,726,510)
Other comprehensive income (loss), net of reclassification adjustments . . . . . . . . . . . . . . . . . . (319,938) (179,124) 29,246 (3,264,673)
Net transfer from minority interests . . . . . . . . . . . . . . . . . . . 785 376 720 8,010
Adjustment to initially apply SFAS No. 158 (note 11) . . . . . – – (22,419) –
Balance at end of year . . . . . . . . . . . . . . . . . . . . . . . . . . . . ¥(586,351) ¥(267,198) ¥ (88,450) $(5,983,173)
71Hitachi, Ltd.Annual Report 2009

The following is a summary of reclassification adjustments by each classification of other comprehensive income (loss) arising during the years ended March 31, 2009, 2008 and 2007 and the amounts of income tax expense or benefit allocated to each component of other comprehensive income (loss), including reclassification adjustments.
Millions of yen
2009
Before-tax amount
Tax benefit (expense)
Net-of-tax amount
Other comprehensive loss arising during the year:
Foreign currency translation adjustments . . . . . . . . . . . . . . . . . . . . . ¥(110,285) ¥ – ¥(110,285)
Pension liability adjustments . . . . . . . . . . . . . . . . . . . . . . . . . . . . . . . (260,629) 49,582 (211,047)
Net unrealized holding gain on available-for-sale securities . . . . . . . . (54,445) 20,781 (33,664)
Cash flow hedges . . . . . . . . . . . . . . . . . . . . . . . . . . . . . . . . . . . . . . (3,615) 1,426 (2,189)
(428,974) 71,789 (357,185)
Reclassification adjustments for realized net loss included in net loss:
Foreign currency translation adjustments . . . . . . . . . . . . . . . . . . . . . (614) – (614)
Pension liability adjustments . . . . . . . . . . . . . . . . . . . . . . . . . . . . . . . 44,845 (17,951) 26,894
Net unrealized holding gain on available-for-sale securities . . . . . . . . 18,171 (7,362) 10,809
Cash flow hedges . . . . . . . . . . . . . . . . . . . . . . . . . . . . . . . . . . . . . . (28) 186 158
62,374 (25,127) 37,247
Other comprehensive loss, net of reclassification adjustments:
Foreign currency translation adjustments . . . . . . . . . . . . . . . . . . . . . (110,899) – (110,899)
Pension liability adjustments . . . . . . . . . . . . . . . . . . . . . . . . . . . . . . . (215,784) 31,631 (184,153)
Net unrealized holding gain on available-for-sale securities . . . . . . . . (36,274) 13,419 (22,855)
Cash flow hedges . . . . . . . . . . . . . . . . . . . . . . . . . . . . . . . . . . . . . . (3,643) 1,612 (2,031)
¥(366,600) ¥ 46,662 ¥(319,938)
Thousands of U.S. dollars
2009
Before-tax amount
Tax benefit (expense)
Net-of-tax amount
Other comprehensive loss arising during the year:
Foreign currency translation adjustments . . . . . . . . . . . . . . . . . . . . . $(1,125,357) $ – $(1,125,357)
Pension liability adjustments . . . . . . . . . . . . . . . . . . . . . . . . . . . . . . . (2,659,480) 505,939 (2,153,541)
Net unrealized holding gain on available-for-sale securities . . . . . . . . (555,561) 212,051 (343,510)
Cash flow hedges . . . . . . . . . . . . . . . . . . . . . . . . . . . . . . . . . . . . . . (36,888) 14,551 (22,337)
(4,377,286) 732,541 (3,644,745)
Reclassification adjustments for realized net loss included in net loss:
Foreign currency translation adjustments . . . . . . . . . . . . . . . . . . . . . (6,265) – (6,265)
Pension liability adjustments . . . . . . . . . . . . . . . . . . . . . . . . . . . . . . . 457,603 (183,174) 274,429
Net unrealized holding gain on available-for-sale securities . . . . . . . . 185,418 (75,122) 110,296
Cash flow hedges . . . . . . . . . . . . . . . . . . . . . . . . . . . . . . . . . . . . . . (286) 1,898 1,612
636,470 (256,398) 380,072
Other comprehensive loss, net of reclassification adjustments:
Foreign currency translation adjustments . . . . . . . . . . . . . . . . . . . . . (1,131,622) – (1,131,622)
Pension liability adjustments . . . . . . . . . . . . . . . . . . . . . . . . . . . . . . . (2,201,877) 322,765 (1,879,112)
Net unrealized holding gain on available-for-sale securities . . . . . . . . (370,143) 136,929 (233,214)
Cash flow hedges . . . . . . . . . . . . . . . . . . . . . . . . . . . . . . . . . . . . . . (37,174) 16,449 (20,725)
$(3,740,816) $ 476,143 $(3,264,673)
72 Hitachi, Ltd.Annual Report 2009

Millions of yen
2008
Before-tax amount
Tax benefit (expense)
Net-of-tax amount
Other comprehensive loss arising during the year:
Foreign currency translation adjustments . . . . . . . . . . . . . . . . . . . . . . . . . . ¥ (49,452) ¥ – ¥ (49,452)
Pension liability adjustments . . . . . . . . . . . . . . . . . . . . . . . . . . . . . . . . . . . . (159,751) 65,529 (94,222)
Net unrealized holding gain on available-for-sale securities . . . . . . . . . . . . . (87,015) 35,113 (51,902)
Cash flow hedges . . . . . . . . . . . . . . . . . . . . . . . . . . . . . . . . . . . . . . . . . . . 31 (230) (199)
(296,187) 100,412 (195,775)
Reclassification adjustments for realized net loss included in net loss:
Foreign currency translation adjustments . . . . . . . . . . . . . . . . . . . . . . . . . . 847 – 847
Pension liability adjustments . . . . . . . . . . . . . . . . . . . . . . . . . . . . . . . . . . . . 32,516 (13,052) 19,464
Net unrealized holding gain on available-for-sale securities . . . . . . . . . . . . . (7,023) 3,615 (3,408)
Cash flow hedges . . . . . . . . . . . . . . . . . . . . . . . . . . . . . . . . . . . . . . . . . . . (372) 120 (252)
25,968 (9,317) 16,651
Other comprehensive loss, net of reclassification adjustments:
Foreign currency translation adjustments . . . . . . . . . . . . . . . . . . . . . . . . . . (48,605) – (48,605)
Pension liability adjustments . . . . . . . . . . . . . . . . . . . . . . . . . . . . . . . . . . . . (127,235) 52,477 (74,758)
Net unrealized holding gain on available-for-sale securities . . . . . . . . . . . . . (94,038) 38,728 (55,310)
Cash flow hedges . . . . . . . . . . . . . . . . . . . . . . . . . . . . . . . . . . . . . . . . . . . (341) (110) (451)
¥(270,219) ¥ 91,095 ¥(179,124)
Millions of yen
2007
Before-tax amount
Tax benefit (expense)
Net-of-tax amount
Other comprehensive income arising during the year:
Foreign currency translation adjustments . . . . . . . . . . . . . . . . . . . . . . . . . . ¥ 19,532 ¥ – ¥ 19,532
Minimum pension liability adjustments . . . . . . . . . . . . . . . . . . . . . . . . . . . . 39,469 (17,439) 22,030
Net unrealized holding gain on available-for-sale securities . . . . . . . . . . . . . 14,230 (7,098) 7,132
Cash flow hedges . . . . . . . . . . . . . . . . . . . . . . . . . . . . . . . . . . . . . . . . . . . (173) (4) (177)
73,058 (24,541) 48,517
Reclassification adjustments for realized net gain included in net loss:
Foreign currency translation adjustments . . . . . . . . . . . . . . . . . . . . . . . . . . 2,232 – 2,232
Net unrealized holding gain on available-for-sale securities . . . . . . . . . . . . . (37,126) 15,250 (21,876)
Cash flow hedges . . . . . . . . . . . . . . . . . . . . . . . . . . . . . . . . . . . . . . . . . . . 552 (179) 373
(34,342) 15,071 (19,271)
Other comprehensive income, net of reclassification adjustments:
Foreign currency translation adjustments . . . . . . . . . . . . . . . . . . . . . . . . . . 21,764 – 21,764
Minimum pension liability adjustments . . . . . . . . . . . . . . . . . . . . . . . . . . . . 39,469 (17,439) 22,030
Net unrealized holding gain on available-for-sale securities . . . . . . . . . . . . . (22,896) 8,152 (14,744)
Cash flow hedges . . . . . . . . . . . . . . . . . . . . . . . . . . . . . . . . . . . . . . . . . . . 379 (183) 196
¥ 38,716 ¥ (9,470) ¥ 29,246
73Hitachi, Ltd.Annual Report 2009

16. pLEdgEd ASSEtS
As of March 31, 2009, the Company and certain subsidiaries pledged a portion of their assets as collateral primarily for bank loans as follows:
Millions of yenThousands of
U.S. dollars
2009 2009
Cash and cash equivalents . . . . . . . . . . . . . . . . . . . . . . . . . . . . . . . . . . . . . . . . . . . . . . . ¥ 67 $ 684
Short-term investments . . . . . . . . . . . . . . . . . . . . . . . . . . . . . . . . . . . . . . . . . . . . . . . . . . 32 326
Other current assets . . . . . . . . . . . . . . . . . . . . . . . . . . . . . . . . . . . . . . . . . . . . . . . . . . . . 4,684 47,796
Investments and advances . . . . . . . . . . . . . . . . . . . . . . . . . . . . . . . . . . . . . . . . . . . . . . . 294 3,000
Land . . . . . . . . . . . . . . . . . . . . . . . . . . . . . . . . . . . . . . . . . . . . . . . . . . . . . . . . . . . . . . . . 5,268 53,755
Buildings . . . . . . . . . . . . . . . . . . . . . . . . . . . . . . . . . . . . . . . . . . . . . . . . . . . . . . . . . . . . . 11,655 118,929
Machinery and equipment . . . . . . . . . . . . . . . . . . . . . . . . . . . . . . . . . . . . . . . . . . . . . . . . 8,243 84,112
Other assets . . . . . . . . . . . . . . . . . . . . . . . . . . . . . . . . . . . . . . . . . . . . . . . . . . . . . . . . . . 175 1,786
¥30,418 $310,388
In addition to the above, prepaid expenses and other current assets as of March 31, 2009 and 2008 include restricted cash of ¥6,906 million ($70,469 thousand) and ¥7,043 million, respectively, as a compensating balance for short-term borrowing arrangements.
17. commitmENtS ANd coNtiNgENciES
The Company and its operating subsidiaries are contingently liable for loan guarantees to its affiliates and others in the amount of approximately ¥54,927 million ($560,480 thousand) as of March 31, 2009.
Hitachi Capital Corporation (HCC) and certain other financial subsidiaries provide guarantees to financial institutions for extending loans to customers of the subsidiaries. As of March 31, 2009, the undiscounted maximum potential future payments under such guarantees amounted to ¥436,153 million ($4,450,541 thousand). For providing these guarantees, the subsidiaries obtain collateral equal to the amount of the guarantees, and therefore, the Company considers the risk to be low. The Company accrued ¥8,457 million ($86,296 thousand) as an obligation to stand ready to perform over the term of the guarantees in the event the customer cannot make scheduled payments.
The subsidiaries provide certain revolving lines of credit to its credit card holders in accordance with the terms of the credit card business customer service contracts. Furthermore, the subsidiaries provide credit facilities to parties in accordance with the service agency business contracts from which temporary payments on behalf of such parties are made. In addition, the Company and HCC provide loan commitments to affiliates and others.
The outstanding balance of these revolving lines of credit, credit facilities and loan commitments as of March 31, 2009 is as follows:
Millions of yenThousands of
U.S. dollars
2009 2009
Total commitment available . . . . . . . . . . . . . . . . . . . . . . . . . . . . . . . . . . . . . . . . . . . . . . . ¥578,682 $5,904,918
Less amount utilized . . . . . . . . . . . . . . . . . . . . . . . . . . . . . . . . . . . . . . . . . . . . . . . . . . . . 4,499 45,908
Balance available . . . . . . . . . . . . . . . . . . . . . . . . . . . . . . . . . . . . . . . . . . . . . . . . . . . . . . . ¥574,183 $5,859,010
A portion of these revolving lines of credit is pending credit approval and cannot be utilized.
74 Hitachi, Ltd.Annual Report 2009
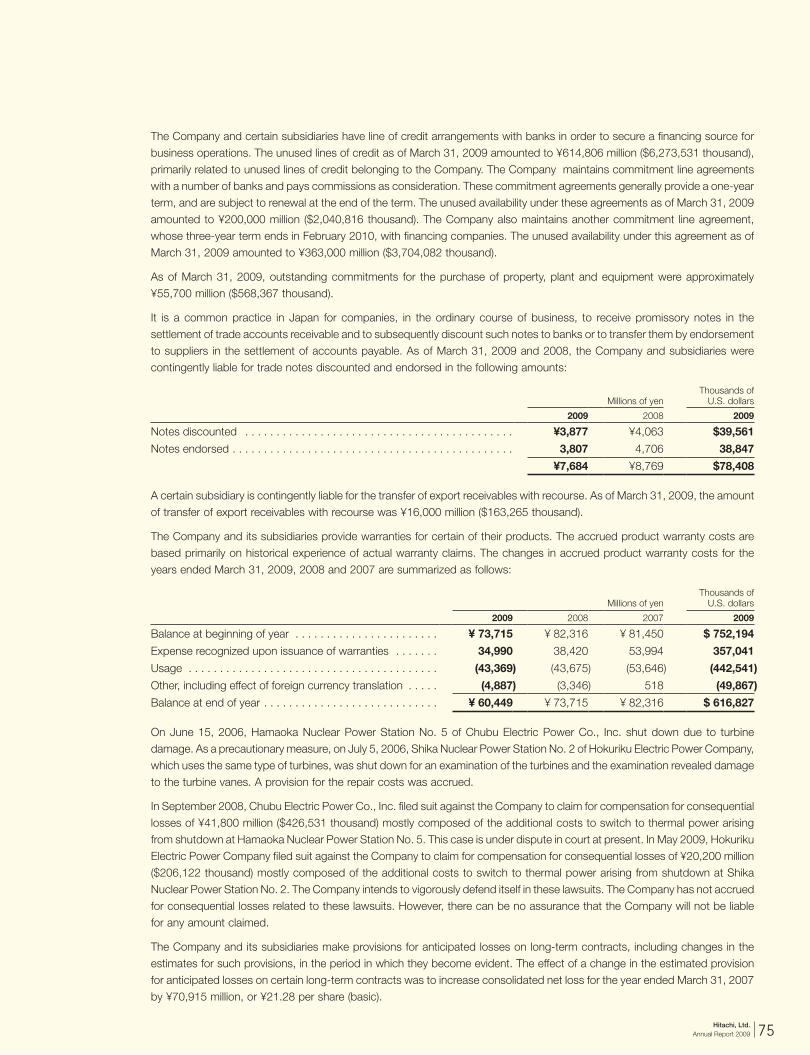
The Company and certain subsidiaries have line of credit arrangements with banks in order to secure a financing source for business operations. The unused lines of credit as of March 31, 2009 amounted to ¥614,806 million ($6,273,531 thousand), primarily related to unused lines of credit belonging to the Company. The Company maintains commitment line agreements with a number of banks and pays commissions as consideration. These commitment agreements generally provide a one-year term, and are subject to renewal at the end of the term. The unused availability under these agreements as of March 31, 2009 amounted to ¥200,000 million ($2,040,816 thousand). The Company also maintains another commitment line agreement, whose three-year term ends in February 2010, with financing companies. The unused availability under this agreement as of March 31, 2009 amounted to ¥363,000 million ($3,704,082 thousand).
As of March 31, 2009, outstanding commitments for the purchase of property, plant and equipment were approximately ¥55,700 million ($568,367 thousand).
It is a common practice in Japan for companies, in the ordinary course of business, to receive promissory notes in the settlement of trade accounts receivable and to subsequently discount such notes to banks or to transfer them by endorsement to suppliers in the settlement of accounts payable. As of March 31, 2009 and 2008, the Company and subsidiaries were contingently liable for trade notes discounted and endorsed in the following amounts:
Millions of yenThousands of
U.S. dollars
2009 2008 2009
Notes discounted . . . . . . . . . . . . . . . . . . . . . . . . . . . . . . . . . . . . . . . . . . . ¥3,877 ¥4,063 $39,561
Notes endorsed . . . . . . . . . . . . . . . . . . . . . . . . . . . . . . . . . . . . . . . . . . . . . 3,807 4,706 38,847
¥7,684 ¥8,769 $78,408
A certain subsidiary is contingently liable for the transfer of export receivables with recourse. As of March 31, 2009, the amount of transfer of export receivables with recourse was ¥16,000 million ($163,265 thousand).
The Company and its subsidiaries provide warranties for certain of their products. The accrued product warranty costs are based primarily on historical experience of actual warranty claims. The changes in accrued product warranty costs for the years ended March 31, 2009, 2008 and 2007 are summarized as follows:
Millions of yenThousands of
U.S. dollars
2009 2008 2007 2009
Balance at beginning of year . . . . . . . . . . . . . . . . . . . . . . . ¥ 73,715 ¥ 82,316 ¥ 81,450 $ 752,194
Expense recognized upon issuance of warranties . . . . . . . 34,990 38,420 53,994 357,041
Usage . . . . . . . . . . . . . . . . . . . . . . . . . . . . . . . . . . . . . . . . (43,369) (43,675) (53,646) (442,541)
Other, including effect of foreign currency translation . . . . . (4,887) (3,346) 518 (49,867)
Balance at end of year . . . . . . . . . . . . . . . . . . . . . . . . . . . . ¥ 60,449 ¥ 73,715 ¥ 82,316 $ 616,827
On June 15, 2006, Hamaoka Nuclear Power Station No. 5 of Chubu Electric Power Co., Inc. shut down due to turbine damage. As a precautionary measure, on July 5, 2006, Shika Nuclear Power Station No. 2 of Hokuriku Electric Power Company, which uses the same type of turbines, was shut down for an examination of the turbines and the examination revealed damage to the turbine vanes. A provision for the repair costs was accrued.
In September 2008, Chubu Electric Power Co., Inc. filed suit against the Company to claim for compensation for consequential losses of ¥41,800 million ($426,531 thousand) mostly composed of the additional costs to switch to thermal power arising from shutdown at Hamaoka Nuclear Power Station No. 5. This case is under dispute in court at present. In May 2009, Hokuriku Electric Power Company filed suit against the Company to claim for compensation for consequential losses of ¥20,200 million ($206,122 thousand) mostly composed of the additional costs to switch to thermal power arising from shutdown at Shika Nuclear Power Station No. 2. The Company intends to vigorously defend itself in these lawsuits. The Company has not accrued for consequential losses related to these lawsuits. However, there can be no assurance that the Company will not be liable for any amount claimed.
The Company and its subsidiaries make provisions for anticipated losses on long-term contracts, including changes in the estimates for such provisions, in the period in which they become evident. The effect of a change in the estimated provision for anticipated losses on certain long-term contracts was to increase consolidated net loss for the year ended March 31, 2007 by ¥70,915 million, or ¥21.28 per share (basic).
75Hitachi, Ltd.Annual Report 2009

In January 2007, the European Commission ordered the Company and one of its affiliated companies to pay a fine for infringement of EC antitrust rules regarding alleged antitrust violations for the gas insulated switchgear equipment used at substations. In April 2007, the Company lodged an appeal with the Court of First Instance of the European Communities requesting the court to annul the decision of the European Commission. The determination has not been rendered at present, but the Company accrued the reasonably estimated amount for the fine.
In October 2006, a subsidiary and an affiliate of the Company in the U.S. received a grand jury subpoena in connection with the investigation conducted by the Antitrust Division of the U.S. Department of Justice in respect of alleged antitrust violations relating to static random access memories. In December 2008, these companies received information that the Antitrust Division of the U.S. Department of Justice would terminate the investigation of this matter.
In December 2006, the Company and a subsidiary in Europe received requests for information from the European Commission, a subsidiary in Japan received a grand jury subpoena in connection with the investigation conducted by the Antitrust Division of the U.S. Department of Justice and received requests for information from the Fair Trade Commission of Japan, and an affiliate in Japan received a request for information from the Fair Trade Commission of Japan, all in respect of alleged antitrust violations relating to the liquid crystal displays. In December 2008, a subsidiary in Japan received a cease and desist order from the Fair Trade Commission of Japan, but it has not received a surcharge payment order. The Japanese subsidiary accrued the reasonably estimated amount for the loss in relation to the investigation by the Antitrust Division of the U.S. Department of Justice as of March 31, 2009, and paid that fine in June 2009.
In June 2007, the Company received requests for information from the European Commission in respect of alleged antitrust violations relating to dynamic random access memories.
In September 2007, a subsidiary and an affiliate of the Company in the U.S. received a grand jury subpoena in connection with the investigation conducted by the Antitrust Division of the U.S. Department of Justice in respect of alleged antitrust violations relating to flash memories.
In November 2007, a subsidiary of the Company in the U.S. received a grand jury subpoena in connection with the investigation conducted by the Antitrust Division of the U.S. Department of Justice in respect of alleged antitrust violations relating to cathode ray tubes. In addition, in November 2007, two subsidiaries in Asia and in Europe received requests for information from the European Commission. Furthermore, in November 2007, a subsidiary in Canada received requests for information from the Canadian Competition Bureau.
In December 2008, the Company received requests for information from the European Commission in respect of alleged antitrust violations relating to power transformers.
The Company and these companies do not concede the alleged antitrust violations, but depending upon the outcome of these investigations, fines or surcharge payments, the amount of which is uncertain, may be imposed on them. In addition, subsequent to these actions by the competent authorities, a number of class action lawsuits have been filed against the Company and some of these companies in the U.S. and Canada.
Depending upon the outcome of the above legal proceedings, there may be an adverse effect on the consolidated financial position or results of operations. Currently the Company is unable to estimate the adverse effect, if any of many of these proceedings. Accordingly, except as otherwise stated, no accrual for potential loss has been made.
In addition to the above, the Company and certain subsidiaries are subject to several legal proceedings and claims which have arisen in the ordinary course of business and have not been finally adjudicated. These actions when ultimately concluded and determined will not, in the opinion of management, have a material adverse effect on the consolidated financial position or results of operations of the Company and subsidiaries.
76 Hitachi, Ltd.Annual Report 2009

18. impAirmENt LoSSES for LoNg-LivEd ASSEtS
For the year ended March 31, 2009, the majority of the impairment losses were recorded on long-lived property, plant and equipment located in Japan. The Digital Media & Consumer Products division recognized a loss of ¥57,995 million ($591,786 thousand), primarily in its plasma TV business, due to 1) the decision to reorganize sourcing for glass panel components from in-house manufacturing to an outside supplier; 2) patents with lower-than-expected future license income; and, 3) a specific type of electronic parts that were projected to have lower production because of smaller demand in the market. The Power & Industrial Systems division recognized a loss of ¥32,961 million ($336,337 thousand) primarily in its automotive products business whose profitability has deteriorated because of a significant deterioration of the automotive market. The Information & Telecommunication Systems division recognized a loss of ¥21,139 million ($215,704 thousand) primarily due to 1) its semiconductor and financial institution-related businesses whose profitability have deteriorated because of smaller demand in the markets; 2) a decline in the expected selling price of certain assets held for sale caused by a deterioration of the real estate market; and, 3) a decline in the estimated recoverable value because of the bankruptcy of a customer. The High Functional Materials & Components division recognized a loss of ¥12,888 million ($131,510 thousand) primarily in its semiconductor-related and automotive-related products businesses whose profitabilities have deteriorated because of a significant deterioration in these markets. The fair value estimates used to determine these losses were based primarily on discounted future cash flows.
For the year ended March 31, 2008, the majority of the impairment losses were recorded on long-lived property, plant and equipment located in Japan. The Digital Media & Consumer Products division recognized a loss of ¥68,791 million primarily due to its plasma TV business for which the Company and certain subsidiaries have recognized losses for consecutive periods because of severe market competition accompanied by falling prices. These impairment losses included patents with lower-than-expected future license income. The Power & Industrial Systems division recognized a loss of ¥9,298 million primarily due to its electric power selling business whose profitability has deteriorated due to rising fuel prices. The High Functional Materials & Components division recognized a loss of ¥7,172 million primarily due to rapid falling prices of LCD drivers for which a subsidiary supplies material for the related semiconductors. The fair value estimates used to determine these losses were based primarily on discounted future cash flows.
For the year ended March 31, 2007, the majority of the impairment losses were recorded on long-lived property, plant and equipment located in Japan. The High Functional Materials & Components division recognized a loss of ¥4,351 million primarily due to a specific type of material for semiconductors that was projected to have lower production because of smaller demand in the market. The Digital Media & Consumer Products division recognized a loss of ¥1,305 million primarily due to a specific type of electronic parts that was projected to have lower production because of smaller demand in the market. The Electronic Devices division recognized a loss of ¥1,294 million primarily due to projection television tubes that were scheduled to reduce their production. The fair value estimates used to determine these losses were based primarily on discounted future cash flows.
19. rEStructuriNg chArgES
Certain losses incurred in the reorganization of the Company’s operations are considered restructuring charges. Components and related amounts of the restructuring charges, before the related tax effects, for the years ended March 31, 2009, 2008 and 2007 are as follows:
Millions of yenThousands of
U.S. dollars
2009 2008 2007 2009
Special termination benefits . . . . . . . . . . . . . . . . . . . . . . ¥21,517 ¥15,676 ¥3,868 $219,561
Loss on fixed assets . . . . . . . . . . . . . . . . . . . . . . . . . . . 1,410 2,434 115 14,388
¥22,927 ¥18,110 ¥3,983 $233,949
77Hitachi, Ltd.Annual Report 2009

The Company and certain subsidiaries provided special termination benefits to those employees voluntarily leaving the companies. The accrued special termination benefits were recognized at the time voluntary termination was offered and benefits were accepted by the employees. An analysis of the accrued special termination benefits for the years ended March 31, 2009, 2008 and 2007 is as follows:
Millions of yenThousands of
U.S. dollars
2009 2008 2007 2009
Balance at beginning of the year . . . . . . . . . . . . . . . . . . . . . . ¥ 8,952 ¥ 44 ¥ 1,106 $ 91,347
New charges . . . . . . . . . . . . . . . . . . . . . . . . . . . . . . . . . . . . . 21,517 15,676 3,868 219,561
Cash payments . . . . . . . . . . . . . . . . . . . . . . . . . . . . . . . . . . . (22,449) (6,348 ) (4,931 ) (229,072)
Foreign currency exchange rate changes . . . . . . . . . . . . . . . . (477) (420) 1 (4,867)
Balance at end of the year . . . . . . . . . . . . . . . . . . . . . . . . . . . ¥ 7,543 ¥ 8,952 ¥ 44 $ 76,969
The followings represent significant restructuring activities for the year ended March 31, 2009 by business line:
1. The Power & Industrial Systems division restructured in order to reorganize the automotive products business, which has encountered severe deterioration in the market. The accrued special termination benefits expensed during the year ended March 31, 2009 amounted to ¥7,645 million ($78,010 thousand). The liabilities for special termination benefits amounting to ¥3,283 million ($33,500 thousand) as of March 31, 2009 will be paid by March 2010. Total restructuring charges during the year ended March 31, 2009 amounted to ¥7,649 million ($78,051 thousand).
2. The High Functional Materials & Components division restructured in order to reorganize its high-grade metal products and materials business to reduce costs and improve profitability. The accrued special termination benefits expensed during the year ended March 31, 2009 amounted to ¥4,069 million ($41,520 thousand). The liabilities for special termination benefits amounting to ¥1,050 million ($10,714 thousand) as of March 31, 2009 will be paid by March 2010. Total restructuring charges during the year ended March 31, 2009 amounted to ¥4,252 million ($43,388 thousand).
3. The Digital Media & Consumer Products division restructured in order to reorganize the flat-panel TV business which is subject to severe market competition accompanied with falling prices. The accrued special termination benefits expensed during the year ended March 31, 2009 amounted to ¥3,635 million ($37,092 thousand). The liabilities for special termination benefits amounting to ¥833 million ($8,500 thousand) as of March 31, 2009 will be paid by March 2010. Total restructuring charges during the year ended March 31, 2009 amounted to ¥3,802 million ($38,796 thousand).
The followings represent significant restructuring activities for the year ended March 31, 2008 by business line:
1. The Information & Telecommunication Systems division restructured in order to strengthen its storage business on a global basis. The accrued special termination benefits expensed during the year ended March 31, 2008 amounted to ¥5,916 million. The liabilities for special termination benefits amounting to ¥2,304 million as of March 31, 2008 were paid by March 2009. Total restructuring charges during the year ended March 31, 2008 amounted to ¥7,260 million.
2. The Digital Media & Consumer Products division restructured in order to reorganize the flat-panel TV business which is subject to severe market competition accompanied with falling prices. The accrued special termination benefits expensed during the year ended March 31, 2008 amounted to ¥3,903 million. The liabilities for special termination benefits amounting to ¥2,571 million as of March 31, 2008 were paid by March 2009. Total restructuring charges during the year ended March 31, 2008 amounted to ¥4,095 million.
3. The Power & Industrial Systems division restructured in order to reorganize its plant construction business for reducing costs and improving profitability primarily in Japan. The accrued special termination benefits expensed during the year ended March 31, 2008 amounted to ¥2,836 million. The liabilities for special termination benefits amounting to ¥2,836 million as of March 31, 2008 were paid by March 2009. Total restructuring charges during the year ended March 31, 2008 consisted only of special termination benefits.
The restructuring charges for the year ended March 31, 2007 mainly consist of special termination benefits for the early terminated employees of subsidiaries in the High Functional Materials & Components division and the Information & Telecommunication Systems division.
78 Hitachi, Ltd.Annual Report 2009

20. othEr iNcomE ANd othEr dEductioNS
The following items are included in other income or other deductions for the years ended March 31, 2009, 2008 and 2007.
Millions of yenThousands of
U.S. dollars
2009 2008 2007 2009
Net gain (loss) on securities . . . . . . . . . . . . . . . . . . . . . . . . . . ¥(44,077) ¥ 80,129 ¥ 47,687 $(449,765)
Net loss on sale and disposal of rental assets and other property . . . . . . . . . . . . . . . . . . . . . . . . . . . . . . . . (21,292) (8,246) (24,611) (217,265)
Exchange loss . . . . . . . . . . . . . . . . . . . . . . . . . . . . . . . . . . . . (37,259) (28,414) (3,029) (380,194)
Other income for the year ended March 31, 2009 represents a gain of ¥5,203 million ($53,092 thousand) on the sale of a subsidiary’s mobile communication business.
The major components of net gain on securities for the year ended March 31, 2008 were related to sales of a part of shares of Hitachi Displays, Ltd. and Hitachi-GE Nuclear Energy, Ltd. and of all shares of Hitachi Semiconductor Singapore Pte. Ltd.
Other income for the year ended March 31, 2008 also includes a realized gain of ¥21,040 million on a contribution of available-for-sale securities to a pension fund trust.
21. SALES of Stock By SuBSidiAriES or AffiLiAtEd compANiES
In April 2007, Hitachi Metals, Ltd., a subsidiary which manufactures and sells high-grade metal products, and NEOMAX Co., Ltd., a subsidiary which manufactures and sells magnets and ceramics, conducted a merger in which Hitachi Metals, Ltd. was the surviving entity and NEOMAX Co., Ltd. was the acquired entity. Prior to the merger, Hitachi Metals, Ltd. opened its tender offer to acquire common shares of NEOMAX Co., Ltd. for the period from November 7, 2006 to December 11, 2006 for ¥2,500 per share. In April 2007, Hitachi Metals, Ltd. allocated 2 of its shares to 1 share of NEOMAX Co., Ltd. to acquire the shares of NEOMAX Co., Ltd. held by third parties in accordance with the terms and conditions of the tender offer. As a result, Hitachi Metals, Ltd. issued 9,389,202 shares of common stock to the shareholders of NEOMAX Co., Ltd. Since all the shares of Hitachi Metals, Ltd. were issued to third parties, the Company’s ownership interest of common stock decreased from 56.6% to 55.1%. The Company did not recognize a deferred tax liability on this transaction.
In February 2007, Opnext, Inc., a subsidiary which designs and manufactures optical modules and components, issued 12,536,406 shares of common stock at $15 per share to third parties in an initial public offering and the Company sold a portion of its investment in Opnext, Inc. As a result of the issuance of new shares and sale of the investment, the Company’s ownership interest of common stock decreased from 67.3% to 43.9% at March 31, 2007 and the remaining investment is accounted for using the equity method. The Company provided a deferred tax liability on this gain.
79Hitachi, Ltd.Annual Report 2009

22. NEt iNcomE (LoSS) pEr ShArE iNformAtioN
The reconciliations of the numbers and the amounts used in the basic and diluted net loss per share computations are as follows:
Number of shares
2009 2008 2007
Weighted average number of shares on which basic net loss per share is calculated . . . . . . . . . . . . . . . . . . 3,323,996,973 3,324,562,767 3,331,918,803
Effect of dilutive securities:
Stock options . . . . . . . . . . . . . . . . . . . . . . . . . . . . . . . . . . . . . . . – 122,257 158,778
Number of shares on which diluted net loss per share is calculated . . . . . . . . . . . . . . . . . . . . . . . . . . . . . . . . . . 3,323,996,973 3,324,685,024 3,332,077,581
Millions of yenThousands of
U.S. dollars
2009 2008 2007 2009
Net loss applicable to common stockholders . . . . . ¥(787,337) ¥(58,125) ¥(32,799) $(8,034,051)
Effect of dilutive securities:
Subsidiaries’ stock options and other . . . . . . . . . (8) (948) (92) (82)
Net loss on which diluted net loss per share is calculated . . . . . . . . . . . . . . ¥(787,345) ¥(59,073) ¥(32,891) $(8,034,133)
Yen U.S. dollarsNet loss per share:
Basic . . . . . . . . . . . . . . . . . . . . . . . . . . . . . . . . . ¥(236.86) ¥(17.48) ¥(9.84) $(2.42)
Diluted . . . . . . . . . . . . . . . . . . . . . . . . . . . . . . . . (236.87) (17.77) (9.87) (2.42)
The net loss per share computations for the years ended March 31, 2009, 2008 and 2007 exclude all outstanding convertible bonds because their effect would have been antidilutive. In addition, the net loss per share computation excludes some stock options because their effect would have been antidilutive.
23. SuppLEmENtAry iNcomE ANd ExpENSE iNformAtioN
Millions of yenThousands of
U.S. dollars
2009 2008 2007 2009
Shipping and handling costs . . . . . . . . . . . . . . . . ¥148,145 ¥162,526 ¥155,535 $1,511,684
Advertising expense . . . . . . . . . . . . . . . . . . . . . . 38,598 45,823 53,577 393,857
Maintenance and repairs . . . . . . . . . . . . . . . . . . . 78,242 84,122 82,902 798,388
Rent . . . . . . . . . . . . . . . . . . . . . . . . . . . . . . . . . . 148,401 143,369 146,139 1,514,296
Research and development expense . . . . . . . . . . 416,517 428,171 412,534 4,250,173
80 Hitachi, Ltd.Annual Report 2009

24. SuppLEmENtAry cASh fLow iNformAtioN
Millions of yenThousands of
U.S. dollars
2009 2008 2007 2009
Cash paid during the year for:
Interest . . . . . . . . . . . . . . . . . . . . . . . . . . . . . . . . . . . . . . . . ¥ 34,443 ¥ 42,468 ¥ 38,712 $ 351,459
Income taxes . . . . . . . . . . . . . . . . . . . . . . . . . . . . . . . . . . . 177,624 174,735 123,677 1,812,490
Noncash investing and financial activities:
Capitalized lease assets . . . . . . . . . . . . . . . . . . . . . . . . . . . ¥ 10,299 ¥ 5,488 ¥ 6,056 $ 105,092
The proceeds from the sale of securities classified as available-for-sale discussed in note 4 are included in both (increase) decrease in short-term investments and proceeds from sale of investments and subsidiaries’ common stock on the consolidated statements of cash flows.
25. dErivAtivE iNStrumENtS ANd hEdgiNg ActivitiES
Overall risk profileThe major manufacturing bases of the Company and its subsidiaries are located in Japan and Asia. The selling bases are located globally, and the Company and its subsidiaries generate approximately 40% of their sales from overseas. These overseas sales are mainly denominated in the U.S. dollar or Euro. As a result, the Company and its subsidiaries are exposed to market risks from changes in foreign currency exchange rates.
The Company’s financing subsidiaries in the U.K, the U.S. and Singapore issue variable rate medium-term notes mainly through the Euro markets to finance its overseas long-term operating capital. As a result, the Company and its subsidiaries are exposed to market risks from changes in foreign currency exchange rates and interest rates.
The Company and its subsidiaries are also exposed to credit-related losses in the event of non-performance by counterparties to derivative financial instruments, but it is not expected that any counterparties will fail to meet their obligations because most of the counterparties are internationally recognized financial institutions that are rated A or higher and contracts are diversified into a number of major financial institutions.
The Company and its subsidiaries have an insignificant amount of derivative instruments containing credit-risk-related contingent features, such as provisions that require the Company’s debt to maintain an investment grade credit rating from each of the major credit rating agencies.
Risk management policyThe Company and its subsidiaries assess foreign currency exchange rate risk and interest rate risk by continually monitoring changes in these exposures and by evaluating hedging opportunities. It is the Company’s principal policy that the Company and its subsidiaries do not enter into derivative financial instruments for speculation purposes.
Foreign currency exchange rate risk managementThe Company and its subsidiaries have assets and liabilities which are exposed to foreign currency exchange rate risk and, as a result, they enter into forward exchange contracts and cross currency swap agreements for the purpose of hedging these risk exposures.
In order to fix the future net cash flows principally from trade receivables and payables recognized, which are denominated in foreign currencies, the Company and its subsidiaries on a monthly basis measure the volume and due date of future net cash flows by currency. In accordance with the Company’s policy, a certain portion of measured net cash flows is covered using forward exchange contracts, which principally mature within one year.
The Company and its subsidiaries enter into cross currency swap agreements with the same maturities as underlying debt to fix cash flows from long-term debt denominated in foreign currencies. The hedging relationship between the derivative financial instrument and its hedged item is highly effective in achieving offsetting changes in foreign currency exchange rates.
81Hitachi, Ltd.Annual Report 2009
Interest rate risk managementThe Company’s and certain subsidiaries’ exposure to interest rate risk is related principally to long-term debt obligations. Management believes it is prudent to minimize the variability caused by interest rate risk.
To meet this objective, the Company and certain subsidiaries principally enter into interest rate swaps to manage fluctuations in cash flows. The interest rate swaps entered into are receive-variable, pay-fixed interest rate swaps. Under the interest rate swaps, the Company and certain subsidiaries receive variable interest rate payments on long-term debt associated with medium-term notes and make fixed interest rate payments, thereby creating fixed interest rate long-term debt.
Certain financing subsidiaries mainly finance a portion of their operations by long-term debt with a fixed interest rate and lend funds at variable interest rates. Therefore, such companies are exposed to interest rate risk. Management believes it is prudent to minimize the variability caused by interest rate risk. To meet this objective, certain financing subsidiaries principally enter into interest rate swaps converting the fixed rate to the variable rate to manage fluctuations in fair value resulting from interest rate risk. Under the interest rate swaps, certain financing subsidiaries receive fixed interest rate payments associated with medium-term notes and make variable interest rate payments, thereby creating variable-rate long-term debt.
The hedging relationship between the interest rate swaps and its hedged item is highly effective in achieving offsetting changes in cash flows and fair value resulting from interest rate risk.
Fair value hedgeChanges in fair value of both recognized assets and liabilities, and derivative financial instruments designated as fair value hedges of these assets and liabilities are recognized in other income (deductions). Derivative financial instruments designated as fair value hedges include forward exchange contracts associated with operating transactions, cross currency swap agreements and interest rate swaps associated with financing transactions.
Exchange loss for the years ended March 31, 2009 and 2008 includes net gains of ¥169 million ($1,724 thousand) and ¥4,142 million, respectively, which represent the component of hedging instruments excluded from the assessment of hedge effectiveness. Net gain or loss excluded from the assessment of hedge effectiveness is not material for the year ended March 31, 2007. Net gain or loss related to the ineffective portion of hedging instruments is not material for the years ended March 31, 2009, 2008 and 2007.
Interest charges for the years ended March 31, 2009, 2008 and 2007 include net losses of ¥466 million ($4,755 thousand) and ¥586 million and a net gain of ¥601 million, respectively, which represent the component of hedging instruments excluded from the assessment of hedge effectiveness. Net gain or loss related to the ineffective portion of hedging instruments is not material for the years ended March 31, 2009, 2008 and 2007.
Cash flow hedgeForeign currency exposure:
Changes in fair value of forward exchange contracts designated and qualifying as cash flow hedges of forecasted transactions are reported in accumulated other comprehensive income (AOCI). These amounts are reclassified into earnings in the same period as the hedged items affect earnings.
Exchange gain for the years ended March 31, 2009 and 2008 includes net gains of ¥2,229 million ($22,745 thousand) and ¥1,591 million, respectively, which represent the component of hedging instruments excluded from the assessment of hedge effectiveness. Net gain or loss excluded from the assessment of hedge effectiveness is not material for the year ended March 31, 2007. Net gain or loss related to the ineffective portion of hedging instruments is not material for the years ended March 31, 2009, 2008 and 2007.
It is expected that a net gain of approximately ¥5,342 million ($54,510 thousand) recorded in AOCI relating to existing forward exchange contracts will be reclassified into other income or other deductions during the year ending March 31, 2010.
As of March 31, 2009, the maximum length of time over which the Company and its subsidiaries are hedging their exposure to the variability in future cash flows associated with foreign currency forecasted transactions is approximately 61 months.
82 Hitachi, Ltd.Annual Report 2009

Interest rate exposure:
Changes in fair values of interest rate swaps designated as hedging instruments for the variability of cash flows associated with long-term debt obligations are reported in AOCI. These amounts subsequently are reclassified into interest charges as a yield adjustment in the same period in which the hedged debt obligations affect earnings.
Interest charges for the years ended March 31, 2009, 2008 and 2007 include net losses of ¥347 million ($3,541 thousand) and ¥194 million and a net gain of ¥99 million, respectively, which represent the component of hedging instruments excluded from the assessment of hedge effectiveness. Interest charges for the years ended March 31, 2009 and 2008 include a net gain of ¥553 million ($5,643 thousand) and a net loss of ¥730 million, respectively, which represents the component of hedge ineffectiveness. Net gain or loss related to the ineffective portion of hedging instruments is not material for the year ended March 31, 2007.
It is expected that a net loss of approximately ¥571 million ($5,827 thousand) recorded in AOCI related to the interest rate swaps will be reclassified into interest charges as a yield adjustment of the hedged debt obligations during the year ending March 31, 2010.
The contract or notional amounts of derivative financial instruments held as of March 31, 2009 and 2008 are summarized as follows:
Millions of yenThousands of
U.S. dollars
2009 2008 2009
Forward exchange contracts:
To sell foreign currencies . . . . . . . . . . . . . . . . . . . . . . . . . . . . . . . . . . . . . ¥237,177 ¥277,379 $2,420,173
To buy foreign currencies . . . . . . . . . . . . . . . . . . . . . . . . . . . . . . . . . . . . . 128,035 109,840 1,306,480
Cross currency swap agreements:
To sell foreign currencies . . . . . . . . . . . . . . . . . . . . . . . . . . . . . . . . . . . . . 106,329 48,736 1,084,990
To buy foreign currencies . . . . . . . . . . . . . . . . . . . . . . . . . . . . . . . . . . . . . 131,111 206,392 1,337,867
Interest rate swaps . . . . . . . . . . . . . . . . . . . . . . . . . . . . . . . . . . . . . . . . . . . 406,725 443,426 4,150,255
Option contracts . . . . . . . . . . . . . . . . . . . . . . . . . . . . . . . . . . . . . . . . . . . . . 7,552 13,269 77,061
The following tables, “Effective portion of derivatives designated as hedging instruments and related hedged items” and “Ineffective portion and amount excluded from effectiveness test,” show the effects of derivative instruments for fair value hedges on the consolidated statement of operations for the quarter ended March 31, 2009:
Effective portion of derivatives designated as hedging instruments and related hedged items
Hedging instruments Related hedged items
Derivatives Location of gain (loss)Millions of yen
Thousands of U.S. dollars Items Location of gain (loss)
Millions of yen
Thousands of U.S. dollars
Forward exchange contracts
Other deductions . . . ¥ (6,814) $ (69,531) Accounts receivable and accounts payable
Other deductions . . . ¥ 5,832 $ 59,510
Other deductions . . . (590) (6,020) Short-term investments and short-term debt
Other deductions . . . 614 6,265
Cross currency swap agreements
Other deductions . . . (3,036) (30,979) Investments and advances
Other deductions . . . 3,053 31,153
Interest charges . . . . (3,115) (31,786) Long-term debt Interest charges . . . . 2,900 29,592
¥(13,555) $(138,316) ¥12,399 $126,520
83Hitachi, Ltd.Annual Report 2009

Ineffective portion and amount excluded from effectiveness test
Derivatives Location Millions of yenThousands of
U.S. dollars
Forward exchange contracts Other deductions . . . . . . . . . . . . . . . . . . . ¥ 227 $ 2,316
Cross currency swap agreements Other deductions . . . . . . . . . . . . . . . . . . . (2,065) (21,071)
Interest rate swaps Interest charges . . . . . . . . . . . . . . . . . . . . (58) (592)
¥(1,896) $(19,347)
The following tables, “Gain (loss) recognized in OCI, Effective portion of derivatives designated as hedging instruments,” “Gain (loss) reclassified from AOCI into consolidated statement of operations, Effective portion of derivatives designated as hedging instruments” and “Gain (loss) on derivatives designated as cash flow hedging instruments, Ineffective portion and amount excluded from effectiveness test” show the effect of derivative instruments for cash flow hedges on the consolidated statement of operations for the quarter ended March 31, 2009:
Gain (loss) recognized in OCIEffective portion of derivatives designated as hedging instruments
Derivatives Millions of yenThousands of
U.S. dollars
Forward exchange contracts . . . . . . . . . . . . . . . . . . . . . . . . . . . . . . . . . . . . . . . . . . . . . ¥ 638 $ 6,510
Cross currency swap agreements . . . . . . . . . . . . . . . . . . . . . . . . . . . . . . . . . . . . . . . . . (1,685) (17,194)
Interest rate swaps . . . . . . . . . . . . . . . . . . . . . . . . . . . . . . . . . . . . . . . . . . . . . . . . . . . . (1,025) (10,459)
Option contracts . . . . . . . . . . . . . . . . . . . . . . . . . . . . . . . . . . . . . . . . . . . . . . . . . . . . . . 8 82
¥(2,064) $(21,061)
Gain (loss) reclassified from AOCI into consolidated statement of operationsEffective portion of derivatives designated as hedging instruments
Derivatives Location Millions of yenThousands of
U.S. dollars
Forward exchange contracts Other deductions . . . . . . . . . . . . . . . . . . . ¥(1,623) $(16,561)
Cross currency swap agreements Other deductions . . . . . . . . . . . . . . . . . . . (1,080) (11,020)
Interest rate swaps Interest income . . . . . . . . . . . . . . . . . . . . 830 8,469
Option contracts Other deductions . . . . . . . . . . . . . . . . . . . (1,492) (15,225)
¥(3,365) $(34,337)
Gain (loss) on derivatives designated as cash flow hedging instrumentsIneffective portion and amount excluded from effectiveness test
Derivatives Location Millions of yenThousands of
U.S. dollars
Forward exchange contracts Other deductions . . . . . . . . . . . . . . . . . . . ¥(1,598) $(16,306)
Cross currency swap agreements Other deductions . . . . . . . . . . . . . . . . . . . (358) (3,653)
Interest rate swaps Interest income . . . . . . . . . . . . . . . . . . . . 120 1,224
¥(1,836) $(18,735)
26. coNcENtrAtioNS of crEdit riSk
The Company and its subsidiaries generally do not have significant concentrations of credit risk to any counterparties nor any regions because they are diversified and spread globally.
84 Hitachi, Ltd.Annual Report 2009

27. fAir vALuE of fiNANciAL iNStrumENtS
The following methods and assumptions are used to estimate the fair values of financial instruments:
Investments in securitiesRefer to note 28 for the methods and assumptions used to estimate the fair values of investments in securities.
Long-term debtThe fair value of long-term debt is estimated based on quoted market prices or the present value of future cash flows using the Company’s and its subsidiaries’ incremental borrowing rates for similar borrowing arrangements.
Cash and cash equivalents, Trade receivables, Short-term debt and Trade payablesThe carrying amount approximates the fair value because of the short maturity of these instruments.
Derivative financial instrumentsThe fair values of forward exchange contracts, cross currency swap agreements, interest rate swaps and option contracts are estimated on the basis of the market prices of derivative financial instruments with similar contract conditions.
The carrying amounts and estimated fair values of the financial instruments as of March 31, 2009 and 2008 are as follows:
Millions of yen Thousands of U.S. dollars
2009 2008 2009
Carrying amounts
Estimated fair values
Carrying amounts
Estimated fair values
Carrying amounts
Estimated fair values
Investments in securities:
Short-term investments . . . . . . . . . . . . . . . ¥ 8,654 ¥ 8,654 ¥ 61,289 ¥ 61,289 $ 88,306 $ 88,306
Investments and advances . . . . . . . . . . . . . 158,819 158,819 269,498 269,498 1,620,602 1,620,602
Derivatives (Effective Portion in Other Current Assets):
Forward exchange contracts . . . . . . . . . . . 2,475 2,475 12,144 12,144 25,255 25,255
Cross currency swap agreements . . . . . . . 16,297 16,297 7,755 7,755 166,296 166,296
Interest rate swaps . . . . . . . . . . . . . . . . . . . 31 31 32 32 316 316
Option contracts . . . . . . . . . . . . . . . . . . . . 1 1 70 70 10 10
Derivatives (Ineffective Portion in Other Current Assets):
Forward exchange contracts . . . . . . . . . . . 180 180 181 181 1,837 1,837
Cross currency swap agreements . . . . . . . . 414 414 97 97 4,224 4,224
Interest rate swaps . . . . . . . . . . . . . . . . . . . – – 14 14 – –
Option contracts . . . . . . . . . . . . . . . . . . . . – – – – – –
Derivatives (Effective Portion in Other Assets):
Forward exchange contracts . . . . . . . . . . . 34 34 – – 347 347
Cross currency swap agreements . . . . . . . . 14,358 14,358 2,854 2,854 146,510 146,510
Interest rate swaps . . . . . . . . . . . . . . . . . . . 496 496 590 590 5,061 5,061
Option contracts . . . . . . . . . . . . . . . . . . . . – – – – – –
Derivatives (Ineffective Portion in Other Assets):
Forward exchange contracts . . . . . . . . . . . – – – – – –
Cross currency swap agreements . . . . . . . . 5,963 5,963 3,134 3,134 60,847 60,847
Interest rate swaps . . . . . . . . . . . . . . . . . . . – – – – – –
Option contracts . . . . . . . . . . . . . . . . . . . . – – – – – –
85Hitachi, Ltd.Annual Report 2009

Millions of yen Thousands of U.S. dollars
2009 2008 2009
Carrying amounts
Estimated fair values
Carrying amounts
Estimated fair values
Carrying amounts
Estimated fair values
Long-term debt . . . . . . . . . . . . . . . ¥(1,821,287) ¥(1,801,249) ¥(1,808,486) ¥(1,793,317) $(18,584,561) $(18,380,092)
Derivatives (Effective Portion in Other Current Liabilities):
Forward exchange contracts . . . (4,669) (4,669) (917) (917) (47,643) (47,643)
Cross currency swap agreements . . . . . . . . . . . . . . . (142) (142) (80) (80) (1,449) (1,449)
Interest rate swaps . . . . . . . . . . (379) (379) (660) (660) (3,867) (3,867)
Option contracts . . . . . . . . . . . . (37) (37) (12) (12) (378) (378)
Derivatives (Ineffective Portion in Other Current Liabilities):
Forward exchange contracts . . . (619) (619) – – (6,316) (6,316)
Cross currency swap agreements . . . . . . . . . . . . . . . (345) (345) (90) (90) (3,520) (3,520)
Interest rate swaps . . . . . . . . . . (466) (466) – – (4,755) (4,755)
Option contracts . . . . . . . . . . . . – – – – – –
Derivatives (Effective Portion in Other Liabilities):
Forward exchange contracts . . . (66) (66) (60) (60) (673) (673)
Cross currency swap agreements . . . . . . . . . . . . . . . (4,842) (4,842) (1,055) (1,055) (49,408) (49,408)
Interest rate swaps . . . . . . . . . . (3,135) (3,135) (1,994) (1,994) (31,990) (31,990)
Option contracts . . . . . . . . . . (5) (5) (13) (13) (51) (51)
Derivatives (Ineffective Portion in Other Liabilities):
Forward exchange contracts . . . – – – – – –
Cross currency swap agreements . . . . . . . . . . . . . . . (2) (2) (64) (64) (20) (20)
Interest rate swaps . . . . . . . . . . (840) (840) (866) (866) (8,571) (8,571)
Option contracts . . . . . . . . . . . . – – – – – –
It is not practicable to estimate the fair value of investments in unlisted stock because of the lack of a market price and difficulty in estimating fair value without incurring excessive cost. The carrying amounts of these investments as of March 31, 2009 and 2008 totaled ¥53,325 million ($544,133 thousand) and ¥54,898 million, respectively.
86 Hitachi, Ltd.Annual Report 2009
28. fAir vALuE
SFAS No. 157 establishes a fair value hierarchy that prioritizes the use of observable inputs in markets over the use of unobservable inputs when measuring fair value as follows:
Level 1Quoted prices for identical assets or liabilities in active markets.
Level 2Quoted prices for similar assets or liabilities in active markets; quoted prices associated with transactions that are not distressed for identical or similar assets or liabilities in markets that are not active; or valuations whose significant inputs are derived from or corroborated by observable market data.
Level 3Valuations using inputs that are not observable.
Investments in debt and equity securitiesWhen available, quoted market prices are used to determine the fair value of investment securities included in Level 1. Level 1 securities include available-for-sale securities such as listed stocks on exchange markets and debt securities such as Japan treasury bonds and U.S. treasury bonds.
In the absence of an active market for investment securities, quoted prices for similar investment securities, quoted prices associated with transactions that are not distressed for identical or similar investment securities or other relevant information including market interest rate curves, referenced credit spreads or default rates, are used to determine fair value. These investments are included in Level 2. Level 2 securities include short-term investments and available-for-sale securities such as listed stocks traded over-the-counter, investment funds, debt securities traded over-the-counter, and money market funds.
In infrequent circumstances, the significant inputs of fair value for investment securities are unobservable and the Company mainly uses an income or market approach to corroborate relevant information provided by financial institutions. These investments are included in Level 3. Level 3 securities include available-for-sale securities such as private debt securities and structured bonds with little market activity.
DerivativesClosing prices are used for derivatives included in Level 1, which are traded on active markets. The majority of derivatives are traded on over-the-counter markets, which the Company does not deem to represent active markets. Derivative assets and liabilities for which fair value is based on quoted prices associated with transactions that are not distressed, in markets that are not active, or based on models using interest rate curves and forward and spot prices for currencies and commodities are included in Level 2. Derivatives included in Level 2 primarily consist of interest rate swaps, cross-currency swaps and foreign currency and commodity forward and option contracts. In infrequent circumstances, the significant inputs of fair value are unobservable and the Company mainly uses an income or market approach to corroborate relevant information provided by financial institutions. These derivatives are included in Level 3.
Subordinated interests resulting from securitizationWhen fair value is determined using observable inputs, including prices of recent transactions in markets that are not distressed, subordinated interests are included in Level 2. When significant inputs are not observable, fair value is determined based on economic assumptions used in measuring the fair value of the subordinated interests, including weighted-average life, expected credit risks, and discount rates, and the subordinated interests are included in Level 3.
87Hitachi, Ltd.Annual Report 2009

The following table presents the assets and liabilities that are measured at fair value on a recurring basis and the fair value hierarchy classification as of March 31, 2009.
Millions of yen
Fair value hierarchy classification
Total Balance Level 1 Level 2 Level 3
Assets:
Investments in securities . . . . . . . . . . . . . . . . . . . . . . . ¥167,187 ¥129,006 ¥ 11,649 ¥ 26,532
Derivatives . . . . . . . . . . . . . . . . . . . . . . . . . . . . . . . . . . 40,249 – 40,249 –
Subordinated interests resulting from securitization . . . 123,465 – – 123,465
¥330,901 ¥129,006 ¥ 51,898 ¥149,997
Liabilities:
Derivatives . . . . . . . . . . . . . . . . . . . . . . . . . . . . . . . . . . ¥ (15,547) ¥ – ¥(15,547) ¥ –
Thousands of U.S. dollars
Fair value hierarchy classification
Total Balance Level 1 Level 2 Level 3
Assets:
Investments in securities . . . . . . . . . . . . . . . . . . . . . . . $1,705,990 $1,316,388 $ 118,867 $ 270,735
Derivatives . . . . . . . . . . . . . . . . . . . . . . . . . . . . . . . . . . 410,704 – 410,704 –
Subordinated interests resulting from securitization . . . 1,259,847 – – 1,259,847
$3,376,541 $1,316,388 $ 529,571 $1,530,582
Liabilities:
Derivatives . . . . . . . . . . . . . . . . . . . . . . . . . . . . . . . . . . $ (158,643) $ – $(158,643) $ –
88 Hitachi, Ltd.Annual Report 2009

The following table presents the changes in Level 3 instruments measured on a recurring basis for the year ended March 31, 2009.
Millions of yen Thousands of U.S. dollars
Investments in securities
Subordinated interests resulting
from securitization Total
Investments in securities
Subordinated interests resulting
from securitization Total
Balance at beginning of year . . . . . . . . . . ¥ 46,324 ¥133,271 ¥179,595 $ 472,694 $1,359,908 $1,832,602
Purchases, sales, issuances and settlements . . . . . . . . . . . . . . . . . . . (16,662) (9,402) (26,064) (170,020) (95,939) (265,959)
Total gains or losses (realized/unrealized)
Included in earnings (a) . . . . . . . . . . . . (2,928) 3,592 664 (29,877) 36,653 6,776
Included in other comprehensive loss . . (202) (3,996) (4,198) (2,062) (40,775) (42,837)
Balance at end of year . . . . . . . . . . . . . . . ¥ 26,532 ¥123,465 ¥149,997 $ 270,735 $1,259,847 $1,530,582
The amount of total gains or losses for the period included in earnings attributable to the change in unrealized gains or losses relating to assets still held at the reporting date . . . . . . . . . . . . ¥ (2,685) ¥ 3,408 ¥ 723 $ (27,398) $ 34,776 $ 7,378
(a) Level 3 gains and losses (realized and unrealized) included in earnings for the year ended March 31, 2009 are reported in other income (deductions).
Assets that are measured at fair value during the period on a non-recurring basis because they are deemed to be impaired are not included in the above tables. The Company has written down the carrying amount of equity-method and cost-method investments on the consolidated balance sheet because the Company deems the decline of fair value to be other-than-temporary. For the year ended March 31, 2009, the Company recognized ¥11,219 million ($114,480 thousand) of impairment losses related to equity-method investments and ¥5,877 million ($59,969 thousand) of impairment losses related to cost-method investments, which are included in other deductions in the consolidated statement of operations. The carrying amount of equity-method investments subject to the impairment charges as of March 31, 2009 is ¥11,831 million ($120,724 thousand) and is classified as Level 1. The carrying amounts of cost-method investments subject to the impairment charges as of March 31, 2009 consist of ¥2,044 million ($20,857 thousand) classified as Level 2 and ¥1,068 million ($10,898 thousand) classified as Level 3. The Company has valued Level 3 assets using an income approach, using unobservable inputs based on business forecasts, market trends, and assumptions of projected business plans.
29. mErgEr ANd AcquiSitioN
On January 14, 2009, the Company announced its decision to purchase additional shares of Hitachi Kokusai Electric Inc. (Hitachi Kokusai Electric), an equity method affiliate, through a tender offer to make Hitachi Kokusai Electric its subsidiary for the purpose of establishing a stable equity-based relationship and strengthening the cooperative relationship in the fields of communications and video, and broadcasting systems businesses. Hitachi Kokusai Electric’s Board of Directors resolved to approve the tender offer at the meeting held on the same day. The price of the tender offer was ¥780 ($7.96) per share, which was determined by comprehensively taking into consideration the market price of Hitachi Kokusai Electric’s common stock, Hitachi Kokusai Electric’s financial condition, future earnings prospects and a valuation of Hitachi Kokusai Electric stock conducted by a third party appraiser. The price included a premium of approximately 77% over the average share price of Hitachi Kokusai Electric’s common stock traded on the First Section of the Tokyo Stock Exchange for three month period ended January 13, 2009. As a result, the Company purchased 13,406,000 shares, the upper limit for the number of shares in the tender offer, for ¥10,456 million ($106,694 thousand) in the period from January 26, 2009 through March 11, 2009, resulting in the Company’s ownership increasing from 38.8% to 51.6%. Accordingly, the Company obtained control over Hitachi Kokusai Electric and it became a consolidated subsidiary of the Company. Therefore, the Company has consolidated Hitachi Kokusai Electric as of March 31, 2009 in the consolidated balance sheet. The results of operations of Hitachi Kokusai Electric for the period from the acquisition date to March 31, 2009 were not material. Accordingly, the results of operations of Hitachi Kokusai Electric will be consolidated for the year beginning April 1, 2009.
89Hitachi, Ltd.Annual Report 2009

The Company is currently evaluating the fair values to be assigned to assets and liabilities of Hitachi Kokusai Electric at the acquisition date.
On a pro forma basis, revenue, net loss and the per share information of the Company with assumed acquisition dates for Hitachi Kokusai Electric of April 1, 2008 and 2007 would not differ materially from the amounts reported in the accompanying consolidated financial statements as of and for the years ended March 31, 2009 and 2008.
On January 14, 2009, the Company also announced its decision to purchase additional shares of Hitachi Koki Co., Ltd. (Hitachi Koki), an equity method affiliate, through a tender offer to make Hitachi Koki its subsidiary for the purpose of establishing a stable equity-based relationship and strengthening the cooperative relationship in business expansion on a global scale and research and development into lithium-ion battery-operated products. Hitachi Koki’s Board of Directors resolved to approve the tender offer at the meeting held on the same day. The price of the tender offer was ¥1,300 ($13.27) per share, which was determined by comprehensively taking into consideration the market price of Hitachi Koki’s common stock, Hitachi Koki’s financial condition, future earnings prospects and a valuation of Hitachi Koki stock conducted by a third party appraiser. The price included a premium of approximately 77% over the average share price of Hitachi Koki’s common stock traded on the First Section of the Tokyo Stock Exchange for three month period ended January 13, 2009. As a result, the Company purchased 12,473,000 shares, the upper limit for the number of shares in the tender offer, for ¥16,214 million ($165,449 thousand) in the period from January 26, 2009 through March 9, 2009, resulting in the Company’s ownership increasing from 38.9% to 51.2%. Accordingly, the Company obtained control over Hitachi Koki and it became a consolidated subsidiary of the Company. Therefore, the Company has consolidated Hitachi Koki as of March 31, 2009 in the consolidated balance sheet. The results of operations of Hitachi Koki for the period from the acquisition date to March 31, 2009 were not material. Accordingly, the results of operations of Hitachi Koki will be consolidated for the year beginning April 1, 2009.
The Company is currently evaluating the fair values to be assigned to assets and liabilities of Hitachi Koki at the acquisition date.
On a pro forma basis, revenue, net loss and the per share information of the Company with assumed acquisition dates for Hitachi Koki of April 1, 2008 and 2007 would not differ materially from the amounts reported in the accompanying consolidated financial statements as of and for the years ended March 31, 2009 and 2008.
On October 11, 2006, the Company signed a basic agreement with Clarion Co., Ltd. (Clarion) and decided to purchase additional shares of Clarion through a tender offer at ¥230 per share. The purchase price of ¥230 per share was determined by comprehensively taking into consideration the market price of Clarion common stock, Clarion’s financial condition, future earnings prospects and a third party evaluation of the estimated value of Clarion stock, and included a premium of approximately 33% over average share price of Clarion common stock traded on the First Section of the Tokyo Stock Exchange for the three month period immediately preceding October 10, 2006. As a result, the Company purchased a total of 139,108,174 shares for ¥31,994 million in the period from October 25, 2006 through November 30, 2006, resulting in the Company’s ownership increasing from 14.4% to 63.7%. Accordingly, the Company obtained control over Clarion and it became a consolidated subsidiary of the Company effective December 7, 2006.
Clarion manufactures and sells in-vehicle equipment such as car audio and car navigation systems. The Company has strategically targeted the automotive systems business and the purpose of the tender offer was to further expand its car information system business.
The amount assigned to each major asset and liability caption of Clarion at the acquisition date is as follows:
Millions of yen
Current assets . . . . . . . . . . . . . . . . . . . . . . . . . . . . . . . . . . . . . . . . . . . . . . . . . . . . . . . . . . . . . . . . . . . . . . . . ¥ 83,414
Non-current assets . . . . . . . . . . . . . . . . . . . . . . . . . . . . . . . . . . . . . . . . . . . . . . . . . . . . . . . . . . . . . . . . . . . . 50,558
Goodwill (not deductible for tax purposes) . . . . . . . . . . . . . . . . . . . . . . . . . . . . . . . . . . . . . . . . . . . . . . . . . . . 22,620
Current liabilities . . . . . . . . . . . . . . . . . . . . . . . . . . . . . . . . . . . . . . . . . . . . . . . . . . . . . . . . . . . . . . . . . . . . . . (61,063)
Non-current liabilities . . . . . . . . . . . . . . . . . . . . . . . . . . . . . . . . . . . . . . . . . . . . . . . . . . . . . . . . . . . . . . . . . . . (38,568)
Minority interests . . . . . . . . . . . . . . . . . . . . . . . . . . . . . . . . . . . . . . . . . . . . . . . . . . . . . . . . . . . . . . . . . . . . . . (11,997)
Net assets previously acquired . . . . . . . . . . . . . . . . . . . . . . . . . . . . . . . . . . . . . . . . . . . . . . . . . . . . . . . . . . . (12,444)
Acquisition cost (including direct acquisition costs) . . . . . . . . . . . . . . . . . . . . . . . . . . . . . . . . . . . . . . . . . . . . (32,520)
90 Hitachi, Ltd.Annual Report 2009

The results of operations of Clarion beginning December 7, 2006 are included in the accompanying consolidated statements of operations. On a pro forma basis, revenue, net loss and the per share information of the Company with assumed acquisition date for Clarion of April 1, 2006 would not differ materially from the amounts reported in the accompanying consolidated financial statements as of and for the year ended March 31, 2007.
30. Stock optioN pLANS
The Company and certain subsidiaries have stock option plans. Under the Company’s stock option plans, non-employee directors, executive officers and certain employees have been granted stock options to purchase the Company’s common stock. Under these stock option plans, options were granted at prices not less than market value at the date of grant and are exercisable from one year after the date of grant and expire four years after the date of grant. The Company and certain subsidiaries recognized no material stock-based compensation expense for the years ended March 31, 2009, 2008 and 2007.
The Company ceased granting stock options as part of the Company’s compensation policy, and therefore, during the years ended March 31, 2009, 2008 and 2007 the Company granted no stock options.
A summary of the Company’s stock option plans’ activity for the year ended March 31, 2009 is as follows:
Stock options (shares)
Weighted-average exercise price
(yen)
Weighted-average remaining
contractual term (year)
Aggregate intrinsic value
(millions of yen)
Outstanding at beginning of year . . . . . . . . . . . . . . . . 1,089,000 ¥747
Exercised . . . . . . . . . . . . . . . . . . . . . . . . . . . . . . . (46,000) 717
Forfeited . . . . . . . . . . . . . . . . . . . . . . . . . . . . . . . . (135,000) 719
Expired . . . . . . . . . . . . . . . . . . . . . . . . . . . . . . . . . (497,000) 781
Outstanding at end of year . . . . . . . . . . . . . . . . . . . 411,000 ¥719 0.3 ¥–
Exercisable at end of year . . . . . . . . . . . . . . . . . . . . . 411,000 ¥719 0.3 ¥–
Weighted-average exercise price (U.S. dollars)
Aggregate intrinsic value (thousands of
U.S. dollars)
Outstanding at beginning of year . . . . . . . . . . . . . . . . $7.62
Exercised . . . . . . . . . . . . . . . . . . . . . . . . . . . . . . . 7.32
Forfeited . . . . . . . . . . . . . . . . . . . . . . . . . . . . . . . . 7.34
Expired . . . . . . . . . . . . . . . . . . . . . . . . . . . . . . . . . 7.97
Outstanding at end of year . . . . . . . . . . . . . . . . . . . $7.34 $–
Exercisable at end of year . . . . . . . . . . . . . . . . . . . . . $7.34 $–
The exercise price of all of the stock options outstanding as of March 31, 2009 was ¥719 ($7.34).
The total intrinsic value of options exercised during the years ended March 31, 2009, 2008 and 2007 was ¥1 million ($10 thousand), ¥74 million and ¥45 million, respectively. The total cash received as a result of stock option exercises for the years ended March 31, 2009, 2008 and 2007 was ¥33 million ($337 thousand), ¥238 million and ¥170 million, respectively.
91Hitachi, Ltd.Annual Report 2009
Management’s Report on Internal Control over Financial Reporting
The management of the Company is responsible for establishing and maintaining adequate internal control over financial reporting. Internal control over financial reporting is defined in Rule 13a-15(f) or 15d-15(f) promulgated under the Securities Exchange Act of 1934 as a process designed by, or under the supervision of, the Company’s principal executive and principal financial officers and effected by the Company’s Board of Directors, management and other personnel, to provide reasonable assurance regarding the reliability of financial reporting and the preparation of financial statements for external purposes in accordance with generally accepted accounting principles and includes those policies and procedures that:
•Pertaintothemaintenanceofrecordsthat,inreasonabledetail,accuratelyandfairlyreflectthetransactionanddispositionsof the assets of the Company;
•Providereasonableassurancethattransactionsarerecordedasnecessarytopermitpreparationoffinancialstatementsin accordance with generally accepted accounting principles, and that receipts and expenditures of the Company are being made only in accordance with authorizations of management and directors of the Company; and
•Providereasonableassuranceregardingpreventionortimelydetectionofunauthorizedacquisition,useordispositionofthe Company’s assets that could have a material effect on the financial statements.
Because of its inherent limitations, internal control over financial reporting may not prevent or detect misstatements. Projections of any evaluation of effectiveness to future periods are subject to the risk that controls may become inadequate because of changes in conditions, or that the degree of compliance with the policies or procedures may deteriorate.
The Company’s management assessed the effectiveness of the Company’s internal control over financial reporting as of March 31, 2009. In making this assessment, the Company’s management used the criteria set forth by the Committee of Sponsoring Organizations of the Treadway Commission (COSO) in Internal Control-Integrated Framework.
Based on its assessment, the Company’s management concluded that, as of March 31, 2009, the Company’s internal control over financial reporting was effective based on those criteria.
The Company’s independent registered public accounting firm has issued an audit report on the effectiveness of the Company’s internal control over financial reporting. This report appears on page 94.
92 Hitachi, Ltd.Annual Report 2009

Report of Independent Registered Public Accounting Firm
To the Stockholders and Board of Directors of Hitachi, Ltd.:
We have audited the accompanying consolidated balance sheets of Hitachi, Ltd. and subsidiaries (the “Company”) as of March 31, 2009 and 2008, and the related consolidated statements of operations, stockholders’ equity, and cash flows for each of the three years in the period ended March 31, 2009, all expressed in Japanese yen. These financial statements are the responsibility of the Company’s management. Our responsibility is to express an opinion on these financial statements based on our audits.
We conducted our audits in accordance with the standards of the Public Company Accounting Oversight Board (United States). Those standards require that we plan and perform the audit to obtain reasonable assurance about whether the financial statements are free of material misstatement. An audit includes examining, on a test basis, evidence supporting the amounts and disclosures in the financial statements. An audit also includes assessing the accounting principles used and significant estimates made by management, as well as evaluating the overall financial statement presentation. We believe that our audits provide a reasonable basis for our opinion.
The Company’s consolidated financial statements do not disclose segment information required by Statement of Financial Accounting Standards No. 131, “Disclosures about Segments of an Enterprise and Related Information.” In our opinion, disclosure of segment information is required by U.S. generally accepted accounting principles.
In our opinion, except for the omission of segment information discussed in the preceding paragraph, the financial statements referred to above present fairly, in all material respects, the consolidated financial position of Hitachi, Ltd. and subsidiaries at March 31, 2009 and 2008, and the consolidated results of their operations and their cash flows for each of the three years in the period ended March 31, 2009, in conformity with U.S. generally accepted accounting principles.
As discussed in Note 2 (i), “Property, Plant and Equipment,” effective April 1, 2007, the Company elected to change to the 250% declining balance depreciation method.
We also have audited, in accordance with the standards of the Public Company Accounting Oversight Board (United States), Hitachi, Ltd.’s internal control over financial reporting as of March 31, 2009, based on criteria established in Internal Control-Integrated Framework issued by the Committee of Sponsoring Organizations of the Treadway Commission and our report dated June 23, 2009 expressed an unqualified opinion thereon.
We have also recomputed the translation of the consolidated financial statements as of and for the year ended March 31, 2009 into United States dollars. In our opinion, the consolidated financial statements expressed in Japanese yen have been translated into United States dollars on the basis described in Note. 3.
Tokyo, JapanJune 23, 2009
93Hitachi, Ltd.Annual Report 2009

Report of Independent Registered Public Accounting Firm
To the Stockholders and Board of Directors of Hitachi, Ltd.:
We have audited Hitachi Ltd.’s internal control over financial reporting as of March 31, 2009, based on criteria established in Internal Control-Integrated Framework issued by the Committee of Sponsoring Organizations of the Treadway Commission (the COSO criteria). Hitachi Ltd.’s management is responsible for maintaining effective internal control over financial reporting, and for its assessment of the effectiveness of internal control over financial reporting included in the accompanying Management’s Report on Internal Control Over Financial Reporting. Our responsibility is to express an opinion on the company’s internal control over financial reporting based on our audit.
We conducted our audit in accordance with the standards of the Public Company Accounting Oversight Board (United States). Those standards require that we plan and perform the audit to obtain reasonable assurance about whether effective internal control over financial reporting was maintained in all material respects. Our audit included obtaining an understanding of internal control over financial reporting, assessing the risk that a material weakness exists, testing and evaluating the design and operating effectiveness of internal control based on the assessed risk, and performing such other procedures as we considered necessary in the circumstances. We believe that our audit provides a reasonable basis for our opinion.
A company’s internal control over financial reporting is a process designed to provide reasonable assurance regarding the reliability of financial reporting and the preparation of financial statements for external purposes in accordance with generally accepted accounting principles. A company’s internal control over financial reporting includes those policies and procedures that (1) pertain to the maintenance of records that, in reasonable detail, accurately and fairly reflect the transactions and dispositions of the assets of the company; (2) provide reasonable assurance that transactions are recorded as necessary to permit preparation of financial statements in accordance with generally accepted accounting principles, and that receipts and expenditures of the company are being made only in accordance with authorizations of management and directors of the company; and (3) provide reasonable assurance regarding prevention or timely detection of unauthorized acquisition, use or disposition of the company’s assets that could have a material effect on the financial statements.
Because of its inherent limitations, internal control over financial reporting may not prevent or detect misstatements. Also, projections of any evaluation of effectiveness to future periods are subject to the risk that controls may become inadequate because of changes in conditions, or that the degree of compliance with the policies or procedures may deteriorate.
In our opinion, Hitachi, Ltd. maintained, in all material respects, effective internal control over financial reporting as of March 31, 2009, based on the COSO criteria.
We also have audited, in accordance with the standards of the Public Company Accounting Oversight Board (United States), the accompanying consolidated balance sheets of Hitachi, Ltd. and subsidiaries as of March 31, 2009 and 2008, and the related consolidated statements of operations, stockholders’ equity, and cash flows for each of the three years in the period ended March 31, 2009, all expressed in Japanese yen, and our report dated June 23, 2009 stated that, except for the omission of segment information required by Statement of Financial Accounting Standards No. 131, “Disclosures about Segments of an Enterprise and Related Information,” the financial statements referred to above present fairly, in all material respects, the consolidated financial position of Hitachi, Ltd. and subsidiaries at March 31, 2009 and 2008, and the consolidated results of their operations and their cash flows for each of the three years in the period ended March 31, 2009, in conformity with U.S. generally accepted accounting principles.
Tokyo, JapanJune 23, 2009
94 Hitachi, Ltd.Annual Report 2009

95Hitachi, Ltd.Annual Report 2009

Five-Year summaryHitachi, Ltd. and Subsidiaries
Millions of yen
2009 2008 2007 2006 2005
For the year:
Revenues . . . . . . . . . . . . . . . . . . . . . . . . . . . . . . . . . . ¥10,000,369 ¥11,226,735 ¥10,247,903 ¥ 9,464,801 ¥9,027,043
Operating income (note) . . . . . . . . . . . . . . . . . . . . . . . 127,146 345,516 182,512 256,012 279,055
Net income (loss) . . . . . . . . . . . . . . . . . . . . . . . . . . . . (787,337) (58,125) (32,799) 37,320 51,496
Cash dividends declared . . . . . . . . . . . . . . . . . . . . . . 9,971 19,947 19,974 36,641 36,462
Capital investment (Property, plant and equipment) . . . . . . . . . . . . . . . . 788,466 969,087 1,048,572 954,706 959,593
Depreciation (Property, plant and equipment) . . . . . . . 478,759 541,470 472,175 451,170 425,080
R&D expenditures . . . . . . . . . . . . . . . . . . . . . . . . . . . 416,517 428,171 412,534 405,079 388,634
At year-end:
Total assets . . . . . . . . . . . . . . . . . . . . . . . . . . . . . . . . 9,403,709 10,530,847 10,644,259 10,021,195 9,736,247
Net property, plant and equipment . . . . . . . . . . . . . . . 2,393,946 2,653,918 2,688,977 2,460,186 2,357,931
Stockholders’ equity . . . . . . . . . . . . . . . . . . . . . . . . . 1,049,951 2,170,612 2,442,797 2,507,773 2,307,831
Yen
Per share information:
Net income (loss):
Basic . . . . . . . . . . . . . . . . . . . . . . . . . . . . . . . . . . . ¥ (236.86) ¥ (17.48) ¥ (9.84) ¥ 11.20 ¥ 15.53
Diluted . . . . . . . . . . . . . . . . . . . . . . . . . . . . . . . . . . (236.87) (17.77) (9.87) 10.84 15.15
Net income (loss) per ADS (representing 10 shares):
Basic . . . . . . . . . . . . . . . . . . . . . . . . . . . . . . . . . . . (2,369) (175) (98) 112 155
Diluted . . . . . . . . . . . . . . . . . . . . . . . . . . . . . . . . . . (2,369) (178) (99) 108 151
Cash dividends declared . . . . . . . . . . . . . . . . . . . . . . 3.0 6.0 6.0 11.0 11.0
Cash dividends declared per ADS (representing 10 shares) . . . . . . . . . . . . . . . . . . . . . . 30 60 60 110 110
Stockholders’ equity . . . . . . . . . . . . . . . . . . . . . . . . . 315.86 652.95 734.66 752.91 692.73
Number of employees . . . . . . . . . . . . . . . . . . . . . . . . . . 400,129 389,752 384,444 355,879 347,424
Note: In order to be consistent with financial reporting principles and practices generally accepted in Japan, operating income is presented as total revenues less cost of sales and selling, general and administrative expenses. The Company believes that this is useful to investors in comparing the Company’s financial results with those of other Japanese companies. Under accounting principles generally accepted in the United States of America, restructuring charges, net gain or loss on sale and disposal of rental assets and other property and impairment losses for long-lived assets are included as part of operating income for the years ended March 31, 2009, 2008 and 2007. See the consolidated statements of operations and notes 18, 19 and 20 to the consolidated financial statements.
The restructuring charges mainly represent special termination benefits incurred with the reorganization of our business structures, and as the result of the Company and its subsidiaries reviewing and reshaping the business portfolio. Restructuring charges, net gain or loss on sale and disposal of rental assets and other property and impairment losses for long-lived assets for the years ended March 31, 2006 and 2005 totaled net losses of ¥34,944 million and ¥69,649 million, respectively.
96 Hitachi, Ltd.Annual Report 2009
Corporate Data(As of March 31, 2009)
Corporate NameHitachi, Ltd.
(Kabushiki Kaisha Hitachi Seisakusho)
principal office6-6, Marunouchi 1-chome, Chiyoda-ku,
Tokyo, 100-8280, Japan
Founded1910 (Incorporated in 1920)
Number of employees400,129
Number of Shares IssuedCommon Stock: 3,368,126,056 shares
Number of Shareholders387,898
administrator of Shareholders’ registerTokyo Securities Transfer Agent Co., Ltd.
6-2, Otemachi, 2-chome, Chiyoda-ku,
Tokyo, 100-0004, Japan
Depositary and registrar for american Depositary receipts(New York Stock Exchange Listed Symbol — HIT)
Citibank, N.A. Shareholder Services
P.O. Box 43077
Providence, Rhode Island 02940-3077 USA
TEL: U.S.A. 1-877-CITI-ADR (248-4237) (toll-free)
International +1-781-575-4555
E-mail: [email protected]
URL: www.citi.com/adr
overseas Stock exchange ListingNew York
Japanese Stock exchange ListingsTokyo, Osaka, Nagoya, Fukuoka and Sapporo
Independent registered public accounting FirmErnst & Young ShinNihon LLC
UrLhttp://www.hitachi.com/
For Further inFormation, please contact:
Investor Relations
JapaNHitachi, Ltd.
6-6, Marunouchi 1-chome, Chiyoda-ku,
Tokyo, 100-8280
TEL: +81-3-3258-1111
E-mail: [email protected]
U.S.a.Hitachi America, Ltd.
50 Prospect Avenue, Tarrytown, NY 10591
TEL: +1-914-333-2987
E-mail: [email protected]
U.K.Hitachi Europe Ltd.
Whitebrook Park, Lower Cookham Road,
Maidenhead Berkshire SL6 8YA
TEL: +44-1628-585379
E-mail: [email protected]
ChINa Hitachi (China) Ltd.
Beijing Fortune Bldg. 18F,
5 Dong San Huan Bei-Lu, Chao Yang District, Beijing 100004
TEL: +86-10-6539-9139
97Hitachi, Ltd.Annual Report 2009

HITA
CH
I Annual R
epo
rt 2009
Printed in Japan