are teachers’ formative assessment practices reliable
TRANSCRIPT

Kennesaw State University Kennesaw State University
DigitalCommons@Kennesaw State University DigitalCommons@Kennesaw State University
Doctor of Education in Teacher Leadership Dissertations Office of Collaborative Graduate Programs
Fall 12-4-2020
Are Teachers’ Formative Assessment Practices Reliable Are Teachers’ Formative Assessment Practices Reliable
Indicators of Students’ Mastery of Standards? Indicators of Students’ Mastery of Standards?
Olivia Hall
Follow this and additional works at: https://digitalcommons.kennesaw.edu/teachleaddoc_etd
Part of the Educational Assessment, Evaluation, and Research Commons, and the Teacher Education
and Professional Development Commons
Recommended Citation Recommended Citation Hall, Olivia, "Are Teachers’ Formative Assessment Practices Reliable Indicators of Students’ Mastery of Standards?" (2020). Doctor of Education in Teacher Leadership Dissertations. 46. https://digitalcommons.kennesaw.edu/teachleaddoc_etd/46
This Dissertation is brought to you for free and open access by the Office of Collaborative Graduate Programs at DigitalCommons@Kennesaw State University. It has been accepted for inclusion in Doctor of Education in Teacher Leadership Dissertations by an authorized administrator of DigitalCommons@Kennesaw State University. For more information, please contact [email protected].

Running Head: ARE TEACHERS’ FORMATIVE ASSESSMENTS RELIABLE? 1
Are Teachers’ Formative Assessment Practices Reliable Indicators of Students’ Mastery of
Standards?
Olivia Waller-Hall
Kennesaw State University
July 22, 2020
A Dissertation
Presented in Partial Fulfillment of Requirements for the
Doctor of Education in Teacher Leadership
Bagwell College of Education

ARE TEACHERS’ FORMATIVE ASSESSMENTS RELIABLE?
2
Acknowledgements
I would like to thank my dissertation committee – Dr. Jihye Kim, Dr. Arvin Johnson, and
Dr. Brian R. Lawler for their support and guidance throughout this journey. I am also thankful to
my school colleagues that encouraged me every step of the way. Finally, I would like to
acknowledge my family, who continuously reminded me of the purpose placed on my life and
the source of my help.
“I will lift up mine eyes unto the hills, from whence cometh my help. My help cometh from the
Lord, which made heaven and earth.”
Psalm 121:1 & 2
ARE TEACHERS’ FORMATIVE ASSESSMENTS RELIABLE?
3
Dedication
I dedicate this dissertation to my family of educators – my grandmother, mother, sisters, aunts,
and cousins who have used their gifts unselfishly to teach, inspire, and share the knowledge that
God has given them to effect positive change with the youth in our world.
ARE TEACHERS’ FORMATIVE ASSESSMENTS RELIABLE?
4
Table of Contents
Acknowledgments 2
Dedication 3
Abstract 7
Chapter 1: Introduction 8
Introduction and Rationale for the Study 8
Problem Statement 12
Research Questions 13
Organization of the Study 13
Chapter 2: Review of the Literature 15
History of Educational Assessments in U.S. Schools 15
Oral Examinations 16
Written Examinations 16
Standardized Tests 17
Achievement Tests 17
College Entrance Exams 18
Advancements in Scoring 18
Norm-Referenced Tests 19
Basic Skills Tests 20
Criterion-Referenced Competency Tests 20
Reporting for Subgroups 21
Major Categories of Assessments 21
Diagnostic Assessments 22
Strengths 23
Challenges 24
Interim/Benchmark Assessments 24
Strengths 25
Challenges 26
Formative Assessments 27
Strengths 32
Challenges 32
Summative Assessments 33
Strengths 34
Challenges 34
Issues with Testing 35
Questions about the Veracity of Standardized Tests 35
Validity and Reliability of Formative Assessments 36
Subjectivity in Teacher Grading 38
Determining the Meaning of Proficiency 39
ARE TEACHERS’ FORMATIVE ASSESSMENTS RELIABLE?
5
Empirical Studies Regarding Formative Assessments 40
Predictors of Success 40
Weighted GPAs Leading to Grade Inflation 40
Standards-Based Grading and Predictions of Mastery 40
Sources of Grading Variability 41
Measures of Educational Outcomes 41
Synthesis 42
Connection to Teacher Leadership/Recommended Actions 43
Impact on the Field of Teacher Leadership 43
Chapter 3: Research Methodology 45
Research Questions 45
Justification of the Research Tradition Selected 46
Rationale for Implementing a Case Study 47
Worldview of the Researcher 48
Context of the Study 49
Population and Sampling Procedures 50
Access and Permission 53
Data Collection and Analysis 54
Validity of Interpretation 64
Credibility (Internal Validity) 64
Transferability (External Validity/Generalizability) 65
Dependability (Reliability) 65
Confirmability (Objectivity) 65
Limitations and Delimitations 66
Ethical Consideration 68
Chapter 4: Findings 71
Research Question 1 72
Third Grade Chi-Square Results 79
Fourth Grade Chi-Square Results 81
Fifth Grade Chi-Square Results 82
Research Question 2 84
Demographics/Survey Participants 84
Teacher Perceptions 87
Teachers’ Perceived Value of the State Test 87
Accurate Measurement 88
Accurate Measurement of Subgroups 89
Differences in Results/Educational Effectiveness 92
Measure of Educational Effectiveness 93
Alignment of Classroom Practices with the State Test 95
Alignment of Formative Assessments 97
Teacher Expectations 99
GMAS Influence on Teacher Practice 100
Research Question 3 103

ARE TEACHERS’ FORMATIVE ASSESSMENTS RELIABLE?
6
Formative Assessment Teacher Profiles 107
Dana 107
Vivian 109
Saul 111
Rachael 113
Bethany 114
Kelly 116
Barbara 118
Cross-Analysis of Participants’ Findings 120
FARROP Findings 121
Analysis of FARROP Findings 123
Analysis of Formative Assessments 124
Summary 127
Chapter 5: Conclusions and Recommendations 132
Introduction and Summary of Key Findings 132
Discussion of Findings 133
Research Question One 133
Research Question Two 135
Research Question Three 138
Implication of the Findings 141
Recommendations for Further Action Research 142
Recommendations for Teachers 142
Recommendations for Teacher Leaders 145
Recommendations for Administrators and School Policy-Makers 148
Final Thoughts and Conclusions 150
References 153
Appendices
Appendix A: Informed Consent Form 175
Appendix B: Classroom Observation Form 177
Appendix C: Teacher Survey on the Impact of State-Mandated Testing Programs 179
Appendix D: Survey Reliability Data 188
Appendix E: Test Score/Grade Distribution for 35 Title I Schools 194
Appendix F: Individual School Graphs 197
Appendix G: Chi-Square Contingency Tables (Manual Calculations) 216
Appendix H: FARROP Findings 220

ARE TEACHERS’ FORMATIVE ASSESSMENTS RELIABLE?
7
Abstract
Some students, parents, and teachers are concerned over the apparent disparity between a student’s
classroom grades and his/her proficiency levels reported from criterion-referenced standardized
assessments, such as the Georgia Milestones. The purpose of this research project was to
determine if teachers’ formative assessment practices were reliable indicators of students’ mastery
of grade-level standards. This study was a mixed-methods study with an explanatory research
design. Qualitative data were collected through observations and interviews that analyzed teachers’
perceptions of the meaning of formative assessments and how they are impacted by the summative
assessment system. Also, samples of teacher-selected assessments were analyzed to determine if
the formative assessment items were aligned to the standard at the appropriate level of complexity.
Findings from this analysis showed that many of the formative assessments given by teachers were
not fully aligned to the standard. Quantitative data analysis also found that students’ grades on
formative assessments were correlated to their proficiency levels on the Georgia Milestones
assessment. Findings from this study have provided evidence for a need for assessment reform
through improved professional learning provided by teacher leaders that calibrates an
understanding of the standard and how to assess it, as well as the implementation of standards-
based grading.
Keywords: Georgia Milestones, formative assessment, summative assessment, and grading

ARE TEACHERS’ FORMATIVE ASSESSMENTS RELIABLE?
8
Are Teachers’ Formative Assessment Practices Reliable Indicators of Students’ Mastery of
Standards?
Chapter 1: Introduction and Rationale for the Study
Each year parents receive regular reports of their student’s progress in American schools.
In the current standards-based educational environment, progress reports detail a student’s
progression towards mastery of grade-level standards. These reports are created by the students’
teachers who formatively assess the students throughout the course of study to determine
development towards meeting identified curriculum standards. However, parents also receive
another report of how well their students have mastered these same curriculum standards at the
end of the yearly instructional cycle. This report comes not from a compilation of evidence
documented throughout the school year. This summative report reflects a student’s performance
on a single assessment, which generally carries with it high stakes that may affect grade-level
promotion, school funding, and be “used to make decisions about students, teachers, schools
and/or districts” (Blazer, 2011, p. 1). While based on the same standards, these two accounts
may report different things (O’Malley, 2017).
This is a confusing reality in American schools today. Students in elementary schools
can be exposed to a standards-based curriculum for 180 days. Their teachers may plan highly-
engaging, standards-driven lessons and formatively assess student progress towards meeting
those standards all along the way. Students may also receive regular feedback from teachers who
share the results from quizzes, tests, and performance-based assessments with their parents, and
parents may receive quarterly report cards and attend parent/teacher conferences in which they
are presented with evidence of their child’s learning over the course of the instructional period.
Some of these students may even be celebrated with awards, medals, and trophies at Honors Day

ARE TEACHERS’ FORMATIVE ASSESSMENTS RELIABLE?
9
Programs affirming them for their efforts in achieving above average mastery of grade level
standards. All these things may take place in schools today based upon how students performed
on teacher-made/selected formative assessments. Yet the score reports from the standardized
assessment given at the end of the school year may indicate something very different from the
portrait painted by the student’s classroom teacher.
This is a wide-spread issue. Variability in students’ performance on classroom
assessments and norm-referenced assessments such as the SAT or the ACT is well documented
for high school students because of its impact for admission into American colleges and
universities (Berlinsky-Schine, 2020). The issue is pervasive throughout the country. One study
of 123,000 students enrolled in 33 American colleges found that a student’s high school grades is
“a more reliable predictor of academic success” than the standardized assessment (Adams, 2014,
p. 1).
However, what about elementary students who are tested using a criterion-referenced
assessment? Are parents of elementary school students receiving conflicting reports, as well?
Logical assumptions could be made that a student’s standardized test performance and classroom
grades would be similar because they are both assessments of a student’s mastery of a given
curriculum. O’Malley (2017) reports that standardized test scores do not always mirror grades
that students have earned in the classroom. She also states that the students’ performance in
school generally reflects higher achievement than standardized test performance (O’Malley,
2017). Though not as well documented as it is with high school students, it appears that there is
some concern about the discrepancy between classroom performance and standardized testing
performance even in elementary and middle schools. This is evident through the numerous

ARE TEACHERS’ FORMATIVE ASSESSMENTS RELIABLE?
10
published articles and reports giving parents “tips” to help students improve on standardized
assessments (Liu, 2020).
End of Grade Assessments
The federal mandate covered in the 2015 Every Student Succeeds Act (ESSA) requires
that public schools in our country adopt an academically challenging curriculum and are held
accountable for student achievement through annual testing in third through eighth grade. Public
school students in these grades take a state-mandated test once a year in reading and math and
must also be tested in science once in elementary and middle school (The Understood Team,
2020).
Students all over the country are held to this mandate. However, this study will focus and
gather data from a school district in Georgia. While the data for this study is collected in one
state, the results can be applicable to states all over the country that adheres to the 2015 ESSA
federal mandate of adopting state-mandated assessments for accountability purposes. State-
mandated testing in elementary schools is a priority throughout our country. “High-quality
assessments are a critical tool that can help educators, parents, and policymakers promote
educational equity by highlighting achievement gaps, especially for our traditionally underserved
students, and that can spur instructional improvements that benefit all our children” (Alexander,
2017, p. 4).
Previously in the state of Georgia, students in third through eighth grade were required to
take stakes End of Grade (EOG) assessments on the state’s criterion-referenced test, the Georgia
Milestones. The Georgia Department of Education (2015) states that the purpose of the EOG
assessments is to ascertain how well students have mastered the curriculum taught in state-
funded schools throughout the year. Students’ performance on these tests is also used to gauge

ARE TEACHERS’ FORMATIVE ASSESSMENTS RELIABLE?
11
the quality of the schools, and this information is shared with stakeholders (i.e. parents, the
public, policy makers, etc.). The administration of the Georgia Milestones was to meet the
federal mandate of the Every Student Succeeds Act. This federal education law mandates that
states must annually assess students in grades 3-8 for accountability purposes (U. S. Department
of Education, 2015).
The Georgia Milestones was introduced to the educational community in 2014 with its
first implementation in the 2014-2015 school year (Beaudette, 2014). With the state’s adoption
of new content standards – the Georgia Standards of Excellence (GSE) – the Georgia Milestones
was created as a summative assessment to “measure how well students have learned the
knowledge and skills outlined in these standards” (Beaudette, 2014, p. 2). The Georgia
Milestones replaced the Criterion Referenced Competency Test (CRCT) that had been previously
used as part of the state’s accountability system.
However, there have been recent changes to the state’s summative assessment cycle. On
March 16, 2020, Governor Brian Kemp signed an Executive Order which suspended in-person
learning for all Georgia schools due to the Covid-19 pandemic plaguing our county (Lane, 2020).
In support of this mandate and similar mandates across the country, the United States Education
Secretary, Betsy DeVos, provided a one-year waiver to “suspend federally mandated testing for
the 2019-20 school year after schools around the country closed and learning was delivered
remotely for several months” (Strauss, 2020, p. 3).
Since that time, Georgia’s Governor Brian Kemp has sought to gain permission from the
federal government to suspend the Georgia Milestones Assessment System (GMAS) testing for
the second year in a row because of what he called “disruptions in learning” due to the
coronavirus pandemic (Strauss, 2020, p. 1). Governor Kemp further stated that he would

ARE TEACHERS’ FORMATIVE ASSESSMENTS RELIABLE?
12
continue to seek eliminating some assessments because, in his opinion the “current high-stakes
testing regime is excessive” (Strauss, 2020, p. 1). The governor also stated that the schools
should use the upcoming school year to “focus on remediation, growth and the safety of
students” (Strauss, 2020, p. 6).
Problem Statement
In contemplating changes to the yearly assessment cycle, educators, policy makers and
other stake-holders must consider what type of assessment system should be implemented to
focus on remediation and growth while providing the data needed at the federal level to
document student achievement and school effectiveness. Without the administration of the
summative assessment, what could be used?
Because the EOG assessments are given at the end of the year, it would be beneficial for
students, parents and teachers to be able to track students’ mastery of curriculum standards
throughout the year. One would think that this could be aptly done by examining the grades that
students receive from classwork and tests that assess these same grade level standards. However,
research of this issue in high school classes shows that there can be a great disparity between the
grades that students achieve on their report cards and the performance level rating that they
achieve on end-of-course/end-of-grade assessments (O’Malley, 2017). It can be very
disheartening for a parent to see that his/her child performed poorly on this standardized test
after receiving passing, if not exceptional, grades throughout the school year.
However, this does occur with End of Course (EOC) assessments. For example, it was
reported in 2009 that over 200,000 students were enrolled in the Algebra I course in public
schools in Texas. Eighty-eight percent of those students passed the Algebra I course. However,
only 56% of the 10th graders passed the Texas Assessment of Knowledge and Skills (O’Malley,

ARE TEACHERS’ FORMATIVE ASSESSMENTS RELIABLE?
13
2017). Furthermore, this is not a recent issue. A study conducted in 1999 reported that 79% of
the students in Texas passed the Algebra I course, but only 45% of those students passed the
Algebra I EOC test (Boykin, 2010).
The goal of this study is to determine if the results from teacher-created/selected
formative assessments are reliable indicators of how students will perform on a summative
assessment that measures the same curriculum.
Research Questions
This study was designed to answer the following research questions:
1. What is the relationship between a student’s math grades and his/her standardized test
score?
2. What are teachers’ perceptions regarding the uses of standardized test scores in
improving instructional decisions?
3. How well do teachers’ formative assessments align with the rigor of the standardized
assessment at the appropriate level of complexity?
Organization of the Study
The first chapter, Chapter 1, will serve as an introduction to the study as well as an
overview of the background and imminent need for reform in testing practices in the state of
Georgia, which can be applicable to other states with state-mandated testing. This chapter will
also share the problem statement, research questions, and outline of the study.
In Chapter 2, the researcher will review relevant literature regarding the ever-changing
cycle of assessment in American history. The strengths, challenges, and issues with each type of
assessment will also be discussed. This chapter will also present working definitions of terms
associated with assessment and the testing movement in the United States. Findings from

ARE TEACHERS’ FORMATIVE ASSESSMENTS RELIABLE?
14
empirical studies that are currently available relationship between formative and summative
assessments will be shared, and connections to the field of teacher leadership will be purported.
Chapter 3 describes the methodology used in this study to address the three research
questions. Included in this chapter are details of the research design including a description of
the research theories used. Details regarding the participant selections, instruments, and data
collection/analysis will be shared.
Chapter 4 will include the analysis of all data collected for the study. The data analysis
will be organized by research questions. In this chapter, discussion regarding any emerging
themes will be highlighted, as well.
Finally, Chapter 5 will encompass a summary of the major findings of this study.
Implications for the field of teacher leadership will also be addressed in this chapter along with
recommendations for teachers, teacher leaders, and future research.

ARE TEACHERS’ FORMATIVE ASSESSMENTS RELIABLE?
15
Chapter 2: Review of the Literature
Educational assessments have become a common fixture in our American schools since
the beginning of the one-room schoolhouses of the colonial period (Brink, 2011). Along with its
pervasive use, assessment has taken on many forms–from oral examinations, to paper-pencil
tests, to standardized/multiple-choice assessments, and performance-based evaluations (Miller,
Gronlund & Lin, 2013, p. 1). However, policymakers have attempted over the years to have
assessments create a portrait of the learner that summarizes his/her knowledge level, abilities,
readiness, and aptitude (Park, Ji, & Lin, 2015). This quest to use assessments to create the
perfect profile of a learner has come under scrutiny and leaves people to ask several questions:
What does this assessment tell about the learner? Is this assessment really measuring what it
proposes? How can information from this assessment be used? Will other assessments yield
similar findings? These questions and more should be addressed to determine the proper use of
assessment in American schools.
History of Educational Assessments in U. S. Schools
Reform in educational measurement within the United States can be traced back to the
mid-1850’s (Miller, Gronlund, & Lin, 2013, p. 4). As the perceived needs of the nation have
changed, so has the evaluation of its students. Politicians and policy makers have greatly
influenced the educators’ practice to help frame the concept of an ideal citizen needed to propel
this nation to be a leading force in the world (Brock, 2018). Along with these ideals, assessments
have been created to evaluate whether or not schools are producing students that will give
America the edge that is needed, as well as, ensure that schools and teachers are held accountable
to taxpayers for their significant investment (History of Standardized Tests, n.d.).

ARE TEACHERS’ FORMATIVE ASSESSMENTS RELIABLE?
16
Because assessment has become a standard component of the educational cycle,
educational examinations are commonplace in our schools (Neill, 2016). However, shifts over
time in the way people think about education have caused the purposes of educational
examinations to change and evolve (Chappuis, 2010). An examination is a detailed evaluation or
test of one’s knowledge and/or skills in an identified area (Examination, n.d.). However,
examinations in the United States have taken on many forms and have changed over time based
upon ever-evolving objectives.
Oral Examinations
Before 1845, the mission of schools in the United States was to serve the wealthy elite,
and assessments were given to determine if students had mastered what had been taught. These
examinations were called “recitations” and were administered orally in a whole group setting
(Brink, 2011). However, educational reformers, such as Horace Mann of Massachusetts and
Henry Barnard of Connecticut began a movement to provide a free, public education for the
masses paid by tax dollars. These reformers believed that making a public education available
for all people in the country would serve “as an effective instrument to achieve justice and
equality of opportunity and to remove poverty” (Mishra, 2016, p. 84). Therefore, with this end
in mind, it became necessary to create accountability systems so that the use of tax dollars could
be justified. The laborious and time-consuming methods of oral examinations would not suffice.
Written Examinations
After visiting Europe in 1843, Mann was convinced that written exams were superior to
oral recitations in that they could be administered to large groups at a time and served as a lasting
record of knowledge obtained by the student (Hutchinson & Hadjioannou, 2017). Therefore, in
1845, the Massachusetts Board of Education under the leadership of Horace Mann began

ARE TEACHERS’ FORMATIVE ASSESSMENTS RELIABLE?
17
instituting written examinations of students. The results of these tests were not received well
because teachers were harshly criticized about the quality of education that students received.
Teachers believed that the reason for unfavorable student outcomes was that the written exams
were not well aligned to the content taught in the classrooms (“History of Standardized Testing,”
2013).
Standardized Tests
These written exams were the first examples of “standardized tests”. These tests were
standardized in that they were easily-gradable, published assessments with directions given for
administration and instructions for interpretation of the results (Congress of the U. S., 1992, p.
108). Also, teachers were not privy to the questions before the administration. With the
administration of these early assessments, there was minimal thought for the idea of norming
student results or comparing student scores against the performance of peers of the same age or
grade level who had already completed the exam. However, information gathered from these
early, standardized written assessments would soon be used as an educational equalizer to ensure
that students in one-room country schoolhouses were receiving an education comparable to
students in big metropolitan areas (Brookhart, 2013).
Achievement Tests
From 1850 to 1900, the residual effects of taxpayers funding public education became a
dubious burden that required justification from policy makers. Not only were tax dollars being
used to fund schooling for the masses, but income decreased significantly that would have been
generated by students aged 10 to 15 if they were working instead of attending school. It was
estimated that this loss of income from school-aged children increased from $25 million in 1860
to $215 million in 1900 (Congress of the U. S., 1992, p. 106). In order to justify the money spent

ARE TEACHERS’ FORMATIVE ASSESSMENTS RELIABLE?
18
on public education, policy makers relied on principles of business practices and determined that
achievement tests should be implemented to show the returns of investment in students’
education. Thus, achievement tests were implemented for accountability measures. These first
achievement tests had a two-fold purpose – to classify students based upon proficiency and to
allow outside governing authorities to monitor the effectiveness of schools (Hutt & Schneider,
2018).
College Entrance Exams
During this time, achievement tests were not only used in grade schools, but were
becoming increasingly popular with colleges. In 1890 Harvard President, Charles William Eliot,
proposed that colleges create a standardized admissions test that would be a requirement for
entry into colleges throughout the country. Therefore, in 1900, the College Entrance
Examination Board was established, and the first college entry exams were administered in 1901
(Alcocer, n.d.).
Additionally, standardized assessments were becoming increasingly popular. In 1905,
Alfred Binet created a standardized test that measured intelligence (i.e. Standford-Binet
Intelligence Test). Also, in World War I, servicemen were given aptitude tests to assign them to
appropriate jobs in the military, and throughout the first three decades of the 20th century, there
were well over 100 standardized achievement tests created to assess students in elementary and
secondary school subject areas (Alcocer, n.d.) including the first SAT tests administered in 1926.
Advancements in Scoring
Consequently, because of the popularity with standardized testing, developments were
created to provide ease of use and faster reporting. In 1914 when completing his doctoral
dissertation at Kansas State Teachers’ College, Frederick Kelly introduced the concern of

ARE TEACHERS’ FORMATIVE ASSESSMENTS RELIABLE?
19
subjectivity in grading assessments. Therefore, he proposed that examinations be created that
had pre-established answers and eliminated any variation in scoring (Watters, 2015). Kelly’s
multiple-choice Kansas Silent Reading Test could be administered within a limited time frame
without the student having to write anything and graded by scanning the page at a glance. This
type of standardized assessment gained popularity, and the first multiple-choice assessments
were introduced on a large scale in 1930 as a means of removing some of the subjectivity in
grading/scoring (Alcocer, n.d.). Then in 1936, advancements in computing led to the creation of
the automatic test scanner by IBM, which remained virtually unchanged up until 2005
(Automated Test Scoring, n.d.).
Norm-Referenced Tests
Next, governmental policies were introduced that required the use of standardized testing
as a requisite for receiving federal funding. Federal legislation like the 1958 National Defense
Education Act (NDEA) required secondary schools to establish testing programs in order to
receive federal dollars. These tests were to be used “to identify students with outstanding
aptitudes and abilities so they could prepare for college” (Brookhart, 2013). Also, after the Civil
Rights Act of 1964 was passed to promote equality in schools, President Lyndon B. Johnson
facilitated the establishment of the Elementary and Secondary Education Act (ESEA) in 1965.
This government regulation, along with its subsequent reauthorizations, emphasized high
standards and accountability in schools and used norm-referenced, standardized testing as a tool
to evaluate educational programs and a requirement for Title I or low-income schools to receive
funding (Paul, 2018). This yielded the consistent use of norm-referenced tests such as the Iowa
Test of Basic Skills (ITBS) in elementary schools and the American College Testing Program
(ACT) for entrance into college programs (History of Standardized Tests, n.d.). These norm-

ARE TEACHERS’ FORMATIVE ASSESSMENTS RELIABLE?
20
referenced assessments were used to rank students and compare their performance to similar
peers across the nation.
Basic Skills Tests
The next major advancement in education reform that impacted testing in schools was the
“Back-to-Basics” movement beginning in the 1970s. This educational reform movement
resulted from a decline in student test scores and concern from the private sector that schools
were not producing graduates that were competent in the basic skills – reading, writing, and
arithmetic. Therefore, minimum competency exams were established in some states to ensure
students achieved a minimum level of competency before moving to the next grade or graduating
from high school (Weiss, 2016).
Although the country now had educational assessments that required a focus on minimum
competencies, in 1983, President Ronald Reagan released a report called, “A Nation at Risk.” In
this report, there were some startling findings about the assessment results in the nation—“23
million American adults were functionally illiterate; the average achievement for high school
students on standardized tests was lower than before the launch of Sputnik in 1957; and only
one-fifth of 17-year old students had the ability to write a persuasive essay” (Graham, 2015).
These findings caused great alarm and launched the standards-based reform era in American
testing.
Criterion-Referenced Competency Tests
During the standards-based era, reauthorizations of ESEA boosted federal allocations for
education with the goal of increasing students’ proficiency on state-wide exams (High, 2015).
These criterion-referenced assessments were to be created based upon approved state-wide
curriculum standards that were grade-level expectations of what students should learn in school.

ARE TEACHERS’ FORMATIVE ASSESSMENTS RELIABLE?
21
Common Core State Standards were created in 2010 and released for adoption to support the
idea of a national curriculum. The No Child Left Behind Act (NCLB) of 2001 and its updated
version, Race to the Top (RTTT) forced accountability of schools through these criterion-
referenced assessments and evaluated schools based upon their achieving Adequate Yearly
Progress (AYP; Lee, 2014).
Reporting for Subgroups
Components of the reauthorizations of ESEA take into consideration the progress of each
subgroup tested. Previously, the assessment performance of subgroups such as African-
Americans, English-language learners, and students with disabilities was hidden from scrutiny
among the total school population, virtually ignoring their growth and progress. However, with
NCLB, RTTT, and the most recent Every Student Succeeds Act of 2015, there has been a focus
for improving student outcomes of all learners in the nation’s schools (Education Post, 2019).
Major Categories of Assessments
The nation’s history is replete with examples of how educators and policy makers have
used assessments to ascertain students’ knowledge, skill, and aptitude, measure learner growth,
compare and rank order students, identify qualified candidates, and evaluate schools. However,
studies of assessments in schools have shown that assessments occur during three main periods
of the instructional cycle: before, during and after instruction (Konen, 2017), and are classified
into two categories – formative assessments and summative assessments (Proprofs, 2019).
Formative assessment practices are considered part of the instructional cycle. They inform
students and teachers of students’ progress towards achieving identified goals, and are used to
guide instructional decisions. On the other hand, summative assessment practices are used to
determine what students have learned with regards to content standards. Summative assessments

ARE TEACHERS’ FORMATIVE ASSESSMENTS RELIABLE?
22
can be standardized assessments or teacher-created assessments given at the end of an
instructional cycle (Reese, 2009). The following is a description of the four main types of
assessments that are used in American schools today.
Diagnostic Assessments
Diagnostic assessments are formative assessments used to gauge what students already
know (Archuleta, 2019). They involve the collection and meticulous evaluation of data
concerning students’ knowledge in a particular area. Diagnostic assessments are administered
before instruction begins to determine what students know and understand at the onset of a
particular course, unit or lesson. They provide detailed information about learning barriers
students may have and offer insight into skills that need to be attained (Saeed, Tahir, and Latif,
2018). Educators then use the information gathered from diagnostic assessments to individualize
instruction to meet students’ needs. Diagnostic assessments have aided teachers in identifying
students’ strengths and weakness, identifying students’ misconceptions about a concept, and
planning for instruction.
Both informal and formal measures may be used as diagnostic assessments (“Formal and
Informal Assessments,” 2015). Examples of diagnostic assessments created by teachers include
pretests, self-assessments, inventories, interviews, initial writing prompts, etc. Other more
formal diagnostic assessments used in education and created by psychometricians include
assessments such as DIBELS (Dynamic Indicators of Basic Early Literacy Skills) and IKAN
(Individual Knowledge Assessment of Number). Diagnostic assessments can take almost any
form with the goal of gathering information about what the student knows about the content
before the instruction begins (Abbey, 2017).

ARE TEACHERS’ FORMATIVE ASSESSMENTS RELIABLE?
23
Strengths. Diagnostic assessments add value to the educational process in that they
provide a realistic picture of a student’s current understanding of knowledge and skills in a
course before instruction begins. Having this knowledge helps educators plan for instruction and
helps students know what skills/content should be focused upon during the course (Abbey,
2017). This type of information helps to individualize the instruction for students and make the
learning experiences more meaningful for them (Wixson & Valencia, 2011). Learning pathways
created through diagnostic assessments have been found to improve time on task and increase
student engagement (Pagani, Fitzpatrick, & Parent, 2012).
Also, diagnostic assessments help teachers and students pace themselves. For example, if
a diagnostic assessment shows that a student has sufficient knowledge in a particular area, time
can be devoted to other areas of need. Using data from diagnostic assessments helps educators to
shape their courses, reserving precious instructional time for content that has not yet been
mastered (Nguyen, 2019).
Another benefit of the use of diagnostic assessments is that they can be used to measure
the impact of an instructional program (Bhanji et al., 2012). Because diagnostic assessments are
administered before the treatment/instruction begins, stakeholders are able to know exactly what
level of understanding students possessed in a particular area before the course and then use
another assessment to measure the student growth achieved (Thomas et al., 2019). Because of
this benefit, data from diagnostic assessments is sometimes compared to student outcomes
demonstrated in summative assessments to provide a picture of student achievement, program
implementation, professional development needs of staff, and even teacher effectiveness.

ARE TEACHERS’ FORMATIVE ASSESSMENTS RELIABLE?
24
Challenges. One real drawback to the use of diagnostic assessments is in the lack of
flexibility in some courses. The purpose of using diagnostic assessments is to be able to use the
information to tailor student learning. However, some schools/districts/programs require a strict
adherence to a prescribed scope and sequence that limits flexibility (Keeling, 2009).
Another challenge for teachers is that even though diagnostic assessments are used, there
is a lack of time and/or resources to fill in the gaps for some students and meet everyone’s
individualized needs while maintaining the requirements of a particular course. Often data from
diagnostic assessments shows multiple pre-requisite skills and knowledge that must be attained
before a student is able to be successful in a particular unit/course. This presents a challenge for
educators to meet these individualized needs. One author writes, “We spend significant amounts
of time teaching in reverse, and then ask why students are not catching up to their peers”
(Rollins, 2014, p. 4).
Finally, as with many other types of assessments, a student’s familiarity with the
diagnostic assessment can skew data for better or for worse. There have been educators that
have documented that becoming accustomed to prompts used in a particular test format reduces
frustration and facilitates demonstration of mastery of a concept (Giavanna, 2017).
Interim/Benchmark Assessments
Interim/Benchmark assessments are administered periodically (every five to nine weeks)
within the school year to determine students’ progress towards demonstrating proficiency with
identified curriculum/grade-level standards. (Garner, Thorne, & Horn, 2017). Educators use the
data gathered from benchmark assessments in a variety of ways to inform instructional decisions.
Classroom teachers use information from benchmark assessments to determine which standards
have been mastered and adjust instruction accordingly. School-level and district administrators

ARE TEACHERS’ FORMATIVE ASSESSMENTS RELIABLE?
25
use the data from interim assessments as an indication of the effectiveness of curricular resources
to help students master grade-level standards. The information gained from benchmark
assessments is also used to measure student growth over time and to predict students’
performance on high-stakes assessments like end-of-grade or end-of-class summative
assessments (Garner, Thorne, & Horn, 2017). Examples of some interim/benchmark assessments
include Renaissance Star Reading and Math, Voyager Sopris Learning, and Aimsweb Plus.
Strengths. In his article, “Interim Assessments: Keys to Successful Implementation,”
Kim Marshall states the overarching benefit of interim assessments. “The basic argument for
interim assessments is actually quite compelling: let’s fix our students’ learning problems during
the year, rather than waiting for high-stakes tests to make summative judgments on us all at the
end of the year” (Marshall, 2006, p. 6).
One of the features of the reports that typically come from popular interim/benchmark
assessments is the at-a-glance interpretation guide concerning students at risk of academic
failure. Many of the reports provided from the interim/benchmark assessments utilize a traffic-
light style reporting process that gives the reader easy-to-interpret information at-a-glance about
a student’s mastery of grade level standards. See Figure 1 below which shows a sample report
from an Algebra benchmark assessment.

ARE TEACHERS’ FORMATIVE ASSESSMENTS RELIABLE?
26
Figure 1. Sample report from an interim-benchmark assessment. Reprinted from
setontesting.com. (n.d.). Retrieved from https://www.setontesting.com/algebra-placement-test/.
Copyright 2018 by Seton Testing Services. Reprinted for educational use only.
Challenges. One documented challenge of using interim/benchmark assessments is that
some teachers have found that the benchmark assessment may not be well aligned to the pacing
in the scope and sequence (Abrams, Mcmillan, & Wetzel, 2015). When this occurs, students’
scores on benchmarks cannot be seen as reliable because the assessment truly did not measure
the intended content of what should have been taught up to that point in time. One teacher
expressed her frustration:
“The other problem too is when you have your pacing guide and they tell you to hit this
[content] the first nine weeks, a lot of times the questions on the benchmark aren’t

ARE TEACHERS’ FORMATIVE ASSESSMENTS RELIABLE?
27
correlated with what you were teaching the first nine weeks, so they will have questions
about things that they didn’t tell you to go over” (Abrams, Mcmillan, & Wetzel, 2015, p.
365).
Alignment is also a problem with benchmarks created at the district level by curriculum
specialists. In a 2017 study, Garner, Thorne, and Horn reported that “locally developed
benchmark assessments lack the (costly) psychometric validation of published tests, while
purchased benchmark assessments are often poorly aligned to local curricula” (p. 409).
Formative Assessments
Formative assessments are informal and formal measures of learning that are used
throughout an instructional cycle to monitor students’ progress towards identified goals or
expectations. The main goal of formative assessments is to improve learning rather than just to
assign a grade (Godbout & Richard, 2000). The information gained through the use of formative
assessments assists educators in making sound instructional decisions that meet the needs of
learners in their classes. W. J. Popham cites in his research that “if teachers employ (a) formative
assessment's means-ends paradigm in their classrooms, their students will learn better” (Popham,
2013). Diagnostic assessments and benchmark assessments are formative in nature when the
data gathered is used to improve student outcomes. Because formative assessments are used to
drive instruction, it is imperative that they are given periodically throughout the unit/course to
provide effective/timely feedback thereby maximizing student achievement.
Formative assessments can take on many different methods and can be formal or informal
in nature. Some of the strategies used for formative assessments are discussed below:
• Analyzing Student Work – Teachers examine student work against an exemplar
to identify gaps between their learning targets and the actual student’s

ARE TEACHERS’ FORMATIVE ASSESSMENTS RELIABLE?
28
performance. This information is used to determine students’ mastery of
standards, as well as, provided teachers with information to modify their
practices (Brondyk, n.d.)
• Classroom Polls – This is a method to check for whole group understanding. The
teacher poses a question and polls the room to determine how many students are
answering the question (i.e. “How many chose letter A? B? C? D?”). Students
then display their answers by holding them up on whiteboards or raising the
number of fingers to show their responses. This strategy allows the teacher to
assess learning at-a-glance (Bambrick-Santoyo, 2016)
• Conferencing – This assessment strategy involves the educator meeting one-on-
one with the student to discuss a particular assignment. During the conference,
the teacher is able to ascertain student mastery of concepts and provide the
student with immediate feedback for improvement (Fluckiger et al., 2010).
• Essays/ Open-Ended Questioning – Students are given a question to respond to in
order to demonstrate mastery or understanding of a concept. The prompt is
“open-ended” in that it requires the student to construct an answer as opposed to
selecting the correct answer choice (“close-ended”). Open-ended essay type
assessments also require more depth of thought than close-ended questions.
Norman Webb and Karin Hess suggest that open-ended questioning as a
formative assessment not only assesses the “breadth of content but also the depth
at which students are expected to understand concepts (Eddy & Kuehnert, 2018,
p. 37).

ARE TEACHERS’ FORMATIVE ASSESSMENTS RELIABLE?
29
• Exit Tickets – Also referred to as “Tickets Out the Door,” these assessments
allow students to respond to a question, solve a problem or summarize their
understanding of the day’s lesson in a short amount of time. This type of
informal assessment is usually given on an index card or a “sticky note.” (Dodge,
2009).
• Formative Paper-Pencil Assessments – This type of assessment employs the use
of various assessment strategies such as multiple-choice assessment items, essay
items (open- and closed-ended questions), performance tasks, etc. to allow
students to demonstrate mastery of a concept. Formative paper-pencil
assessments are graded and the results are shared with students as a check in
student progress (Ketabi & Ketabi, 2014).
• Games – Educational games are often used in the classroom as an interactive way
for teachers to assess students’ knowledge. They can be used to assess the
knowledge of an individual or a group of students and are widely used for
assessment purposes because of the vast array of possibilities and their
motivational appeal (Kumar, 2018).
• Graphic Organizers – Students use this type of assessment to make connections
in their learning, show relationships between concepts and organize information
from the content (Dodge, 2009).
• Journal Reflections – This ongoing assessment strategy requires the student to
describe personal thoughts and record their ideas and experiences. The strength
of reflective journals lies in that they show individual growth and changes within
in the student over a period of time (Clark, 2012).

ARE TEACHERS’ FORMATIVE ASSESSMENTS RELIABLE?
30
• Misconception Check – This type of formative assessment provides students with
an incorrect answer in order to see if they can identify the error. To assess in this
way, teachers give students a false fact about the lesson concept and students use
some type of signal (i.e., colored cards, thumbs up/down, stand/sit) to agree or
disagree. The teacher must record student answers so that the information can be
used to clear up student misconceptions (Holbeck, Bergquist, & Lees, 2014).
• Multiple Choice Assessments – This type of formative assessment is popular
because of its ease in grading and its objective nature. Students are given a
prompt and are asked to select only the correct answer(s) from the listed choices
(Barlow & Marolt, 2012).
• Observation – In this process, the teacher systematically views or records
students while at work for the purpose of improving instruction. This process
gives teachers insight into students’ thought processes, learning styles, and
misconceptions (Liu, 2013).
• Performance-Based Assessments – Students are asked to make a presentation,
perform a task, create or produce a product with real-world connections. This
type of assessment is used to gauge students’ problem-solving and critical
thinking skills (Harada, 2004). This type of assessment requires students to create
something to serve as evidence of their learning.
• Portfolio – This is a type of authentic is a collection of a student’s work samples
within a course over a period of time. The student’s work is collected and
evaluated to show growth over time. The work selected in the portfolio should
represent a variety of skills and knowledge obtained throughout the course. Also,

ARE TEACHERS’ FORMATIVE ASSESSMENTS RELIABLE?
31
portfolio assessments can be used for self-reflection and exhibition of learning
(Adeyemi, 2015).
• Quizzes – A quiz can be considered as a pre-test to determine how a student has
achieved mastery of the instructional material before the summative exam.
Quizzes should be aligned directly to content standards and lesson objectives.
Several types of questions (i.e. multiple-choice, fill in the blank, constructed
responses, etc.) can be used on a quiz with the intent of using the information to
track student progress and improve learning (Turner, 2014).
• Self-assessments – This type of formative assessment improves the educational
process by requiring students to monitor their own learning based upon identified
success criteria. Students are empowered and taught to “regulate their own
learning by requiring them to exercise metacognitive monitoring of their work
and processes against standards, expectations, targets, or goals” (Panadero,
Brown & Strijbos, 2016, p. 811).
• Summarization/Reflection – Students are provided opportunities to pause their
learning, review, and make sense of what they have learned. Summarization is a
beneficial formative assessment practice because it requires students to
synthesize information, sorting through ideas and gleaning the most important
information. It is considered one of the less stressful formative assessments
methods, and researchers have found that reflective summarization also helps
students better retain their knowledge, thereby improving learning (Mock et al.,
2016).

ARE TEACHERS’ FORMATIVE ASSESSMENTS RELIABLE?
32
Strengths. Formative assessment improves the educational process in several ways. It is
used “to clarify what students are supposed to be learning, improve the instructional practices of
individual teachers, and allow for reteaching of concepts to reach struggling students” (Bekula,
2010). Formative assessment also strengthens the educational process by providing “real-time”
data needed to adjust teaching and learning (Phelps, 2010). It promotes the use of effective
strategies in the classroom because teachers are able to gather information to modify teaching
and learning as it is happening.
In addition to helping teachers make sound instructional decisions, formative assessments
can help students become more self-reflective about their learning (Hollingworth, 2012).
Formative assessments give students the opportunity to check their progress during the course of
the instructional unit. One study found that formative assessments improve the relationship
between parents and teachers by using the information about the student gained from the
formative assessment to help parents and educators establish goals and have a common
understanding about what is needed for the student (Curry et al., 2016).
Also, formative assessments tend to carry less risk that some other assessments. They are
generally used in conjunction with other instructional measures to create a portrait of the
student’s performance. Other assessments like summative, standardized assessments have higher
stakes and may be used as criteria for promotion to the next grade level or passing a class
(Carnegie Mellon University, 2019).
Challenges. One significant challenge in the use of formative assessments is that “most
current classroom teachers do not receive training in effective assessment practice in their
preparation programs, and require significant and ongoing training to develop this practice (Dell

ARE TEACHERS’ FORMATIVE ASSESSMENTS RELIABLE?
33
& Dell, 2016). If the assessment does not appropriately measure what it intends to assess, it is a
waste of time.
Additionally, some educators feel that precious instructional time is sometimes sacrificed
to administer common formative assessments within the school. Common formative
assessments are assessments that are meant to guide instruction but are given to every child in a
particular course within the grade to compare student and teacher performance. When teachers
must adhere to rigid formative assessment schedules, they may feel the need to push through
content before it is taught to mastery which, in turn, diminishes student outcomes on the
assessment (Sasser, 2018).
Another thing to consider about formative assessments is that they are generally low-
stakes assessments and lack the gravity associated with the higher-stakes of summative
assessments. This may result in students not taking the assessments seriously and not attempting
to perform as well on them. When this happens, teachers will not be able to get a true picture of
a students’ ability and use the information improperly (Sasser, 2018).
Summative Assessments
In contrast to formative assessments, summative assessments are used at the end of an
instructional course to ascertain what students have learned during that period of instruction.
Formative assessments are assessments for learning, while summative assessments are
assessments of learning (Tomlinson et al., 2013). According to a leader in the field, Richard
DuFour (2010), summative assessments should answer the following questions: “Did the student
acquire the intended knowledge and skills by the deadline? Yes or no? Pass or fail? Proficient
or non-proficient?” (p. 2). Summative assessments are viewed as the culminating assessments
after an instructional cycle has been completed (e.g. a final project, comprehensive exam, senior

ARE TEACHERS’ FORMATIVE ASSESSMENTS RELIABLE?
34
recital, research paper). Generally, the information used from summative assessments has more
far-reaching effects than the other types of assessments which focus on the individual learner.
Data gathered from some summative assessments carry high stakes in that the information is
sometimes used to determine promotion of students, evaluate the educator’s instruction and/or
the effectiveness of the curriculum or accreditation of a program (Garrison & Erhinghaus, 2019).
Strengths. One of the strengths of summative assessments is that they are generally
given at the end of a course and can be used to measure growth and attainment of skills and
objectives. They are criterion-referenced assessments which means that they are based upon
certain knowledge and skills that have been identified for course mastery (Klapp, 2018).
Summative assessments are also used as a motivator for students (Klapp, 2018). Because of the
gravity of the assessment, students will be more likely to take the summative exam seriously and
be motivated to do their best (Concordia, 2017).
Challenges. Even though having high-stakes assigned to most summative assessments is
a strength, there are negative aspects involved with the use of these assessments. Summative
assessments are sometimes used as a singular variable for some high-stakes decisions. For
example, promotion to the next grade for third, fifth, and eighth grade students in the state of
Georgia is dependent upon the student’s performance on one assessment—the Georgia
Milestones Assessment. Students in grade 3 must pass the English/Language Arts assessment,
and students in grades 5 and 8 must pass the English/Language Arts and Mathematics
assessments in order to be promoted to the next grade level (“Promotion and Retention
Guidance,” 2019) virtually ignoring their performance on formative assessments the entire year.
Also, many summative assessments are standardized tests that were not created by
classroom teachers who teach the content, but were created by psychometricians as an

ARE TEACHERS’ FORMATIVE ASSESSMENTS RELIABLE?
35
accountability measure for school evaluation and state/federal funding. The issue with these
standardized, formative assessments is that they have years of research questioning the reliability
and validity of these accountability measures (Strauss, 2017).
Issues with Testing
Questions about the Veracity of Standardized Tests. Because standardized tests are
typically used as accountability measures that determine promotion/retention, merit pay, teacher
and principal evaluations, one would question the accuracy of these summative tests. The
accountability reform movement of Race to the Top (RTTT) funded two different agencies to
create criterion-referenced standardized assessments aligned to the Common Core Curriculum
Standards (CCCS). These two consortiums—Smarter Balanced and Partners for Assessment of
Readiness for College and Careers (PARCC)—develop annual standardized assessments to be
used in multiple states across the country (Kubiszyn & Borich, 2016, p. 336). With access to
federal funds, testing is a multi-million dollar industry. In 2017, the Huffington Post reported
that the “standardized testing market was anywhere between $400 million and $700 million”
(Stauffer, 2017, p. 2).
Additionally, these tests are constructed by psychometricians, curriculum experts,
teachers and school administrators who use their expertise to ensure that they yield accurate
results. In other words, students’ performance on norm-referenced tests should be accurately
compared to a normative sample, and students’ performance on standardized criterion-referenced
tests, such as the Georgia Milestones, should correctly indicate if students meet or exceed the
state standards (Kubiszyn & Borich, 2016, p. 337).
With so much money being spent to develop them by experts in the field, it would seem
that standardized tests could be trusted to provide an accurate picture of student performance.

ARE TEACHERS’ FORMATIVE ASSESSMENTS RELIABLE?
36
However, there are multiple reports of issues with reports of standardized assessments due to test
bias. There is an ongoing debate initially raised by Roy Freedle in 2003 about the SAT being
culturally and statistically biased (“Bias in the SAT,” 2010). Several researchers have produced
counter claims (Dorans & Zeller, 2004), but the debate continues. Also, the veracity of the
results of the Praxis I exam was called into question because a certain group of candidates for a
teacher education program was found to “not know how to take” standardized assessments
(Graham, 2013, p. 1). The researcher did not call this an example of test bias but did
acknowledge that the scores of this ethnic group were impacted negatively.
Also, standardized assessments are limited in that they are just one “snapshot” of a
student’s achievement. Ricketts (2010) reports that a variety of assessments should be used to
provide a clear picture of a student’s achievement. She further states that the most ideal
assessment situation is to have a variety of formative assessments to “monitor learning
throughout the learning process and summative assessments that serve as checkpoints of learning
at the end of a learning cycle” (Ricketts, 2010, p. 48).
Validity and Reliability of Formative Assessments. In order to guide teachers in
creating assessments that are aligned to the standards, it is important to consider whether or not
the teacher-made assessments are valid and reliable. Do the assessments created by teachers
measure the skills and knowledge intended, and do they yield similar results each time they are
administered? A case study involving 42 physics teachers in Kenya was conducted to examine
validity and reliability of teacher-made assessments. The researchers interviewed the 42
educators, collected and analyzed sample assessments that they had given for validity and
reliability. The findings of the case study showed that the experience of the teachers, education

ARE TEACHERS’ FORMATIVE ASSESSMENTS RELIABLE?
37
level and training on test construction and analysis influenced the validity and reliability of the
tests (Kinyua & Okunya, 2014).
Kastberg (2003) also found that teachers can use Bloom’s taxonomy as a framework for
assessment construction to align test items to the curriculum that is taught. Bloom’s taxonomy
considers the level of cognitive demand that is necessary for a student to complete a task ranging
from the lower knowledge and comprehension levels that require simple recall, to being able to
apply the knowledge learned, analyze its components, synthesize the information to create new
ideas, and then evaluate the content to make judgments about what is learned. Additional
research has shown that training teachers to carefully consider the depth of knowledge of
assessment tasks and items greatly improves the validity and reliability of the tests that they
make (McMillan, 2005).
Another framework for determining the level of cognition required to answer an
assessment item or complete an assessment task is Norman Webb’s Depth of Knowledge (DOK)
Levels. Webb’s framework model was created to increase the “cognitive complexity and demand
of standardized assessments” (Francis, 2016, p. 10). There are four DOK levels that
progressively increase in the amount of required cognitive demand. They include: DOK Level 1
– Recall and Reproduction (recall of facts or procedures), DOK Level 2 – Skills and Concepts
(Use information or conceptual knowledge), DOK Level 3 – Short-term Strategic Thinking
(requires reasoning or developing a plan), and DOK Level 4 – Extended Thinking (requires
making connections and complex reasoning; Oregon State, n.d.). The assessments guides for the
Georgia Milestones show the DOK Level that each standard is aligned to and provides sample
items (GADOE, 2014).

ARE TEACHERS’ FORMATIVE ASSESSMENTS RELIABLE?
38
Subjectivity in Teacher Grading. Another theme that must be addressed in this study is
the impact that subjectivity plays in teacher grades. O’Malley (2017) states that the disparity in
classroom grades and standardized tests may come from the fact that teachers use a plethora of
formative assessment measures to contrive the final classroom grade. These measures could
include quizzes, tests, homework, class participation, projects, group assignments and even
behavior. Another factor to consider is that each teacher weighs these components differently
which leads to even more variability. Cliffordson and Thorsen (2012) suggest that grades are
multidimensional in nature and encapsulate criterion-based skills and knowledge, but they also
reflect subjective measures that may distort their meaning.
However, with the introduction of Common Core standards, there has been a push by
some educators to move to more objective measures of grading through a standards-based
grading system/report card, but this has come with opposition. When a group of parents in a
Chicago middle school was introduced to their new standards-based grading system, the school
district received strong opposition. One parent called the standards-based grading system “an
unmitigated disaster” (Krishnamurthy, 2014, p. 5). The reasons for opposition included the fact
that even though ratings were based on students learning key concepts and skills, no one had a
clear idea of what “mastery” entailed. Parents had very little understanding of the 1-4 rating
system.
Therefore, other researchers have proposed that there should be a level of consistency and
inter-rater reliability within standards-based grading (Munoz & Guskey, 2015). Professional
learning should be provided to teachers and parents that help them to understand the indicators
that show whether or not their student has mastered the standard at the appropriate level of
complexity. This type of work should be required as part of any standards-based grading system.

ARE TEACHERS’ FORMATIVE ASSESSMENTS RELIABLE?
39
Determining the Meaning of Proficiency. In order to compare the results of student’s
grades and standardized test performance levels, all stakeholders must have a clear
understanding of the meaning of proficiency. The state of Georgia has provided Achievement
Level Descriptors (ALD) that will aid in this process. The theory behind achievement level
descriptors is that students may be able to show some knowledge of the content within a
particular standard, but may not be able to perform at the level of complexity or the DOK level
for which the standard is aligned. Therefore, Georgia and other states have created achievement
level descriptors which provide more meaning to the scale score achievement levels.
Achievement level descriptors should provide stakeholders the ability to make credible
inferences about a student’s knowledge and mastery of the standards (Schneider et al., 2013).
The Georgia Department of Education (2015) has four achievement level descriptors (i.e.
Beginning, Developing, Proficient, and Distinguished). Furthermore, each achievement level
descriptor is illuminated with a specific description of what students on a particular level should
be able to know and do with regard to each standard tested. For example, in order to score at the
Proficient level for the fifth grade numbers and base ten standards, the achievement level
descriptors state that students should be able to “recognize the directional characteristics of place
value; read, write, and compare decimals to thousandths; multiply and divide multi-digit
numbers; add, subtract, multiply, and divide decimals; and use whole number exponents to
denote powers of ten” (GADOE, 2015, p. 3). A distinct description for each of the other three
achievement levels is written so that stakeholder can understand what the ratings say that
students should know and be able to do.

ARE TEACHERS’ FORMATIVE ASSESSMENTS RELIABLE?
40
Empirical Studies Regarding Formative Assessments vs. Summative Assessments
Predictors of Success
Research conducted by Warne et al. (2014) showed that high school grade point averages
derived from formative assessments along with SAT scores were a good predictor of success for
college freshman. Both the students’ GPA and SAT score had a predictive power of (R2 = .43)
regarding a student’s future success in college (Warne et al., 2014).
Weighted GPAs Leading to Grade Inflation
However, this same case study reported that subjective measures in formative
assessments, like the various methods for weighting GPAs led to variation in predictions. The
example given in the study showed that some students received more weight for Advanced
Placement (AP) classes. Students receiving an A in an AP class would get 5 points instead of the
normal 4 points (a 25% inflation), and students receiving a B in an AP class would get 4 points
instead of 3 points (a 33% inflation). In other words, “students who do not do as well in the class
get rewarded more than do students who earn As” in the non-AP class (Warne et al., 2014, p.
263).
Standards-Based Grading and Predictions of Mastery in Standardized Assessments
In 2015, Pollio and Hochbein, published a report comparing the results of standards-
based grading and standardized test scores in high schools. In the report, the researchers made a
concession that although grades and standardized scores play a critical role in assessing students,
“grades have lacked a uniform or standard meaning” (Pollio & Hochbein, 2015, p. 2). The report
states that part of the discrepancy is due to the fact that teachers assess students in a variety of
ways that are not properly aligned with achievement in a particular content area.

ARE TEACHERS’ FORMATIVE ASSESSMENTS RELIABLE?
41
Consequently, these same researchers conducted experimental research in which a group
of Algebra 2 students received an intervention that involved standards-based grading to assess
students’ proficiency levels in the course. After the intervention, it was found that using
standards-based grading doubled the number of students “earning an A or B in a course and
passing the state test” (Pollio & Hochbein, 2015, p. 1). The conclusion drawn is that “standards-
based grading practices identified more predictive and valid assessment of at-risk students’
attainment of subject knowledge” (p. 1).
Sources of Grading Variability
Leaders in the field of assessment, including Susan Brookhart and Thomas R. Guskey,
published research in 2016 called “A Century of Grading Research: Meaning and Value in the
Most Common Educational Measure” (Brookhart et al., 2016). In this research, they conducted
literature searches to identify sources of variability in grading. Some of the reasons for
variability in grading include:
• Variation in the letter grades that teachers allocate to student work
• The teacher’s inability to distinguish between “degrees of merit”
• Lack of consistency in values that various teachers placed upon elements in an
assignment.
• Lack of consistency in standards on the school and district level (Brookhart et al.,
2016).
Measures of Educational Outcomes
Brandy Ellison (2009) reported case study research that showed that grades were a
suitable supplement to standardized assessment when measuring student outcomes. The
researcher proposed that they be used in conjunction with one another because they measure

ARE TEACHERS’ FORMATIVE ASSESSMENTS RELIABLE?
42
different things. Grades add to an understanding of students’ behaviors and achievements—
something that standardized assessments are unable to do. This study used qualitative and
quantitative measures to try to show a predictive relationship between end-of-course grades and
the state of Virginia’s standardized assessment. Findings showed that none of the end-of-course
grades were 100% predictors of students’ performance on the state’s exam (Ellison, 2011).
Although some subgroups showed a stronger relationship between the two types of assessments.
This researcher also concluded that there is a need for educators to be surveyed to establish what
non-achievement variables are considered to determine students’ end-of-course grades. This
research will help form an understanding of the extent to which variables are used that are not
contained within the gradebook but which do influence the assigned end-of-course grades
(Ellison, 2011).
Synthesis
The review of the current literature regarding the disparity between classroom grades and
standardized test score proficiency levels establishes several themes. Several studies have been
conducted that emphasize the disparity between formative assessment grading and summative
standardized tests. These studies have been limited to research of college and high school level
students. This study will add to the body of research regarding alignment of end-of-grade
standardized assessments and the grades assigned to students in elementary courses.
With regards to validity and reliability, the literature review also showed that educators
must be coached and receive job-embedded professional learning opportunities in selecting
assessment items that are aligned to the standards at the appropriate level of complexity.
Standard #5 of the Georgia Teacher Leadership Standards is devoted to ensuring that teachers are
guided in selecting appropriate assessment instruments to monitor student progress towards
ARE TEACHERS’ FORMATIVE ASSESSMENTS RELIABLE?
43
mastery of grade-level standards (GACE, 2014). Also, there is a level of subjectivity that must
be addressed with teacher-assigned classroom grades. Variables such as participation and effort
cannot be consistently measured and are not related to the standards. Additionally, teachers must
use tools provided by the state when constructing assessments to help provide meaning to the
various proficiency levels so that clear inferences are made about what students are able to do
when examining the student work.
Connection to Teacher Leadership/Recommended Actions
A great disparity between classroom grades and a student’s standardized test proficiency
level is a sure indicator of a lack of alignment in the formative assessment system practiced in
the schools. Teachers must be guided in unpacking the standards to ensure that they understand
the skills and knowledge that should be mastered by the students before instructing them.
Unpacking the standards should not be done in isolation but should take place through
collaborative conversations with educators to identify the depth of knowledge required from the
standards, thus making planning for instruction more thoughtful, purposeful and accurate. When
creating assessments, educators should be coached and work collaboratively with others to
clarify assessment requirements and then create exemplars that show what students should be
able to do to demonstrate mastery of the given standard (Alonzo, Mihirrahi, & Davison, 2018).
Using assessment measures/items not appropriately aligned to the standard may produce a false
perception of what students are able to do.
Impact on the Field of Teacher Leadership
It is this researcher’s desire to use the information gained from this study to share with
instructional coaches the need to create better assessments for students that are aligned at the
appropriate level of complexity. Hopefully, this information will be the catalyst to guide the

ARE TEACHERS’ FORMATIVE ASSESSMENTS RELIABLE?
44
work of professional learning communities and influence job-embedded professional learning.
Teachers should be coached and guided in understanding the meaning of the standard,
identifying the Depth of Knowledge that is required, determining the best way to measure
mastery of the standard, and creating exemplars for students in order to provide the most
appropriate feedback to improve teaching and learning.

ARE TEACHERS’ FORMATIVE ASSESSMENTS RELIABLE?
45
Chapter 3: Research Methodology
The purpose of this study was to: (a) establish if there is a disparity between the results of
formative and summative assessments that teachers administer to students in elementary schools
and (b) identify potential causes for the difference in results of these two types of assessments.
In elementary schools in Georgia, students participate in a comprehensive summative assessment
program called the Georgia Milestones that measures how well students have mastered the
knowledge and skills delineated in the state’s adopted mathematics curriculum, the Georgia
Standards of Excellence (GaDOE, 2015). The Georgia Milestones (GMAS) is a summative
assessment that is administered at the end of the grade; however, students in grades 3–5 are
assessed throughout the school year by individual classroom teachers that create formative
assessments based upon this same curriculum—the Georgia Standards of Excellence (GSE)—
and then assign grades on student report cards based upon the formative assessments that they
have created. The goal of this study was to determine if the results from teacher-created and/or
selected formative assessments are reliable indicators of how students will perform on a
summative assessment that measures the same curriculum.
Research Questions
This study was designed to answer the following research questions:
1. What is the relationship between students’ math grades and their standardized test score?
2. What are teachers’ perceptions regarding the uses of standardized test scores in
improving instructional decisions?
3. How well do teachers’ formative assessments align with the rigor of the standardized
assessment?

ARE TEACHERS’ FORMATIVE ASSESSMENTS RELIABLE?
46
Justification of the Research Design Selected
A mixed-methods research design was conducted to explore the relationship between
formative and summative assessments within a standards-based curriculum. In this case,
quantitative and qualitative measures were used to provide a more comprehensive outlook than
that of using qualitative or quantitative methods alone (Creswell, 2013). Although more time-
consuming, Ahmed et al. (2016) assert that mixed-methods research (MMR) offers several
benefits:
• MMR is used to answer a broader range of research questions.
• MMR generates a more thorough knowledge required to inform theory and practice.
• MMR produces strong evidence for conclusions.
• MMR increases the ability to generalize the results, and
• MMR counteracts the weaknesses of one method in order to strengthen both.
Additionally, the research questions proposed in this study required a mixed-methods approach
because they could not be answered by quantitative or qualitative measures alone.
The type of mixed-methods study that was proposed for this research is an explanatory
design method. The explanatory research design is a two-phase method in which numerical data
is obtained and then narrative data is collected in an attempt to explain the numerical data
(Creswell, 2009). In explanatory research, the study is conducted to try to explain, rather than
describe, the phenomenon studied (Given, 2008). The review of the literature revealed that there
is discrepancy between the scores that high school students achieve on standardized assessments
and the grades that they receive on their report cards for the same content area (O’Malley, 2017).
This researcher sought to shape an understanding of this phenomenon by extending the research
to elementary school students using descriptive, numerical data, and then attempted to uncover

ARE TEACHERS’ FORMATIVE ASSESSMENTS RELIABLE?
47
root causes through teacher perception data and a qualitative examination of how well teachers
align their formative assessments to the summative assessment given.
Rationale for Implementing a Case Study
A case study was the research design used to explore this topic. Case studies are used to
answer “how” and “why” questions within certain real-life parameters (Klein, 2012). A case
study allows the researcher to examine a problem/phenomenon “in order to extrapolate key
themes and results that help predict future trends, illuminate previously hidden issues that can be
applied to practice, and/or provide a means for understanding an important research problem
with greater clarity” (Monitoring and Evaluation Toolkit, 2019, p. 4).
Yin (2018) suggests three important features of case studies before determining if it is the
most important method to use to conduct research. First, Yin asserts that case study research
must require the researcher to explore the phenomenon by asking how and why questions. In
this study, the researcher explored how well students’ proficiency levels on the mathematics
Georgia Milestones assessment were correlated to the grades that they received on their report
cards for the same content and why there may have been a discrepancy between a student’s
grades and standardized test proficiency levels. Next, Yin states that case study research is
appropriate when the researcher has very little or no control over the phenomenon being studied.
This researcher is an employee in the school district being studied. However, she has had no
impact on students’ grades or performance on standardized assessments within the 41 schools
included in the study. Finally, case study research is appropriate when the event being studied is
an experience within a real-world context. Thousands of young people each year are engaged in
formative and summative assessment systems as part of the instructional cycle and accountability
systems. It would be helpful to determine if there is a relationship between these two types of

ARE TEACHERS’ FORMATIVE ASSESSMENTS RELIABLE?
48
assessments within the same curricular parameters. If a relationship is found, this information
could be used to make instructional decisions and contribute to the meaning of what being a
“Proficient” or “Honor Roll” student means. Therefore, this study met the criteria of a case
study as proposed by Yin by satisfying the three given qualifications.
Worldview of the Researcher
Additionally, this type of research design was chosen because of the ideals of this
researcher. This researcher was interested in using a dual approach to this study combining
principles of transformative inquiry and positivism. A dual approach was taken because of the
researcher’s desire to understand how things work as it relates to the relationship between
formative and summative assessments (positivism), while seeking to become a change agent and
improve the formative assessment practices of some educators (transformative).
First of all, the positivist approach to this research sought to understand how there may be
a discrepancy between a student’s performance on formative and summative assessments when
they are aligned to the same content standards. Positivism relies on the use of scientific evidence
through experimental action research and statistics to reveal how society truly operates
(Positivism in Sociology: Definition, Theory & Examples, 2015). As a positivist researcher, the
goal was to describe the phenomenon and to rely on what can be observed and measured in the
evidence (Trochim, 2020). This positivist view of the world required a triangulation of data
using multiple measures and observations to get a clear understanding of what is happening in
the real world (Trochim, 2020). First the researcher used statistical methods to compare grades
and test scores. Then this researcher interviewed teachers to find out their individual perspective
on the value of the summative assessment system and its impact to their formative assessment
practices in the classroom. Finally, the positivist approach required this researcher to gather data

ARE TEACHERS’ FORMATIVE ASSESSMENTS RELIABLE?
49
by observing formative assessment practices of teachers and analyzing the formative assessments
that they use in the classroom to see how well aligned they are to what is assessed in the
summative assessment system.
Additionally, this research project was transformative in nature because the researcher
pursued bringing to light the possible issue of the disparity between classroom grades derived
from formative assessments and standardized test proficiency levels and worked with educators
to make a change in their practice. Prior studies have concurred that there can be a disparity
between the grades that students achieve in school and the performance level rating that they
receive on standardized tests that supposedly assess the same content (Boykin, 2010). Therefore,
this researcher worked with educators as “active collaborators” in this inquiry process to
encourage participatory action and reform of grading practices (Creswell, 2013, p. 25).
Finally, the goal of this research project was to bring to light issues regarding the possible
disparity between grading and standardized test scores while proposing practical changes that
educators can take to decrease the disparity. Seeking reform in grading practices to become
better aligned with the results of end-of-grade tests was what made this research transformative
in nature. It is a call for radical change in educational practice (National Science Foundation,
2007).
Context of the Study
Phase One focused on Research Question 1: What is the relationship between students’
math grades and their performance level on the Georgia Milestones mathematics assessment?
The goal of the first phase was to determine if there is indeed a discrepancy between the
students’ performance on standardized summative assessments and their performance on
formative assessments of the same curriculum. Phase One employed quantitative research

ARE TEACHERS’ FORMATIVE ASSESSMENTS RELIABLE?
50
methods using a descriptive/inferential statistical design to identity whether or not a correlation
exists between formative and summative assessments administered to elementary school students
in Georgia.
Phase Two of this case study focused on answering two research questions: What are
teachers’ perceptions regarding the uses of standardized test scores in improving instructional
decisions, and how well do teachers’ formative assessments align to the rigor of the Georgia
Milestones mathematics assessments at the appropriate level of complexity? The goal of this
phase was to gather information to infer why there may have been a difference in how students
perform on formative and summative assessments that measure the same curriculum standards.
Information gathered in this phase of the study incorporated a mixed-methods design that
included perception surveys from classroom teachers (quantitative analysis), observations of
teachers’ formative assessment practices (qualitative analysis) and an examination of the rigor
and standards-based alignment of formative assessments created by classroom teachers
(qualitative analysis).
Population and Sampling Procedures
This first phase of the case study was conducted within an urban school district in
Georgia. This school district served a total of 31,494 students in its 59 elementary schools.
Sixteen thousand, ninety (16,090) of those students attended its 35 traditional elementary schools
(i.e. non-charter or partner schools). However, the data gathered for this study was limited to a
sample size of 2,471 fifth grade students in its 35 traditional Title I elementary schools. These 35
Title I elementary schools received additional federal funds because their students come from
low income families with at least 95% of their student population receiving free or reduced price
lunch.

ARE TEACHERS’ FORMATIVE ASSESSMENTS RELIABLE?
51
The rationale for this limitation included the need to focus on results of schools similar in
demographics to that of the school selected for Phase Two of the study which is a Title I school.
These 35 Title I schools are similar in that they receive additional government-allocated funds to
aid them in their quest to meet state standards. These additional funds are used to keep the
student/teacher ratio relatively low, provide school-wide intervention programs, and deliver
additional educational resources. Title I funds can also be used for non-educational supports for
students such as parental engagement, behavior initiatives and attendance support (Kajeet, 2020,
p. 9). The funds provided to these 35 Title I schools are in response to a mandate provided in the
Every Student Succeeds Act signed into law by President Barack Obama in 2015 (U. S.
Department of Education, 2015). Because these additional provisions were not provided to
every school in the district, it was determined to focus on the results of the schools that received
these added supports to achieve academic gains. The demographic information for students in
the district’s traditional Title I Schools is found in Table 1. The rationale for including the
demographics for the district’s traditional Title I schools is to provide more context to the
interpretation of this data and to show that these schools primarily serve minority, economically-
disadvantaged students which mirrors the sample of students used in Phase 2 of this case study.
Table 1
Demographics for students in Traditional Title I Schools (Georgia Urban District)
Subgroup N Percentage
Asian/Pacific Islander 161 1.0%
American Indian/Alaskan 48 0.3%
Black 14,143 87.9%
Hispanic 1,191 7.4%
Multi-racial 225 1.4%
White 531 3.3%
Economically Disadvantaged 15,704 97.6%
English Language Learners 917 5.7%
Students with Disabilities 2,124 13.2%

ARE TEACHERS’ FORMATIVE ASSESSMENTS RELIABLE?
52
Phase Two of the study was dependent upon data gathered from a mid-sized elementary
school within this urban district that will be referred to as Oak Hill Elementary (a pseudonym).
Oak Hill Elementary was a Title I school that served 425 students in grades Pre-Kindergarten to
Fifth grade. All of Oak Hill’s students received free or reduced priced lunch, but 72% of its
students were directly certified as economically disadvantaged which satisfies at least one of the
following criteria:
• The student came from a family that received Supplemental Nutrition Assistance
Program (SNAP) food stamp benefits.
• The student came from a family that received Temporary Assistance for Needy
Families (TANF) benefits, or
• The student came from a family that had been identified as homeless, foster, or
migrant (Georgia School Reports, n.d.).
In addition to its poverty index, Oak Hill’s student population was 99.7% non-white with
African-Americans (almost 85%) as the most prevalent subgroup of the population and
Hispanics (15%) as the second highest subgroup.
Additionally, Oak Hill’s faculty and staff population was even less diverse with African-
Americans as the most dominant subgroup. Phase Two of this study gathered information from
members of this staff in grades 3-5 whose students were tested using the Georgia Milestones
summative assessment system. All participants asked to participate in the perception survey for
this study had varying years of experience (see Table 2). Also, formative assessments were
gathered from seven of the participants for analysis within small discussion groups, and
additional data regarding teachers’ formative assessment practices were gathered through
classroom observations.

ARE TEACHERS’ FORMATIVE ASSESSMENTS RELIABLE?
53
Table 2
The Perception Survey Participant Information
Participant
Pseudonym
Grade Approximate
Age
Race Gender Years of
Experience
Subjects
Taught Dana 3rd Grade Late 20s African-American Female 6 All Subjects
Vivian 3rd Grade Mid 40s African-American Female 23 All Subjects
Saul 3rd Grade Late 40s African-American Male 22 Math & Science
Rachael 4th Grade Mid 50s African-American Female 25 Mathematics
Bethany 4th Grade Early 30s African-American Female 10 Math (SWD)
Kelly 5th Grade Late 40s African-American Female 15 Mathematics
Barbara 5th Grade Early 50s African-American Female 24 Math (SWD)
Access and Permission
Access and permission were obtained from Oak Hill’s school principal to survey
members of the staff, observe and provide feedback to teachers regarding formative assessment
practices, and work with teachers to analyze teacher-created/selected formative assessments for
alignment to the standard at the appropriate level of complexity. Once permission for the study
had been obtained by the principal and the school district, purposeful sampling was used to
obtain teacher participants. Purposeful sampling and criterion sampling were desirable for this
process because the participants should have had an understanding of the phenomenon and the
research problem being investigated (Creswell, 2013). In this case, all of the third–fifth grade
teachers at Oak Hill Elementary had students that participated in the state’s summative
assessment system and created formative assessments for grading purposes thereby meeting the
criteria for participation.
Therefore, all prospective teacher participants were invited to a focus group meeting to
give an explicit overview of the study including a statement of the problem, the research
questions that were investigated, and the research design that was used. Prospective participants
were assured of anonymity–no records of students’ or teachers’ names, identification numbers or
ARE TEACHERS’ FORMATIVE ASSESSMENTS RELIABLE?
54
individual assessment data/grades will be divulged at any time. Pseudonyms were used to
reference information gathered from individual teachers to ensure full confidentiality. Finally,
teachers signed a consent form acknowledging agreement to participate in the study (see
Appendix A).
Data Collection and Analysis
Phase One
Phase One of the study was conducted to answer the question: What is the relationship
between a student’s math grades and his/her performance level on the Georgia Milestones
mathematics assessment? Analyses were first conducted in order to answer the research
question. The responses were compared via statistical significance tests. When warranted by
evidence of statistical significance, effect sizes were estimated.
In Phase One, archived Georgia Milestones fifth grade math averages were collected
from the 2019 testing administration of the 35 Title I traditional schools in the chosen urban
school district in Georgia. The data gathered included the percentage of fifth grade students
scoring in each of the four proficiency levels (i.e. Beginning, Developing, Proficient and
Distinguished). Additionally, fourth quarter math grades were retrieved via the district’s student
information database. The fourth quarter math grades were cumulative grades representing the
average for the entire school year. This data set included the percentage of fifth graders from
each of the 35 schools that received an A, B, C, or F as a fourth quarter report card grade. The
percentage attained for each performance level was described as Level 1, 2, 3, or 4 using the
coding system and criteria used to compare grades and test scores shown in Figure 2 below.
Descriptive statistics were used to analyze this data by creating graphical/pictorial models of the
distribution of GMAS scores and grades at each school (see Figure 3).

ARE TEACHERS’ FORMATIVE ASSESSMENTS RELIABLE?
55
Figure 2. Comparison Criteria.
Figure 3. Sample School Graph.
•Grade: F
•Test Score: Beginning
•Failure to Achieve Grade Level StandardsLevel 1•Grade: C
•Test Score: Developing
•Average Achievement of Grade Level StandardsLevel 2•Grade: B
•Test Score: Proficient
•Above Average Achievement of Grade Level StandardsLevel 3•Grade: A
•Test Score: Distinguished
•Superior Achievement of Grade Level StandardsLevel 4
Test Scores
Grades
0%
20%
40%
60%
80%
100%
Distinguished/A Proficient/B Developing/C Beginning/F
0%11%
34%
55%21%
34%42%
3%
School 1
2019 - 5th Grade Mathematics
Comparison of Test Scores and Grades
Test Scores Grades

ARE TEACHERS’ FORMATIVE ASSESSMENTS RELIABLE?
56
Rationale for the Comparison Used in This Study. In the state of Georgia, the Georgia
Promotion, Placement, and Retention law (O.C.G.A. §§ 20-2-282 through 20-2-285) and State
Board of Education Rule (160-4-2-.11) of 2014 state that fifth graders must “achieve grade level
on the state-adopted assessments in reading and mathematics and meet promotion standards and
criteria established by the local board of education for the school that the student attends”
(Georgia Department of Education, 2015, p. 2). Furthermore, the Frequently Asked Questions
document on this rule states that if a fifth grade student does not achieve a level of Developing,
Proficient or Distinguished on the mathematics section of GMAS then “the child is automatically
retained” (Georgia Department of Education, 2015, p. 2). Hence, the comparison guidelines
shown in Figure 4 were established for use in this research study. The GMAS Beginning
achievement level and an F grade average both denote that a student has not attained grade level
standards.
The Chi-Square Analysis. The next part of Phase One was to conduct further analysis
from a sample of this population. Individual GMAS scores and fourth quarter math grades from
third-fifth grade students at Oak Hill Elementary School were analyzed to see if an inference
could be made regarding the relationship between GMAS scores and report card grades. The
grades from fourth quarter were cumulative grades for the entire year. Therefore, the fourth
quarter grades and GMAS scores both represented an evaluation of the entire curriculum.
Analyses was first conducted in order to answer the research question. Due to the small sample
size, the responses were compared via statistical significance tests. When warranted by evidence
of statistical significance, effect sizes were estimated.
A Chi-Square goodness of fit test was conducted in order to determine how likely it is
that the distribution of mean standardized math scores (achievement levels) and mean grades

ARE TEACHERS’ FORMATIVE ASSESSMENTS RELIABLE?
57
from formative assessments was due to chance. In this case, the assumption that was made was
that a student’s grades and test scores were not related or independent of each other. Therefore,
the null hypothesis of this statistical test proposed that a relationship did not exist between these
two variables; they are independent on one another. The following null and alternative
hypotheses will be used for this study:
H0 – An elementary student’s math proficiency level on the Georgia Milestones
assessment is independent of the fourth quarter math report card grade.
H1 – An elementary student’s math proficiency level on the Georgia Milestones
assessment is not independent of the fourth quarter math report card grade.
SPSS was used to conduct the Pearson Chi-Square Test of Independence. The = 0.05
with a 95% confidence interval. The two categorical variables were “GMAS Proficiency Level”
and “Grade.” Within each category, there were four groups as described in the contingency table
below (see Table 3).
Table 3
Contingency Table between Proficiency Level and Grade
Level Distinguished Proficient Developing Beginning
Grade A B C F
Phase Two
Phase Two of the study was conducted to answer the remaining research questions: 2)
What are teachers’ perceptions regarding the uses of standardized test scores in improving
instructional decisions, and 3) how well do teachers’ formative assessments align to the rigor of
the Georgia Milestones mathematics assessments at the appropriate level of complexity? In
Phase Two, the researcher gathered data from a variety of sources (i.e. surveys, teacher-
created/selected formative assessments, and classroom observations) for a period of eight weeks.

ARE TEACHERS’ FORMATIVE ASSESSMENTS RELIABLE?
58
This period of data collection and the multiple sources used allowed the researcher to triangulate
the data (Clancy, 2001) and add validity to the findings that emerged through recurrent behaviors
and practices (Lundberg, 2003). The instruments and methods that were used to collect data for
this phase are described below.
Initial Focus Group. As a precursor to collecting data through other methods, an initial
focus group was convened with prospective study participants to make them aware of the goals
of the study, the data that was collected, and the time/level of commitment involved. During this
time, the researcher shared several topics that should always be addressed before initiating a
research case study such as the researcher’s motives/intentions, the care that was taken to protect
the anonymity of all stakeholders involved through the use of pseudonyms, logistical concerns
regarding time, artifacts used, the number of classroom observations/feedback sessions, and the
option to be removed from the study at any time (Resnik, 2011).
Surveys. To gain information about the perceptions of teachers with regards to the
impact of formative assessment practices on summative assessments, approximately 60 teachers
from the participating urban school district were surveyed. Several questions from the “Teacher
Survey on the Impact of State-Mandated Testing Programs” created by Boston College’s
National Board on Educational Testing and Public Policy were used (Pedulla, 2003).
The survey that was used was part of a two-year national study throughout 47 states of
public school educators in grades 2–12. There was a sample size of about 12,000 teachers, and
35% (4,200 teachers) responded to the mail survey (Pedulla, 2003). The goal of this previous
study was to examine how state-wide testing programs impact teachers and their instruction in
classrooms. The survey has several dimensions that examine teacher perspectives on state-wide
testing programs. However, the survey questions that were used in this study examined the
ARE TEACHERS’ FORMATIVE ASSESSMENTS RELIABLE?
59
following areas: 1) teachers’ perceived value of the state test, 2) the alignment of classroom
practices with the state test, and 3) the impact on the content and mode of instruction/amount of
instructional time. With regards to validity, these survey questions measured exactly what was
intended in this study and were used to answer Research Question 2: What are teachers’
perceptions regarding the uses of standardized test scores in improving instructional decisions?
Also, with regards to reliability, the Cronbach’s alpha measure of internal consistency for the
survey dimension that was used is .73 (Pedulla et al., 2003) which implied good internal
consistency.
The survey was uploaded to a Google Form and the data was analyzed to show trends in
teachers’ beliefs and practices regarding formative and summative assessments and were used to
answer the second research question regarding teacher perceptions of how state-mandated testing
impacts classroom practices. Additional questions from the survey that will be used to answer
Research Question 2 can be found in Part 3 of Appendix C.
Analysis of the survey data included a descriptive report of aggregate responses to the
questionnaire (Cresswell, 2013). The researcher placed participant responses in a table to show
the distribution of responses for each question in the survey and created graphs to analyze the
data. The researcher noted patterns in responses and variation in results in order to make data-
driven inferences. Next, a summary of findings was constructed to include trends in teacher
perceptions in order to answer the second research question.
Classroom Observations. Seven classroom teachers whose students were tested using
the Georgia Milestones Assessment System were observed three times each over the 8-week
period. The purpose of these classroom observations was to determine trends in formative
assessment practices used by these teachers. This trend data helped answer questions about the

ARE TEACHERS’ FORMATIVE ASSESSMENTS RELIABLE?
60
how well teacher-created/selected formative assessments were aligned to the summative
assessment (GMAS) at the appropriate level of complexity.
All seven of these teachers were required to align their lessons and assessments with the
Georgia Standards of Excellence–the same curriculum measured by the Georgia Milestones. The
observation instrument that was used is the Formative Assessment Rubrics, Reflection and
Observation Tools to Support Professional Reflection on Practice (Wylie & Lyon, 2013). This
tool was created by an initiative of the Council of Chief State School Officers (CCSSO). This
collaborative is called FAST (Formative Assessment for Students and Teachers) whose mission is
to advance the implementation of formative assessments in each of its member states (CCSSO
Collaborative, n.d.). A copy of the observation form is in Appendix B.
The FARROP (Wylie & Lyon, 2013) was used to gather data on six of the ten dimensions
of formative assessment practices of teachers and has a rubric for each of the dimensions:
• Learning Goals – This dimension focuses on how well the teacher aligns
learning goals to the Georgia Standards of Excellence (GSE) and communicates
those goals to students.
• Criteria for Success – This dimension investigates how well students understand
what quality work looks like in relationship to the GSE standard.
• Tasks and Activities to Elicit Evidence of Learning – This dimension focuses on
evidence of student learning and mastery of GSE standards produced by students
during the lesson.
• Feedback Loops During Questioning – This dimension focuses on how well the
teacher provides ongoing feedback regarding student mastery of the standards
during the lesson.

ARE TEACHERS’ FORMATIVE ASSESSMENTS RELIABLE?
61
• Descriptive Feedback – This dimension focuses on the teacher’s role in
providing individualized feedback to students with regards to the success criteria
established.
• Use of Evidence to Inform Instruction – This dimension focuses on how
formative assessment is used to adjust instruction as needed to improve students’
mastery of the standards.
Analysis of these classroom observations included quantitative and qualitative measures.
First, a descriptive summary of each observation will be made. Each dimension of the
observation instrument required scores from the FARROP rubric (i.e. 1 – Beginning; 2 –
Developing; 3 – Progressing; 4 – Extending). This numerical information was analyzed and
described. Next, the notes from the observation instruments were organized in a table and the
data was coded, themes highlighted and patterns in teacher practices described (Merriam, 2009).
Post-Observation Discussions. As part of the protocol in using the FARROP, the
researcher was required to conduct a post-observation discussion with the teachers. The goal of
this discussion was to collect further evidence that supported inferences made about a particular
teacher’s formative assessment practices and their alignment with the Georgia Standards of
Excellence and the Georgia Milestones. Post-observation questions included:
• What was the learning goal(s) for the lesson? Did students achieve that goal?
How do you know?
• What evidence of student learning was collected? What is the next step?
• Using the Georgia Milestones Achievement Level Descriptors, how well-aligned
is your lesson to the intent of the standard?

ARE TEACHERS’ FORMATIVE ASSESSMENTS RELIABLE?
62
Information collected during the observation and post-observation discussion followed a similar
pattern for analysis: 1) organizing the data in a table; 2) coding the data by key words, actions,
and themes; and 3) interpreting the data coded to discover trends in teacher formative assessment
practices in order to infer how well they align to the state’s curriculum at the appropriate level of
complexity. Table 4 provides the study’s timeline.
Table 4
Case Study Timeline
Case Study Timeline Week of
January 13, 2020 • Use Descriptive Statistics to Compare Fifth Grade Students’ 2019 Standardized Test
Performance and Fourth Quarter Mathematics Grades from the 35 Title I Schools
Week of
January 20, 2020 • Use Statistical Tests to Compare Fifth Grade Students’ 2019 Standardized Test
Performance and Fourth Quarter Mathematics Grades from Oak Hill Elementary
School
Week of
January 27, 2020 • Conduct Initial Focus Group Meeting; Provide Overview of the Study; Secure
Participant Consent Week of
February 3, 2020 • Conduct FAST Observation #1 for the 7 Participating Teachers
• Debrief FAST Observation with the 7 Participating Teachers
Week of
February 10, 2020 • Conduct PLC with Third grade participating teachers
• Collect one CR quiz, exit ticket and homework assignment from each teacher and
identify the standard for each
• Work with the teachers to rate their formative assessment artifacts based upon the
Achievement Level Descriptors for that Standard.
Week of
February 17, 2020 • Conduct FAST Observation #2 for the 7 Participating Teachers and debrief
Week of
February 24, 2020 • Conduct PLC with Fourth grade participating teachers
• Collect one CR quiz, exit ticket and homework assignment from each teacher and
identify the standard for each
• Work with the teachers to rate their formative assessment artifacts based upon the
Achievement Level Descriptors for that Standard.
Week of
March 2, 2020 • Conduct FAST Observation #3 for the 7 Participating Teachers
• Debrief FAST Observation with the 7 Participating Teachers
Week of
March 9, 2020 • Conduct PLC with Fifth grade participating teachers
• Collect one CR quiz, exit ticket and homework assignment from each teacher and
identify the standard for each
• Work with the teachers to rate their formative assessment artifacts based upon the
Achievement Level Descriptors for that Standard.
Week of
March 16, 2020 • Organize Data into a table
• Code Data by Keywords, Actions, and Themes
Week of
March 23, 2020 • Interpret Data Coded by Trends to Discover Trends in Teacher Formative Assessment
Practices
• Make Inferences and Draw Conclusions
Artifacts. In addition to observing teachers’ formative assessment practices in the
classroom, the researcher collected sample teacher-created/selected formative assessments for

ARE TEACHERS’ FORMATIVE ASSESSMENTS RELIABLE?
63
analysis. Each teacher submitted one constructed response item from a quiz, one exit ticket, and
one homework assignment aligned to a particular standard that had been used for grading
purposes. The researcher then used the Georgia Milestones Achievement Level Descriptors
matrix (GADOE, 2015) to determine how well the teacher-created/selected formative
assessments align to the rigor of the Georgia Milestones mathematics assessments at the
appropriate level of complexity. For each formative assessment, the researcher used the
Achievement Level Descriptors matrix to analyze the assignment and rate it according to the four
categories:
• Beginning – This work demonstrates that student has not yet demonstrated
proficiency in the knowledge and skills necessary for the given standard and need
substantial academic support.
• Developing – This work demonstrates that student has demonstrated partial
proficiency in the knowledge and skills necessary for the given standard and need
additional academic support.
• Proficient – This work demonstrates that the student has demonstrated
proficiency in the knowledge and skills necessary for the given standard and are
prepared for the next grade level’s content.
• Distinguished – This work demonstrates that the student has advanced
proficiency in the knowledge and skills necessary for the given standard and are
well prepared for the next grade level’s content (Georgia Department of
Education, 2015).
By completing this analysis, the researcher was able to infer what percentage of the
sample teachers’ formative assessments align to the rigor of the Georgia Milestones mathematics

ARE TEACHERS’ FORMATIVE ASSESSMENTS RELIABLE?
64
assessments at the appropriate level of complexity. Analysis of the sample teachers’ formative
assessments also gave evidence if there is any variation of alignment or rigor by the type of
assignment given.
Validity of Interpretation
In order for this research to have a significant impact and effect change on teachers’
formative assessment practices, several factors were considered regarding the trustworthiness of
this research. Shenton (2004) reports several criteria that must be considered when exploring the
trustworthiness of qualitative research. The research design used in this study addressed each of
the four criteria for trustworthiness of research.
Credibility (Internal Validity)
The internal validity of a study references to what extent a study actually measures what
is intended (Shenton, 2004). The internal validity of this research study has been addressed in
several ways. First of all, the researcher collected several different types of information to
triangulate the data and better inform the inferences made in the analysis. Data used to answer
the research questions included information collected from teacher surveys, teacher-
created/selected formative assessments, classroom observations and post-observation
interviews/conferences. All of these research methods were well-established/recognized
qualitative research strategies that provided evidence for the researcher to make an inference
about how well teachers align formative assessments to match the rigor of the standards within
the summative assessment.
Another strategy to ensure internal validity was to ensure the honesty of the informants
(Shenton, 2004). All participants of the study were assured in the initial focus group meeting
that their right to anonymity will be respected which protected them from the threat of adverse

ARE TEACHERS’ FORMATIVE ASSESSMENTS RELIABLE?
65
consequences and promoted honesty. Additionally, the researcher had a good working rapport
with each of the participants and had already established their trust.
Transferability (External Validity/Generalizability)
Transferability refers to the extent to which the research findings can be applied in other
circumstances (Qualitative Designs, 2017). Background data was provided to establish a context
for the study. Although the sample size used in the quantitative analysis was relatively small,
generalizations can be made with regards to the larger population with similar characteristics
experiencing the same phenomenon (Shenton, 2004).
Dependability (Reliability)
With regards to reliability, the research design was described in great detail so that if the
processes used within the study were repeated, another researcher should be able to gain the
same results and make similar inferences. Such attention to the description of the methods used
helped to establish the research design as a “prototype model” (Shenton, 2004).
Confirmability (Objectivity)
Finally, the issue of objectivity within the research design is paramount. Inferences
drawn from the research must be free of the researcher’s biases and must be founded upon the
information collected from the participants (Shenton, 2004). In this case, the researcher was
strongly biased toward the belief that formative and summative assessment results should mirror
each other if aligned to the same standards-based curriculum. However, conclusions drawn must
be limited to only inferences made from the data collected. Objectivity was supported in this
research design through the triangulation of the data to reduce researcher bias and the initial
admission by this researcher was shared that teachers must be supported in creating formative

ARE TEACHERS’ FORMATIVE ASSESSMENTS RELIABLE?
66
assessments for students at the appropriate level of complexity in order to mirror the rigor of
their summative assessment.
Limitations and Delimitations
This research study used a case study within a mixed-methods design to try to explain a
particular phenomenon. Because the nature of a case study had a limited number of participants,
the results from this small sample had to be generalized over a large population. Access and
permission for individual student results at all 35 Title I schools within the district would provide
more data and give a clear, concise picture of the relationship between students’ summative test
scores and their formative assessment grades.
An additional limitation of the study was that there has been some debate over the ability
to compare formative assessments to summative assessments because of the varying purposes of
each. However, the school district in which the study took place was a standards-based district
which means that the curriculum was driven by the Georgia Standards of Excellence. Research
has shown that both types of assessments are essential to the educational process and in this case
are based upon the same learning goals (Ricketts, 2010). Zook (2017) also states, “Formative
assessments let students show that they’re learning, and summative assessments let them show
what they’ve learned” (p. 8).
Another limitation of the study was that the Department of Education for the state of
Georgia had not released a clear explanation of the cut scores for each proficiency level of the
Georgia Milestones assessment. The Georgia Milestones End-of-Grade Interpretive Guide for
Score Reports for Spring and Summer 2019 (EOG Interpretation Guide, 2019) described each
achievement level as:

ARE TEACHERS’ FORMATIVE ASSESSMENTS RELIABLE?
67
A range of scores that defines a specific level of student performance, as
articulated in the Achievement Level Descriptors (ALDs). . . The minimum
and maximum scale scores for the different EOG assessments differ
because the tests vary in length and their relative difficulty. (p. 8)
This means that the percentage for correct answers for each cut score had not been shared
with the public which made it difficult to compare GMAS achievement level descriptors to the
district’s grading system that states that 90%–100% is an “A” and so forth.
Therefore, a delimitation for this study was to use the following comparisons in Table 5
as a standard for comparison in this study.
Table 5
Comparison of Standardized Scores to Grades
GMAS Achievement Level Descriptors Urban School District’s Grading Scale
Distinguished Learners demonstrate advanced
proficiency in the knowledge and skills necessary at
this grade level and content area of learning, as
specified in Georgia’s content standards. The students
are well prepared for the next grade level and are well
prepared for college and career readiness.
Weighted Average of Formative Assessments
A = 90%-100%
Shall Indicate Superior Achievement of Grade
Level Standards
Proficient Learners demonstrate proficiency in the
knowledge and skills necessary at this grade level and
content area of learning, as specified in Georgia’s
content standards. The students are prepared for the
next grade level and are on track for college and career
readiness.
Weighted Average of Formative Assessments
B = 80%-89%
Shall Indicate Above Average Achievement of
Grade Level Standards
Developing Learners demonstrate partial proficiency
in the knowledge and skills necessary at this grade
level and content area of learning, as specified in
Georgia’s content standards. The students need
additional academic support to ensure success in the
next grade level and to be on track for college and
career readiness.
Weighted Average of Formative Assessments
C = 70%-79%
Shall Indicate Average Achievement of Grade
Level Standards
Beginning Learners do not yet demonstrate proficiency
in the knowledge and skills necessary at this grade
level and content area of learning, as specified in
Georgia’s content standards. The students need
substantial academic support to be prepared for the
next grade level and to be on track for college and career readiness.
Weighted Average of Formative Assessments
F = 0%-69%
Shall Indicate Failure to Achieve Grade Level
Standards

ARE TEACHERS’ FORMATIVE ASSESSMENTS RELIABLE?
68
A final limitation noted regards the potential bias of the researcher because of her
affiliation with the school district in which the case study was conducted. To counteract this
potential bias, this researcher has presented this study through a positivist approach by
triangulating data and using multiple measures before drawing conclusions. Much of the data
used to draw conclusions is included within the study itself to allow for ease of replication.
Ethical Consideration
Additionally, to ensure that this research was respected and all participants were treated
in an ethical manner, certain principles were adhered to throughout the study. First of all, the
study was conducted in a manner to minimize the risk of harm to participants. Consent was
obtained from every participant with the right to withdraw at any time. Everyone that engaged in
the study did so of their own free will without the threat of coercion or lack of anonymity
(Saunders, Kitzinger, & Kitzinger, 2015).
It was also important that participation in the study maximized the benefits for all
stakeholders. Participants in the study saw it as something that is related to their work. This
work was of interest to not only the individual teacher participants in the study but also linked to
the values and principles espoused in the school district as a whole. It was anticipated that the
school system will value the information gained through the study because the district already
tracked each teacher’s GMAS test scores and the distribution of grades for each course taught.
This researcher took great care to avoid the mistreatment, mishandling and misinterpretation of
data collected in order to show respect for all perspectives involved (i.e. student, teacher, school,
and district).
Finally, results of the study were with Oak Hill’s faculty and staff and other stakeholders
to share light on the relationship between summative and formative assessments and teachers’

ARE TEACHERS’ FORMATIVE ASSESSMENTS RELIABLE?
69
current formative assessment practices. After analysis of the data collected in the study,
recommendations were made regarding professional learning for teachers in improving formative
assessment practices. Figure 4 provides a complete overview of the research design.

ARE TEACHERS’ FORMATIVE ASSESSMENTS RELIABLE?
70
Figure 4. The Flowchart of the Research Design.
Are
Tea
cher
s’ F
orm
ativ
e A
sses
smen
t P
ract
ices
Rel
iab
le I
nd
icat
ors
of
Stu
den
ts’
Mas
tery
of
Sta
nd
ard
s?
Research Questions:
What is the relationshjp between a student's math grades and his/her standardized test score?
What are teachers' perceptions regarding the uses of standardized test scores in improving
instructional decisions?
How well do teachers' formative assessments align with the rigor of the standardized assessment at the appropriate level of
complexity?
Hypotheses:
Null Hypothesis (H0):
An elementary student’s math proficiency level on the Georgia Milestones assessment is
independent of the 4th quarter math report card grade.
Alternative Hypothesis (H1):
An elementary student’s math proficiency level on the Georgia Milestones assessment is
notrindependent of the 4th quarter math report card grade.
Methodology:
Design:
Mixed-methods design investigating the relationship between teachers' formative assessments and the Georgia Milestones
Assessment System
Qualitative Strategies:
- Classroom Observations
- Analysis of Teacher-Created Formative Assessments
Quantitative Strategies:
- Teacher Surveys
- Comparison of the distribution of the grades and standardized test scores within Title I schools
Informants:
Setting:
- Thirty-five Title I Schools in an urban public school district in Georgia
Participants:
- 7 elementary school mathematics teachers (for observations and formative assessment samples)
- 63 elementary school teachers (for surveys)

ARE TEACHERS’ FORMATIVE ASSESSMENTS RELIABLE?
71
Chapter 4: Findings
This study investigated whether or not the results from teacher-created/selected formative
assessments are reliable indicators of how students will perform on a summative assessment that
measures the same curriculum. The purpose of this chapter is to exhibit the results of the mixed
methods study that was conducted to answer the following research questions:
1. What is the relationship between a student’s math grades and his/her standardized test
score?
2. What are teachers’ perceptions regarding the uses of standardized test scores in
improving instructional decisions?
3. How well do teachers’ formative assessments align with the rigor of the standardized
assessment?
Data was obtained from 35 Title I schools to gain insight into the relationship between a
student’s math grade and the proficiency level score obtained on a standardized test. Further data
from one Title I school within the district was analyzed to look at individual students’ test scores
and the math grades achieved to determine whether or not grades and test scores are independent
of each other. Survey data was gathered to measure teachers’ perceptions regarding the uses of
standardized test scores in making instructional decisions. Teachers were also observed and
structured interviews were conducted to ascertain the impact of standardized testing on their
everyday classroom instruction. Finally, teacher created/selected formative assessments were
analyzed to determine the level of alignment to the state’s standardized assessment. This chapter
will be organized by research question with the quantitative and qualitative measures used to
inform analysis.

ARE TEACHERS’ FORMATIVE ASSESSMENTS RELIABLE?
72
Research Question 1
The first research question was: What is the relationship between a student’s math grades
and his/her standardized test score? To answer this question, data was obtained from all 35 Title
I schools within an urban school district in Georgia. For each of the 35 schools, the grade
distribution and distribution of standardized test scores was examined for fifth grade
mathematics. The percentage of fifth grade students in each school that received A’s, B’s, C’s,
and F’s were reported along with the percentage of fifth grade math students in each proficiency
level (i.e. Beginning, Developing, Proficient, and Distinguished) of the Georgia Milestones
Assessment. Descriptive statistics were used to analyze this aggregate data.
Figure 5 below shows the criteria used to compare the grades and test scores.
Figure 5. Comparison Criteria between Grades and Test Scores.
Initial examination of the data showed that distribution of grades and test scores among
the 35 Title I schools was extremely dissimilar. Figure 6 shows an example of the difference in
•Grade: F
•Test Score: Beginning
•Failure to Achieve Grade Level StandardsLevel 1•Grade: C
•Test Score: Developing
•Average Achievement of Grade Level StandardsLevel 2•Grade: B
•Test Score: Proficient
•Above Average Achievement of Grade Level StandardsLevel 3•Grade: A
•Test Score: Distinguished
•Superior Achievement of Grade Level StandardsLevel 4

ARE TEACHERS’ FORMATIVE ASSESSMENTS RELIABLE?
73
distribution of grades and test scores. Out of the 66 fifth grade students tested at this particular
school, 24% of those students received an A for the math course, but only 2% of those students
received a Distinguished rating on the GMAS. Thirty-eight (38%) percent of the students
received a B math grade, but only 19% received a Proficient rating. Thirty-eight (38%) percent
of the students received a C math grade, but 24% of the students received a Developing rating on
the GMAS. Finally, none of the fifth grade students in School 11 received a failing grade in
math, but 56% of the students in School 11 scored on the Beginning Level of GMAS. The
comparison charts for all 35 schools can be found in Appendix F.
Figure 6. School 11 – Comparison of Math Grade and GMAS Score Distribution.
Further examination of the data showed that for the majority of Title I schools in the
district, there was a great discrepancy between the percentage of students failing the fifth grade
math course and the percentage of students failing the criterion-referenced standardized
assessment of the same content (GMAS). The data showed that there were five schools that had
Test Scores
Grades
0%20%40%60%80%
100%
2%19% 24%
56%24%38% 38%
0%
School 11
2019 - 5th Grade Mathematics
Comparison of Test Scores and Grades
Test Scores Grades

ARE TEACHERS’ FORMATIVE ASSESSMENTS RELIABLE?
74
a 1% to 25% difference in the percentage of students with failing grades and failing the GMAS.
There were 19 schools that had a 26% to 50% difference in the percentage of students with
failing grades and failing the GMAS, and 10 schools with a 51% to 75% difference. Figure 6 is
a histogram that shows the frequency of each group of differences. Twenty-nine of the 35
schools had differences of over 25% in the percentages of students with failing math grades and
percentages of students that failed the standardized assessment. Appendix E provides a full
report of the differences for all 35 Title I schools.
Figure 6. Differences in the Percentages of Failing Grades to Failing Test Scores.
In most cases there were more students to fail the standardized assessment (GMAS) than
those that failed the math course. Only one school (i.e. School 22) had more students to receive
a failing math grade (48%) than received a failing GMAS test score (41%). The eighty-one
students in this particular school (i.e. School 22) had math grades that were very similar to that
1
5
19
10
00
2
4
6
8
10
12
14
16
18
20
-25% to 0% 1% to 25% 26% to 50% 51% to 75% 76% to 100%
Num
ber
of
Sch
ools
Difference
Difference in the Percentage of 5th Grade Students Failing the 2019 GMAS
and Failing Math Grades at 35 Title I Schools

ARE TEACHERS’ FORMATIVE ASSESSMENTS RELIABLE?
75
of the GMAS test scores (i.e. 4% - Distinguished / 5% - A’s; 18% - Proficient / 21% - B’s; 37% -
Developing / 26% C’s; 41% - Beginning / 48% - F’s).
However, to get a better picture of the relationship between an elementary student’s math
grade and his/her test score, individual student data was examined from Oak Hill Elementary,
one of the Title I schools in this urban school district. Individual student test data from the 2019
GMAS administration along with each individual student’s fourth quarter math grade was
obtained to provide clarity to this issue. Students in grades 3, 4, and 5 were tested in
mathematics for the 2019 GMAS administration. Table 6 provides a summary of the students
tested during the 2019 GMAS administration at Oak Hill Elementary.
Table 6
Summary of Oak Hill Student Participants
Third Grade Frequency Percent
Male 57 65.5%
Female 30 34.5%
Third Grade Total 87 100.0%
Fourth Grade Frequency Percent
Male 48 60.0%
Female 32 40.0%
Fourth Grade Total 80 100.0%
Fifth Grade Frequency Percent
Male 38 57.6%
Female 28 42.4%
Fifth Grade Total 66 100.0%
Next, descriptive statistics were used to analyze the data for each grade level. The
preliminary data shows the following frequencies for grades (Table 7) and test scores (Table 8).
When examining the data for Oak Hill’s students that received an above average grade in

ARE TEACHERS’ FORMATIVE ASSESSMENTS RELIABLE?
76
mathematics, 56% of the third grade students received an A or B. There were 40% of the fourth
graders that received above average grades in math, and 61% of the fifth graders receiving above
average grades. Out of 233 students in third–fifth grade, only 28 students (12%) failed their
mathematics class. Fifteen percent (15%) of the third grade students received a failing math
grade, 19% of the fourth graders received a failing math grade, and 0% of the fifth graders
received a failing math grade.
Table 7
2019 Oak Hill Students’ Math Grades
Grades A’s B’s C’s F’s
N % N % N % N %
Third 22 25% 27 31% 25 29% 13 15%
Fourth 7 9% 25 31% 33 41% 15 19%
Fifth 15 23% 25 38% 25 38% 1 2%
Additionally, preliminary findings from the GMAS test scores for Oak Hill’s students
show that only 21% of the 233 students in third-fifth grade scored at the Proficient and above
rating on the state’s standardized assessment. Twenty-one percent of the third graders scored
Proficient or above, 23% of the fourth graders scored Proficient or above, and 20% of the fifth
graders scored Proficient or above. Out of the 233 elementary students tested in third-fifth
grade, 39% of the students failed the 2019 GMAS mathematics assessment scoring at the
Beginning level.
Table 8
2019 Oak Hill Students’ GMAS Test Proficiency Levels
Grade Distinguished Proficient Developing Beginning
N % N % N % N %
Third 0 0% 19 22% 35 40% 33 38%
Fourth 0 0% 18 23% 38 47% 22 28%
Fifth 1 2% 12 18% 16 24% 37 56%

ARE TEACHERS’ FORMATIVE ASSESSMENTS RELIABLE?
77
The following figures–Figure 8, Figure 9, and Figure 10–show the grade/test score
distribution for third, fourth and fifth-grade at Oak Hill Elementary. The pictorial
representations of the data show in each case that the distribution of grades is dissimilar to the
distribution of standardized test scores.
Figure 8. Oak Hill Elementary–Third Grade Distribution of Grades/Test Scores.
Test Scores
Grades
0%20%40%60%80%
100%
0%
22%40% 38%
25% 31% 29%15%
Oak Hill Elementary
2019 - 3rd Grade Mathematics
Comparison of Test Scores and Grades
Test Scores Grades

ARE TEACHERS’ FORMATIVE ASSESSMENTS RELIABLE?
78
Figure 9. Oak Hill Elementary–Fourth Grade Distribution of Grades/Test Scores.
Figure 10. Oak Hill Elementary–Fifth Grade Distribution of Grades/Test Scores.
Test Scores
Grades
0%20%40%60%80%
100%
0%
23%
48%30%
9%
31%41%
19%
Oak Hill Elementary
2019 - 4th Grade Mathematics
Comparison of Test Scores and Grades
Test Scores Grades
Test Scores
Grades
0%20%40%60%80%
100%
2%18% 24%
56%24%38% 38%
0%
Oak Hill Elementary
2019 - 5th Grade Mathematics
Comparison of Test Scores and Grades
Test Scores Grades

ARE TEACHERS’ FORMATIVE ASSESSMENTS RELIABLE?
79
Finally, to determine if there is a relationship between an elementary student’s math
grades and his/her test score, a Chi-Square test was performed using SPSS software for each
grade level’s individual student data. In each case the following null and alternative hypotheses
were tested.
H0 – An elementary student’s math proficiency level on the Georgia Milestones
assessment is independent of the fourth quarter math report card grade.
H1 – An elementary student’s math proficiency level on the Georgia Milestones
assessment is not independent of the fourth quarter math report card grade.
The = 0.05 with a 95% confidence interval.
Third Grade Chi-Square Results
Using SPSS software, a chi-square test of independence was performed to examine the
relationship between math GMAS test scores and fourth quarter math grades. Since the p-value
is small, the null hypothesis can be rejected because there is enough statistical evidence to
conclude that the variables are associated. The relation between these variables was significant,
X2 (6, N = 87) = 46.914, p = .000, 95% CI [1.24, 14.45]. The effect size for this finding,
Cramer’s V, was relatively strong, .519 (Peter, 2016). A third grade elementary student’s math
proficiency level on the Georgia Milestones assessment is not independent of his fourth quarter
math report card grade (see Table 9).
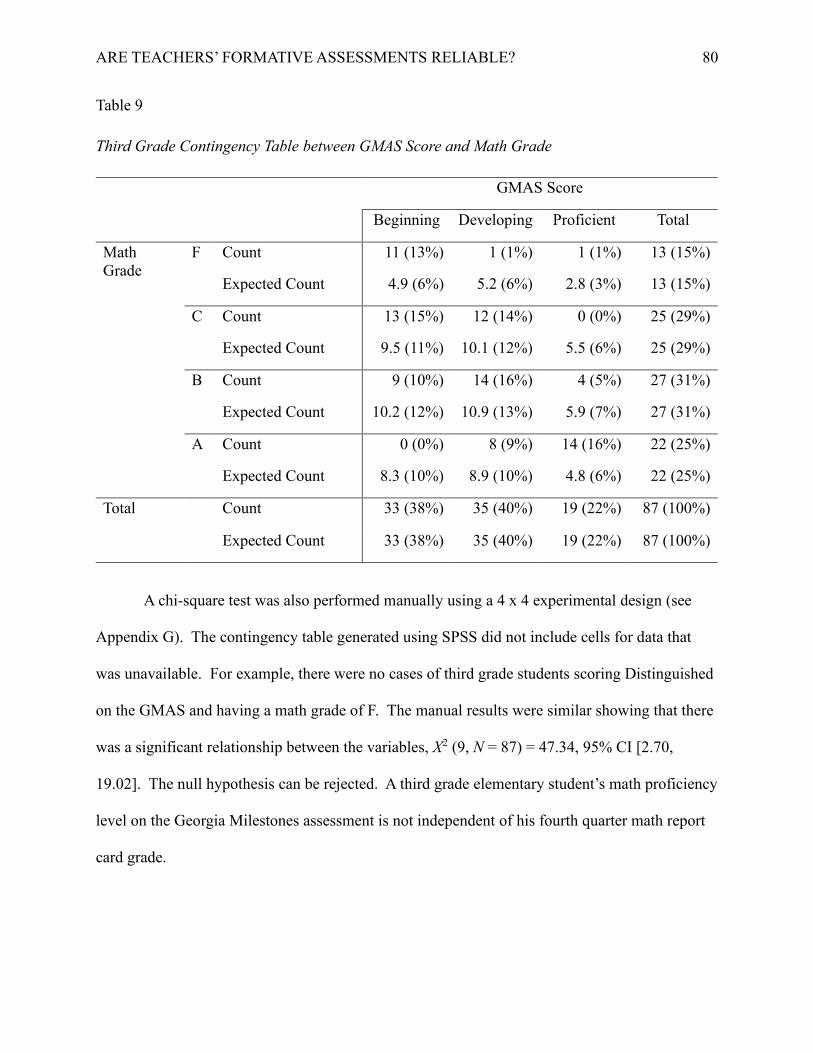
ARE TEACHERS’ FORMATIVE ASSESSMENTS RELIABLE?
80
Table 9
Third Grade Contingency Table between GMAS Score and Math Grade
GMAS Score
Beginning Developing Proficient Total
Math
Grade
F Count 11 (13%) 1 (1%) 1 (1%) 13 (15%)
Expected Count 4.9 (6%) 5.2 (6%) 2.8 (3%) 13 (15%)
C Count 13 (15%) 12 (14%) 0 (0%) 25 (29%)
Expected Count 9.5 (11%) 10.1 (12%) 5.5 (6%) 25 (29%)
B Count 9 (10%) 14 (16%) 4 (5%) 27 (31%)
Expected Count 10.2 (12%) 10.9 (13%) 5.9 (7%) 27 (31%)
A Count 0 (0%) 8 (9%) 14 (16%) 22 (25%)
Expected Count 8.3 (10%) 8.9 (10%) 4.8 (6%) 22 (25%)
Total Count 33 (38%) 35 (40%) 19 (22%) 87 (100%)
Expected Count 33 (38%) 35 (40%) 19 (22%) 87 (100%)
A chi-square test was also performed manually using a 4 x 4 experimental design (see
Appendix G). The contingency table generated using SPSS did not include cells for data that
was unavailable. For example, there were no cases of third grade students scoring Distinguished
on the GMAS and having a math grade of F. The manual results were similar showing that there
was a significant relationship between the variables, X2 (9, N = 87) = 47.34, 95% CI [2.70,
19.02]. The null hypothesis can be rejected. A third grade elementary student’s math proficiency
level on the Georgia Milestones assessment is not independent of his fourth quarter math report
card grade.

ARE TEACHERS’ FORMATIVE ASSESSMENTS RELIABLE?
81
Fourth Grade Chi-Square Results
A chi-square test of independence was performed to examine the relationship between
math GMAS test scores and fourth quarter math grades. Since the p-value is small, the null
hypothesis can be rejected because there is enough statistical evidence to conclude that the
variables are associated. The relation between these variables was significant, X2 (6, N = 80) =
25.779, p = .000, 95% CI [1.24, 14.45]. The effect size for this finding, Cramer’s V, was
moderate, .401 (Peter, 2016). A fourth grade elementary student’s math proficiency level on the
Georgia Milestones assessment is not independent of his fourth quarter math report card grade
(see Table 10).
Table 10
Fourth Grade Contingency Table between GMAS Score and Math Grade
GMAS Score
Beginning Developing Proficient Total
Math
Grade
F Count 9 (11%) 6 (8%) 0 (0%) 15 (19%)
Expected Count 4.5 (6%) 7.1 (9%) 3.4 (4%) 15 (19%)
C Count 13 (16%) 15 (19%) 5 (6%) 33 (41%)
Expected Count 9.9 (12%) 15.7 (20%) 7.4 (9%) 33 (41%)
B Count 2 (3%) 15 (19%) 8 (10%) 25 (31%)
Expected Count 7.5 (9%) 11.9 (15%) 5.6 (7%) 25 (31%)
A Count 0 (0%) 2 (3%) 5 (6%) 7 (9%)
Expected Count 2.1 (3%) 3.3 (4%) 1.6 (2%) 7 (9%)
Total Count 24 (30%) 38 (48%) 18 (23%) 80 (100%)
Expected Count 24 (30%) 38 (48%) 18 (23%) 80 (100%)

ARE TEACHERS’ FORMATIVE ASSESSMENTS RELIABLE?
82
A chi-square test was also performed manually using a 4 x 4 experimental design (see
Appendix G). The contingency table generated using SPSS for the fourth grade results, as well,
did not include cells for data that was unavailable. For example, there were no cases of fourth
grade students scoring Distinguished on the GMAS and having a math grade of C. The manual
chi-square results were similar showing that there was a significant relationship between the
variables, X2 (9, N = 80) = 25.56, 95% CI [2.70, 19.02]. The null hypothesis can be rejected. A
fourth grade elementary student’s math proficiency level on the Georgia Milestones assessment
is not independent of his fourth quarter math report card grade.
Fifth Grade Chi-Square Results
A chi-square test of independence was performed to examine the relationship between
math GMAS test scores and fourth quarter math grades. Since the p-value is small, the null
hypothesis can be rejected because there is enough statistical evidence to conclude that the
variables are associated. The relation between these variables was significant, X2 (9, N = 66) =
43.652, p = .000, 95% CI [1.24, 14.45]. The effect size for this finding, Cramer’s V, was
relatively strong, .470 (Peter, 2016). A fifth grade elementary student’s math proficiency level
on the Georgia Milestones assessment is not independent of his fourth quarter math report card
grade (see Table 11).

ARE TEACHERS’ FORMATIVE ASSESSMENTS RELIABLE?
83
Table 11
Fifth Grade Contingency Table between GMAS Score and Math Grade
GMAS Score
Beginning Developing Proficient Distinguished Total
Math
Grade
F Count 1 (2%) 0 (0%) 0 (0%) 0 (0%) 1 (2%)
Expected
Count
.6 (0.9%) .2 (0.3%) .2 (0.3%) 0 (0%) 1 (2%)
C Count 23 (36%) 1 (2%) 1 (2%) 0 (0%) 25 (39%)
Expected
Count
14.0 (22%) 6.1 (10%) 4.5 (7%) .4 (0.6%) 25 (39%)
B Count 12 (18%) 11 (17%) 2 (3%) 0 (0%) 25 (38%)
Expected
Count
14 (21%) 6.1 (9%) 4.5 (7%) .4 (0.6%) 25 (38%)
A Count 1 (2%) 4 (6%) 9 (14%) 1 (2%) 15 (23%)
Expected
Count
8.4 (13%) 3.6 (5%) 2.7 (4%) .2 (0.3%) 15 (23%)
Total Count 37 (56%) 16 (24%) 12 (18%) 1 (2%) 66 (100%)
Expected
Count
37 (56%) 16 (24%) 12 (18%) 1 (2%) 66 (100%)
Finally, a chi-square test was performed manually using a 4 x 4 experimental design (see
Appendix G). As in the other two cases, the contingency table generated using SPSS for the fifth
grade results did not include cells for data that was unavailable. For example, there were no
cases of fifth grade students scoring Distinguished on the GMAS and having a math grade of B.
The manual chi-square results were similar showing that there was a significant relationship
between the variables, X2 (9, N = 66) = 47.8, 95% CI [2.70, 19.02]. The null hypothesis can be

ARE TEACHERS’ FORMATIVE ASSESSMENTS RELIABLE?
84
rejected. A fifth grade elementary student’s math proficiency level on the Georgia Milestones
assessment is not independent of his fourth quarter math report card grade.
Research Question 2
The second research question was: What are teachers’ perceptions regarding the uses of
standardized test scores in improving instructional decisions? To answer this question, a survey
was created using several dimensions from Boston College’s Teacher Survey on the Impact of
State-Mandated Testing Programs (Pedulla, 2003). The survey questions and dimensions that
were used in this study examined the following areas: 1) teachers’ perceived value of the state
test, 2) the alignment of classroom practices with the state test, and 3) the impact on the content
and mode of instruction/amount of instructional time.
Demographics/ Survey Participants
Permission was obtained from an urban school district in Georgia to ask seven principals
from the 35 Title I schools to share the online survey with their third–fifth grade teachers. These
seven principals, including Oak Hill’s principal, shared the link to the online survey with their
teachers. A total of 63 teachers took part in the survey within the allotted time frame (five days).
Of the survey respondents, only 8% of them were novice teachers with five years or less
experience. The majority of the teachers had over five years of experience, and 36% of the
teachers surveyed had over 20 years of experience in education (see Figure 11).
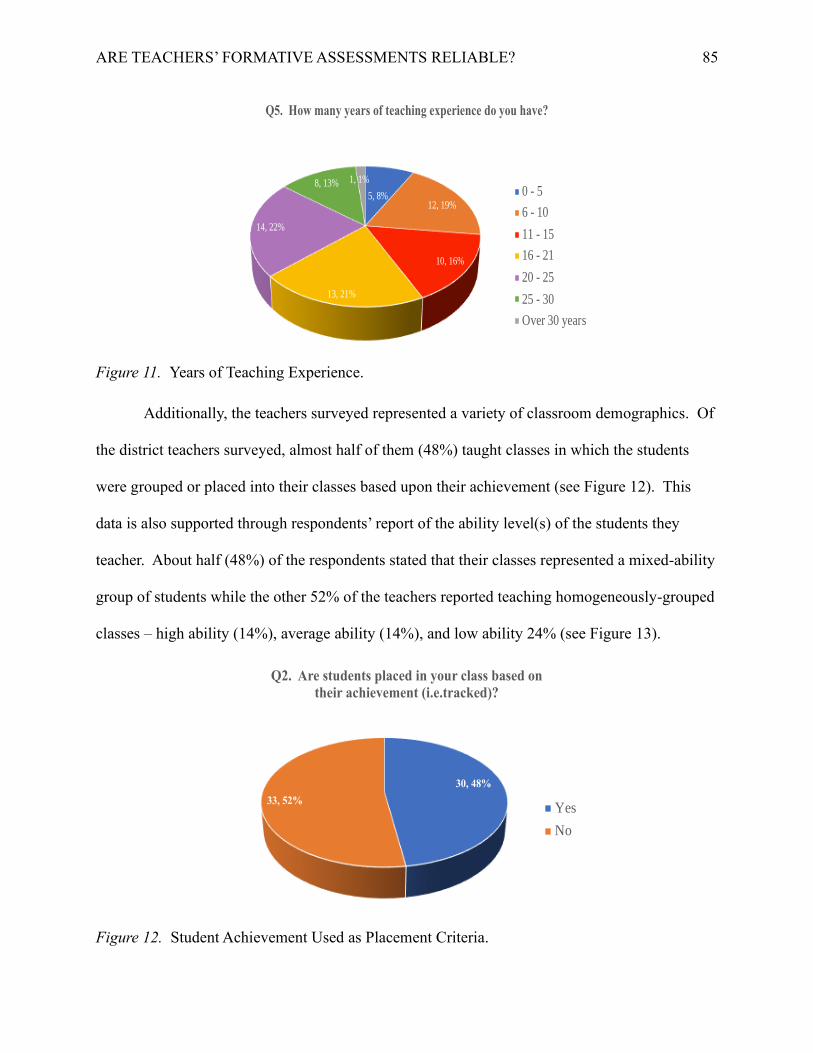
ARE TEACHERS’ FORMATIVE ASSESSMENTS RELIABLE?
85
Figure 11. Years of Teaching Experience.
Additionally, the teachers surveyed represented a variety of classroom demographics. Of
the district teachers surveyed, almost half of them (48%) taught classes in which the students
were grouped or placed into their classes based upon their achievement (see Figure 12). This
data is also supported through respondents’ report of the ability level(s) of the students they
teacher. About half (48%) of the respondents stated that their classes represented a mixed-ability
group of students while the other 52% of the teachers reported teaching homogeneously-grouped
classes – high ability (14%), average ability (14%), and low ability 24% (see Figure 13).
Figure 12. Student Achievement Used as Placement Criteria.
5, 8%12, 19%
10, 16%
13, 21%
14, 22%
8, 13% 1, 1%
Q5. How many years of teaching experience do you have?
0 - 5
6 - 10
11 - 15
16 - 21
20 - 25
25 - 30
Over 30 years
30, 48%
33, 52%
Q2. Are students placed in your class based on
their achievement (i.e.tracked)?
Yes
No

ARE TEACHERS’ FORMATIVE ASSESSMENTS RELIABLE?
86
Figure 13. Achievement Level of Classes.
Also, class size for the teachers differed greatly. Only 13% of the teachers reported
having a small class size of at least 15 students. The majority range for class size was between
16 to 25 students (76%). However, there were seven teachers (11%) who reported teaching a
class size greater than 25 students (see Figure 14).
Figure 14. Class Size.
9, 14%
9, 14%
15, 24%
30, 48%
Q3. Which one of the following categories best describes the
ability/achievement level of your class?
High ability or achievement
Average ability or achievement
Low ability or achievement
Mixed ability or achievement
8, 13%
25, 40%
23, 36%
5, 8%2, 3%
Q4. How many students are in your class?
1 - 15
16 - 20
21 - 25
26 - 30
31+

ARE TEACHERS’ FORMATIVE ASSESSMENTS RELIABLE?
87
Teacher Perceptions
The questions in the survey examined teacher perceptions in several areas, and through
careful quantitative analysis of these areas, several themes emerged. Figure 15 outlines the
dimensions of the survey questions and sub-themes that emerged from survey respondents.
Figure 15. Teacher Perception Themes.
Teachers’ Perceived Value of the State Test. Several survey questions were used to
determine teachers’ perceived value of the GMAS. Questions in this dimension covered issues
regarding whether or not teachers believed the GMAS mathematics assessment was an accurate
measure of the state’s curriculum–the Georgia Standards of Excellence. Questions in this
dimension also dealt with the issue of whether or not teachers believed that the results from the
GMAS were an accurate indicator of the effectiveness of instruction that students had received.
Teachers responded to each item in this domain using a 5-point Likert scale with a rating of 1 as
“Strongly Disagree” and a rating of 5 as “Strongly Agree.” Additionally, teachers were given the
Teachers' Perceived
Value of the State Test
•Educational Quality/Effectiveness
•Accurate Measurement
Alignment of Classroom
Practices with the State Test
•Alignment of Instruction
•Alignment of Formative Assessments
The Impact on the Content and Mode of Instruction
•Influence of Practice
•Expectation of Student Performance
Teacher
Perceptions

ARE TEACHERS’ FORMATIVE ASSESSMENTS RELIABLE?
88
opportunity to make comments regarding students’ performance on the Georgia Milestones and
the relationship to classroom grading.
Accurate Measurement. Teachers responded to several questions indicating whether or
not they perceived that the state-mandated summative assessment (GMAS) was indeed an
accurate measurement of student competencies. Table 12 provides a summary of the results in
this area.
Table 12
Accurate Measurement of Student Achievement
Survey Respondents
Question Response f %
Q7. The state-mandated test (Georgia
Milestones) is as accurate a measure of student
achievement as a teacher’s judgment.
Strongly Disagree
Disagree
Neutral
Agree
Strongly Agree
5
20
25
7
6
8
32
40
11
10
Q8. The state-mandated test (Georgia
Milestones) is as accurate a measure in rating
student performance as the grades that they
receive on their report cards.
Strongly Disagree
Disagree
Neutral
Agree
Strongly Agree
5
21
22
8
7
8
33
35
13
11
Q21. The state-mandated test (GMAS) measures
high standards of achievement.
Strongly Disagree
Disagree
Neutral
Agree
Strongly Agree
1
6
22
22
12
2
10
35
35
19
When questioned about the accuracy of the Georgia Milestones assessment, most
teachers (54%) agreed that the state assessment measured a high standard of achievement. Yet,
forty percent (40%) of the teachers felt that the summative assessment was not as accurate a
measure of student achievement as a teacher’s judgment. Teacher respondents also had varying
opinions when asked if the summative assessment (GMAS) was as accurate in rating student
performance as report card grades. Forty-one percent did not agree, while 24% agreed that the
GMAS was as accurate as report card grades.

ARE TEACHERS’ FORMATIVE ASSESSMENTS RELIABLE?
89
Reasons for the variance of teacher opinions in this area became clear through the open-
ended responses from respondents. One teacher reported, “Grades students receive in the
classroom do not always reflect how they will score on the Georgia Milestones.” Comments
from other teachers revealed that report card grades may not match summative assessment
results because of unwritten policies to pass students. A teacher stated, “The grades my students
receive in the classroom do not match what is on the Milestones due to the fact that I am unable
to fail them.” Another teacher reported, “Some students receive grades that are not reflective of
their performance in the classroom or on the GMAS. Some students will receive a grade of C to
keep from failing.”
Accurate Measurement of Subgroups. Table 13 below shows a summary of teacher
perceptions regarding the performance of minority students and students acquiring English as a
second language on the summative assessment.
Table 13
Accurate Measurement of Subgroups
Survey Respondents
Question Response f %
Q16. Performance differences between minority
and non-minority students are smaller on the
state-mandated test (GMAS) than on the grades
achieved in the classroom.
Strongly Disagree
Disagree
Neutral
Agree
Strongly Agree
14
15
15
12
7
22
24
24
19
11
Q17. The state-mandated test (GMAS) is NOT
an accurate measure of what minority students
know and can do.
Strongly Disagree
Disagree
Neutral
Agree
Strongly Agree
2
4
17
21
19
3
6
27
33
30
Q22. The state-mandated test (GMAS) is NOT
an accurate measure of what students who are
acquiring English as a second language know
and can do.
Strongly Disagree
Disagree
Neutral
Agree
Strongly Agree
2
4
14
19
24
3
6
22
30
38

ARE TEACHERS’ FORMATIVE ASSESSMENTS RELIABLE?
90
The results from survey respondents showed that 63% of the teachers believed that the
results from the summative assessment were not an accurate measure of what minority students
know and can do. Also 68% of the teachers felt that the state-mandated assessment is not an
accurate measure of what ESOL students know and can do. These findings reveal perceptions of
cultural bias that teachers may have with the summative assessment system.
When contemplating the results of minority and non-minority students, one respondent
commented that “The GMAS is not culturally relevant to low-achieving, impoverished students”
which indicates that socio-economic status may need to be considered as well. Another teacher
responded,
I have noticed a trend in education where communities of lower socio-economics score
lower on the Georgia Milestones than the affluent communities. But each community’s
teachers teach the same standards. Thus, economic gaps heavily influence the
achievement gap. Therefore, economic equity needs to turn into a policy.
Another sub-group of students that teachers referred to are our gifted kids or high-
achieving students. Several respondents with differing opinions made comments about the
performance of this subgroup of students. One teacher stated, “I have gifted students so they
usually perform well on the GMAS.” A second teacher agreed, “My students’ daily grades
usually align with the scores from the Georgia Milestones.” Another teacher stated, “If they
(students) are successful in class proficiency they will be successful on the GMAS, and if they
are not successful in class they do not master the GMAS.”
However, this is not the case with all high performing and/or gifted students. One
teacher stated, “Some bright students are not good test takers and the grade reflects an "A"
student, however, they may score below level on GMAS.” Another teacher reported, “Students
ARE TEACHERS’ FORMATIVE ASSESSMENTS RELIABLE?
91
who are high performing in the classroom can receive a low score on the GMAS because they
have a fear of the test, which is not something that may be evident when taking an in-class
assessment.”
A second teacher agreed stating, “They are usually pretty close in terms of achievement,
but students can have test anxiety or they could perform better than expected. You really never
can tell.” A third teacher added,
From experience, I have had students who were on the Honor Roll and didn’t pass a
portion of the Georgia Milestones! In my opinion, the curriculum that my school adopted
in the past wasn’t adequate enough to prepare students to be proficient or higher but
more so to prepare them to be Developing. My students were getting passing grades
because the curriculum was too easy. The Georgia Milestones was challenging, so a lot
of my high performing students didn’t do as well. That was due to lack of exposure in the
curriculum.
One final subgroup that may be considered are our transient students. One teacher stated,
“In many instances a correlation cannot be made especially with transient students.” Transient
students are those who contribute to the high mobility rate in our school system because they
move from school to school. This presents a difficulty because schools in our district do not
follow the same pacing guide, nor use the same curricular resources to ensure that as students
move from school to school, there is consistency in what is taught at a particular time.
At a minimum, these findings show that teachers believe that the student performance on the
summative assessment (GMAS) and on classroom formative assessments is impacted by a
variety of variables that may or may not be controlled. Variables such as student mobility rate,
socio-economic status, previous experiences, and test anxiety all may impact a student’s

ARE TEACHERS’ FORMATIVE ASSESSMENTS RELIABLE?
92
performance on both the summative and formative assessment systems, thereby impacting the
results.
Differences in Results/Educational Effectiveness. Respondents were also questioned
about using the results of the summative assessment as a means of judging educational
effectiveness. The results found in Table 14 showed that the majority of educators do not feel
that the summative assessment system should be used to make decisions about educational
effectiveness in the school, but 70% of the teachers also reported that their administrators do feel
results from the state-mandated test reflect the quality of teachers’ instruction.
Table 14
Educational Effectiveness/Differences in Results
Survey Respondents
Question Response f %
Q19. Score differences from year to year on
the state-mandated test reflect changes in the
characteristics of students rather than
changes in school effectiveness.
Strongly Disagree
Disagree
Neutral
Agree
Strongly Agree
5
4
18
21
15
8
6
29
33
24
Q24. Differences among schools on the
state-mandated tests are more a reflection of
students’ background characteristics than of
school effectiveness.
Strongly Disagree
Disagree
Neutral
Agree
Strongly Agree
0
0
10
21
32
0
0
16
33
51
Q27. Administrators in my school believe
students’ state-mandated test (GMAS) scores
reflect the quality of teachers’ instruction.
Strongly Disagree
Disagree
Neutral
Agree
Strongly Agree
1
3
15
23
21
2
5
24
37
33
When questioned about the fluctuation in standardized assessment test results from year
to year, 57% of the district’s teachers indicated that the score differences on the GMAS from
year to year were due to changes in the characteristics of students rather than the changes in
school effectiveness. Also, the majority of survey respondents (84%) stated that the differences
ARE TEACHERS’ FORMATIVE ASSESSMENTS RELIABLE?
93
among schools on the state-mandated tests are more a reflection of students’ background
characteristics than of school effectiveness.
Respondents made several comments regarding possible reasons for differences in the
way students perform on the GMAS. One respondent noted, “Some students just don't test well
or have the home support needed to do well on the test.” Another teacher commented that the
previous year(s) instruction is also a factor,
Because many students begin each year 1 to 2+ years behind grade level, teachers are at a
disadvantage from day one. Teachers are unable to begin where they are supposed to
start with the pacing guide. They must go back and try to fill in the gaps in learning to
assist students with grasping new concepts. Students feel frustrated and defeated in
certain subjects when there is a huge deficit in their learning (i.e. math & reading).
Thanks for allowing me the opportunity to speak freely.
Another teacher made comments about the variety of variables that may influence
differences in student performance on the GMAS. He/she stated,
I believe that standardized testing doesn't really show what all students know and have
learned. There are many variables (i.e. homelessness, food insecurity, domestic violence,
child abuse, etc.) that can affect students before and during the GMAS. I believe there
should be several testing measures to test student mastery of content. It is my belief that
if a state assessment was given at the beginning of school and then at the end of the
school year, it would show a clearer picture of student mastery.
Measure of Educational Effectiveness. Survey respondents expressed strong feelings
when asked about the Georgia Milestones being used as a measure of educational effectiveness.
One teacher commented,

ARE TEACHERS’ FORMATIVE ASSESSMENTS RELIABLE?
94
It’s not about the Milestones, it’s about the students we teach. The Milestones should be
redesigned for students with learning disabilities and academic challenges. It should be
different levels of the GMAS assessment. If we practice differentiation in the classroom,
the assessment should be the same.
Another special education teacher added,
I believe students in my classroom should have an alternative assessment since their
learning looks different based on their IEP (Individualized Education Program). I believe
that the Georgia Milestones puts a lot of stress on students. Why give 1,000,000 during
the school year then make such a big deal about one? In my opinion, I believe students
no longer take assessments seriously because all we do is test them.
Another teacher added to the idea of using the summative assessment as a measure of
educational effectiveness. He/she stated, “Georgia Milestones doesn't consider having to
remediate students. Sometimes, students grow but do not pass the assessment.”
The survey data from respondents showed that 48% of the district’s teachers disagreed or
strongly disagreed that GMAS scores accurately reflect the quality of education students have
received at schools (see Figure 16) even though 70% of them reported that their evaluators do
believe that the summative results do reflect instruction in the classroom.

ARE TEACHERS’ FORMATIVE ASSESSMENTS RELIABLE?
95
Figure 16. GMAS Scores–A Reflection of Educational Quality?
Alignment of Classroom Practices with the State Test. Another dimension of the
survey considered the alignment of the summative assessment to formative assessment practices
and daily instruction of teachers. Results from this area of the study shown in Table 15 showed
that the majority of teachers (70%) believed that the state-mandated test is aligned to the
curriculum that they are required to follow. Also 77% of the teachers believe that the district’s
curriculum is aligned to what is covered in the GMAS as well. Furthermore, 57% of survey
respondents reported that their daily instruction is compatible with the Georgia Milestones
assessment. All of this is evidence that the majority of teachers in the district do acknowledge
the importance of teaching to the state’s adopted curriculum that is assessed through the Georgia
Milestones Assessment System.
10, 16%
20, 32%
20, 32%
8, 12%
5, 8%
Q13. Scores on the state-mandated test accurately reflect the quality of
education students have received.
Strongly Disagree
Disagree
Neutral
Agree
Strongly Agree

ARE TEACHERS’ FORMATIVE ASSESSMENTS RELIABLE?
96
Table 15
Alignment of Formative Assessment
Survey Respondents
Question Response f %
Q6. The state-mandated test (Georgia
Milestones) is compatible with my daily
instruction.
Strongly Disagree
Disagree
Neutral
Agree
Strongly Agree
2
5
20
22
14
3
8
32
35
22
Q9. My district’s curriculum is aligned with
the state-mandated testing program (GMAS).
Strongly Disagree
Disagree
Neutral
Agree
Strongly Agree
0
3
11
33
16
0
5
17
52
25
Q10. The state-mandated test (Georgia
Milestones) is based on a curriculum
framework (Georgia Standards of
Excellence) that ALL teachers in my state
should follow.
Strongly Disagree
Disagree
Neutral
Agree
Strongly Agree
0
5
14
24
20
0
8
22
38
32
Q12. The instructional texts and materials
that the district requires me to use are
compatible with the state-mandated test
(GMAS).
Strongly Disagree
Disagree
Neutral
Agree
Strongly Agree
2
15
15
21
10
3
24
24
33
16
Q18. Many low scoring students will do
better on the state-mandated test (GMAS) if
they receive specific preparation for it.
Strongly Disagree
Disagree
Neutral
Agree
Strongly Agree
1
10
17
15
20
2
16
27
24
32
Q20. If I teach to the state standards or
frameworks, students will do well on the
state-mandated test (GMAS).
Strongly Disagree
Disagree
Neutral
Agree
Strongly Agree
2
11
19
14
17
3
17
30
22
27
Q26. The state-mandated testing program
(GMAS) leads some teachers in my school to
teach in ways that contradict their own ideas
of good educational practice.
Strongly Disagree
Disagree
Neutral
Agree
Strongly Agree
2
6
21
7
17
4
11
40
13
32

ARE TEACHERS’ FORMATIVE ASSESSMENTS RELIABLE?
97
However, survey results also show varying opinions about how well adherence to the
state’s adopted curriculum impacts student outcomes on the GMAS. Comments provided by the
teachers show that although students may perform well on classroom assignments aligned to the
state’s adopted curriculum, these results may not necessarily transfer to students’ performance on
the summative assessment. One teacher reported, “Generally, my students perform much better
in the classroom compared to their performance on the Georgia Milestones.” Another teacher
stated,
I believe that students' abilities are not a direct reflection of their scores on the GMAS.
Students that have high grades and achieve and perform well in the classroom, could
possibly score low on the GMAS (for a reason unknown). Therefore, the GMAS should
be eliminated or revised. The efficacy of the GMAS should be a primary focus of
educational leaders.
Additionally, there was some indication from survey respondents that the administration
of the GMAS impacts their daily instruction with students. Teachers were asked specifically
about preparation for the summative assessment. One teacher reported, “How students perform
on standardized prep coursework is indicative of Georgia Milestone potential.” In fact, 56% of
the district’s teachers agreed or strongly agreed that their students would do better on the state-
mandated test (GMAS) if they receive specific preparation for it.
Alignment of Formative Assessments. With regards to content and format of teacher
created/selected formative assessments, 71% of the district’s teachers agreed or strongly agreed
that their tests have the same content as the state-mandated assessment (see Figure 17). Also,
41% of district’s teachers believed that their assessments are in the same format as the GMAS
(see Figure 18). This data reveals that the majority of teachers do believe that their classroom

ARE TEACHERS’ FORMATIVE ASSESSMENTS RELIABLE?
98
formative assessments measure the same content that students are assessed through the Georgia
Milestones.
Figure 17. Formative Assessment vs. GMAS Content.
Figure 18. Formative Assessment vs. GMAS Format.
5, 8%
13, 21%
29, 46%
16, 25%
Q28. My tests have the same content as the state-mandated test (GMAS).
Strongly Disagree
Disagree
Neutral
Agree
Strongly Agree
1, 2%
8, 13%
28, 44%
10, 16%
16, 25%
Q25. My tests are in the same format as the state-mandated test (GMAS).
Strongly Disagree
Disagree
Neutral
Agree
Strongly Agree

ARE TEACHERS’ FORMATIVE ASSESSMENTS RELIABLE?
99
However, one teacher shared ideas about the difference in format for the summative
assessment and classroom formative assessments. He/she stated, “The GMAS often contains
questions at a DOK level of 2 or 3. Whereas in the classroom, the formative assessments may be
at a DOK level of 1 or 2. Students who struggle in third grade, particularly in Reading, will be
behind in upper grades, making it hard to pass future state tests at a high level.”
Teacher Expectations. In the next dimension of the survey, respondents had to answer
questions relating to expectations they have for student performance on summative and
formative assessments. The responses to all three questions in this dimension in Table 16
showed that the majority of teachers have high expectations of student performance regardless
the type of assessment. Whether the assessment was used in the classroom for formative
assessment purposes or summative assessment purposes, this data shows that the majority of
teachers have high expectations for students’ academic performance.
Table 16
Survey Responses on Teacher Expectations
Survey Respondents
Question Response f %
Q14. Teachers have high expectation s for the
performance of all students on the state-
mandated test (GMAS).
Strongly Disagree
Disagree
Neutral
Agree
Strongly Agree
0
2
11
25
25
0
3
17
40
40
Q15. Teachers have high expectations for the
performance of all students on their graded
formative assessments.
Strongly Disagree
Disagree
Neutral
Agree
Strongly Agree
1
2
7
23
30
2
3
11
37
48
Q23. Teachers have high expectations for the in-
class academic performance of students in my
school.
Strongly Disagree
Disagree
Neutral
Agree
Strongly Agree
0
2
8
25
28
0
3
13
40
44

ARE TEACHERS’ FORMATIVE ASSESSMENTS RELIABLE?
100
However, even though many of the teachers indicated that they have high expectations
for their students, open-ended responses from some respondents show a contrasting picture. All
teachers surveyed do not expect that their students will perform well on both the summative and
formative assessments. One teacher reported, “Many students achieve higher grades in the
classroom compared to their scores on the Georgia Milestones test results.” Also, some teachers’
expectations of student performance on the GMAS and on classroom formative assessments vary
for a plethora of reasons. One teacher stated,
I feel the grades the students make on assessments taken weekly and daily do not add up
to how they perform on the GMAS. There are a lot of variables associated with it. In a
low socio-economic school, their (students) focus is merely dedicated to doing the best
they can. Usually, the students give 100% percent to completing the GMAS and getting
a score of “Developing” and some will prove to be “Proficient”. It’s the hard work and
the teachers working ten times harder than the average teacher to attain the scores. A lot
of times you witness students who have achieved all year long (Honor Roll) and end up
not passing the GMAS, while others are barely in the Developing stages.
GMAS Influence on Teacher Practice. Next, several questions on the survey required
respondents to consider how administering the GMAS may influence their practices in the
classroom. Teachers were asked about how often their students’ GMAS results impacted their
teaching. Forty-eight percent (48%) of district teachers stated that their students’ scores
impacted their teaching daily. In contrast, none of the teachers stated that the GMAS results
never influenced their teaching (see Figure 19).

ARE TEACHERS’ FORMATIVE ASSESSMENTS RELIABLE?
101
Figure 19. GMAS Impact on Teaching.
Next, teachers were asked about the type of instructional activities that are impacted by
the results from the state-mandated test (GMAS). The top 3 activities (see Figure 20) that are
impacted by GMAS for district teachers were: plan instruction (67%), give feedback to students
(60%) and select instructional materials (59%). These findings may prove to be interesting to
some readers because the results from the summative assessment are reported at the end of the
school year. It could also be argued that using the summative assessment results to plan for
instruction, select instructional materials, and give feedback to students are practices that could
be associated more with formative assessment which shows an even greater impact that the
summative assessment system has on the day-to-day formative assessment practices of
educators.
Several teachers made comments about specific changes to instruction and formative
assessment practices that need to happen to improve student achievement on the GMAS. One
teacher proposed that, “We need to do more written responses in our testing strategies that
30, 48%
12, 19%
5, 8%
2, 3%
3, 5%
9, 14%
2, 3%
Q29. How often do your OWN students' results on the state-mandated test (GMAS)
influence your teaching? (Mark only one response.)
Daily
A few times a week
A few times a month
A few times a year
Never
I did not receive students' test results in time to
use them.
I teach a grade and/or subject that does not
receive students' test results.
I teach a grade and/or subject that should get
students' results but did not receive them.
ARE TEACHERS’ FORMATIVE ASSESSMENTS RELIABLE?
102
explain how we come to conclusions and not just looking for a quick answer.” A second teacher
stated, “I think that the high level questioning should be evident in instruction and classwork to
prepare students for the rigor of the test, realizing that there are various levels of questioning.”
Another teacher recommended that we examine the rigor in our instructional practices and hold
teachers in the lower grades more accountable for student performance. He/she stated,
I do not believe some students have the same rigor in the classroom that they have on the
GMAS. This is sometimes due to the makeup of the class or the teachers not
differentiating for the students that can be pushed. Also, the students are not accustomed
to the rigor when they get to the upper grades because they aren't used to the high
expectations and the higher level of thinking that goes into reading and math. Teachers in
the lower grades who are not tested need to be held to a greater accountability.
Also, there was one teacher that felt that in order for students to perform better on the
GMAS, the content must be more relevant to their lives. He/she commented, “Students have to
internalize the test and the effect it plays in their instruction and its relationship to their future
goals and educational pursuit.”

ARE TEACHERS’ FORMATIVE ASSESSMENTS RELIABLE?
103
Figure 20. GMAS Impact on Instructional Activities.
Finally, with the survey results showing that some teachers allow the results of the
GMAS to influence instructional practices and activities, 45% of district teachers reported that
the state-mandated testing program (GMAS) leads some teachers in their schools to teach in
ways that contradict their own ideas of good educational practice. Because this finding was not
complemented with additional comments from teachers, further investigation may be warranted.
Research Question 3
The third research question was: How well do teachers’ formative assessments align to
the rigor of the standardized assessment at the appropriate level of complexity? To answer this
question, this researcher observed and analyzed the formative assessment practices at Oak Hill
Elementary, one of the 35 Title I schools in the Georgia urban school district studied. This
researcher is considered a participant observer because she serves as the instructional coach for
6
8
7
35
38
22
42
37
35
33
37
0 5 10 15 20 25 30 35 40 45
None of the above
Do not get the results back in time to use them
Determine student grade (in whole or in part)
Give feedback to parents
Give feedback to students
Plan curriculum
Plan my instruction
Select instructional materials
Assess my teachnig effectiveness
Evaluate student progress
Group studens within my class
Q30. Do YOU use the results of the state-mandated test (GMAS) for any of the following activities?
(Mark ALL that apply.)

ARE TEACHERS’ FORMATIVE ASSESSMENTS RELIABLE?
104
the teachers participating in this study from Oak Hill. Demographic information for each
participating teacher is presented in Table 17 below.
Table 17
Participant Demographics
Participant
Pseudonym
Grade Approximate
Age
Race Gender Years of
Experience
Subjects
Taught Dana 3rd Grade Late 20s African-American Female 6 All Subjects
Vivian 3rd Grade Mid 40s African-American Female 23 All Subjects
Saul 3rd Grade Late 40s African-American Male 22 Math &
Science
Rachael 4th Grade Mid 50s African-American Female 25 Mathematics
Bethany 4th Grade Early 30s African-American Female 10 Math (SWD)
Kelly 5th Grade Late 40s African-American Female 15 Mathematics
Barbara 5th Grade Early 50s African-American Female 24 Math (SWD)
Oak Hill Elementary School in which the case study was conducted has a student
population of about 430 students in grades Pre-Kindergarten to fifth grade. All of Oak Hill’s
students receive free or reduced priced lunch, but 72% of its students are directly certified as
economically disadvantaged. Oak Hill’s student population is 99.7% non-white with African-
Americans (almost 85%) as the most prevalent subgroup of the population and Hispanics (15%)
as the second highest subgroup. Less than 1% of the school’s population consists of multi-racial
students. English language learners comprise 10.19% of Oak Hill’s population, and Students
with Disabilities (SWD) make up 13.5% of the school’s population. Based on the College and
Career Ready Performance Index (CCRPI), Oak Hill, as a school, received a C letter grade in
2019 for a CCRPI score of 76.4. The CCRPI score is calculated based upon standardized test
scores, student growth on the test, graduation rates and other factors (GOSA, 2019).
After approval for the case study and teacher consent was obtained, data was collected
for a period of four weeks to gain insight into teachers’ formative assessment practices to see if
the practices and the assessments, themselves, align appropriately to the Georgia Milestones

ARE TEACHERS’ FORMATIVE ASSESSMENTS RELIABLE?
105
assessment. Each of the seven teachers’ mathematics classes was observed three times using the
Formative Assessment Rubrics, Reflection and Observation Tools to Support Professional
Reflection on Practice (FARROP). The following dimensions of this observation instrument
were utilized:
• Learning Goals – This dimension focuses on how well the teacher aligns learning
goals to the Georgia Standards of Excellence (GSE) and communicates those
goals to students.
• Criteria for Success – This dimension investigates how well students understand
what quality work looks like in relationship to the GSE standard.
• Tasks and Activities to Elicit Evidence of Learning – This dimension focuses on
evidence of student learning and mastery of GSE standards produced by students
during the lesson.
• Feedback Loops During Questioning – This dimension focuses on how well the
teacher provides ongoing feedback regarding student mastery of the standards
during the lesson.
• Descriptive Feedback – This dimension focuses on the teacher’s role in
providing individualized feedback to students with regards to the success criteria
established.
• Use of Evidence to Inform Instruction – This dimension focuses on how
formative assessment is used to adjust instruction as needed to improve students’
mastery of the standards.
Analysis of these classroom observations included quantitative and qualitative measures.
First, a descriptive summary of each observation was made. Each dimension of the observation

ARE TEACHERS’ FORMATIVE ASSESSMENTS RELIABLE?
106
instrument requires scores from the FARROP rubric (i.e. 1 – Beginning; 2 – Developing; 3 –
Progressing; 4 – Extending). This numerical information was described in detail and analyzed.
Next, the notes from the observation instruments were organized in a table and the data was
coded, themes highlighted and patterns in teacher practices described (Merriam, 2009).
Following each observation, individual teachers were engaged in semi-structured
interviews to gain more insight on their perspectives. The post-observation questions included:
• What was the learning goal(s) for the lesson? Did students achieve that goal?
How do you know?
• What evidence of student learning was collected? What is the next step?
• Using the Georgia Milestones Achievement Level Descriptors, how well-aligned
is your lesson to the intent of the standard?
Also, during these three post-observation interviews, teachers along with the researcher
analyzed the formative assessments used noting whether or not the formative assessment that
was used for grading purposes was aligned to the standard at the appropriate level of complexity.
To determine this, the GMAS Achievement Level Descriptors and Hess’s Cognitive Rigor
Matrix for mathematics and science were used as guidelines (Hess, 2009). Hess’s Cognitive
Rigor Matrix is a tool that combines Benjamin Bloom’s taxonomy (Anderson, 2014) and
Norman Webb’s Depth of Knowledge (Webb, 1997) and is often used by educators when
designing assessment items and performance tasks to determine what cognitive rigor should look
like (Hess, 2014). Hess’s Cognitive Rigor Matrix was used in conjunction with the GMAS
Achievement Level Descriptors to provide more information about the cognitive demand
required by each formative assessment. A variety of formative assessments were collected and

ARE TEACHERS’ FORMATIVE ASSESSMENTS RELIABLE?
107
analyzed from each teacher but had to include the following: (1) an exit ticket, (2) a homework
assignment, and (3) a constructed response item from a quiz.
Formative Assessment Teacher Profiles
The following narratives will be used to report the findings of the classroom
observations, post-observation conferences, and student work analysis to gain more insight into
formative assessment practices and teacher perspectives and answer the following research
question: How well do teachers’ formative assessments align to the rigor of the standardized
assessment at the appropriate level of complexity?
Dana. Dana is an African-American female in her late 20s who has been teaching for six
years. She teaches a reduced-model EIP (Title I – Early Intervention Program) third grade class
which means that she teaches a relatively small, mixed ability group of students. Out of Dana’s
sixteen third graders, there are four students that have been identified as EIP or “at-risk of not
reaching or maintaining academic grade level” (Donald, 2018, p. 3). Dana’s class has several
English Language Learners (ELLs) that do receive services earlier in the school day but
participate in Dana’s entire math block. Also, during her math block, Dana serves two Students
with Disabilities (SWD) children that return to her classroom for an extra dose of math after
receiving pull-out services from a special education teacher.
Dana is returning to education after staying home with her child for about five years.
Dana presents herself as a cooperative, caring educator that works well with her grade level team
during the weekly collaborative planning sessions and tries to follow the scope and sequence
documents provided by our district to the best of her ability. However, many times her pacing
lags behind her peers on the grade level because she is concerned that her “students are not ready
to move on yet.” Dana has difficulty staying on the district’s pacing because she stretches out one

ARE TEACHERS’ FORMATIVE ASSESSMENTS RELIABLE?
108
math lesson over the course of several days to ensure that her students “have the concept.” This
means that activities may be repeated and additional instruction may take place before her
students take the assessment that has been planned for that particular group of lessons.
Classroom Formative Assessment Practices. Analysis of Dana’s formative assessment
practices showed that she scored in the Progressing level throughout each of the dimensions of
the FARROP observation instrument (see Appendix H). Dana consistently presented a clear
focus for her math lessons by stating the learning goal aligned to the standard. However, this
practice could have been enhanced by making connections to what had been previously learned.
With regards to the student work/formative assessments given to students, Dana selected
formative assessments and assigned grades to tasks that were aligned to learning targets within
the standard. This provided information about how students were progressing towards mastery
of skills within the standard, instead of the standard as a whole. During each observation, Dana
made it a practice to post a teacher exemplar and then shared student exemplars as examples of
what made a “good answer”.
Additionally, there was evidence that Dana used the information from the formative
assessments to inform her practice. During one of the debriefing sessions, she expressed the
following concern:
The Exit Ticket showed that most of my students just weren’t ready. I just can’t move on
and allow them to fail. The concepts build on each other. If I move on too fast, the kids
will have gaps in their knowledge and won’t demonstrate mastery on the test.
Alignment of Dana’s Formative Assessments. Dana’s selection of formative
assessments came from a variety of resources (i.e. textbook publisher, web-based and created by
herself and/or team). Using the GMAS Achievement Level Descriptors, 2 of the 3 formative

ARE TEACHERS’ FORMATIVE ASSESSMENTS RELIABLE?
109
assessments were constructed on the Developing Level which means that students who
demonstrated mastery on these formative assessments should possess the skills needed for them
to perform on the Developing Level of the GMAS. Dana’s web-based homework assignment
and teacher-created quiz would need to be adjusted in order to require her students to
demonstrate skills necessary for performing at the Proficient Level and above on the GMAS (see
Table 18).
Table 18
Formative Assessment Analysis–Dana
Assessment
Type
Origin Standard
Alignment
Achievement
Level
Descriptors
Rating
Hess’s
Cognitive
Rigor
Matrix
Level
How Might the Task be
Adjusted to Meet the Proficient
Level and/or Beyond?
Exit Ticket Textbook
Publisher
3.NF.3 Distinguished DOK 2/
Analyze
Homework Web-
based
Resource
3.NBT.2 Developing DOK 1/
Apply
Use place value relationships
to explain arithmetic patterns.
Quiz Teacher
Created
3.NF.2 Developing DOK 2/
Understand
Understands fractions in terms
of intervals on a number line.
Vivian. Vivian is an African-American female in her mid 40s who has been teaching for
a total of 23 years. Vivian’s third grade class is also comprised of a mixed-ability group of 16
students. Three of her students are in the EIP program, 3 students are ELL, and 3 students are
SWD. Although her ELL and SWD students leave Vivian’s classroom at various times during
the day, all 16 students are present during her math block which gives the SWD students an extra
dose in math.
Vivian is an experienced educator who feels very comfortable in math. She is also
extremely comfortable with the math curriculum resources that the school has chosen to use
because she piloted the program in our school for a year before the school’s decision to use these

ARE TEACHERS’ FORMATIVE ASSESSMENTS RELIABLE?
110
curricular resources on a school-wide basis. For this reason, Vivian is responsible for writing the
math plans for her third grade team and leads out in sharing math resources during weekly
collaborative planning sessions.
Classroom Formative Assessment Practices. Vivian’s formative assessment practices
ranged from the Beginning to the Developing Level using the FARROP observation instrument
(see Appendix H). Observation of Vivian’s math classes showed that she did not make it a
practice to share a standards-driven learning goal with students. At the beginning of each lesson,
students were told what the topic was for the day. Also, students were not provided with clear
expectations of success for their work, and the feedback given to students regarding their work
lacked specificity (see Appendix H). This lack of attention to the details of the standard was also
reflected in the formative assessments that she selected for her students. The majority of the
formative assessments she gave and used for grading purposes were aligned to the standard at the
topic level, but did not encompass the full meaning of the standard. With regards to using the
formative assessments to guide instruction, Vivian stated that she was more concerned with
covering the content in time for the GMAS administration. In her words, she needed to “keep
moving.”
Alignment of Vivian’s Formative Assessments. Vivian’s selection of formative
assessments also come from a variety of resources (i.e. textbook publisher, web-based and
created by herself and/or team). However, 2 of the 3 formative assessments analyzed were
constructed at the Beginning Level. Although her students may demonstrate mastery on these
assessments, it is implied that they were not rigorous enough to allow students to demonstrate
mastery of grade level standards according to the GMAS Achievement Level Descriptors (see
Table 19).

ARE TEACHERS’ FORMATIVE ASSESSMENTS RELIABLE?
111
Table 19
Formative Assessment Analysis –Vivian
Assessment
Type
Origin Standard
Alignment
Achievement
Level
Descriptors
Rating
Hess’s
Cognitive
Rigor
Matrix
Level
How Might the Task be
Adjusted to Meet the Proficient
Level and/or Beyond?
Exit Ticket Web-
based
Resource
3.NF.3 Beginning DOK 1/
Remember
Compare fractions with the
same numerator or same
denominator.
Homework Textbook
Publisher
3.NF.1 Beginning DOK 1/
Understand
Vary the kind of model used
(i.e. area model or number
line).
Quiz Teacher
Created
3.NF.3 Proficient DOK 1/
Understand
Require an explanation of
equal partitions of one or more
wholes or intervals on a
number line.
Saul. Saul is an African-American male in his late 40s with 22 years of experience in
education. Saul team-teaches a group of nineteen third graders with another teacher. However,
Saul is responsible for the math and science instruction in that classroom. Because our number
of third grade at-risk EIP students was so great, Saul’s class was created before the first quarter
of school ended to provide services for these students. Saul’s class is considered a Title I
Augmented class with 14 of his 19 students classified as EIP. This class is in the Augmented EIP
model because another teacher is provided to reduce the teacher/pupil ratio.
Saul is an experienced educator and is confident in his math instruction because before
this assignment, he served the past five years as an EIP pull-out teacher that removed EIP
students from the classroom and provided math instruction to students that needed this type of
small group intervention. However, this year is different for Saul because he has to teach a full
classroom of students and is encouraged to plan his instruction with the third grade team. Saul
has proven to be a team player and is extremely cooperative.

ARE TEACHERS’ FORMATIVE ASSESSMENTS RELIABLE?
112
Classroom Formative Assessment Practices. Saul’s formative assessment practices
ranged from the Developing to the Progressing Level using the FARROP observation instrument
(see Appendix H). Saul did consistently communicate learning goals to students and did model
expectations for student success. Also, the analysis of the formative assessments that he selected
did show that they were properly aligned to the standard at the appropriate level of complexity.
However, Saul could have improved his formative assessment practices by providing descriptive
feedback to students regarding their performance on formative assessments. Feedback given to
students in Saul’s math classes was generally brief and non-descript, such as “Good” or “You
Got it!” Students were not provided detailed evidence that explained their progress towards
mastery of the standard.
Alignment of Saul’s Formative Assessments. All three of Saul’s formative assessments
were analyzed and were found to be constructed at the Proficient Level or above using the
GMAS Achievement Level Descriptors rating. This would imply that demonstrating mastery on
these formative assessments would show that students possessed the skills needed to demonstrate
proficiency or above in these areas on the GMAS (see Table 20).
Table 20
Formative Assessment Analysis–Saul
Assessment
Type
Origin Standard
Alignment
Achievement
Level
Descriptors
Rating
Hess’s
Cognitive
Rigor
Matrix
Level
How Might the Task be
Adjusted to Meet the Proficient
Level and/or Beyond?
Exit Ticket Teacher
Created
3.NF.2 Distinguished DOK 2/
Analyze
Homework Teacher
Created
3.NF.3 Proficient DOK 2/
Analyze
Compare fractions with the
same numerator or same
denominator.
Quiz Teacher
Created
3.NF.3 Proficient DOK 1/
Apply
Explain understanding of
fractional equivalence and
comparisons.
ARE TEACHERS’ FORMATIVE ASSESSMENTS RELIABLE?
113
Rachael. Rachael is an African-American female in her mid 50s with 25 years of
experience in education. Rachael is the mathematics teacher for all of our fourth grade students.
Our school is departmentalized on the fourth grade level with 3 different teachers (i.e. one Math;
one Reading/ELA; one Science/Social Studies). Each mixed-ability group of homeroom
students rotates with their entire class from teacher to teacher throughout the day. Within each
class, there is a variety of EIP, ELL, and SWD students. However, during one math block,
Rachael team-teaches with another EIP teacher to augment that class setting. During another
math block, a special education teacher pushes in to team-teach and provide services for a large
number of SWD students.
Rachael is extremely confident in teaching mathematics. For most of her career, she has
taught either fourth or fifth grade mathematics and chooses to work in schools where math is
departmentalized on the elementary school level. Rachael is responsible for the fourth grade
mathematics plans. However, she does use weekly math collaborative planning time to plan with
the fourth grade EIP teacher and the fourth grade special education teacher.
Classroom Formative Assessment Practices. Observation of Rachael’s math classes
often showed that her formative assessment practices ranged from the Progressing to the
Extending levels using the FARROP instrument (see Appendix H). Rachael consistently
communicated the daily learning target to students and made it a practice to model several
examples for students to provide them with an exemplar. She also frequently provided students
with a checklist to ensure that they were familiar with the success criteria and required that they
use the checklist to self-assess their work. When examining, the formative assessments that
Rachael used, it was found that they were often aligned to specific learning targets for each class
period. While indeed aligned to learning targets, these formative assessments did not meet the

ARE TEACHERS’ FORMATIVE ASSESSMENTS RELIABLE?
114
full intentionality of the standard. In debriefing sessions, Rachael made it clear that it was
important for her to use these formative assessments to track student progress and provide
evidence for the weekly grade/progress reports given to students and their parents.
Alignment of Rachael’s Formative Assessments. Rachael also used formative
assessments from a variety of sources. However, two of the three formative assessments we
analyzed for Rachael were constructed at the Developing Level. Students scoring at the
Developing Level are approaching but have not reached standards mastery. These formative
assessments are not in total alignment with the standards according to the GMAS Achievement
Level Descriptors (see Table 21).
Table 21
Formative Assessment Analysis–Rachael
Assessment
Type
Origin Standard
Alignment
Achievement
Level
Descriptors
Rating
Hess’s
Cognitive
Rigor
Matrix
Level
How Might the Task be
Adjusted to Meet the Proficient
Level and/or Beyond?
Exit Ticket Textbook
Publisher
4.NBT.4 Developing DOK 2/
Apply
Recognize/Explain whole
number patterns in base ten.
Homework Web-
based
Resource
4.NBT.2 Developing DOK 2/
Analyze
Uses place value to
symbolically order and compare
numbers.
Quiz Teacher
Created
4.NF.2 Proficient DOK 2/
Analyze
Create common denominators
to compare.
Bethany. Bethany is an African-American female in her early 30s who is a special
education educator of ten years. Bethany’s case load consists of fourth grade SWD students with
a variety of exceptionalities. Bethany serves these students in several capacities. She team-
teaches with Rachael for one block of the school day. During this time, she pushes into the
classroom and utilizes one of three different co-teaching models. During some classes, the One
Teach-One Assist model is used, in which Rachael teaches the class while Bethany assists
ARE TEACHERS’ FORMATIVE ASSESSMENTS RELIABLE?
115
individual students as needed and helps to manage behavior. Other times, Bethany and Rachael
parallel teach in which they divide the students and both teach the same content using different
resources and/or strategies. The third co-teaching model that they use is the alternative teaching
model in which they split up the group and teach different content. This model is used mainly
after an assessment, and there is a group of students that need to be re-taught the content before
moving on.
Bethany is also responsible for teaching a small group of SWD fourth graders during an
additional math block. During this block, Bethany is able to use the student’s IEP
(Individualized Education Plan) to teach grade level standards by deconstructing the standard
and working on individual skills that each student needs.
Classroom Formative Assessment Practices. Using the FARROP observation instrument
in Bethany’s math classes showed that Bethany consistently performed at the Extending level
with regards to formative assessment practices (see Appendix H). Bethany consistently
communicated learning goals to students and deconstructed the standards to identify specific
skills that students should be able to do in order to demonstrate mastery of the standard. Bethany
used the deconstructed standard to create a matrix of skills and then created formative
assessments for each of the skills/learning targets within the matrix.
In Bethany’s math class, it was observed that each of her special education students may
have been working on a different task/skill within the matrix. Bethany made it a practice to
move throughout the classroom, giving each student individualized feedback on their work
which helped them to know how to improve. After a student demonstrated mastery of a skill
within the matrix, the student was then taught and formatively assessed on the next skill within
the standard’s matrix.

ARE TEACHERS’ FORMATIVE ASSESSMENTS RELIABLE?
116
Although Bethany had an ongoing process for using formative assessments in her
classroom, these assessments based on learning targets were not used for grading purposes.
When asked to explain, she stated,
It’s not time to give grades yet. I have to use this information to let me know what skills
within the standard that my students can show mastery. These tasks just help me to know
what they can do and whether or not they are ready to move to the next skill. I have to do
all of this before I create an assessment for grading that is totally aligned to the standard.
Alignment of Bethany’s Formative Assessments. Bethany’s formative assessments were
created by her. After deconstructing the standard into distinct skills, she created tasks for her
students that encompassed multiple skills and showed the full intent of the standard. All of the
assessments that she shared and we analyzed together were constructed at the Proficient Level or
above using the GMAS Achievement Level Descriptors (see Table 22).
Table 22
Formative Assessment Analysis–Bethany
Assessment
Type
Origin Standard
Alignment
Achievement
Level
Descriptors
Rating
Hess’s
Cognitive
Rigor
Matrix
Level
How Might the Task be
Adjusted to Meet the Proficient
Level and/or Beyond?
Exit Ticket Teacher
Created
4.NF.4 Proficient DOK 2/
Apply
Solves word problems with
multiplication of fractions.
Homework Teacher
Created
4.NF.4 Proficient DOK 2/
Apply
Explains multiplication of
fractions by whole numbers.
Quiz Teacher
Created
4.NF.4 Distinguished DOK 3/
Analyze
Kelly. Kelly is an African-American female in her late 40s with 15 years of experience.
She is responsible for teaching math to all of our fifth grade students. Our fifth grade is also
departmentalized with 1 teacher for Mathematics, 1 teacher for Reading/ELA, and 1 teacher for
Science/Social Studies. However, our fifth grade students have been homogeneously grouped at

ARE TEACHERS’ FORMATIVE ASSESSMENTS RELIABLE?
117
the beginning of the school year using summative assessment data from the previous year’s
Georgia Milestones assessment and the STAR Math assessment given at the beginning of the
school year. We have three homogeneous instructional groups–Lions (Low-Achieving), Mastiffs
(Mid-Achieving), and Hyenas (High-Achieving). These instructional groups are fluid and
changes are made throughout the year based upon formative assessment data and teacher
observations.
Kelly is responsible for the mathematics plans for fifth grade but works collaboratively
with the fifth grade special education teacher to plan instruction weekly and analyze student data.
Kelly has been teaching only fifth grade mathematics for the past five years and each year is
growing her capacity and confidence in the content. Kelly is a firm but caring teacher and
welcomes any support that is given.
Classroom Formative Assessment Practices. Observation of Kelly’s math classes
showed that her formative assessment practices ranged from the Progressing to the Extending
levels using the FARROP observation instrument (see Appendix H). It was Kelly’s practice to
begin each lesson communicating the learning target to students. Kelly also repeatedly modeled
expectations for students and created formative assessments that were appropriately aligned to
the standard.
However, Kelly’s formative assessment practices could have been improved with regards
to providing descriptive feedback to students. As students worked independently, Kelly’s
practice was to make laps around the room, marking up students’ papers with a rating code:
• Smiley face – Student has mastered the concept.
• Check – Student is moving in the right direction and needs more “at-bats”.
• Question Mark – Student is unsure, still has questions, and needs re-teaching.

ARE TEACHERS’ FORMATIVE ASSESSMENTS RELIABLE?
118
When asked about her rating code, Kelly stated that the symbols were for her use, not necessarily
for the students. The code was used for instructional grouping. She used the code to determine
who would be called back to her table during the small group time to receive additional
instruction.
Alignment of Kelly’s Formative Assessments. Kelly selected formative assessments
from a variety of sources. Using the GMAS Achievement Level Descriptors, all three of the
assessments that were analyzed were constructed at the Proficient Level of the GMAS. In other
words, the tasks required students to demonstrate mastery of skills that were needed to be
considered Proficient in that particular standard (see Table 23).
Table 23
Formative Assessment Analysis–Kelly
Assessment
Type
Origin Standard
Alignment
Achievement
Level
Descriptors
Rating
Hess’s
Cognitive
Rigor
Matrix
Level
How Might the Task be
Adjusted to Meet the Proficient
Level and/or Beyond?
Exit Ticket Textbook
Publisher
5.NF.3 Proficient DOK 1/
Apply
Solves multistep problems in
division of fractions.
Homework Web-
based
Resource
5.NF.3 Proficient DOK 1/
Apply
Solves multistep problems in
division of fractions.
Quiz Teacher
Created
5.NF.3 Proficient DOK 3/
Apply
Solves multi-step problems in
multiplication of fractions and
mixed numbers.
Barbara. Barbara is an African-American female in her early 50s with 24 years of
experience with special education students. Barbara’s case load consists mainly of fifth graders
which means that she co-teaches with Kelly for one period of the day. The co-teaching model
that Barbara and Kelly mainly use is the Tag Team model in which they both deliver instruction.
This Tag Team model is not generally planned but is spontaneous and is usually characterized
with Kelly beginning the instruction that she has planned and Barbara jumping in to demonstrate

ARE TEACHERS’ FORMATIVE ASSESSMENTS RELIABLE?
119
a different strategy or add to the lesson in some way. Barbara and Kelly have an excellent
rapport with each other that makes this co-teaching model possible.
Barbara is also responsible for pulling out five SWD fifth graders for more individualized
math instruction related to their IEPs. During this math block, the instruction parallels the
lessons that the fifth graders get in Kelly’s math class but gives the students time for additional
practice and support.
Classroom Formative Assessment Practices. Observation of Barbara’s formative
assessment practices showed that she ranged from the Beginning to the Developing level using
the FARROP observation instrument (see Appendix H). Barbara did not take the time to
communicate learning goals to students and made it a practice to model only one example for
students before asking them to try the task on their own. Therefore, students were frequently
confused about the concept and were unclear about expectations. When asked about this
process, Barbara stated that it was important for her students to learn to work independently.
After trying on their own, she would then go back and model problems that presented the most
difficulty for students. Barbara stated:
I walk around while students are working independently to see what they can do by
themselves. I don’t want to hold their hands like most people do with special education
students. It does no good for them. After I see what the majority of them are having
difficulty with, I then guide them slowly through the steps so they can get it.
In addition to scoring low in formative assessment practices, analysis of Barbara’s
formative assessments used for grades showed their lack of alignment to grade level standards.
It was found that Barbara placed an emphasis on giving her special education students
assignments that she felt could be completed independently instead of scaffolding instruction,

ARE TEACHERS’ FORMATIVE ASSESSMENTS RELIABLE?
120
modeling expectations and requiring them to complete assignments based upon grade level
standards (i.e., the standards that are tested on the GMAS).
Alignment of Barbara’s Formative Assessments. Barbara selected formative
assessments from a variety of sources. Two of her assessments were rated at the Proficient Level
using the GMAS Achievement Level Descriptors. However, one assignment that was used for
grading purposes was not even rated at the Beginning Level because it was based on a concept
that should be taught and assessed at the previous grade level (see Table 24).
Table 24
Formative Assessment Analysis–Barbara
Assessment
Type
Origin Standard
Alignment
Achievement
Level
Descriptors
Rating
Hess’s
Cognitive
Rigor
Matrix
Level
How Might the Task be
Adjusted to Meet the Proficient
Level and/or Beyond?
Exit Ticket Textbook
Publisher
5.NF.6 Proficient DOK 1/
Apply
Solves multistep problems with
areas of rectangles.
Homework Web-
based
Resource
4.NBT.4
(Below
Grade
Level)
Below Grade
Level
DOK 1/
Apply
Combine with a 5th grade
measurement standard to make
connections to the current grade
level.
Quiz Teacher
Created
5.NF.6 Proficient DOK 1/
Apply
Fluently multiplies fractions by
whole numbers.
Cross-Analysis of Participants’ Findings
After examining the formative assessment practices of each of the participating teachers
and working with them to analyze their formative assessments for alignment to the Georgia
Milestones, several findings emerged. The following provides an analysis of the classroom
observations that examined teachers’ formative assessment practices along with an analysis of
trends discovered through an analysis of teacher formative assessments used for grading
purposes.

ARE TEACHERS’ FORMATIVE ASSESSMENTS RELIABLE?
121
FARROP Findings. Each teacher was observed three times and then received a rating in
each of the dimensions regarding their formative assessment practices using the Formative
Assessment Rubrics, Reflection and Observation Tools to Support Professional Reflection on
Practice (FARROP) rubrics. The rubrics for each dimension help to describe the combined role
of the teacher and students in a particular formative assessment dimension. It should be noted
that the ratings represent the teacher’s level of implementation of formative assessment practices,
not their level of expertise (Wylie & Lyon, 2013). There are 4 levels of implementation in the
FARROP rubric: (1) Beginning, (2) Developing, (3) Progressing, and (4) Extending.
With regards to Learning Goals, the average rating for the teachers was 2.86 (SD =
1.345) with most of the teachers scoring a rating of 4. It was found that most of the teachers did
present standards-driven learning goals for the lesson but may or may not have presented the
goals in language that students could understand or use to make connections to previous
learning.
In the next dimension, Criteria for Success, teachers were expected to communicate to
students what quality work looks like. The mean rating in this area was 2.71 (SD = 1.254) with a
mode of 3. It was found that some teachers may have modeled expectations for students but did
not allow an opportunity for students to internalize the success criteria in a way that they
effectively understood what was required. Teachers that were rated on the Extending Level of
this dimension provided a teacher exemplar, shared student exemplars and had discussions to
clarify expectations.
With regards to Tasks & Activities to Elicit Evidence of Student Learning, the average
teacher rating was 2.86 (SD = 1.069) with a mode of 3. The evidence showed that most teachers
chose tasks that were related to the learning goal. However, some of the teachers neglected to

ARE TEACHERS’ FORMATIVE ASSESSMENTS RELIABLE?
122
choose a variety of tasks and activities to provide evidence for student mastery of standards and
may not have appropriately used the evidence for the tasks to evaluate learning.
When examining feedback, the average teacher rating in the dimension, Feedback Loops
During Questioning was a 3 (SD = 1.0) with a bimodal rating of 4 and 2. This showed that
teachers varied greatly in the practice of engaging students in discussion to discern
understanding of the content. Also, it was found that most of the teachers needed improvement
in the practice of using student work to provide evidence-based feedback to individual students
regarding clear targets for improvement. The mean rating for this dimension was 2.71 (SD =
1.113).
Finally, in the dimension of Use of Evidence to Inform Instruction, teachers received a
mean rating of 2.71 (SD = .756) with a bimodal rating of 2 and 3. The observation data showed
that even though teachers collected evidence of student learning, in most cases this evidence was
not used to adjust instruction across a series of lessons as a whole. It was found that the majority
of teachers were more concerned with documenting student performance and moving on to the
lesson/concept. Figure 21 and Table 25 provide a summary of the FARROP observation data.

ARE TEACHERS’ FORMATIVE ASSESSMENTS RELIABLE?
123
Figure 21. Teacher Ratings Using the FARROP Instrument.
Table 25
Mean Ratings for FARROP Dimensions (N=7)
Descriptive
Summary
Learning
Goals
Criteria of
Success
Tasks and
Activities
to Elicit
Evidence
of
Learning
Feedback
Loops
During
Questioning
Descriptive
Feedback
Use of
Evidence
to Inform
Instruction
Mean 2.86 2.71 2.86 3.00 2.71 2.71
Median 3.00 3.00 3.00 3.00 3.00 3.00
Mode 4 3 3 2a 2a 2a
Std.
Deviation
1.345 1.254 1.069 1.000 1.113 .756
Note. a Multiple modes exist. The smallest value is shown.
Analysis of FARROP Findings. Analysis of the formative assessment practices of
teachers in this Title I school showed a variety of levels of implementation of formative
assessment practices in standards-driven classrooms. The data shows that providing descriptive
feedback to students tied to specific learning goals and success criteria is an area of improvement
3 3 3 3 3 3
1 1
3
2 2
33 3
2 2 2 2
4 4 4 4 4
3
4 4 4 4 4 44
3 3
4
3
2
1 1 1
2
1
2
0
0.5
1
1.5
2
2.5
3
3.5
4
4.5
Learning Goals Criteria of Success Tasks & Activities to
Elicit Evidence of
Learning
Feedback Loops During
Questioning
Descriptive Feedback Use of Evidence to Inform
Instruction
FA
RR
OP
Ob
serv
ati
on
Ru
bric
Ra
tin
gAnalysis of Formative Assessment Practices
Dana Vivian Saul Rachael Bethany Kelly Barbara
ARE TEACHERS’ FORMATIVE ASSESSMENTS RELIABLE?
124
for this group of teachers. Additionally, the teacher’s use of evidence gathered from formative
assessments to inform instruction is an area that should be improved.
Analysis of Formative Assessments. Teachers were asked to bring to debriefing
sessions, three formative assessments that were used for grading purposes: one Exit Ticket, one
Homework, and one Constructed-Response Item from a Quiz. The formative assessments were
analyzed using the Georgia Milestones Achievement Descriptors and Hess’s Cognitive Rigor
Matrix. Below is a summary of the findings (see also Figure 22 and Table 26).
Homework. It was found that out of the three types of assessments, homework
assignments were the least aligned to the Georgia Milestones at the appropriate level of
complexity with a mean rating of 2.14. Homework is a requirement for students in this school
district and comprises 10% of the total mathematics grade. It is considered additional practice on
concepts that have been introduced in the classroom. Because the majority of the homework
assignments analyzed were rated at the Developing Level, this would imply that teachers send
assignments home that may be easier than what is required for students to perform at the
Proficiency Level on the Georgia Milestones Assessment. This may present conflicting
messages to parents and students about the level of rigor required for the GMAS.
Exit Tickets. Exit Tickets were the next highest rated assessment in alignment using the
GMAS Achievement Level Descriptors. At Oak Hill, Exit Tickets are considered part of
classwork and are used to formatively assess to what degree the students mastered the concepts
taught in math class for that day. Exit Tickets and other classwork comprise 40% of the total
math grade for students. The Exit Tickets analyzed from Oak Hill’s teachers showed that the
mean rating was 2.86. The mode for Exit Tickets was 3. In other words, most of Oak Hill’s
teachers selected or designed Exit Tickets that were aligned to at least the Proficient Level of the

ARE TEACHERS’ FORMATIVE ASSESSMENTS RELIABLE?
125
GMAS. However, there were teachers who still used Exit Tickets that asked students to
demonstrate mastery on skills less than what would be required on the GMAS.
Quizzes. Finally, the formative assessment type most aligned to the GMAS was found to
be the constructed response items from quizzes. The mean and mode rating for Quizzes was a 3
implying that the average teacher at Oak Hill selected or created Quiz assessment items that
required students to demonstrate mastery at least at the Proficiency Level required on the
GMAS. Quizzes and test comprise 40% of a student’s mathematics grade.
Figure 22. Formative Assessment Ratings.
Table 26
Mean Ratings for Formative Assessments (N=7)
Descriptive
Summary
Exit Ticket Homework Quiz
Mean 2.86 2.14 3.00
Median 3.00 2.00 3.00
Mode 3 3 3
Std. Deviation 1.069 .900 .577
4
1
4
2
3
3
3
2
1
3
2
3
3
1
2
3
3
3
4
3
3
0 0.5 1 1.5 2 2.5 3 3.5 4 4.5
Dana
Vivian
Saul
Rachael
Bethany
Kelly
Barbara
Formative Assessment Analysis Using the GMAS Achievement Level Descriptors
Quiz Homework Exit Ticket

ARE TEACHERS’ FORMATIVE ASSESSMENTS RELIABLE?
126
Selected vs. Created Assessments. Also, the case study showed that the teachers from
Oak Hill used formative assessments from a variety of sources. Of the 21 formative
assessments, five (24%) of the formative assessments were web-based resources pulled from
educational websites. Only 20% of these web-based resources were aligned to the GMAS
standard at the appropriate level of complexity. According to the rubric from the GMAS
Achievement Level Descriptors, 80% of these web-based resources would not allow students to
“demonstrate proficiency in the knowledge and skills necessary at the identified grade level as
specified in Georgia’s content standards” (GaDOE, 2015). When asked about why a particular
assessment was chosen from a web-based resource, Dana said, “I like to choose assessments
from ____ and ____ because they have already been created and they align to the standard, and if
it aligns to the standard, then it will align to the Georgia Milestones.”
There were five formative assessments analyzed from the textbook publisher adopted for
use at Oak Hill Elementary. Out of these five textbook formative assessments, 60% were
constructed at the Proficiency Level or above. The remaining eleven formative assessments
(52%) were teacher-created. Of these teacher-created formative assessments, 91% were
constructed at the proficient level or above (see Figure 23).
It was noted that many of the formative assessments that were not appropriately aligned
to grade level standards lacked skills and/or competencies needed to demonstrate proficiency.
For example, a formative assessment may have required students to divide fractions (i.e.
Beginning Level). However, requiring students to divide fractions in multi-step word problems
would increase the rigor to rate it on the Distinguished Level. In other words, although the
formative assessments may have skills connected to the standards, the assessment was rated

ARE TEACHERS’ FORMATIVE ASSESSMENTS RELIABLE?
127
below the Proficient Level if it did not encompass all the skills and knowledge needed at the
appropriate level of complexity.
Figure 23. Origins of Oak Hill’s Formative Assessments.
Chapter 4 Summary
Question 1 asked: What is the relationship between a student’s math grades and his/her
standardized test score? The distribution of fifth grade test scores and math grades at most of the
Title I schools was extremely dissimilar based upon the comparison criteria used. When
comparing the two assessment measures, 29 of the 35 schools had differences of over 25% in the
percentage of students failing the assessment measure. However, statistical non-parametrical test
results using the individual test scores and grades from Oak Hill’s students relayed very different
results. The chi-square test conducted for each tested grade level at Oak Hill showed that the
null hypothesis could be rejected, and the alternative hypothesis accepted. On each grade level, a
student’s standardized test scores are related to his/her mathematics grades. Furthermore, in each
case it was found that the relationship between the two variables – GMAS Performance Level
and Fourth Quarter Math Grades was significant. Scatterplots generated from each set of data
show a linear relationship between the two variables (see Figures 24, 25, and 26).

ARE TEACHERS’ FORMATIVE ASSESSMENTS RELIABLE?
128
Figure 24. Third Grade Scatterplot Comparison.
Figure 25. Fourth Grade Scatterplot Comparison.
0
1
2
3
4
0% 10% 20% 30% 40% 50% 60% 70% 80% 90% 100%
GM
AS
PE
RF
OR
MA
NC
E L
EV
EL
FOURTH QUARTER MATH GRADE AVERAGE
Oak Hill ElementaryThird Grade Scatterplot Comparison
2019 GMAS Performance Level vs. Fourth Quarter Math Grade Average
0
1
2
3
4
0% 10% 20% 30% 40% 50% 60% 70% 80% 90% 100%
GM
AS
PE
RF
OR
MA
NC
E L
EV
EL
FOURTH QUARTER MATH GRADE AVERAGE
Oak Hill Elementary
Fourth Grade Scatterplot Comparison
2019 GMAS Performance Level vs. Fourth Quarter Math Grade Average
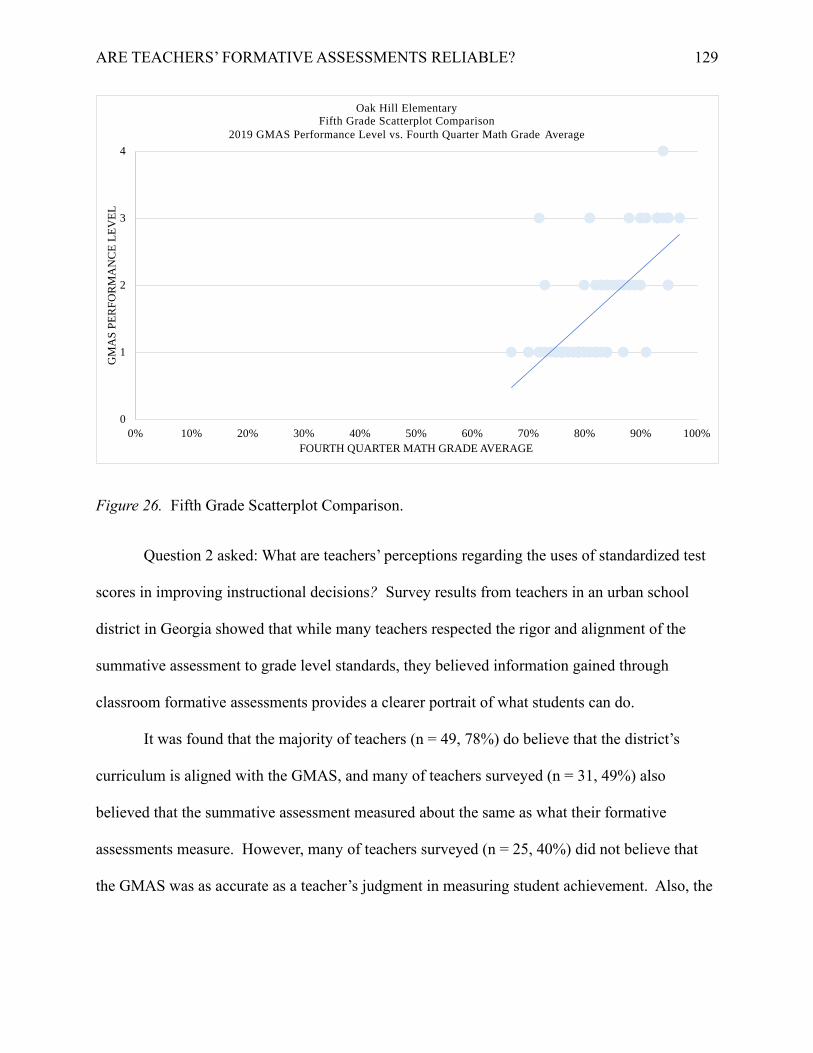
ARE TEACHERS’ FORMATIVE ASSESSMENTS RELIABLE?
129
Figure 26. Fifth Grade Scatterplot Comparison.
Question 2 asked: What are teachers’ perceptions regarding the uses of standardized test
scores in improving instructional decisions? Survey results from teachers in an urban school
district in Georgia showed that while many teachers respected the rigor and alignment of the
summative assessment to grade level standards, they believed information gained through
classroom formative assessments provides a clearer portrait of what students can do.
It was found that the majority of teachers (n = 49, 78%) do believe that the district’s
curriculum is aligned with the GMAS, and many of teachers surveyed (n = 31, 49%) also
believed that the summative assessment measured about the same as what their formative
assessments measure. However, many of teachers surveyed (n = 25, 40%) did not believe that
the GMAS was as accurate as a teacher’s judgment in measuring student achievement. Also, the
0
1
2
3
4
0% 10% 20% 30% 40% 50% 60% 70% 80% 90% 100%
GM
AS
PE
RF
OR
MA
NC
E L
EV
EL
FOURTH QUARTER MATH GRADE AVERAGE
Oak Hill ElementaryFifth Grade Scatterplot Comparison
2019 GMAS Performance Level vs. Fourth Quarter Math Grade Average

ARE TEACHERS’ FORMATIVE ASSESSMENTS RELIABLE?
130
many of respondents (n = 26, 41%) did not believe that the GMAS was as accurate a measure in
rating student performance as report card grades.
Additionally, teacher responses showed that they questioned the accuracy of results for
minority students and other subgroups using the state-mandated test. The majority of
respondents (n = 40, 63%) felt that GMAS was not an accurate measure of what minority
students know and can do, nor did they feel like GMAS was an accurate representation of what
English Language Learners know and can do (n = 43, 68%).
Although the majority of teachers showed that they believed classroom formative
assessments provided a more accurate assessment of student achievement than the state-
mandated GMAS test, it was found that the state-mandated test did have some influence over
teachers’ daily formative assessment practices. Many of the teachers (n = 30, 48%) reported that
GMAS results influenced their formative assessment practices on a daily basis. It was also found
that the use of a state-mandated summative assessment impacted formative assessment practices
in various ways (i.e. grouping students for instruction; selection of educational materials,
selection/construction of formative assessments, etc.). However, even acknowledging that the
summative assessment did impact formative assessment practices in the classroom, many survey
respondents (n = 30, 48%) reported that they did not believe that the state-mandated summative
assessment should be used as a measure of educational effectiveness.
Finally Question 3 asked: How well do teachers’ formative assessments align to the rigor
of the standardized assessment at the appropriate level of complexity? After analyzing the
classroom formative assessments, it was found that 33.3% of the formative assessments that
teachers used for grading purposes did not require students to demonstrate proficiency in the
knowledge and skills necessary at their identified grade level. The mean rating for the formative

ARE TEACHERS’ FORMATIVE ASSESSMENTS RELIABLE?
131
assessments was 2.67 with a standard deviation of .913. It was found that the majority (91%) of
the constructed response items that teachers created for quizzes encompassed the skills that
students needed to demonstrate mastery for a particular standard. However, formative
assessments selected from web-based resources (80%) and even the textbook publisher (40%)
may not have been fully aligned to the standard as identified by the GMAS Achievement Level
Descriptors due to a focus on discrete/isolated skills instead of applying a set of skills within the
context of an application problem.
Through an analysis of the way in which classroom formative assessments were put into
practice and utilized in schools, it was found that the teachers participating in this study needed
to improve their use of formative assessments by using them more effectively to provide
feedback to students informing them of what is needed to achieve the standard and make
instructional decisions regarding planning for students.

ARE TEACHERS’ FORMATIVE ASSESSMENTS RELIABLE?
132
Chapter 5: Conclusions and Recommendations
Introduction and Summary of Key Findings
The purpose of this research project was to determine if teachers’ formative assessment
practices are reliable indicators of students’ mastery of grade level standards. This topic has
become even more relevant with proposed changes in the state’s assessment cycle due to a shift
in the delivery models of instruction. Because of the Covid-19 pandemic, many schools within
the state have opted to serve students virtually or have moved to hybrid models which combine
face-to-face instruction with online learning (Buckle, 2020). Logical assumptions could be made
that a student’s standardized test performance and classroom grades would be similar because
they are both assessments of a student’s mastery of a given curriculum. However, careful
examination of the two measures of student performance must be considered in order to make
quality decisions about what the next round of state-mandated testing should look like.
This mixed-methods explanatory research study employed a two-phase design. In this
explanatory research design, the numerical data was obtained, and then narrative data was
collected in an attempt to explain the numerical data (Creswell, 2009). The researcher sought to
use the data to explain, rather than describe, the phenomenon studied (Given, 2008). As a
participant observer, this aspect of the research was extremely important to this researcher. It
was crucial to set aside bias and rely on the views of the participants in the study to construct
meaning around these issues that may be commonly known in a school setting but whose
explanations are not well established within the literature.
The initial review of the literature revealed that there is discrepancy between the scores
that high school students achieve on standardized assessments and the grades that they receive on
their report cards for the same content area (O’Malley, 2017). This researcher sought to enhance

ARE TEACHERS’ FORMATIVE ASSESSMENTS RELIABLE?
133
the body of research in this area by extending the research to elementary school students using
descriptive, numerical data, and then attempted to uncover root causes through teacher
perception data and a qualitative examination of how well teachers align their formative
assessments to the summative assessment given. With underlying causes unveiled, practical
solutions may be proposed to remedy the situation and effect change within our school culture.
This explanatory research study was driven by three questions:
1. What is the relationship between a student’s math grades and his/her standardized test
score?
2. What are teachers’ perceptions regarding the uses of standardized test scores in
improving instructional decisions?
3. How well do teachers’ formative assessments align to the rigor of the standardized
assessment at the appropriate level of complexity?
Discussion of Findings
Research Question One
Major Finding: Test Scores Are Correlated to Student Grades. While descriptive
statistics conducted within the study showed that test scores and student grades do not mirror
each other, the non-parametrical ANOVA tests conducted showed that even with this disparity,
there is a moderate to relatively strong relationship between these two variables. An initial
analysis showed that the averages of the distribution of fourth quarter cumulative math grades
and the end-of-grade math summative assessment were extremely dissimilar in most cases. The
data also showed great differences (i.e. 25% and higher) in the percentage of elementary students
that failed the summative assessment and the percentage of students that failed the math course.
ARE TEACHERS’ FORMATIVE ASSESSMENTS RELIABLE?
134
In the majority of cases there were more students to fail the summative assessment than those
that failed the math course.
However, the chi-square test of independence showed that there is indeed a moderate to
relatively strong relationship between a student’s GMAS test score and fourth quarter math
grade. The data provided showed that the difference in distribution of GMAS scores and grades
was not significant enough to state that it was due to chance. Yet, this data also shows that there
should be no expectation of causality. In other words, a student’s fourth quarter math grade
cannot and should not be used to presume that the student performed comparably on the
standardized assessment.
Furthermore, there were limitations to this research design due to the relatively small
sample size and the fact that there were chi-square cells in each contingency table containing less
than five observations. For example, there were no observed occurrences of a student who
attained a distinguished rating on the GMAS but failed the math course. These findings could be
used as further documentation to support the differences between formative and summative
assessments.
Although both formative and summative assessments are essential components to
teaching and learning in the classroom, several researchers have highlighted their differences.
Godbout and Richard (2000) state that the main goal of formative assessments is to improve
learning. The information from these informal assessments should be used to help teachers make
instructional decisions for students. Formative assessments are to be used throughout the
instructional cycle to monitor student progress towards identified goals or expectations (Popham,
2013). Popham (2013) also states that formative assessments should be used to provide
effective/timely feedback to maximize student achievement. In this way, formative assessments

ARE TEACHERS’ FORMATIVE ASSESSMENTS RELIABLE?
135
can be viewed as “assessments for learning” because they inform the educational process. It is
data used to revise planned instruction (Heick, 2019).
On the other hand, students are engaged in summative assessments at the end of an
instructional cycle to determine what they have learned during that instructional period.
Summative assessments should be viewed as the culmination of an instructional cycle and should
provide information regarding whether or not students achieved the standard by a certain
deadline (DuFour, 2009). As seen in this light, summative assessments are assessments of
learning (Tomlinson, et al., 2013).
Research Question Two
Major Finding: Varying Criteria for Student Performance Leads to Ambiguity
about What Students Can Do. In addition to the aforementioned research, findings from this
study presented multiple reasons for the disparity between grades obtained through formative
assessments and the EOG summative assessment scores. Teachers’ perceptions about the value
of the state-mandated test and its use, its alignment to their formative assessment systems, and
various “unwritten policies” about grading practices are evidence of a lack of standardization of
practices contributing to an ambiguous picture of what students know and are able to do.
First of all, teacher perception data gathered through the survey and the observation
debriefing interviews showed that the majority of teachers did not believe that state-mandated
summative assessments should be used as a measure of educational effectiveness. In their open-
ended responses, teachers cited a variety of reasons including the fact that the standardized
assessment is a singular event within the course of an entire school year. Other teachers stated
that even with the reporting of GMAS student growth percentiles, the results of the standardized
assessment do not emphasize all of the gains that students have made within a school year. This

ARE TEACHERS’ FORMATIVE ASSESSMENTS RELIABLE?
136
preference of differentiated assessments for students was expressed by several educators. One
teacher stated, “I believe students in my classroom should have an alternative assessment since
their learning looks different based on their IEP (Individualized Education Program).” A few
teachers even expressed the desire for a pre-/post-assessment system as part of state-mandated
testing.
Also, most of the survey respondents felt that classroom formative assessments presented
more accurate information about students’ mastery of grade level standards. Teachers also stated
that the achievement of subgroups such as minority students, students with disabilities and
English Language Learners would be more accurately reported through the use of classroom
formative assessments rather than state-mandated test results. One teacher stated,
It’s not about the Milestones. It’s about the students we teach. The Milestones should be
redesigned for students with learning disabilities and academic challenges. There should
be different levels of the GMAS assessment. If we teach using differentiation, the
assessment should be the same.
Responses to the open-ended survey question and teacher interviews also provided more
insight into how the summative assessment system impacts classroom formative assessment
practices. Teachers agreed that the summative assessment impacted daily formative assessment
practices within the classroom and reported that summative assessment results from the previous
year were used to homogeneously group students for instruction and make long-range plans for
the start of a school year. Some survey respondents even reported that they used summative
assessment results to impact the grades that students receive. Also, as part of the preparation to
take the summative assessment, some teachers reported constructing their formative assessments
ARE TEACHERS’ FORMATIVE ASSESSMENTS RELIABLE?
137
in the same format as the GMAS and using test preparation materials to acquaint students with
the language and format of the summative assessment.
However, a major finding of the study provided insight into why there are differences in
the percentage of students failing the GMAS and the percentage of students with failing grades.
Several teachers reported in their survey responses that they are not “allowed” to give failing
grades. In follow-up interviews with teachers at Oak Hill, it was reported that teachers were
instructed not to give students in certain subgroups failing grades and to use different criteria
when assigning grades to these students. For students with disabilities (SWD) and English
Language Learners (ESOL), teachers in the study stated that they were instructed to collaborate
with SWD or ESOL teachers to determine at what grade level those students performed and then
grade their performance based upon how a student at that lower grade level would have
performed on the assignment. For example, if a third grade SWD student was assessed and
found to perform on a first grade level, the teacher would have to examine that SWD student’s
performance based upon how a first grader could perform on the same assignment. Teachers
also reported modifying assignments for students in these subgroups.
To explain the rationale for this practice as it was explained to her Dana stated,
It’s a given that they are behind grade level. It’s really difficult because they’re going to
be tested on the grade that they’re in even though they’re functioning one or more grade
levels behind. I grade them based upon the level that they are on and the level that I can
push them to. We’re pushing them there, but they may not make it there. And by the
time that the Georgia Milestones comes around, we want to have pushed them as far as
possible to be closer to grade level.

ARE TEACHERS’ FORMATIVE ASSESSMENTS RELIABLE?
138
This type of behavior raises concerns due to the subjectivity in formative grading
practices. When looking at a student’s report card grades, what do those grades really mean?
How does that student compare with others in the class? Should there be footnotes on the report
cards to state that “grades were attained using alternate criteria”? Also, how reliable are those
grades? What level of consistency is there in the grades assigned using the alternate criteria?
Tameshia Grimes (2010) states, “Using various types of criteria increases the chances of
subjectivity and bias, invalidating the grade issued as a measure of achievement” (p. 24).
In her study of interpreting the meaning of middle school students’ grades, Tameshia
Grimes (2010) also stated that removing the objectivity in grading practices leads to doubts in
the validity and reliability of the grades and causes teachers to lose credibility. She stated,
When grades are “unidimensional” in nature, their meaning is clear and the message
communicated is more likely to be the message received; however, when grades become
a reflection of a “hodgepodge” of factors, not only does the message communicated
become distorted, but the reliability and validity associated with grades and grading also
get questioned and lose their credibility. (p. 41)
Therefore, when considering the variety of factors involved in grading and formative
assessment practices, it gives credence to the argument that assessing student academic
achievement requires a variety of measures including those that may exclude input from the
classroom teacher in order to obtain a true picture of a student’s mastery of standards.
Research Question Three
Major Finding: Formative Assessments Are Fully Aligned to the Standards When
They Encompass All Skills and Knowledge Outlined in the Standard. The third research
question required a closer look into the formative assessment practices of classroom teachers.

ARE TEACHERS’ FORMATIVE ASSESSMENTS RELIABLE?
139
The findings showed that teachers gathered resources for formative assessments from a variety
of sources. These resources included formative assessments from the adopted textbook
publisher, subscription/non-subscription required web-based resources, and teacher-created
assessments. While there were about 67% of Oak Hill’s analyzed formative assessments
constructed at the appropriate level of complexity, many of them lacked some of the skills and
knowledge for students to demonstrate that they could perform at the Proficiency Level or higher
on the GMAS.
Debriefing sessions with Oak Hill’s teachers showed that they perceived an assessment
was aligned to the standard as long as it contained the same topic of the standard. For example, a
fifth grade geometry standard (5.G.2) states: “Represent real world and mathematical problems
by graphing points in the first quadrant of the coordinate plane, and interpret coordinate values of
points in the context of the situation” (GADOE, 2016, p. 5). If a teacher selected a formative
assessment for grading purposes that only required students to identify ordered pairs on the
coordinate plane that would represent only what a Developing Learner could do according to the
GMAS Achievement Level Descriptors. In order to demonstrate proficiency or above the
student must also “create and use the x-/y- coordinate systems by graphing and interpreting real
world contexts/problems in the first quadrant” (GADOE, 2015, p. 5).
In addition to selecting tasks aligned by topic only, it was found that some teachers also
misused deconstructed standards to assess students without adhering to the full intent of the
standard. Deconstructing standards has been defined as “the process of taking a broad standard
and analyzing its components, then breaking the standard into smaller, more explicit instructional
learning targets for use in daily teaching and classroom-level assessment” (CCCSS, 2018, p. 1).

ARE TEACHERS’ FORMATIVE ASSESSMENTS RELIABLE?
140
When deconstructing standards, teachers are tasked with identifying the individual skills and
knowledge needed to demonstrate mastery of the standard and create learning targets.
While deconstructing standards is a useful exercise that breaks up the learning into bite-
size chunks, creating a formative assessment for grading purposes that encompasses only one of
the learning targets associated with the standard presents a false picture of students’ progress
towards mastery. It could be falsely interpreted that a student who has performed well on the
assessment of a particular learning target possesses all the skills and knowledge needed to
perform well on a GMAS test item that encompasses the full intent of the standard when this
may not be so.
Instead of using the assessments of individual learning targets for grades, this information
can be used as evidence of how close a student is to mastering individual targets within the
standard. Bethany, a special education teacher that has mastered this understanding described
the process she used,
For each standard, I create a formative assessment rubric. I divide a standard by learning
targets and assess students to see how well they perform on each individual learning
target. Learning targets are given a score from the rubric and then the scores are
averaged to create a grade for that particular standard. Using this strategy, I get to see
two things. I am able to see what part of the standard kids are having difficulty
accomplishing, and I also have a systematic way of achieving a grade for that standard.
Also, the grades for my students are curved because at the end of the day, I can’t give
them below a 60% or 70% anyway.
Figure 27 below provides an example of one of Brittany’s formative assessment rubrics.

ARE TEACHERS’ FORMATIVE ASSESSMENTS RELIABLE?
141
Figure 27. Sample Learning Target Rubric.
In summary, it was found that there was a great difference in the communication of the
criteria of success for a particular standard and the feedback provided to students for
improvement. Superficial assessment of the standards by selecting tasks that did not embody the
full intention of the standard left teachers, students, and their parents with information that may
not have accurately reflected what students know and are able to do in relation to the state’s
adopted curriculum.
Implications of the Findings
The purpose of this explanatory research study was to determine whether or not teachers’
formative assessment practices were reliable indicators of students’ mastery of standards, and if
not, find evidence that might explain why. This study aimed to help teachers reflect upon their
formative assessment practices and develop a deeper understanding of how formative
assessments should be used to provide realistic feedback to stakeholders regarding what students

ARE TEACHERS’ FORMATIVE ASSESSMENTS RELIABLE?
142
know and are able to do. The results of this study proposed to expand the literature on the
relationship between formative and summative assessments in the elementary school setting.
While the intent of this study was to construct meaning around the phenomenon of
comparisons of formative and summative assessment results, it is the hope of this researcher that
this understanding yields a transformation in the practice of educators, thereby yielding
improved outcomes for students. Transformative educators promote evidence-based education
which uses research to effect change in our schools. Dylan Wiliam et al. (2020) further
advocates, “Evidence is important, of course, but what is more important is that we need to build
teacher expertise and professionalism so that teachers can make better judgments about when,
and how, to use research” (p. 11).
Recommendations for Further Action Research
Although this body of research determined that student test scores are related to the
formative assessment grades received in elementary classrooms, it is the belief of this researcher
that gains can be accomplished on the part of teachers, school leaders, and policy makers to
create better alignment of these two assessment systems thereby yielding improved student
outcomes. Better alignment of formative and summative assessments could provide “clear
criteria for what defines good performance, detailed/actionable feedback, and information to
make better instructional decisions” (Poorvu Center for Teaching and Learning, 2017, p.5).
Recommendations for Teachers
Based on the findings of this study, teachers need to improve formative assessment
practices. If the goal of classroom formative assessments is to improve learning during the
instructional cycle, then teachers must first be clear on the learning goals that students must
master. Teachers must take the time to clearly examine the standards and deconstruct them to

ARE TEACHERS’ FORMATIVE ASSESSMENTS RELIABLE?
143
determine the specific skills and knowledge that is required to demonstrate mastery. Clear
expectations must be established and then communicated to students (Wylie & Lyon, 2013).
One major finding of this study was that teachers need to create formative assessments
that are aligned to the full intention of the standard. This can only be done if teachers have a
clear understanding of what the standard requires. The work of examining the curriculum and
deconstructing standards is work that is essential to the assessment cycle. Peter DeWitt (2015)
states,
If teachers aren't crystal clear about the full and precise intent of a given standard, how
can they accurately teach it? How can they accurately assess student understanding of it?
How can they clearly communicate to students the specific learning intentions for a unit
of study? (p. 3)
Throughout our history in American education, the process of deconstructing standards
has taken on a variety of guises each supported through a specific protocol. The Five-step
Protocol created by Jan Chappuis (2015), Educational Impact’s Mastering Curriculum Mapping
Guide (2012), and the Deconstruct Standards Protocol by Doug Reeves and Larry Ainsworth
(2003) are just a few of the protocols in use today. Although each of these protocols has specific
steps in examining the standards, the common thread is that they require teachers to do 3 things:
(1) identify what students should be able to know and understand; (2) identify what students
should be able to do; and (3) establish learning goals that can be communicated to students in
language that they will understand. In order to effectively teach and assess the curriculum,
teachers must incorporate these into their practice.
Furthermore, teachers should use deconstructed standards to communicate success
criteria to students. Success criteria should “describe in specific terms what successful

ARE TEACHERS’ FORMATIVE ASSESSMENTS RELIABLE?
144
attainment of the learning goals looks like.” (Ontario Ministry of Education, 2010, p. 39). When
establishing criteria for success, teachers must determine what does quality work look like. They
need to thoughtfully consider what students can do to demonstrate mastery and success in
learning. Caroline Wylie of EL Education suggests that learning targets be used to establish
success criteria (Wylie, 2014). Learning targets describe what students will learn and be able to
do by the end of a lesson. They are concrete goals written in student-friendly terms and begin
with an “I can” statement. Wylie (2014) recommends that learning targets be created from
national/state standards and use language that is specific to a particular context with verbs that
are measurable suggesting how the target will be assessed.
After learning targets are established, teachers should design instructional activities that
would require students to attain skills needed to demonstrate mastery with regard to the success
criteria. These tasks to elicit evidence of student learning should encompass a range of activities
for the teacher to collect “relevant and sufficient evidence of student understanding and/or
progress toward the learning goals” (Wylie & Lyon, 2013, p. 46).
Wylie and Lyon (2013) also suggest that the criteria for success and carefully constructed
tasks be accompanied by exemplars that “illustrate aspects of quality” and a “rubric that students
can use to check their work” (p. 43). It is essential that students truly understand and internalize
the criteria for success with a particular standard so that when they are engaged in a task, they
can use the criteria to guide them and enable them to reflect upon the work.
Also, having clear, concise criteria for success equips teachers with specific “look-fors”
to provide descriptive feedback to students. Providing descriptive feedback to students during
the lesson cycle presents several benefits for teachers and students. It provides the evidence that
students need to improve the quality of their work as long as it is presented in a timely manner

ARE TEACHERS’ FORMATIVE ASSESSMENTS RELIABLE?
145
for students to be able to act on the feedback. For teachers, clear success criteria take away the
subjectivity in grading making the process of describing student performance easier. When
students are provided with clear criteria for success, tasks that are appropriately aligned to this
criteria, and descriptive feedback for improvement, the goals of formative assessment can be
realized (Stenger, 2014).
The aforementioned process of deconstructing the standards to identify what students
should know and be able to do, coupled with determining specific criteria for success is all pre-
work that should be done before teachers begin the process of teaching and creating formative
assessments. This pre-work helps teachers develop a clear understanding of what the content
standards require and better equips them for knowing how they should be assessed. If this is
accomplished, then formative assessments selected and/or created by teachers will be more
appropriately aligned to the standard and represent the full intention of the standard.
Recommendations for Teacher Leaders
The findings in this study present several implications for teacher leaders in the school.
Teacher leaders are charged with mentoring educators and providing professional learning
opportunities that would support teachers in improving their practice. The first implication of
practice for teacher leaders would be to guide their mentees through the aforementioned process
of deconstructing standards to identify clear learning targets, creating tasks appropriately aligned
to the targets, and providing descriptive feedback for improvement.
As the content-area leads or pedagogical experts in the schools, teacher leaders should
work to make collaborative planning sessions more productive and meaningful for educators.
Teacher leaders must facilitate collaborative planning sessions to allow teachers to plan
formative assessments and engage in the work of deconstructing standards while answering the
ARE TEACHERS’ FORMATIVE ASSESSMENTS RELIABLE?
146
following questions: How will we as teachers and our students know when the learning target
has been met? What are our look-fors during the lesson that will help guide our instruction?
Also, teacher leaders should facilitate the process of peer review of formative
assessments. Protocols should be established and used when evaluating a formative assessment
to ensure its alignment to the standard and to determine if the formative assessment encompasses
the full intention of the standard or just one of the skills embedded within. This peer review
process will help teachers not only evaluate their formative assessments but also calibrate the
evaluation/scoring process among a group of teachers. The calibration process helps to ensure
consistency and reliability in the formative assessment data. As part of its assessment toolkit, the
Rhode Island Department of Education (2019) reported that,
Calibration is necessary because rubrics alone do not ensure consistent scoring of student
work.... Through the calibration process, educators agree on how the rubric applies to
particular examples of student work. Not only does this bring about greater accuracy and
reliability in scoring, it also helps to deepen educators’ understanding of expectations for
student work expressed in the rubric. (p. 4)
However, teacher leaders must also focus on the need to guide teachers in establishing
effective formative assessment practices for grading. Professional learning should emphasize
grading practices that would support a common understanding of what grades really mean. This
common understanding should be grounded in the learning targets established for the curriculum
and their accompanying criteria for success. Issues with ambiguity in grading must be
addressed. An “A” earned by one student should represent attainment of the same skills and
knowledge of another student receiving an “A” for that same assignment.

ARE TEACHERS’ FORMATIVE ASSESSMENTS RELIABLE?
147
The first step in this process would be to support teachers in appropriately aligning
formative assessments to grade level standards. Formative assessments for grading purposes
should reflect all the skills and knowledge necessary for students to demonstrate mastery of that
standard, not just discrete skills within the standard. This is not to suggest that teachers should
refrain from assessing individual learning targets. Information gained from assessment of
individual learning targets is essential to diagnosing students’ needs and planning instruction.
However, when assigning a grade, the formative assessment used should encompass the full
intent of the standard. According to Student Achievement Partners, an organization founded by
the authors of the Common Core State Standards, “Aligned instructional practice can be
observed when the content and teacher’s instructional choices allow students to get to the full
intent of the standard” (Student Achievement Partners, 2011, para 3). This organization also
provides resources to support professional learning opportunities in alignment of instructional
practice. Educators should work collaboratively to use this and other resources such as The
Common Core Companion (Burke, 2014). This book and others in its series help users to
promote alignment by providing a detailed explanation of the standard, its relationship to other
grades/content in the curriculum and suggestions for how to teach them.
Next, teacher leaders should provide professional learning in calibrating grading
practices. Job-embedded training should be provided in the construction/use of rubrics and
calibration of scoring. Educators should be given opportunities to examine a piece of student
work and rate it based upon the success criteria embedded in the dimensions of the rubric. These
trainings should also involve the creation of teacher exemplars as a model of what quality work
looks like. As teacher leaders place more emphasis on alignment, formative assessment practices

ARE TEACHERS’ FORMATIVE ASSESSMENTS RELIABLE?
148
should yield more valid results. “Valid and meaningful data-based decision-making depends on
the degree of alignment between standards and assessments” (LaMarca & Redfield, 2000, p. 7).
Recommendations for Administrators and School Policy-Makers
Finally, the task of assessment reform in schools requires careful consideration from
school administrators and policy-makers. The first recommendation for administrators and
school policy-makers is to determine whether or not it is even appropriate to use formative
assessments for grading purposes. Formative assessment occurs throughout the course of
instruction to help inform practice and improve student learning. However, summative
assessment is used to evaluate student learning at the end of an instructional cycle. This study
verified that teachers use how students perform on formative assessments to establish a grade for
a course which in theory changes the use of the assessment. Should this practice be allowed, or
should all formative assessments only be used to assess learning gaps and close those gaps?
School policy-makers need to first establish this understanding of practice.
Tom Schimmer (2019) argues that the answer to this question is no. Formative
assessments should not be used for grading purposes. He cites the research of several scholars
that agree that feedback from formative assessments is most effective when it is not accompanied
by a grade or a score. He asserts that a student who receives a low score may not receive the
feedback well making the process unproductive. According to the researchers, the distinction is
clear.
Formative grades are an oxymoron since the formative and summative uses serve
different priorities. We assess to gather information about student learning and either use
that information formatively to advance learning or use it summatively to verify that it
has occurred (Schimmer, 2019, p. 2).

ARE TEACHERS’ FORMATIVE ASSESSMENTS RELIABLE?
149
While Schimmer (2019) acknowledges that teachers are urged to provide parents with
periodic updates about their student’s progress, he advocates for a policy in which formative
assessment grades do not count and are assigned a weight of zero in the teacher’s gradebook.
This would help ensure that the formative assessment process remains pure and allows students
and parents to focus not so much on whether or not a grade was achieved but keep focused on
what indicates that the student has or has not met the standard.
The second suggestion for this group of stake-holders is to reform grading practices by
implementing standards-based report cards in schools. Standards-based grading is “described as
a grading system in which students are evaluated based on their proficiency in meeting a clearly-
articulated set of course objectives” (Iamarino, 2014, p. 1). Scriffiny (2008) proposes several
benefits of standards-based grading. Standards-based grading provides meaning to vague letter
grades. It provides a focus for rating student performance and evidence to help teachers adjust
instruction. Students are provided feedback regarding specific standards that have or have not
been mastered. Standards-based grading teaches what quality looks like.
Townsley and Buckmiller (2016) assert that the implementation of the more rigorous
Common Core State Standards warrants standards-based grading because the number of
standards has been reduced requiring students to “think deeper and work towards more
meaningful applications” (p. 2). They also argue that recent educational laws such as the Every
Student Succeeds Act state that educational systems “may no longer fail students who don’t
learn, and move on” (p. 2). Instead policy makers are mandating that all students become
proficient (Townsley & Buckmiller, 2016).
Finally, requiring schools to use standards-based grading as part of their formative
assessment systems would be a great complement to the proposed upcoming changes in state-

ARE TEACHERS’ FORMATIVE ASSESSMENTS RELIABLE?
150
wide testing. In the state of Georgia, schools are now provided the option to use an interim
formative assessment system called the DRC BEACON which would be administered
periodically to measure student progress throughout the school year. The Georgia Department of
Education reports that the DRC BEACON is aligned to the Georgia Milestones in several ways,
“including the standards assessed, item types administered, delivery platform used, and tools and
accommodations available” (GADOE, 2020, p. 2). BEACON will not take the place of the
Georgia Milestones, but the goal of this assessment tool is to provide educators with immediate
and detailed results on students’ mastery of standards and attainment of goals.
Because schools are given the autonomy to determine how they will use the data
generated through the BEACON assessment, the student results from BEACON and other
interim assessments like it can be used as one piece of data along with classroom formative
assessments to provide a clear picture of a students’ performance. Pairing BEACON or other
interim assessment results with classroom formative assessments would simplify the work of
standards-based grading and reduce the subjectivity of some teachers’ grading practices.
However, further research should be conducted to determine which types of formative
assessment practices support the results from the state-mandated assessment to provide students,
parents, and other stake-holders an accurate picture of what students are able to do.
Final Thoughts and Conclusion
The history of assessment in American education is replete with periodic changes due to a
variety of reasons. Political debates, cultural issues, the need for technological advancements,
economic changes in our country, a push for accountability systems, and now even a global
pandemic are just a few of the reasons that have warranted shifts in the way students in our

ARE TEACHERS’ FORMATIVE ASSESSMENTS RELIABLE?
151
country have been assessed. It appears that we are now at another crossroads and must
determine an alternate way of assessing our students and measuring educational effectiveness.
The purpose of this study was to explore the relationship between formative assessment
grades and summative assessment results and gain insight into teacher perspectives on the topic.
Evidence gained through this study and others (O’Malley, 2017) show that currently classroom
formative assessments at a glance may appear unrelated to the summative assessment ratings that
students receive on state-mandated test such as the Georgia Milestones, but there is indeed some
correlation. In the wake of changing educational environments due to the impact of Covid-19,
this finding may prove encouraging. The correlation between these two types of assessments
may justify shifting away from high-stakes standardized testing and relying more on formative
assessment results and teacher judgments to make educational decisions. Because a waiver has
been requested to suspend summative assessments for the another year (Strauss, 2020), teachers,
school leaders and other stakeholders need to be able to rely on other testing measures as
assessments of student learning and educational accountability.
Furthermore, the impacts of the Covid-19 pandemic have led to other questions regarding
the equity of education received by students throughout the country and how teachers are able to
respond. How should formative assessment strategies differ in a virtual learning environment?
How can school administrators ensure an equitable standards-based education for all students
when access to technology resources for virtual instruction are not available to all? How can
school policy-makers evaluate student results from summative assessments when they are
administered with the distractions of students’ home environments and without proper
monitoring? These and other questions all signal a need to re-evaluate expectations of
assessments for schools and warrant the need for further research.

ARE TEACHERS’ FORMATIVE ASSESSMENTS RELIABLE?
152
On the other hand, evidence from this case study shows that the current use of grades as a
formative assessment practice may not be the most reliable and valid measure to use. Reform is
needed in schools to change classroom formative assessments to make them better aligned to the
yearly summative assessments that students would have received. The recommendations put
forth in this study are not new. However, they also have not been mastered by many of the
educators providing instruction to students in American schools. Assessment reform in America
is needed. Until this is done, the information gained through the grades from formative
assessments is, at best, left to varying and wide-spread interpretation.

ARE TEACHERS’ FORMATIVE ASSESSMENTS RELIABLE?
153
References
Abby, A. (2017). Ask assessment Abby: Diagnostic assessment. Gazette - Ontario Association
for Mathematics, 56(1), 26–27.
Abrams, L. M., Mcmillan, J. H., & Wetzel, A. P. (2015). Implementing benchmark testing for
formative purposes: Teacher voices about what works. Educational Assessment,
Evaluation and Accountability, 27(4), 347–375.
Adams, C. J. (2014). College-entrance testing: Defining promise: Optional standardized testing
policies in American college and university admissions. Education Week, 33(22), 5.
Adeyemi, B. A. (2015). The efficacy of authentic assessment and portfolio assessment in the
learning of social studies in junior secondary schools in Osun state, Nigeria. Ife
Psychologia, 23(2), 125–132.
Ahmed, V., Opoku, A., & Aziz, Z. (2016). Research methodology in the built environment: a
selection of case studies. London: Routledge, Taylor & Francis Group.
Alcocer, P., & Nea. (n.d.). History of standardized testing in the United States. Retrieved from
http://www.nea.org/home/66139.htm
Allen, J. D. (2005). Grades as valid measures of academic achievement of classroom
learning. The Clearing House, 78(5), 218–223.
Alexander, L. (2017, December 7). Every student succeeds act assessments under Title I, Part A
& Title I, Part B: Summary of Final Regulations. Retrieved October 12, 2020, from
https://www2.ed.gov/policy/elsec/leg/essa/essaassessmentfactsheet1207.pdf
Alonzo, D., Mirriahi, N., & Davison, C. (2018). The standards for academics’ standards-based
assessment practices. Assessment & Evaluation in Higher Education, 1-17.

ARE TEACHERS’ FORMATIVE ASSESSMENTS RELIABLE?
154
Anderson, L. W. (2014). A taxonomy for learning, teaching, and assessing: A revision of
Bloom's. Essex: Pearson.
Archuleta, N. (2019, January 10). Diagnostic testing in education. Retrieved from
https://www.theclassroom.com/diagnostic-testing-education-5096.html
Automated Test Scoring. (n.d.). Retrieved from
https://www.ibm.com/ibm/history/ibm100/us/en/icons/testscore/team/
Bakula, N. (2010). The benefits of formative assessments for teaching and learning. Science
Scope, 34(1), 37-43.
Bambrick-Santoyo, P. (2016). Get better faster scope and sequence. Retrieved from
http://www.samsconnect.com/wordpress/wp-content/uploads/2013/01/Santoyo-
Keynote.pdf
Barnwell, S. (2010). The teacher created criterion-referenced math assessments and the
Tennessee comprehensive achievement program (doctoral dissertation). Trevecca
Nazarene College, Nashville, Tennessee.
Barlow, A. T., & Marolt, A. M. (2012). Effective use of multiple-choice items in the mathematics
classroom. Middle School Journal, 43(3), 50-55.
Beaudette, P. (2014, October 1). Georgia milestones: Georgia’s new standardized test. Retrieved
July 19, 2020, from https://gosa.georgia.gov/georgia-milestones-georgias-new-
standardized-test
Berlinsky-Schine, L. (2020, March 06). The relationship between grades and test scores.
Retrieved October 12, 2020, from https://blog.collegevine.com/the-relationship-between-
grades-and-standardized-test-scores/

ARE TEACHERS’ FORMATIVE ASSESSMENTS RELIABLE?
155
Bhanji, Farhan, Gottesman, R., de Grave, W., Steinert, Y., & Winer, L. R., (2012). The
retrospective pre-post: A practical method to evaluate learning from an educational
program. Academic Emergency Medicine, 19(2), 189–?.
Biggers, M., Forbes, C.T., & Zangori, L. (2013). Elementary teachers' curriculum design and
pedagogical reasoning for supporting students' comparison and evaluation of evidence-
based explanations. Elementary School Journal, 114(1), 48–72.
Blazer, C. (2011, January). Unintended consequences of high stakes testing. Retrieved October
11, 2020, from https://files.eric.ed.gov/fulltext/ED536512.pdf
Boykin, A. (2010). The relationship between high school course grades and exam scores.
Research Watch 9(39), 2–25.
Brink, C. S. (2011). A historical perspective of testing and assessment including the impact of
summative and formative assessment on student achievement (Order No. 3491837).
Available from ProQuest Central; ProQuest Dissertations & Theses A&I; ProQuest
Dissertations & Theses Global; Social Science Premium Collection. (915643881).
Brock, B. (2018, April 9). Decision-making and the education policymaker [Web log post].
Retrieved May 14, 2019, from
https://www.psychologytoday.com/us/blog/psyched/201804/decision-making-and-the-
education-policymaker
Brondyk, S. (n.d.). Analyzing student work. Retrieved from
http://assist.educ.msu.edu/ASSIST/school/together/seciiplc/seciidlrntog/3analstudwork.ht
m
Brookhart, S. M. (2013). The public understanding of assessment in educational reform in the
United States. Oxford Review of Education, 39(1), 52-71.

ARE TEACHERS’ FORMATIVE ASSESSMENTS RELIABLE?
156
Brookhart, S. M., Guskey, T. R., Bowers, A. J., McMillan, J. H., Smith, J. K., Smith, L. F., . . .
Welsh, M. E. (2016). A century of grading research: Meaning and value in the most
common educational measure. Review of Educational Research, 86(4), 803-848.
Buckle, J. (2020, July 17). What will return to school look like this fall? A look inside hybrid
learning plans. Retrieved July 19, 2020, from https://www.panoramaed.com/blog/hybrid-
learning-return-to-school
Burke, J. R. (2014). Common core companion: The standards decoded, grades 3-5 - what they
say, w. Sage Publications.
Burrows, T. J. (2013). A preliminary rubric design to evaluate mixed methods research (Order
No. 3585719). Available from ProQuest Central; ProQuest Dissertations & Theses A&I;
ProQuest Dissertations & Theses Global; Social Science Premium Collection.
(1513244026).
Carnegie Mellon University. (2019). Formative vs summative assessment - Eberly Center -
Carnegie Mellon University. Retrieved from
https://www.cmu.edu/teaching/assessment/basics/formative-summative.html
CCCSS. (2018). California common core state standards. Digital Chalkboard. Retrieved July 21,
2020, from
https://www.mydigitalchalkboard.org/portal/default/Content/Viewer/Content?action=2
Chappuis, J. (2010). Understanding school assessment. Boston, Massachusetts: Allyn & Bacon.
Chappuis, J. (2015). Seven strategies of assessment for learning. Boston, Massachusetts:
Pearson.
Clancy, D. (2001). Studying children and schools. Qualitative Research Traditions. Prospect
Heights, IL: Waveland Press.

ARE TEACHERS’ FORMATIVE ASSESSMENTS RELIABLE?
157
Clark, I. (2012). Formative assessment: Assessment is for self-regulated learning. Educational
Psychology Review, 24(2), 205-249.
Cliffordson & Thorsen (2012). Teachers' grade assignment and the predictive validity of
criterion-referenced grades, Educational Research and Evaluation, 18(2), 153-172, DOI:
10.1080/13803611.2012.659929
Collaboratives. (n.d.). Retrieved from https://ccsso.org/formative-assessment-students-and-
teachers-fast-collaborative.
Cognitive Rigor and DoK. (n.d.). Retrieved from http://www.karin-hess.com/cognitive-rigor-
and-dok
Concordia. (2017, November 08). What are summative assessments? Pros, cons, examples.
Retrieved from https://education.cu-portland.edu/blog/classroom-resources/summative-
assessment-what-teachers-need-to-know/
Creswell, J. W. (2009). Research design: Qualitative, quantitative, and mixed methods
approaches. (Vol. 3). Thousand Oaks, CA: Sage Publications.
http://doi.org/10.1016/j.math.2010.09.003
Creswell, J. W. (2013). Qualitative inquiry and research design: Choosing among five traditions.
Thousand Oaks, CA: Sage Publications.
Curry, K. A., Mwavita, M., Holter, A., & Harris, E. (2016). Getting assessment right at the
classroom level: Using formative assessment for decision making. Educational
Assessment, Evaluation and Accountability, 28(1), 89-104.
Dell, M., & Dell, S. (2016, May). Formative assessment in the classroom: Findings from three
districts. Retrieved from http://public.cdn.msdf.org/MSDF Formative Assessment Study
Final Report.pdf

ARE TEACHERS’ FORMATIVE ASSESSMENTS RELIABLE?
158
Depth of Knowledge (DOK) Overview Chart - Oregon. (n.d.). Retrieved November 30, 2017,
from
http://www.bing.com/cr?IG=317006FC95B241B0B098381D56320689&CID=0E8DC12
1EEFD6B380D36CA6FEFFB6A12&rd=1&h=rOLz7AiY9Dhqm_7Cr9UxfsK2BotJxMQ
OTImk82HsFJQ&v=1&r=http%3a%2f%2fwww.ode.state.or.us%2fteachlearn%2fsubject
s%2fsocialscience%2fstandards%2fdepthofknowledgechart.pdf&p=DevEx,5066.1
DeWitt, P. (2015, March 26). Unwrapping the standards: A simple way to deconstruct learning
outcomes. Retrieved October 09, 2020, from
https://blogs.edweek.org/edweek/finding_common_ground/2015/03/unwrapping_the_sta
ndards_a_simple_way_to_deconstruct_learning_outcomes.html
Dodge, J. (2009). What are formative assessments and why should we use them? Retrieved from
https://www.scholastic.com/teachers/articles/teaching-content/what-are-formative-
assessments-and-why-should-we-use-them/
Donald, A. (2018, March 1). Early intervention program guidance. Retrieved July 12, 2020, from
https://www.gadoe.org/Curriculum-Instruction-and-Assessment/Curriculum-and-
Instruction/Documents/EIP/2018-2019-EIP-Guidance.pdf
Dorans, N., & Zeller, K. (2004). Examining Freedle's claims about bias and his proposed
solution(Rep.). Educational Testing Service.
DuFour, R. (2010, October 27). Grading formative and summative assessments. Retrieved
November 02, 2020, from https://www.allthingsplc.info/blog/?tags%5B%5D=17
Eddy, C. M., & Kuehnert, E. A. (2018). The Advancement of teacher questions in mathematics
education. American Educational History Journal, 45(1), 33-53.
ARE TEACHERS’ FORMATIVE ASSESSMENTS RELIABLE?
159
Education Post. (2019). The ABC's of ESEA, ESSA and No child left behind. Retrieved from
https://educationpost.org/the-abcs-of-esea-essa-and-no-child-left-behind/
Educational Impact. (2012). Mastering curriculum mapping. Retrieved October 09, 2020, from
https://educationalimpact.com/resources/mcm/pdf/MCM_2C_3_Putting_Together_Activi
ty_3.pdf
Egan, K.L., Frerrara, S., Schneider, M. C., & Barton, K. E. (2009). Writing performance level
descriptors and setting performance standards for assessments of modified achievement
standards: The role of innovation and importance of following conventional practice.
Peabody Journal of Education, 84(4), 552-577.
Ellison, B. J. (2011). Does getting A's really matter? A conceptualization of grades as a measure
of educational outcomes (Order No. AAI3436453). Available from Social Science
Premium Collection. (1018343393; 201217137)
Examination. (n.d.). Retrieved from https://www.yourdictionary.com/examination
Examination - Dictionary Definition. (n.d.). Retrieved from
https://www.vocabulary.com/dictionary/examination
Fluckiger, J., Vigil, Y. T., Pasco, R., & Danielson, K. (2010). Formative feedback: Involving
students as partners in assessment to enhance learning. College Teaching, 58(4), 136-140.
Formal and Informal Assessments. (2015, July 22). Retrieved from
https://abdao.wordpress.com/2015/07/18/formal-and-informal-assessments/
Francis, E. (2017, May 9). What is depth of knowledge? Retrieved November 03, 2020, from
https://inservice.ascd.org/what-exactly-is-depth-of-knowledge-hint-its-not-a-wheel/
Frey, B. B., & Schmitt, V. L. (2007). Coming to terms with classroom assessment: The journal of
secondary gifted education. Journal of Advanced Academics, 18(3), 402-423,488,491.

ARE TEACHERS’ FORMATIVE ASSESSMENTS RELIABLE?
160
GADOE. (2016, July). GSE fifth grade curriculum map. Retrieved July 21, 2020, from
https://www.georgiastandards.org/Georgia-Standards/Pages/Math.aspx
GADOE. (2020). Beacon. Retrieved July 22, 2020, from https://www.gadoe.org/Curriculum-
Instruction-and-Assessment/Assessment/Pages/BEACON.aspx
Garrison, C., & Erhringhaus, M. (2019). Formative and summative assessments in the classroom.
Retrieved from
https://www.amle.org/BrowsebyTopic/WhatsNew/WNDet/TabId/270/ArtMID/888/Articl
eID/286/Formative-and-Summative-Assessments-in-the-Classroom.aspx
Garner, B., Thorne, Jennifer, & Horne, S. H. (2017). Teachers interpreting data for instructional
decisions: Where does equity come in? Journal of Educational Administration, 55(4),
407-426.
Georgia Milestones Assessment System. (2015). Retrieved December 01, 2017, from
http://www.gadoe.org/Curriculum-Instruction-and-
Assessment/Assessment/Pages/Georgia-Milestones-Assessment-System.aspx
Georgia Department of Education. (2015, September). Georgia milestones achievement level
descriptors. Retrieved from https://www.gadoe.org/Curriculum-Instruction-and-
Assessment/Assessment/Pages/Georgia-Milestones-ALD.aspx
Georgia Department of Education. (2015). Promotion and retention guidance. Retrieved October
14, 2020, from https://www.gadoe.org/External-Affairs-and-
Policy/Policy/Pages/Promotion-and-Retention.aspx
Georgia Department of Education. (2015, November 10). Frequently asked questions about
promotion, placement, and retention. Retrieved October 14, 2020, from
https://www.gadoe.org/External-Affairs-and-
ARE TEACHERS’ FORMATIVE ASSESSMENTS RELIABLE?
161
Policy/Policy/Documents/PROMOTION%20-%20FAQ%20-%20Promotion%20Place%2
0Retention.pdf
Georgia Milestones Achievement Level Descriptors. (n.d.). Retrieved November 30, 2017, from
http://www.gadoe.org/Curriculum-Instruction-and-
Assessment/Assessment/Pages/Georgia-Milestones-ALD.aspx
Georgia Milestones Test Blueprints. (n.d.). Retrieved December 01, 2017, from
http://www.gadoe.org/Curriculum-Instruction-and-
Assessment/Assessment/Pages/Georgia-Milestones-Test-Blueprints.aspx
Georgia School Reports. (n.d.). Retrieved from https://schoolgrades.georgia.gov/.
Georgia State Board of Education. (2014). State Board Rule 160-4-2-.11 promotion, placement
and retention. Retrieved October 14, 2020, from https://www.gadoe.org/External-Affairs-
and-Policy/State-Board-of-Education/SBOE%20Rules/160-4-2-.11.pdf
Giavanna. (2017, March 30). Four ways diagnostics can tell you even more about your students.
Retrieved from https://lightsailed.com/4-ways-diagnostics-can-tell-even-students/
Given, L. M. (2008). Explanatory research. Retrieved from
https://methods.sagepub.com/reference/sage-encyc-qualitative-research-
methods/n164.xml
Godbout, P., & Richard, J. (2000). Formative assessment as an integral part of the teaching-
learning process. Physical & Health Education Journal, 66(3), 4.
GOSA (Ed.). (2019). Georgia school reports. Retrieved July 12, 2020, from
https://schoolgrades.georgia.gov/hutchinson-elementary-school

ARE TEACHERS’ FORMATIVE ASSESSMENTS RELIABLE?
162
Grimes, T. V. (2010). Interpreting the meaning of grades: A descriptive analysis of middle school
teachers' assessment and grading practices (Unpublished doctoral dissertation). Virginia
Commonwealth University.
Graham, A. (2013). Black teacher education candidates' performance on PRAXIS I: What test
results do not tell us. Negro Educational Review, 64(1), 9-35,135.
Graham, E. (2015, October 26). 'A nation at risk' turns 30: Where did it take us? Retrieved from
http://neatoday.org/2013/04/25/a-nation-at-risk-turns-30-where-did-it-take-us-2/
Green, T. L. (2017). From positivism to critical theory: School-community relations toward
community equity literacy. International Journal of Qualitative Studies in Education
(QSE), 30(4), 370-387.
Harada, V. H. (2004, 10). Authentic assessment, designing performance-based tasks. Teacher
Librarian, 32, 39.
Heick, T. (2019, December 13). The difference between assessment of learning and assessment
for learning -. Retrieved July 20, 2020, from
https://www.teachthought.com/pedagogy/the-difference-between-assessment-of-learning-
and-assessment-for-learning/
HER Editorial Board. (2010). Bias in the SAT? Continuing the debate. Harvard Educational
Review, 80(3), 391–393.
Hess, K. (2009). Hess' Cognitive rigor matrix and curricular examples. Retrieved September 20,
2020, from http://static.pdesas.org/content/documents/m2-activity_2_handout.pdf
Hess, K. (2014, April 11). The Hess cognitive rigor matrix. Retrieved September 21, 2020, from
https://www.karin-hess.com/post/2014-4-11-the-hess-cognitive-rigor-matrix
ARE TEACHERS’ FORMATIVE ASSESSMENTS RELIABLE?
163
Hess, K. (2014, July). Cognitive rigor and DoK. Retrieved from https://www.karin-
hess.com/cognitive-rigor-and-dok.
High, V. (2015). John Dewey and the no child left behind act (NCLB): What would he say? The
Journal of Educational Thought, 48(3), 167.
History of Standardized Tests. (n.d.). Retrieved from
https://standardizedtests.procon.org/view.resource.php?resourceID=006521
History of Standardized Testing. (2013). Retrieved from https://ed.lehigh.edu/theory-to-
practice/2013/history-of-standardized-testing
Holbeck, R., Bergquist, E., & Lees, S. (2014). Classroom assessment techniques: Checking for
student understanding in an introductory university success course. Journal of
Instructional Research, 3, 38-42.
Hollingworth, L. (2012). Why leadership matters: Empowering teachers to implement formative
assessment. Journal of Educational Administration, 50(3), 365-379.
Howard County Public Schools. (2013). HCPSS Homepage. Retrieved July 21, 2020, from
http://www.hcpss.org/
Hutchinson, M., & Hadjioannou, X. (2017). The morphing assessment terrain for English
learners in US schools. English Teaching, 16(1), 110-126.
Hutt, E., & Schneider, J. (2018). A history of achievement testing in the United States or
explaining the persistence of inadequacy. Teachers College Record, 120(11), 1.
Iamarino, D. L. (2014). The benefits of standards-based grading: A critical evaluation of modern
grading practices current issues in education, 17(2).
Kajeet. (2020, September 14). What can title I funding be used for. Retrieved September 18,
2020, from https://www.kajeet.net/what-can-title-i-funding-be-used-for/

ARE TEACHERS’ FORMATIVE ASSESSMENTS RELIABLE?
164
Kastberg, S. (2003). Using Bloom's taxonomy as a framework for classroom assessment. The
Mathematics Teacher, 96(6), 402-405.
Keeling, M. (2009). A district’s journey to inquiry. Knowledge Quest, 38(2), 32-37.
Ketabi, S., & Ketabi, S. (2014). Classroom and formative assessment in second/foreign language
teaching and learning. Theory and Practice in Language Studies, 4(2), 435-440.
Kinyua, D. & Okunya, O. (2014). Validity and reliability of teacher-made tests: Case study of
year 11 physics in Nyahururu district of Kenya. African Educational Research Journal,
2(2), 61-71.
Klapp, A. (2018). Does academic and social self-concept and motivation explain the effect of
grading on students’ achievement? European Journal of Psychology of Education, 33(2),
355-376.
Klein, S. R. (2012). Action research methods: Plain and simple. New York: Palgrave Macmillan
US.
Kubiszyn, T., & Borich, G. D. (2016). Educational testing and measurement: Classroom
application and practice. Hoboken, NJ: John Wiley & Sons.
Kumar, R. (2018). Formative knowledge assessment through games using concept map and
game theory. Journal of Information & Knowledge Management, 17(3)
Konen, J. (2017, December 23). Using Assessment in instruction. Retrieved from
https://www.teacher.org/daily/using-assessment-instruction/
Krishnamurthy, M. (2014, September 30). U-46 parents, students criticize new grading system.
Retrieved November 03, 2020, from
https://www.dailyherald.com/article/20140930/NEWS/140939975?cid=search

ARE TEACHERS’ FORMATIVE ASSESSMENTS RELIABLE?
165
LaMarca, P. M., & Redfield, D. (2000). State standards and state assessment systems: A guide to
alignment. Retrieved July 22, 2020, from https://www.govinfo.gov/content/pkg/ERIC-
ED466497/pdf/ERIC-ED466497.pdf
Lane, M. A. (2020, March 16). Gov. Kemp orders all K-12 Georgia schools to close until end of
March. Retrieved July 19, 2020, from https://www.gpb.org/blogs/education-
matters/2020/03/16/gov-kemp-orders-all-k-12-georgia-schools-close-until-end-of
Lee, A. M., & J.d. (2014). State academic standards: What you need to know. Retrieved from
https://www.understood.org/en/school-learning/partnering-with-childs-school/tests-
standards/state-academic-standards-what-you-need-to-know
Liu, J. (2020, September 10). 12 Tips for parents when your child don't do well for their exams.
Retrieved October 12, 2020, from https://www.bright-culture.com/exam-tips-for-
students/12-tips-for-parents-when-your-child-dont-do-well-for-their-exams/
Liu, Y. (2013). Preliminary study on application of formative assessment in college English
writing class. Theory and Practice in Language Studies, 3(12), 2186-2195.
Lundberg, C. C. (2003). Research design: Qualitative, quantitative and mixed methods
approaches. Organizational Research Methods, 6(3), 404.
Maag-Merki, K. & Holmeier, M. (2015). Comparability of semester and exit exam grades:
Long-term effect of the implementation of state-wide exit exams. School Effectiveness
and School Improvement, 26(1), 57-74.
Marshall, K. (2006, April 14). Interim assessments: Keys to successful implementation.
Retrieved November 02, 2020, from
https://marshallmemo.com/articles/Interim%20Assmt%20Report%20Apr.%2012,%2006.

ARE TEACHERS’ FORMATIVE ASSESSMENTS RELIABLE?
166
McMillan, J. (2005). Understanding and improving teachers' classroom assessment decision
making: implications for theory and practice. Educational Measurement: Issues and
Practice, 22(4), 34-43.
Merriam, S. (2009). Qualitative research: A guide to design and implementation. San Francisco:
Jossey-Bass.
Miller, M. D., Gronlund, N., & Linn, R. L. (2013). Measurement and assessment in teaching.
Singapore: Pearson Education South Asia Pte.
Mishra, S. (2016). Role of education in growth and development of the society: A monthly peer
reviewed international journal of management & IT: A monthly peer reviewed
international journal of management & IT. Splint International Journal of
Professionals, 3(7), 84-91.
Monitoring and Evaluation Toolkit. (2019, September 16). Case study. Retrieved November 03,
2020, from https://thetoolkit.me/123-method/metrics-based-evaluation/metrics-step-
3/case-study/
Nasstrom, G. & Henriksson, W. (2008). Alignment of standards and assessment: a theoretical
and empirical study of methods for alignment. Electronic Journal of Research in
Educational Psychology, 6(3), 667-690.
National Science Foundation. (2007). National science foundation - Where discoveries begin.
Retrieved October 12, 2020, from
https://www.nsf.gov/about/transformative_research/definition.jsp
Neill, M. (2016). The testing resistance and reform movement. Monthly Review,67(10), 8.

ARE TEACHERS’ FORMATIVE ASSESSMENTS RELIABLE?
167
Nguyen, K. (2019, March). Create/select a quality pacing guide. Retrieved from
https://support.illuminateed.com/hc/en-us/articles/219137168-Create-Select-a-Quality-
Pacing-Guide
O'Malley, K. (2017). Why good grades don't always match good test scores. Retrieved
November 30, 2017, from https://www.noodle.com/articles/why-good-grades-dont-
always-match-good-test-scores
Ontario Ministry of Education. (2010). Growing success: assessment, evaluation, and reporting
in Ontario schools. Retrieved from
https://www.rrdsb.com/UserFiles/Servers/Server_73620/File/Our%20Board/Departments
/Special%20Education%20Services/growSuccess.pdf
Pagani, L. S., Fitzpatrick, C., & Parent, S. (2012). Relating kindergarten attention to subsequent
developmental pathways of classroom engagement in elementary school. Journal of
Abnormal Child Psychology, 40(5), 715-25.
Park, K., Ji, H., & Lim, H. (2015). Development of a learner profiling system using
multidimensional characteristics analysis. Mathematical Problems in Engineering, 2015.
Panadero, E., Brown, G. T. L., & Strijbos, J. (2016). The future of student self-assessment: A
review of known unknowns and potential directions. Educational Psychology
Review, 28(4), 803-830.
Paul, C. (2018, April 29). Elementary and secondary education act of 1965. Retrieved from
https://socialwelfare.library.vcu.edu/programs/education/elementary-and-secondary-
education-act-of-1965/
Pedulla, J. P. (2003). The challenges of accountability. Educational Leadership, 61(3), 42–46.
Retrieved from

ARE TEACHERS’ FORMATIVE ASSESSMENTS RELIABLE?
168
http://www.ascd.org/publications/educational_leadership/nov03/vol61/num03/State-
Mandated_Testing—What_Do_Teachers_Think¢.aspx
Pedulla, J. J., Abrams, L. M., Madaus, G. F., Russell, M. K., Ramos, M. A., & Miao, J. (2003,
March). Perceived effects of state-mandated testing programs on teaching and learning:
Findings from a national survey of teachers. PDF. Boston.
Perie, M. (2008). A guide to understanding and developing performance-level descriptors.
Educational Measurement: Issues and Practice, 27(4), 15-29.
Peter. (2016). Analysing a single nominal variable. Retrieved October 05, 2020, from
https://peterstatistics.com/CrashCourse/2-SingleVar/Nominal/Nominal-2c-Effect-
Size.html
Phelps, M. (2010). Real-time teaching and learning. Kappa Delta Pi Record, 46(3), 132-134.
Plake, B.S., Huff, K., & Reshetar, R. (2010). Evidence-centered assessment design as a
foundation for achievement-level descriptor development and for standard setting.
Applied Measurement in Education, 23(4), 342-357.
Pollio, M., & Hochbein, C. (2015). The association between standards-based grading and
standardized test scores in a high school reform model. Teachers College
Record, 117(11), 1.
Poorvu Center for Teaching and Learning. (2017). Formative and summative assessments:
Poorvu Center for Teaching and Learning. Retrieved July 21, 2020, from
https://poorvucenter.yale.edu/Formative-Summative-Assessments
Popham, W. J. (2013). Tough teacher evaluation and formative assessment: Oil and water? Voices
from the Middle, 21(2), 10-14.

ARE TEACHERS’ FORMATIVE ASSESSMENTS RELIABLE?
169
ProProfs. (2019, May 06). What are the different types of educational assessment? - ProProfs.
Retrieved from https://www.proprofs.com/c/lms/what-are-the-different-types-of-
educational-assessment/
Positivism in Sociology: Definition, theory & examples. (2015, September 1). Retrieved from
https://study.com/academy/lesson/positivism-in-sociology-definition-theory-
examples.html
Qualitative Designs. (2017). Retrieved from http://hopscotchmodel.com/qualitative/.
Reese, S. (2009). Assessing the value of education. ACTE Online,17-20. Retrieved from
https://www.acteonline.org/wp-
content/uploads/2018/02/tech_novdec09_Assessing_the_Value_of_Education.pdf.
Resnik, D. B. (2011, May 1). What is ethics in research & why is it important? (Resources:
David B. Resnik: 2015). Retrieved from https://ahrecs.com/resources/ethics-research-
important-resources-david-b-resnik-2015.
Rhode Island Department of Education. (2019). Calibration protocol for scoring student work.
Retrieved October 09, 2020, from
https://www.ride.ri.gov/Portals/0/Uploads/Documents/Teachers-and-Administrators-
Excellent-Educators/Educator-Evaluation/Online-
Modules/Calibration_Protocol_for_Scoring_Student_Work.pdf
Ricketts, C. R. (2010). End of course grades and standardized test scores: Are grades predictive
of student achievement?(Order No. 3422097). Available from ProQuest Central;
ProQuest Dissertations & Theses A&I; ProQuest Dissertations & Theses Global; Social
Science Premium Collection. (755303452).

ARE TEACHERS’ FORMATIVE ASSESSMENTS RELIABLE?
170
Rollins, S. P. (2014). Learning in the fast lane: 8 ways to put all students on the road to
academic success. Alexandria, VA: ASCD.
Saeed, M., Tahir, H., & Latif, I. (2018). Teachers' perceptions about the use of classroom
assessment techniques in elementary and secondary schools. Bulletin of Education and
Research, 40(1).
Sasser, N. (2018, June 27). What are the advantages & disadvantages of formative assessment?
Retrieved from https://classroom.synonym.com/advantages-disadvantages-formative-
assessment-28407.html
Saunders, B., Kitzinger, J., & Kitzinger, C. (2015, October). Anonymising interview data:
challenges and compromise in practice. Retrieved from
https://www.ncbi.nlm.nih.gov/pmc/articles/PMC4582834/.
Schimmer, T. (2019, February 19). Should formative assessments be graded? Retrieved October
19, 2020, from https://www.solutiontree.com/blog/grading-formative-assessments/
Schneider, M. C., Huff, K. L., Egan, K.L., Gaines, M.L., & Ferrara, S. (2013). Relationships
among item cognitive complexity, contextual demands, and item difficulty: implications
for achievement-level descriptors. Educational Assessment, 18(2), 99-121.
Schoonenboom, J., & R, B. J. (2017). How to construct a mixed methods research design. Kölner
Zeitschrift Für Soziologie Und Sozialpsychologie, 69, 107-131.
Scriffiny, P. L. (2008). Seven reasons for standards-based grading. Educational Leadership,
66(2), 70-74. Retrieved July 22, 2020, from
http://www.ascd.org/publications/educational_leadership/oct08/vol66/num02/Seven_Rea
sons_for_Standards-Based_Grading.aspx
Sellers, A. (n.d.). Retrieved from http://www.cps.nova.edu/~cpphelp/class/psy0507/critv.html

ARE TEACHERS’ FORMATIVE ASSESSMENTS RELIABLE?
171
Shenton, A. K. (2004). Strategies for ensuring trustworthiness in qualitative research
projects. Education for Information, 22, 63–75. Retrieved from
https://pdfs.semanticscholar.org/cbe6/70d35e449ceed731466c316cd273032b28ca.pdf
Stauffer, R. (2017, April 28). The business of standardized testing. Retrieved from
https://www.huffpost.com/entry/the-business-of-standardi_b_9785988
Stenger, M. (2014, August 06). Five research-based tips for providing students with meaningful
feedback. Retrieved July 21, 2020, from https://www.edutopia.org/blog/tips-providing-
students-meaningful-feedback-marianne-stenger
Stiggins, R., & DuFour, R. (2009). Maximizing the power of formative assessments. Phi Delta
Kappan, 90(9), 640-644.
Strauss, V. (2017, April 19). 34 problems with standardized tests. Retrieved from
https://www.washingtonpost.com/news/answer-sheet/wp/2017/04/19/34-problems-with-
standardized-tests/?utm_term=.c73af164826d
Strauss, V. (2020, June 18). Georgia becomes first state to seek suspension of standardized tests
in 2020-21 because of coronavirus. Retrieved July 19, 2020, from
https://www.washingtonpost.com/education/2020/06/18/georgia-becomes-first-state-
seek-suspension-standardized-tests-2020-21-due-coronavirus/
Student Achievement Partners. (2011). Aligned instructional practice. Retrieved July 22, 2020,
from https://achievethecore.org/page/2730/aligned-instructional-practice
Tasks and requirements for the GACE® teacher leadership assessment. (2014). Retrieved from
https://gace.ets.org/teacher_leadership/about/tasks_requirements/
ARE TEACHERS’ FORMATIVE ASSESSMENTS RELIABLE?
172
Testing in American schools: Asking the right questions. full report.] (1992). U.S, Government
Printing Office, Superintendent of Documents, Mail Stop: SSOP, Washington, DC 20402-
9328 ($14.00; S/N 052-003-01275-8).
The Understood Team. (2020, April 17). The difference between the every student succeeds act
and no child left behind. Retrieved October 12, 2020, from
https://www.understood.org/en/school-learning/your-childs-rights/basics-about-childs-
rights/the-difference-between-the-every-student-succeeds-act-and-no-child-left-behind
Thomas, E. V., Wells, R., Baumann, S. D., Graybill, E., Roach, A., Truscott, S. D., . . . Crimmins,
D. (2019). Comparing traditional versus retrospective pre-/post-assessment in an
interdisciplinary leadership training program. Maternal and Child Health Journal, 23(2),
191-200.
Tomlinson, C. A., Moon, T., & Imbeau, M. (2013). Assessment and student success in a
differentiated classroom. Retrieved from
http://www.ascd.org/ASCD/pdf/siteASCD/publications/assessment-and-di-
whitepaper.pdf
Trochim, W. (2020, March 13). Positivism & post-positivism. Retrieved October 12, 2020, from
https://conjointly.com/kb/positivism-and-post-positivism/
Turner, S. L. (2014). Creating an assessment-centered classroom: Five essential assessment
strategies to support middle grades student learning and achievement. Middle School
Journal, 45(5), 3-16.
USC Libraries. (2019, October 9). Research guides: Organizing your social sciences research
paper: Writing a case study. Retrieved from
https://libguides.usc.edu/writingguide/casestudy.

ARE TEACHERS’ FORMATIVE ASSESSMENTS RELIABLE?
173
U. S. Department of Education. (2015, December). Every student succeeds act (ESSA).
Retrieved September 18, 2020, from https://www.ed.gov/essa?src=rn
U. S. Dept. of Education. (2015). Every student succeeds act (ESSA). Retrieved July 19, 2020,
from https://www.ed.gov/essa?src=rn
Warne, R. T., Nagaishi, C., Slade, M. K., Hermesmeyer, P., & Peck, E. K. (2014). Comparing
weighted and unweighted grade point averages in predicting college success of diverse
and low-income college students. National Association of Secondary School
Principals.NASSP Bulletin, 98(4), 261-279.
Washington, DC: Creswell, J. W. (2013). Qualitative inquiry and research design: Choosing
among five traditions. Thousand Oaks: Sage.
Watters, A. (2015, January 27). Multiple choice and testing machines: A history. Retrieved from
http://hackeducation.com/2015/01/27/multiple-choice-testing-machines
Webb, N. (1997). Webbalign resources online. Retrieved September 21, 2020, from
https://www.webbalign.org/resources/online
Wiliam, D., Barton, G., Civinini, C., Hepburn, E., Whiteman, P., Gibbons, A., . . . Lough, C.
(2020, August 03). Dylan Wiliam: Teaching not a research-based profession. Retrieved
October 09, 2020, from https://www.tes.com/news/dylan-wiliam-teaching-not-research-
based-profession
Wixson, K. K., & Valencia, S. W. (2011). Assessment in RTI: What teachers and specialists need
to know. The Reading Teacher, 64(6), 466-469.
Wylie, C. (2014). Leaders of their own learning: Chapter 1: Learning targets. Retrieved July 21,
2020, from https://eleducation.org/resources/chapter-1-learning-targets

ARE TEACHERS’ FORMATIVE ASSESSMENTS RELIABLE?
174
Wylie, C., & Lyon, C. (2013, May). Using the formative assessment rubrics, reflection and
observation tools to support professional reflection on practice. Retrieved from
https://ccsso.org/resource-library/formative-assessment-students-and-teachers-fast.
Yin, R. K. (2018). Case study research and applications: design and methods. Los Angeles:
Sage.
Zook, C. (2017, December 14). Formative vs. summative assessments: What's the difference?
Retrieved from https://www.aeseducation.com/blog/formative-vs.-summative-
assessments-what-do-they-mean.

ARE TEACHERS’ FORMATIVE ASSESSMENTS RELIABLE?
175
Appendix A
Informed Consent Form

ARE TEACHERS’ FORMATIVE ASSESSMENTS RELIABLE?
176
INFORMED CONSENT FORM
Thank you for agreeing to participate in this study, which will take place during the 2019 – 2020
school year. This form details the purpose of this study, a description of the involvement required and
your rights as a participant.
The purpose of this study is:
• to determine if teachers’ formative assessment practices are reliable indicators of students’
mastery of grade level standards.
The benefits of the research will be:
• To better understand teachers’ perceptions regarding the use of formative and summative
assessments.
• To help teachers analyze formative assessments with regards to rigor and alignment to the
Georgia Standards of Excellence.
• To help teachers improve formative assessment practices.
The methods that will be used to meet this purpose include:
• Survey
• Mini discussion groups of two or three participants to analyze teacher-created/selected formative
assessments.
• Observations of formative assessment practices
You are encouraged to ask questions or raise concerns at any time about the nature of the study or
the methods I am using. Please contact me at any time at the e-mail address or telephone number listed
below.
Our discussion will be audio taped to help me accurately capture your insights in your own
words. The tapes will only be heard by me for the purpose of this study. If you feel uncomfortable with
the recorder, you may ask that it be turned off at any time.
You also have the right to withdraw from the study at any time. In the event you choose to
withdraw from the study, all information you provide (including tapes) will be destroyed and omitted
from the final paper.
Insights gathered by you and other participants will be used in writing a research report, which
will be read and presented to my dissertation committee at Kennesaw State University. Though direct
quotes from you may be used in the paper, your name and other identifying information will be kept
anonymous.
By signing this consent form I certify that I ____________________________ agree to
(Print full name here)
the terms of this agreement.
____________________________ ______________
(Signature) (Date)
Researcher: [email protected]

ARE TEACHERS’ FORMATIVE ASSESSMENTS RELIABLE?
177
Appendix B
Classroom Observation Form
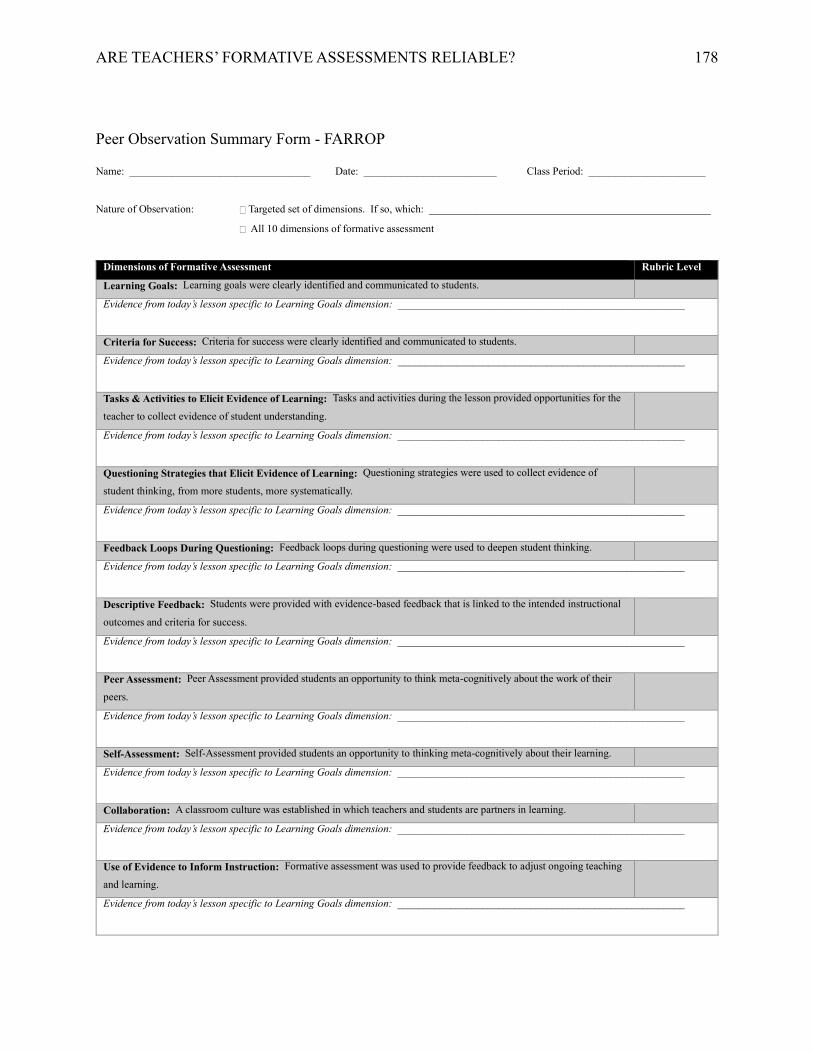
ARE TEACHERS’ FORMATIVE ASSESSMENTS RELIABLE?
178
Peer Observation Summary Form - FARROP
Name: __________________________________ Date: _________________________ Class Period: ______________________
Nature of Observation: Targeted set of dimensions. If so, which: _____________________________________________________
All 10 dimensions of formative assessment
Dimensions of Formative Assessment Rubric Level
Learning Goals: Learning goals were clearly identified and communicated to students.
Evidence from today’s lesson specific to Learning Goals dimension: ______________________________________________________
Criteria for Success: Criteria for success were clearly identified and communicated to students.
Evidence from today’s lesson specific to Learning Goals dimension: ______________________________________________________
Tasks & Activities to Elicit Evidence of Learning: Tasks and activities during the lesson provided opportunities for the
teacher to collect evidence of student understanding.
Evidence from today’s lesson specific to Learning Goals dimension: ______________________________________________________
Questioning Strategies that Elicit Evidence of Learning: Questioning strategies were used to collect evidence of
student thinking, from more students, more systematically.
Evidence from today’s lesson specific to Learning Goals dimension: ______________________________________________________
Feedback Loops During Questioning: Feedback loops during questioning were used to deepen student thinking.
Evidence from today’s lesson specific to Learning Goals dimension: ______________________________________________________
Descriptive Feedback: Students were provided with evidence-based feedback that is linked to the intended instructional
outcomes and criteria for success.
Evidence from today’s lesson specific to Learning Goals dimension: ______________________________________________________
Peer Assessment: Peer Assessment provided students an opportunity to think meta-cognitively about the work of their
peers.
Evidence from today’s lesson specific to Learning Goals dimension: ______________________________________________________
Self-Assessment: Self-Assessment provided students an opportunity to thinking meta-cognitively about their learning.
Evidence from today’s lesson specific to Learning Goals dimension: ______________________________________________________
Collaboration: A classroom culture was established in which teachers and students are partners in learning.
Evidence from today’s lesson specific to Learning Goals dimension: ______________________________________________________
Use of Evidence to Inform Instruction: Formative assessment was used to provide feedback to adjust ongoing teaching
and learning.
Evidence from today’s lesson specific to Learning Goals dimension: ______________________________________________________

ARE TEACHERS’ FORMATIVE ASSESSMENTS RELIABLE?
179
Appendix C
Teacher Survey on the Impact of State-Mandated Testing Programs

ARE TEACHERS’ FORMATIVE ASSESSMENTS RELIABLE?
180
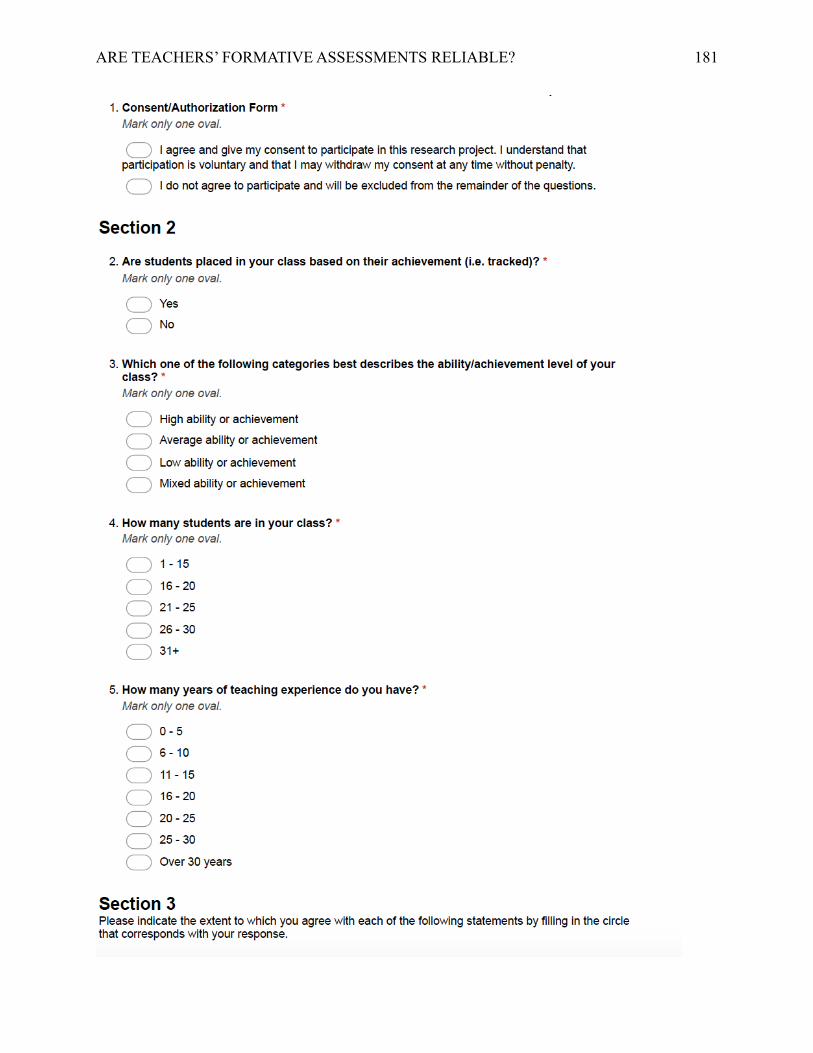
ARE TEACHERS’ FORMATIVE ASSESSMENTS RELIABLE?
181
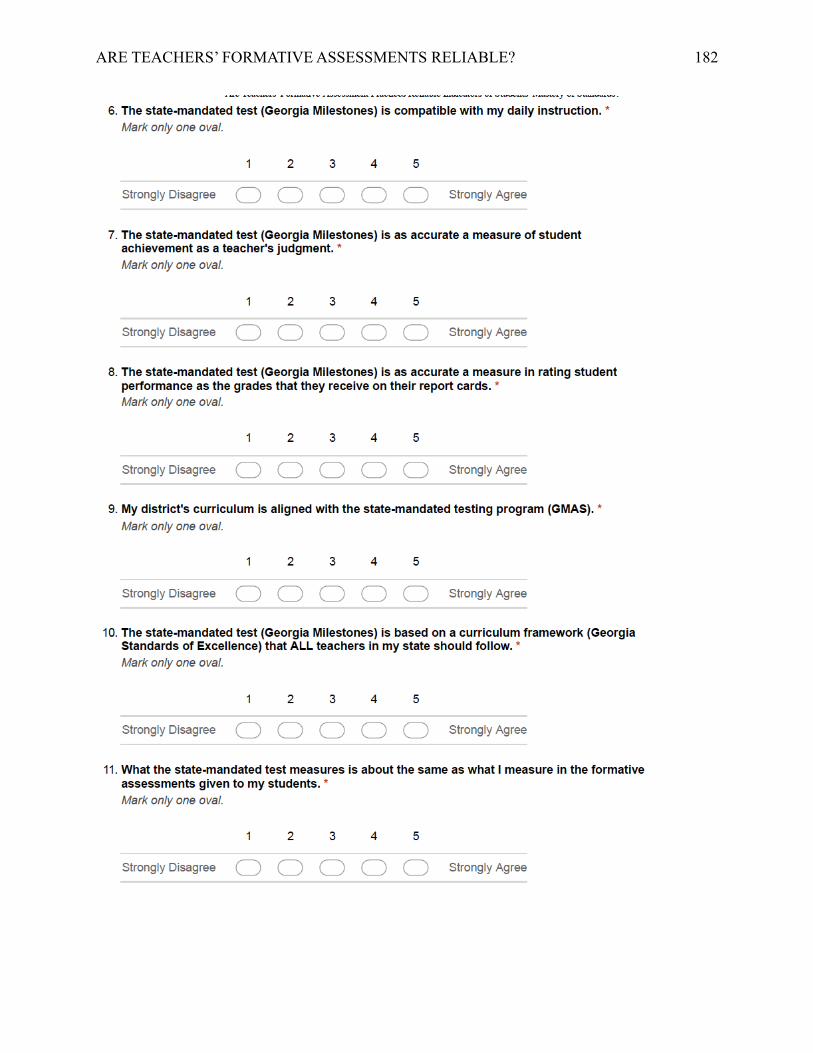
ARE TEACHERS’ FORMATIVE ASSESSMENTS RELIABLE?
182

ARE TEACHERS’ FORMATIVE ASSESSMENTS RELIABLE?
183

ARE TEACHERS’ FORMATIVE ASSESSMENTS RELIABLE?
184

ARE TEACHERS’ FORMATIVE ASSESSMENTS RELIABLE?
185

ARE TEACHERS’ FORMATIVE ASSESSMENTS RELIABLE?
186

ARE TEACHERS’ FORMATIVE ASSESSMENTS RELIABLE?
187

ARE TEACHERS’ FORMATIVE ASSESSMENTS RELIABLE?
188
Appendix D
Survey Reliability Data

ARE TEACHERS’ FORMATIVE ASSESSMENTS RELIABLE?
189
Dimension: Alignment
Reliability Statistics
Cronbach’s
Alpha
N of Items
.855 7
Item-Total Statistics
Scale Mean
if Item
Deleted
Scale
Variance if
Item
Deleted
Corrected
Item-Total
Correlation
Cronbach’s
Alpha if
Item
Deleted
Q6. GMAS Compatible with
Instruction
23.31 19.487 .624 .834
Q9. District Curriculum Aligned
with GMAS
23.00 21.659 .584 .843
Q10. GMAS Based on GSE
Framework
23.07 19.287 .684 .826
Q12. Instructional Material
Aligned to GMAS
23.74 17.857 .660 .831
Q20. Teach State Standards-
Students Do Well
23.43 18.202 .665 .829
Q25. My tests same format as
GMAS
23.31 19.341 .643 .831
Q28. My tests have same content
as GMAS
23.00 21.512 .517 .849

ARE TEACHERS’ FORMATIVE ASSESSMENTS RELIABLE?
190
Dimension: Accurate Measurement
Reliability Statistics
Cronbach’s
Alpha
N of Items
.767 10
Item-Total Statistics
Scale Mean if
Item Deleted
Scale
Variance if
Item Deleted
Corrected
Item-Total
Correlation
Cronbach’s
Alpha if Item
Deleted
Q7. GMAS-Accurate
Measurement of
Achievement as Teacher’s
Judgment
32.64 31.357 .548 .730
Q8. GMAS-Accurate
Measure as Grades
32.52 30.402 .630 .717
Q11. GMAS Measures
Same as Formative
Assessments
31.95 33.461 .477 .742
Q16. Performance Diff.
Smaller on GMAS
(Minority vs. Non)
32.57 31.178 .519 .734
Q17. GMAS Not Accurate
Measurement of Minorities
31.83 35.069 .323 .761
Q18. Low Students Do
Better on GMAS if
Prepared
31.86 30.808 .659 .715
Q19. Score Diff. Student
Change Not School
Effectiveness
31.79 36.270 .202 .777
Q21. GMAS Measures
High Standards of
Achievement
31.76 32.576 .658 .722
Q22. GMAS Not Accurate
for ESOL
31.67 37.496 .113 .789
Q24. Diff. in Schools
Reflect Student
Backgrounds
31.12 37.522 .234 .768

ARE TEACHERS’ FORMATIVE ASSESSMENTS RELIABLE?
191
Dimension: Measure of Educational Effectiveness
Reliability Statistics
Cronbach’s
Alpha
N of Items
.517 3
Item-Total Statistics
Scale Mean
if Item
Deleted
Scale
Variance if
Item
Deleted
Corrected
Item-Total
Correlation
Cronbach’s
Alpha if
Item
Deleted
Q13. GMAS Scores Accurately
Reflect Educational Quality
7.83 2.337 .398 .294
Q19. Score Diff. Student Change
Not School Effectiveness
6.95 3.022 .226 .600
Q27. Admin Test Scores Reflect
Quality of Instruction
6.60 3.320 .418 .336

ARE TEACHERS’ FORMATIVE ASSESSMENTS RELIABLE?
192
Dimension: Teacher Expectations
Reliability Statistics
Cronbach’s
Alpha
N of Items
.804 3
Item-Total Statistics
Scale Mean
if Item
Deleted
Scale
Variance if
Item
Deleted
Corrected
Item-Total
Correlation
Cronbach’s
Alpha if
Item
Deleted
Q14. Teacher High Expectations
on GMAS
8.45 2.400 .780 .604
Q15. Teachers High Expectations
on Formative Assessments
8.50 2.451 .582 .811
Q23. Teachers High Expectations
in Class Performance
8.48 2.597 .607 .775

ARE TEACHERS’ FORMATIVE ASSESSMENTS RELIABLE?
193
Dimension: Influence Practice / Professional Development
Reliability Statistics
Cronbach’s
Alpha
N of Items
.946 6
Item-Total Statistics
Scale Mean
if Item
Deleted
Scale
Variance if
Item
Deleted
Corrected
Item-Total
Correlation
Cronbach’s
Alpha if
Item
Deleted
Q31a. Knowledge of State
Curriculum
18.02 28.365 .815 .938
Q31b. Alignment Class
Curriculum to State Standards
18.10 27.113 .909 .927
Q31c. Alignment Class
Curriculum to GMAS
17.98 28.512 .897 .930
Q31d. Test Prep Strategies 18.05 27.656 .790 .941
Q31e. Interpretation of Test
Results
18.21 27.294 .797 .941
Q31f. Use of Test Results 18.21 27.538 .825 .937

ARE TEACHERS’ FORMATIVE ASSESSMENTS RELIABLE?
194
Appendix E
Test Score / Grade Distribution for 35 Title I Schools

ARE TEACHERS’ FORMATIVE ASSESSMENTS RELIABLE?
195
Test Score / Grade Distribution for the 35 Title I Schools
School Number of
Fifth Grade
Students
%
Distinguished
/ % A's
%
Proficient/
%B's
%
Developing
/ % C's
%
Beginning/
%F's
Difference
in %
Beginning
and % F's
School 1 38 0% 11% 34% 55% 52%
21% 34% 42% 3%
School 2 60 3% 5% 42% 50% 50%
15% 32% 53% 0%
School 3 51 8% 22% 37% 33% 14%
6% 25% 49% 20%
School 4 42 7% 10% 26% 57% 55%
19% 47% 33% 2%
School 5 83 16% 30% 28% 27% 27%
32% 30% 38% 0%
School 6 61 13% 23% 28% 36% 34%
48% 36% 15% 2%
School 7 62 0% 8% 37% 55% 53%
10% 32% 56% 2%
School 8 51 4% 20% 43% 33% 24%
16% 31% 43% 10%
School 9 66 8% 17% 33% 42% 30%
9% 39% 39% 12%
School 10 91 2% 24% 33% 41% 41%
23% 40% 37% 0%
School 11 66 2% 19% 24% 56% 56%
24% 38% 38% 0%
School 12 36 0% 3% 58% 39% 39%
19% 39% 42% 0%
School 13 57 0% 9% 33% 58% 55%
10% 55% 32% 3%
School 14 83 7% 23% 37% 33% 3%
17% 28% 25% 30%
School 15 75 0% 4% 40% 56% 53%
21% 55% 21% 3%
School 16 59 5% 20% 39% 36% 22%
0% 25% 61% 14%
School 17 88 1% 11% 42% 45% 27%
2% 26% 53% 18%
School 18 42 0% 5% 40% 55% 48%

ARE TEACHERS’ FORMATIVE ASSESSMENTS RELIABLE?
196
10% 45% 38% 7%
School 19 87 0% 17% 26% 56% 55%
17% 24% 57% 1%
School 20 65 2% 11% 37% 51% 28%
12% 29% 35% 23%
School 21 66 0% 5% 32% 64% 11%
3% 21% 23% 53%
School 22 81 4% 18% 37% 41% -7%
5% 21% 26% 48%
School 23 105 6% 12% 35% 47% 43%
11% 24% 61% 4%
School 24 80 9% 14% 36% 41% 33%
31% 30% 31% 8%
School 25 65 0% 3% 37% 60% 57%
27% 39% 31% 3%
School 26 85 1% 20% 31% 48% 36%
35% 26% 27% 12%
School 27 93 6% 22% 25% 47% 38%
17% 37% 38% 9%
School 28 57 0% 5% 37% 58% 51%
7% 42% 44% 7%
School 29 87 4% 14% 41% 40% 37%
25% 23% 48% 3%
School 30 47 6% 17% 40% 36% 28%
38% 29% 25% 8%
School 31 86 1% 7% 27% 65% 50%
13% 31% 41% 15%
School 32 54 0% 15% 20% 65% 37%
19% 19% 35% 28%
School 33 70 0% 1% 31% 67% 66%
9% 27% 63% 1%
School 34 93 3% 12% 37% 48% 48%
5% 33% 62% 0%
School 35 51 4% 18% 31% 47% 45%
13% 52% 33% 2%

ARE TEACHERS’ FORMATIVE ASSESSMENTS RELIABLE?
197
Appendix F
Individual School Graphs

ARE TEACHERS’ FORMATIVE ASSESSMENTS RELIABLE?
198

ARE TEACHERS’ FORMATIVE ASSESSMENTS RELIABLE?
199

ARE TEACHERS’ FORMATIVE ASSESSMENTS RELIABLE?
200
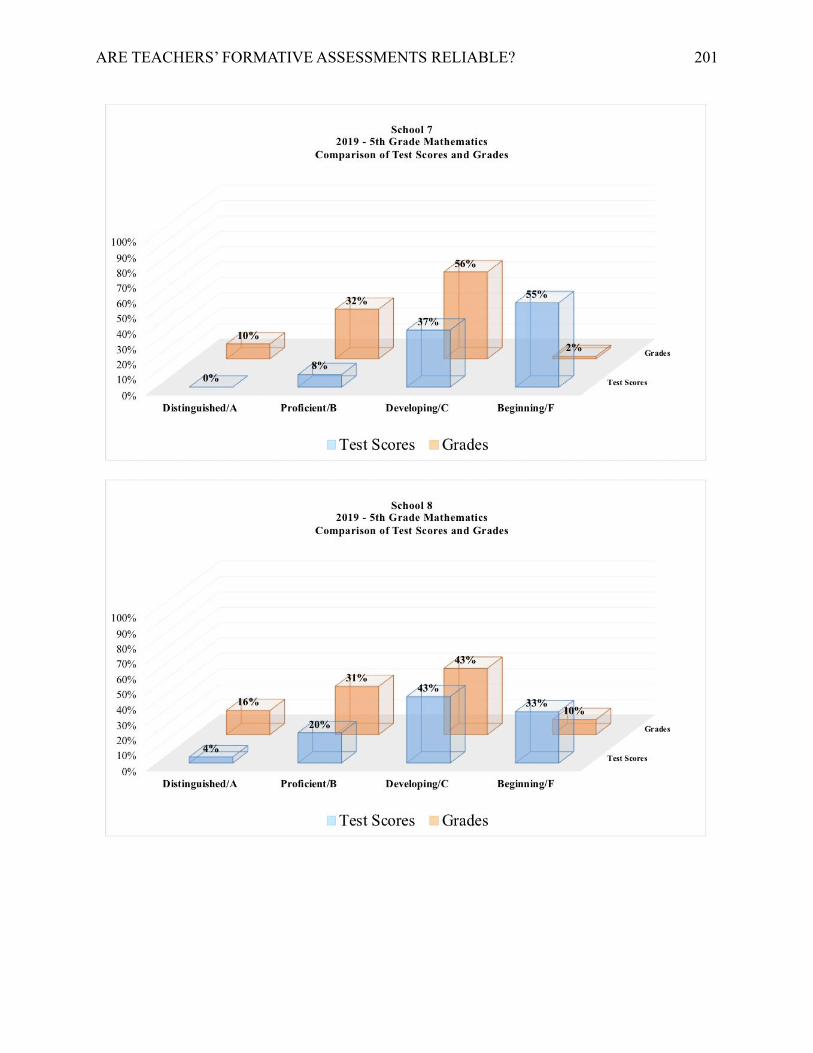
ARE TEACHERS’ FORMATIVE ASSESSMENTS RELIABLE?
201
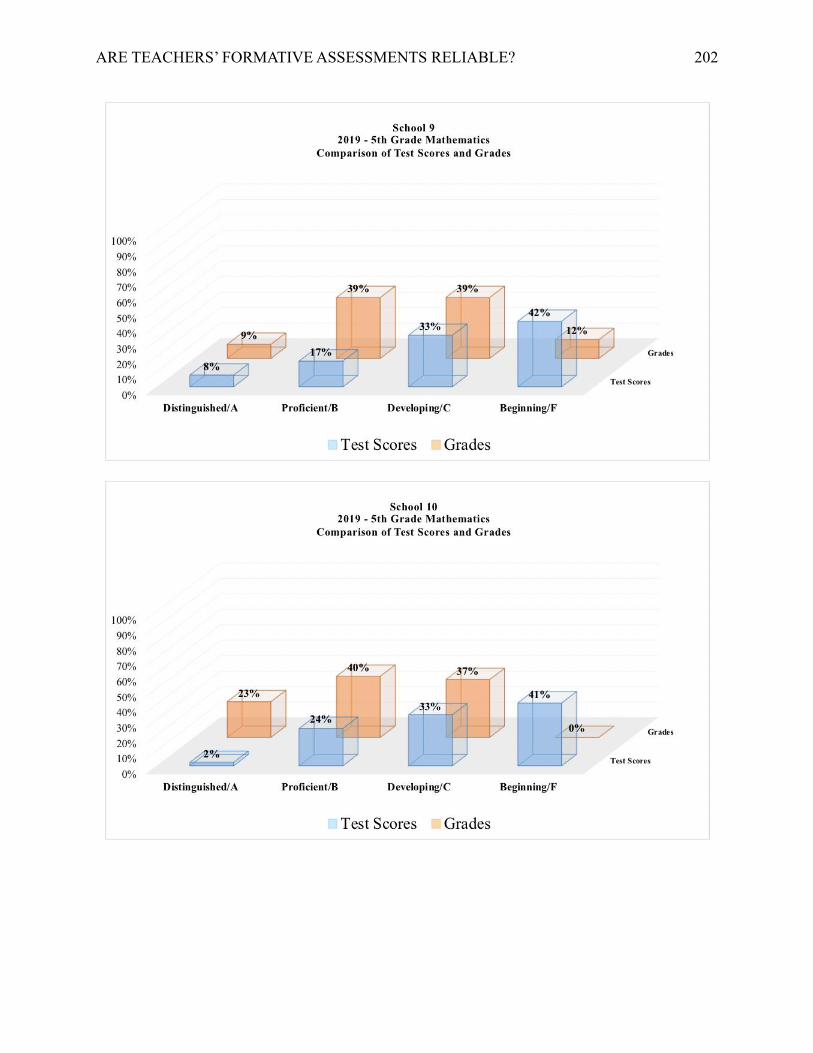
ARE TEACHERS’ FORMATIVE ASSESSMENTS RELIABLE?
202

ARE TEACHERS’ FORMATIVE ASSESSMENTS RELIABLE?
203

ARE TEACHERS’ FORMATIVE ASSESSMENTS RELIABLE?
204

ARE TEACHERS’ FORMATIVE ASSESSMENTS RELIABLE?
205

ARE TEACHERS’ FORMATIVE ASSESSMENTS RELIABLE?
206

ARE TEACHERS’ FORMATIVE ASSESSMENTS RELIABLE?
207

ARE TEACHERS’ FORMATIVE ASSESSMENTS RELIABLE?
208

ARE TEACHERS’ FORMATIVE ASSESSMENTS RELIABLE?
209

ARE TEACHERS’ FORMATIVE ASSESSMENTS RELIABLE?
210

ARE TEACHERS’ FORMATIVE ASSESSMENTS RELIABLE?
211

ARE TEACHERS’ FORMATIVE ASSESSMENTS RELIABLE?
212

ARE TEACHERS’ FORMATIVE ASSESSMENTS RELIABLE?
213
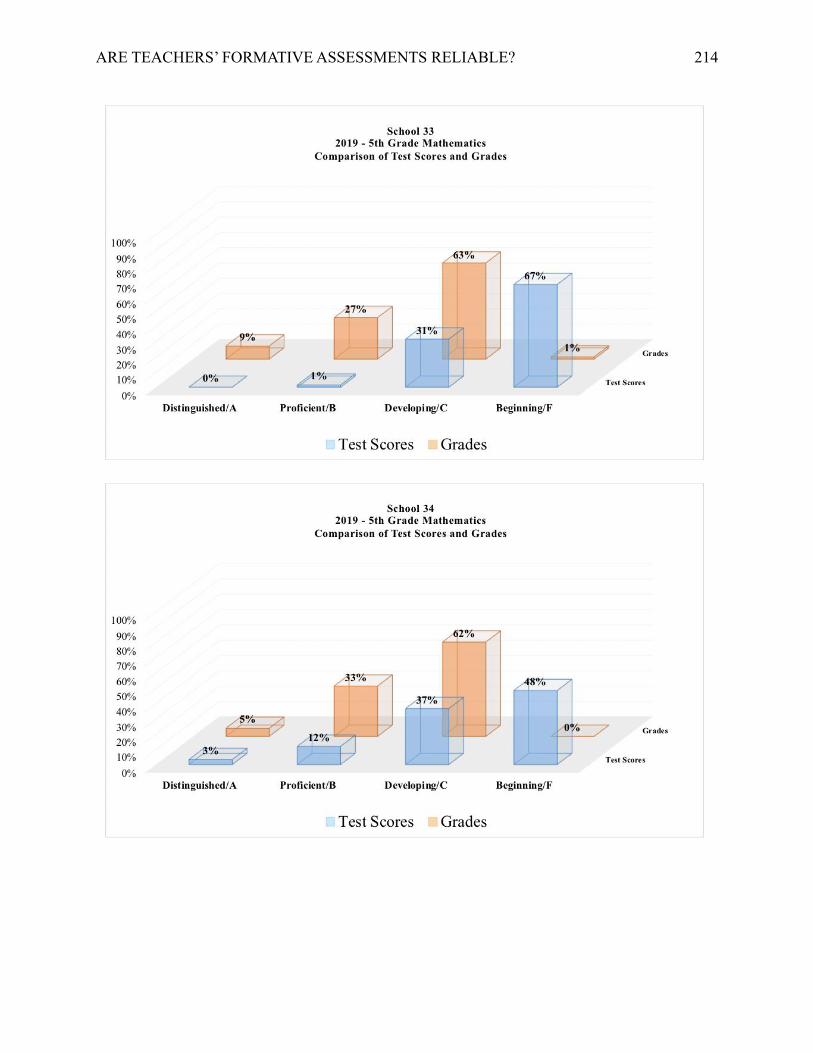
ARE TEACHERS’ FORMATIVE ASSESSMENTS RELIABLE?
214

ARE TEACHERS’ FORMATIVE ASSESSMENTS RELIABLE?
215

ARE TEACHERS’ FORMATIVE ASSESSMENTS RELIABLE?
216
Appendix G
Chi-Square Contingency Tables (Manual Calculations)

ARE TEACHERS’ FORMATIVE ASSESSMENTS RELIABLE?
217
Table G1
Third Grade Contingency Table (Manual Calculations)
GMAS Score
Beginning Developing Proficient Distinguished Total
Math
Grade
F Count 11 (13%) 1 (.01%) 1 (.01%) 0 (0%) 13 (14.9%)
Expected
Count
4.9 (5.6%) 5.2 (5.9%) 2.8 (3.2%) 0 (0%) 13 (14.9%)
C Count 13 (14.9%) 12 (13.8%) 0 (0%) 0 (0%) 25 (28.7%)
Expected
Count
9.5 (10.9%) 10.1 (11.6%) 5.5 (6.3%) 0 (0%) 25 (28.7%)
B Count 9 (10.3%) 14 (16.1%) 4 (4.6%) 0 (0%) 27 (31.0%)
Expected
Count
10.2 (11.7%) 10.9 (12.5%) 5.9 (6.8%) 0 (0%) 27 (31.0%)
A Count 0 (0%) 8 (9.2%) 14 (16.1%) 0 (0%) 22 (25.3%)
Expected
Count
8.3 (9.5%) 8.9 (10.2%) 4.8 (5.5%) 0 (0%) 22 (25.3%)
Total Count 33 (37.9%) 35 (40.2%) 19 (21.8%) 0 (0%) 87 (100%)
Expected
Count
32.9 (37.8%) 35.1 (40.3%) 19 (21.8%) 0 (0%) 87 (100%)
Note. The relation between these variables was significant, X2 (9, N = 87) = 47.34, 95% CI
[2.70, 19.02].

ARE TEACHERS’ FORMATIVE ASSESSMENTS RELIABLE?
218
Table G2
Fourth Grade Contingency Table (Manual Calculations)
GMAS Score
Beginning Developing Proficient Distinguished Total
Math
Grade
F Count 9 (11.3%) 6 (7.5%) 0 (0%) 0 (0%) 15 (18.8%)
Expected
Count
4.5 (5.6%) 7.1 (8.9%) 3.4 (4.3%) 0 (0%) 15 (18.8%)
C Count 13 (16.3%) 15 (18.8%) 5 (6.3%) 0 (0%) 33 (41.3%)
Expected
Count
9.9 (12.4%) 15.7 (19.6%) 7.4 (9.3%) 0 (0%) 33 (41.3%)
B Count 2 (2.5%) 15 (18.8%) 8 (10%) 0 (0%) 25 (31.3%)
Expected
Count
7.5 (9.4%) 11.9 (14.9%) 5.6 (7%) 0 (0%) 25 (31.3%)
A Count 0 (0%) 2 (2.5%) 5 (6.3%) 0 (0%) 7 (8.8%)
Expected
Count
2.1 (2.6%) 3.3 (4.1%) 1.6 (2%) 0 (0%) 7 (8.8%)
Total Count 24 (30%) 38 (47.5%) 18 (22.5%) 0 (0%) 80 (100%)
Expected
Count
24 (30%) 38 (47.5%) 18 (22.5%) 0 (0%) 80 (100%)
Note. The relation between these variables was significant, X2 (9, N = 80) = 25.56, 95% CI
[2.70, 19.02].

ARE TEACHERS’ FORMATIVE ASSESSMENTS RELIABLE?
219
Table G3
Fifth Grade Contingency Table (Manual Calculations)
GMAS Score
Beginning Developing Proficient Distinguished Total
Math
Grade
F Count 1 (1.5%) 0 (0%) 0 (%) 0 (0%) 1 (1.5%)
Expected
Count
6.2 (9.4%) .24 (.4%) .2 (.3%) .02 (.03%) 1 (1.5%)
C Count 23 (34.8%) 1 (1.5%) 1 (1.5%) 0 (0%) 25 (37.9%)
Expected
Count
14 (21.2%) 6.1 (9.2%) 4.5 (6.8%) .38 (.58%) 25 (37.9%)
B Count 12 (18.2%) 11 (16.7%) 2 (3%) 0 (0%) 25 (37.9%)
Expected
Count
14 (21.2%) 6.1 (9.2%) 4.5 (6.8%) .38 (.58%) 25 (37.9%)
A Count 1 (1.5%) 4 (6.1%) 9 (13.6%) 1 (1.5%) 15 (22.7%)
Expected
Count
8.4 (12.7%) 3.6 (5.5%) 2.7 (4.1%) .23(.35%) 15 (22.7%)
Total Count 37 (56%) 16 (24.2%) 12 (18.2%) 1 (1.5%) 66 (100%)
Expected
Count
37 (56%) 16 (24.2%) 12 (18.2%) 1 (1.5%) 66 (100%)
Note. The relation between these variables was significant, X2 (9, N = 66) = 47.8, 95% CI [2.70,
19.02].
ARE TEACHERS’ FORMATIVE ASSESSMENTS RELIABLE?
220
Appendix H
FARROP Findings

ARE TEACHERS’ FORMATIVE ASSESSMENTS RELIABLE?
221
Dana
The following summarizes the data obtained from observing Dana’s mathematics lessons
using the FARROP observation instrument:
The following summarizes the data obtained from observing Dana’s mathematics lessons
using the FARROP observation instrument:
• Learning Goals – Dana’s math lessons usually began with reading the objective
that she posted in the classroom. This standards-based objective was taken
verbatim from the district’s unit of study and was not written in student friendly
terms. No explanation, review of vocabulary, or connections to previous learning
were made. (Example of Posted Objective: “SWBAT generate, interpret, and
analyze number lines IOT represent unit and non-unit fractions by partitioning a
number line into equal parts and recognizing the magnitude of fractional
intervals.)
• Criteria of Success – Dana made it a practice to post a teacher exemplar for
students, shared a student exemplar during the lesson to review the criteria for
success and used the exemplars to have a discussion with students about what
makes “a good answer.”
• Tasks & Activities to Elicit Evidence of Learning – During my observations of
Dana’s math lessons, she did choose tasks that were connected to the learning
goals. However, a few students were unclear about the task and their time was
used ineffectively. This made Dana stop and share a student exemplar for
clarification.

ARE TEACHERS’ FORMATIVE ASSESSMENTS RELIABLE?
222
• Feedback Loops During Questioning – This usually consisted of Dana posing a
question, asking a student to respond, and then asking the entire class to indicate
whether or not they agreed. In this way, Dana facilitated conversations about the
work.
• Descriptive Feedback - As Dana moved around the room, she provided feedback
to individual students on how to improve and shared student exemplars tied to the
criteria for success.
• Use of Evidence to Inform Instruction - Dana used the evidence from the student
work to adjust her instruction during the lesson. For instance, during one lesson,
she stopped students from working and showed a student exemplar to clarify
expectations. However, she is concerned about moving on to the next lesson
regardless of the number of students that achieved the objective. She stated,
The Exit Ticket showed that most of my students just weren’t ready. I just
can’t move on and allow them to fail. The concepts build on each other.
If I move on too fast, the kids will have gaps in their knowledge and won’t
demonstrate mastery on the test.

ARE TEACHERS’ FORMATIVE ASSESSMENTS RELIABLE?
223
Vivian
The following summarizes the data obtained from observing Vivian’s mathematics
lessons using the FARROP observation instrument:
• Learning Goals – In Vivian’s math class, there was no learning goal aligned to
the standard was posted in writing inside the classroom. However, Vivian did use
student-friendly language at the beginning of the lesson to share the learning
goals, and she also made superficial connections to previously taught concepts.
For example, “Today we’re going to review fractions.”
• Criteria of Success – Vivian did not provide criteria of success or exemplar for
students.
• Tasks & Activities to Elicit Evidence of Learning – Vivian engaged students in a
variety of tasks aligned to the standard in her lesson plan. The performance tasks
and work produced by the students did provide insight into the evidence of
student learning. In some cases, students worked cooperatively and support was
provided by teachers and peers in order to complete the tasks.
• Feedback Loops During Questioning – Vivian made it a practice to ask questions
throughout each lesson at various points to encourage student discourse and
check for understanding. Also, students were encouraged to talk in small groups.
• Descriptive Feedback – Vivian’s feedback to students lacked specificity for
improvement and was not tied to instructional outcomes or criteria for success.
Students received a smiley face for correct answers and the problem was circled
if it was wrong. Students were given the opportunity to make corrections.

ARE TEACHERS’ FORMATIVE ASSESSMENTS RELIABLE?
224
• Use of Evidence to Inform Instruction – During a debriefing conference, Vivian
stated that she uses the student work to identify patterns of understanding and
makes inferences about students’ strengths and weaknesses. When asked how
did she know if students achieved the goals of the lesson she stated, “I can see
patterns in what my kids know just by walking around and observing. I make
notes on the students’ papers as I make my laps. The smiley faces show me who
has it and the circles let me know who needs to revisit the problem.” She
acknowledged that “about 70%” of her students demonstrated mastery, but when
asked about whether or not the students’ work led her to deviate from her lesson
plan she stated, “No, that was the objective for the week. We need to keep
moving.”

ARE TEACHERS’ FORMATIVE ASSESSMENTS RELIABLE?
225
Saul
The following summarizes the data obtained from observing Saul’s mathematics lessons
using the FARROP observation instrument:
• Learning Goals – Saul’s practice was to display the standards-based learning goal
as an “I Can. . .” statement on the Smartboard. For example, “I can express
whole number fractions on the number line when the unit interval is 1.” His
learning goals were appropriate for students and were expressed in language that
was accessible for students. He also made vague connections to previous learning
(i.e. “That’s where we have been but today we’re going somewhere else. We’re
writing whole numbers as fractions.”)
• Criteria of Success – Saul modeled expectations for students to show them what
quality work looked like.
• Tasks & Activities to Elicit Evidence of Learning – Saul required his students to
work independently to solve problems. As they worked, he made laps around the
room. After students were given the opportunity to work independently on white
boards and then did a “Show Call” in which students would hold up their
whiteboards. Saul called out student names of students that got correct answers.
• Feedback Loops During Questioning – There was no exchange between the
teacher and one or more students. There was also no questioning to support
deeper thinking.
• Descriptive Feedback – Informal feedback for Saul was brief and non-descript
such as “Good”. There were times when Saul would have students stand with

ARE TEACHERS’ FORMATIVE ASSESSMENTS RELIABLE?
226
correct answers and then had them share their responses with other students at the
board. The feedback was not tied to the criteria for success.
• Use of Evidence to Inform Instruction – Saul was not concerned about analyzing
the evidence to identify patterns of understanding. He stated that they just
needed to move on to the next lesson. He stated, “What I do is what we do daily.
I then give a quiz or test over it. The same questions that we practice, I give a
test over it. I don’t do anything different. If they paid attention, they can put it
together.”

ARE TEACHERS’ FORMATIVE ASSESSMENTS RELIABLE?
227
Rachael
The following summarizes the data obtained from observing Rachael’s mathematics
lessons using the FARROP observation instrument:
• Learning Goals – The standards-based learning goal was written and shared with
students in student-friendly terms.
• Criteria of Success – Rachael’s practice was to go through multiple examples to
provide an exemplar for students and gave a checklist or algorithm to use when
approaching a certain type of problem.
• Tasks & Activities to Elicit Evidence of Learning – The tasks were well-aligned
to the learning goals. The majority of students were clear about the task and were
able to begin work efficiently.
• Feedback Loops During Questioning – Students had to work together to model
for the class. This encouraged dialogue and required that more students engage
in the work and thinking about the problem.
• Descriptive Feedback – Rachael gave feedback that was directly tied to the
criteria for success. She specifically pointed out where they had gone wrong and
reminded them of the process to use. Rachael also reported the results of
students who did well to the entire class.
• Use of Evidence to Inform Instruction – Rachael used a clipboard to walk around
and make notes about how students performed. These notes were used to
determine groups of students to work with during small group instruction time.
Rachael also used the end-of-week quiz results to seat her students in groups in

ARE TEACHERS’ FORMATIVE ASSESSMENTS RELIABLE?
228
the classroom. High-achieving students are motivated to compete for the “first
chair” position in the classroom.

ARE TEACHERS’ FORMATIVE ASSESSMENTS RELIABLE?
229
Bethany
The following summarizes the data obtained from observing Bethany’s mathematics
lessons using the FARROP observation instrument:
• Learning Goals – Bethany’s standards-based learning goal was posted in the
classroom, printed on each student activity and communicated to students in
student-friendly terms. For example, “SWBAT build on students’ work of adding
fractions IOT extend that work into multiplication.” She went on to make
connections for students, “We’ve been working on adding fractions but now
we’re going to multiply them. Remember we learned a while ago that
multiplication is just repeated addition.”
• Criteria of Success – Brittany deconstructed the standard that she was working on
into a list of skills that show what students should be able to do in order to
demonstrate mastery. She then created a matrix (rubric) with each student’s
name and the individual skills needed to show mastery to make notes on student
progress.
• Tasks & Activities to Elicit Evidence of Learning – Students were given a variety
of tasks that were created for them to be able to demonstrate mastery of one or
multiple skills from the standard.
• Feedback Loops During Questioning – Because the instruction is so
individualized, students worked independently. However, Brittany moved
throughout the room to discuss with students what they were doing and give
students individualized feedback to assist them in making their answers better.

ARE TEACHERS’ FORMATIVE ASSESSMENTS RELIABLE?
230
• Descriptive Feedback – Brittany’s feedback to students was both written and oral.
She referred to her success criteria in her feedback and used the language of the
standard to support vocabulary development for her students. The feedback was
completely individualized pointing out examples and referring students to an
exemplar.
• Use of Evidence to Inform Instruction – Brittany used the formative assessments
(i.e. independent practice, questions, exit ticket, etc.) throughout her lessons to
decide next steps for students. She stated,
It’s not time to give grades yet. I have to use this information to let me
know what skills within the standard that my students can show mastery.
These tasks just help me to know what they can do and whether or not
they are ready to move to the next skill. I have to do all of this before I
create an assessment for grading that is totally aligned to the standard.

ARE TEACHERS’ FORMATIVE ASSESSMENTS RELIABLE?
231
Kelly
The following summarizes the data obtained from observing Kelly’s mathematics lessons
using the FARROP observation instrument:
• Learning Goals – The standards-based learning goal was posted and articulated to
students in student-friendly terms. Kelly used the learning goal to help students
make connections to previous learning.
• Criteria of Success – Kelly modeled for the students to set an exemplar and
criteria for success. She reiterated for students over and over again the process
that they should use.
• Tasks & Activities to Elicit Evidence of Learning – The tasks that Kelly selected
were connected to the learning goal and incorporated the use of previously-taught
skills within the current concept. Kelly reviewed students’ progress throughout
the lesson.
• Feedback Loops During Questioning – Kelly encouraged students to collaborate
and build on other students’ responses. She presented questions to help them
clarify their thinking.
• Descriptive Feedback – Kelly made laps around the room and provided
individualized feedback to students that supported the learning goal. After each
round of laps, she brought the class back together as a whole group to talk about
trends that she saw in their work based on the learning goal and provided
opportunities for students to ask questions and apply their knowledge in
meaningful ways.
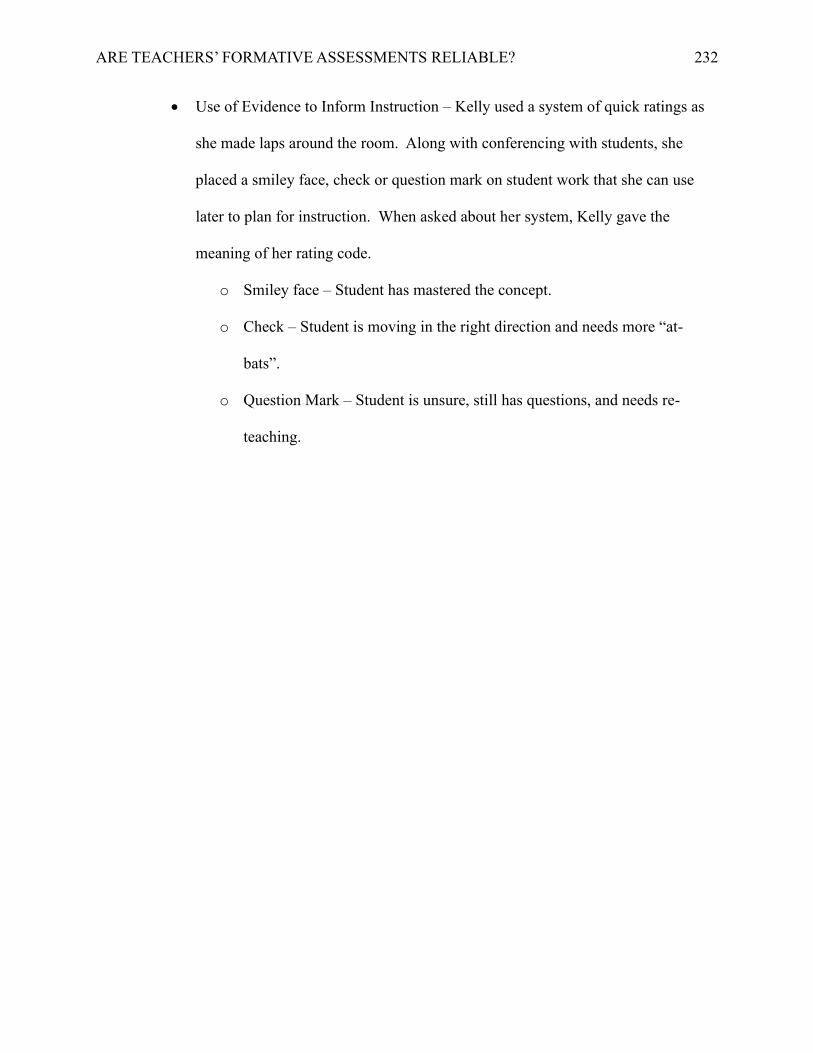
ARE TEACHERS’ FORMATIVE ASSESSMENTS RELIABLE?
232
• Use of Evidence to Inform Instruction – Kelly used a system of quick ratings as
she made laps around the room. Along with conferencing with students, she
placed a smiley face, check or question mark on student work that she can use
later to plan for instruction. When asked about her system, Kelly gave the
meaning of her rating code.
o Smiley face – Student has mastered the concept.
o Check – Student is moving in the right direction and needs more “at-
bats”.
o Question Mark – Student is unsure, still has questions, and needs re-
teaching.

ARE TEACHERS’ FORMATIVE ASSESSMENTS RELIABLE?
233
Barbara
The following summarizes the data obtained from observing Barbara’s mathematics
lessons using the FARROP observation instrument:
• Learning Goals – The learning goal for the previous concept was posted in the
room. Barbara began the lessons using very brief descriptions (i.e. “We’re
moving on to line plots.”)
• Criteria of Success – It was Barbara’s practice to model one and only one
problem for students as an attempt to share criteria for success. Modeling only
one problem for students frequently left them unable to complete the task on their
own.
• Tasks & Activities to Elicit Evidence of Learning – Students were frequently
unclear about the task and time was wasted because repeat explanations were
needed.
• Feedback Loops During Questioning – After allowing students to struggle on
their own, Barbara attempted to have a discussion about the sample problems that
students had difficulty solving. The discussion consisted of a guided practice
where they solved problems as a whole group and she elicited help from students
regarding what to do next.
• Descriptive Feedback – Barbara made no comments to students to provide
feedback or re-teach them as she made laps around the room.
• Use of Evidence to Inform Instruction – There was evidence that Barbara made a
mental note of how students were performing because after allowing them to
work independently, she selected problems that she saw that the majority of

ARE TEACHERS’ FORMATIVE ASSESSMENTS RELIABLE?
234
students had difficulty solving. Then she tried to guide them through the process
as a whole group. Barbara stated,
I walk around while students are working independently to see what they
can do by themselves. I don’t want to hold their hands like most people
do with special education students. It does no good for them. After I see
what the majority of them are having difficulty with, I then guide them
slowly through the steps so they can get it.