are suvs really safer than cars? - access magazine · is real, and whether suvs really are safer...
TRANSCRIPT

2A C C E S S
L AST SPRING’S Senate hearings on Corporate AverageFuel Economy standards made much about the
increased risk Americans would face if forced to give up theirSUVs for vehicles that weigh less. To find out whether that riskis real, and whether SUVs really are safer than cars, as somehave alleged, we analyzed highway fatality data. Our findings
came as a surprise.We focused on “driver death rates,” a concept of
risk developed by the Insurance Institute forHighway Safety. However, our analysis
dif fers from the Institute’s in twoimportant ways. First, we examinerisk not only to drivers of vehicles of aparticular type, but also to drivers ofvehicles that crash with that vehicle
type. Second, we limit our study torecent models having sold enough vehi-
cles to permit statistical analysis. By studyingrisks associated with vehicle models built between 1995 and1999, we focus on vehicles with up-to-date safety designs andconstraint technologies. Seat belts and airbags are improved andmore widely used; vehicle design is more sophisticated; and thestandardized head-on crash test and regulations have hasteneddesign improvements. Manufacturers continue to make addi-tional improvements to vehicles.
To m We n z e l i s a s c i e n t i s t i n t h e E n e r g y A n a l y s i s D e p a r t m e n t a t L a w r e n c e B e r k e l e y N a t i o n a l L a b o r a t o r y ( t p w e n z e l @ l b l . g o v ) .
M a r c R o s s i s p r o f e s s o r o f p h y s i c s a t t h e U n i v e r s i t y o f M i c h i g a n a n d v i s i t i n g s c i e n t i s t a t L a w r e n c e B e r k e l e y
N a t i o n a l L a b o r a t o r y ( m r o s s @ u m i c h . e d u ) .
Are SUVs Really
Safer Than Cars?
B Y T O M W E N Z E L A N D M A R C R O S S
3 A C C E S SN U M B E R 2 1 , F A L L 2 0 0 2
TWO TYPES OF RISK
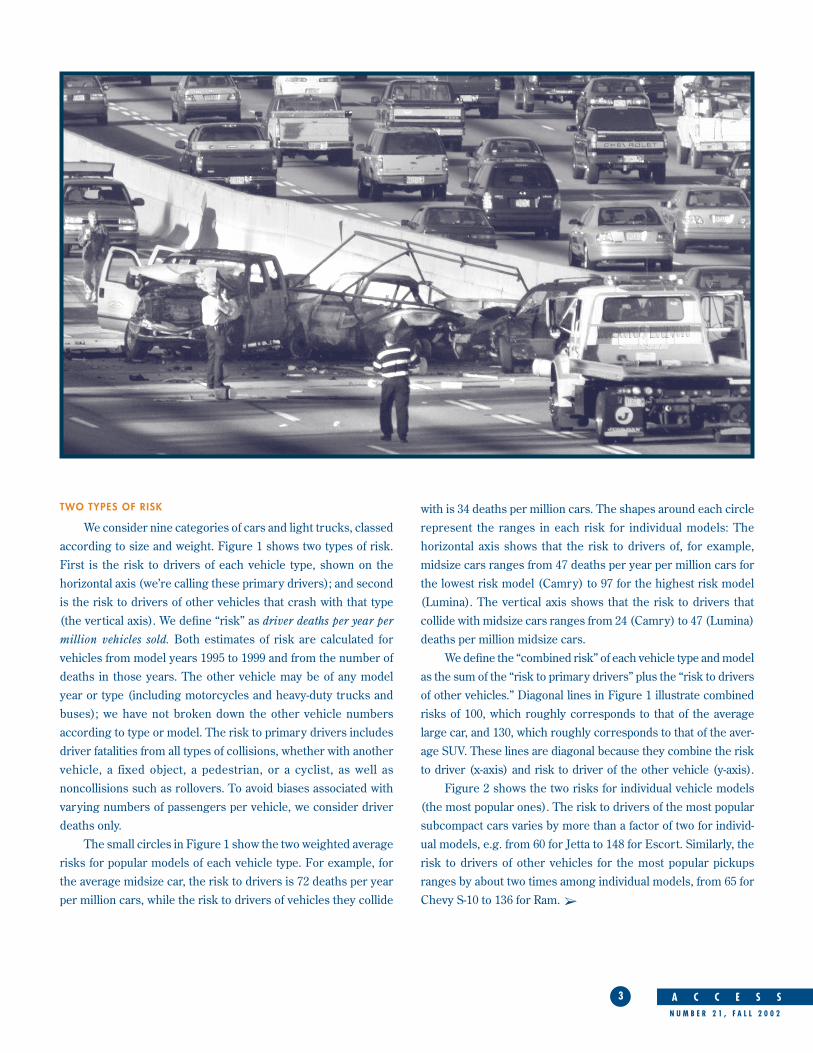
We consider nine categories of cars and light trucks, classedaccording to size and weight. Figure 1 shows two types of risk.First is the risk to drivers of each vehicle type, shown on the horizontal axis (we’re calling these primary drivers); and secondis the risk to drivers of other vehicles that crash with that type(the vertical axis). We define “risk” as driver deaths per year per
million vehicles sold. Both estimates of risk are calculated forvehicles from model years 1995 to 1999 and from the number ofdeaths in those years. The other vehicle may be of any modelyear or type (including motorcycles and heavy-duty trucks andbuses); we have not broken down the other vehicle numbersaccording to type or model. The risk to primary drivers includesdriver fatalities from all types of collisions, whether with anothervehicle, a fixed object, a pedestrian, or a cyclist, as well as noncollisions such as rollovers. To avoid biases associated withvarying numbers of passengers per vehicle, we consider driverdeaths only.
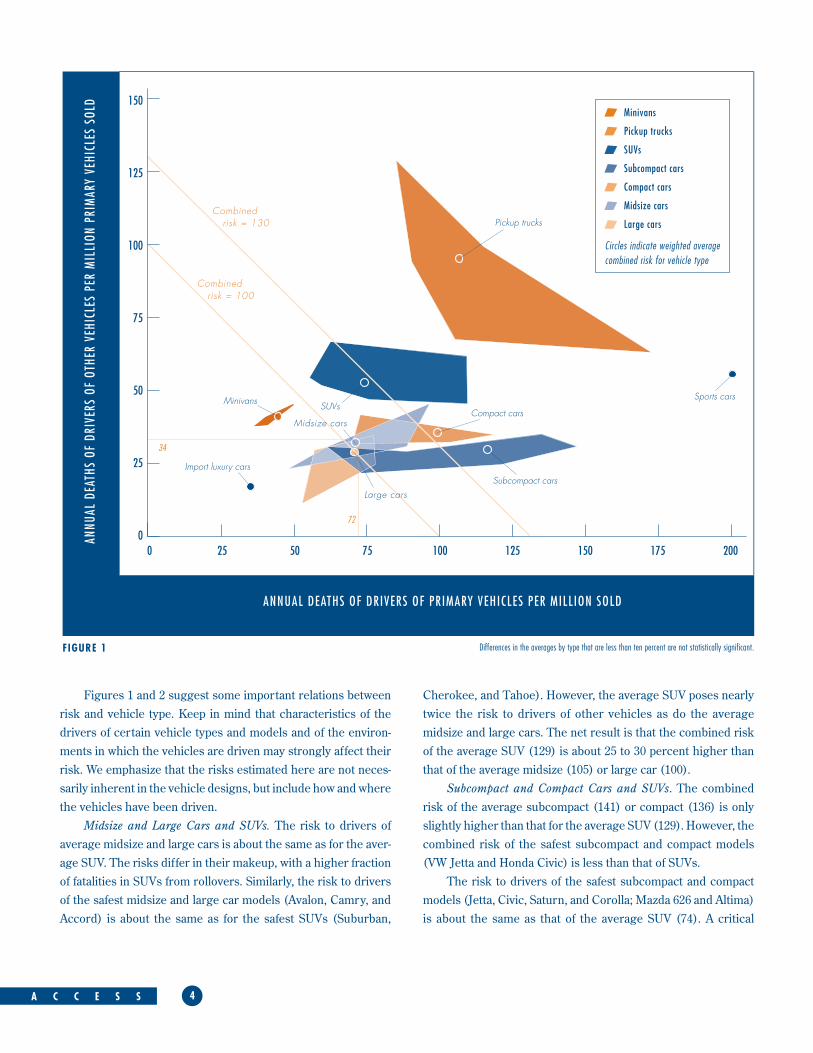
The small circles in Figure 1 show the two weighted averagerisks for popular models of each vehicle type. For example, forthe average midsize car, the risk to drivers is 72 deaths per yearper million cars, while the risk to drivers of vehicles they collide
with is 34 deaths per million cars. The shapes around each circlerepresent the ranges in each risk for individual models: The horizontal axis shows that the risk to drivers of, for example, midsize cars ranges from 47 deaths per year per million cars forthe lowest risk model (Camry) to 97 for the highest risk model(Lumina). The vertical axis shows that the risk to drivers that collide with midsize cars ranges from 24 (Camry) to 47 (Lumina)deaths per million midsize cars.
We define the “combined risk” of each vehicle type and modelas the sum of the “risk to primary drivers” plus the “risk to driversof other vehicles.” Diagonal lines in Figure 1 illustrate combinedrisks of 100, which roughly corresponds to that of the averagelarge car, and 130, which roughly corresponds to that of the aver-age SUV. These lines are diagonal because they combine the riskto driver (x-axis) and risk to driver of the other vehicle (y-axis).
Figure 2 shows the two risks for individual vehicle models(the most popular ones). The risk to drivers of the most popularsubcompact cars varies by more than a factor of two for individ-ual models, e.g. from 60 for Jetta to 148 for Escort. Similarly, therisk to drivers of other vehicles for the most popular pickupsranges by about two times among individual models, from 65 forChevy S-10 to 136 for Ram. ➢
4A C C E S S
Figures 1 and 2 suggest some important relations betweenrisk and vehicle type. Keep in mind that characteristics of thedrivers of certain vehicle types and models and of the environ-ments in which the vehicles are driven may strongly affect theirrisk. We emphasize that the risks estimated here are not neces-sarily inherent in the vehicle designs, but include how and wherethe vehicles have been driven.
Midsize and Large Cars and SUVs. The risk to drivers ofaverage midsize and large cars is about the same as for the aver-age SUV. The risks differ in their makeup, with a higher fractionof fatalities in SUVs from rollovers. Similarly, the risk to driversof the safest midsize and large car models (Avalon, Camry, andAccord) is about the same as for the safest SUVs (Suburban,
Cherokee, and Tahoe). However, the average SUV poses nearlytwice the risk to drivers of other vehicles as do the average midsize and large cars. The net result is that the combined riskof the average SUV (129) is about 25 to 30 percent higher thanthat of the average midsize (105) or large car (100).
Subcompact and Compact Cars and SUVs. The combinedrisk of the average subcompact (141) or compact (136) is onlyslightly higher than that for the average SUV (129). However, thecombined risk of the safest subcompact and compact models(VW Jetta and Honda Civic) is less than that of SUVs.
The risk to drivers of the safest subcompact and compactmodels (Jetta, Civic, Saturn, and Corolla; Mazda 626 and Altima)is about the same as that of the average SUV (74). A critical
Pickup trucks
Sports carsMinivans
Subcompact carsImport luxury cars
Compact carsSUVs
ANNUAL DEATHS OF DRIVERS OF PRIMARY VEHICLES PER MILLION SOLD
ANNU
AL D
EATH
S OF
DRI
VERS
OF
OTHE
R VE
HICL
ES P
ER M
ILLI
ON P
RIM
ARY
VEHI
CLES
SOL
D
0 25 50 75 100 125 150 175 200
150
125
100
75
50
25
0
Combined risk = 130
Combined risk = 100
F IGURE 1 Differences in the averages by type that are less than ten percent are not statistically significant.
72
34
Minivans
Pickup trucks
SUVs
Subcompact cars
Compact cars
Midsize cars
Large cars
Circles indicate weighted averagecombined risk for vehicle type
Large cars
Midsize cars

5 A C C E S SN U M B E R 2 1 , F A L L 2 0 0 2
aspect of the dispute regarding the relative danger to occupantsof light or small cars is the very wide range in the risk to driversof subcompacts. At one end are the low-risk Jetta and Civic mod-els, but at roughly twice their risk are the Cavalier, Escort, andNeon models. The latter three inexpensive domestic models areresponsible for greatly raising the average risk to drivers of sub-compact cars. Does the safety record of those three modelsprove that light cars in general are unsafe? We have presentedevidence that there is no such simple rule. Might it instead sug-gest that relatively inexpensive cars tend to be unsafe? Therecent National Academy majority report on fuel economyargues that the low weight of cars with high fuel economy hasresulted in many excess deaths. That inference is unfounded.
Figure 1 shows that the risk associated with lightweight cars hasa very wide range. In other words, weight does not determinethe risk. New vehicle designs that pay close attention to safetyconsiderations have helped make many cars in the subcompact-to-midsize range as safe as large cars and SUVs.
Minivans. Of all major vehicle types, minivans have the low-est primary risk and the lowest combined risk (excluding luxuryimports). This happy outcome may reflect their drivers’ specialcare, for they are often used to transport children. But it alsoreflects minivan design, for most are built on car platforms,rather than on pickup-truck chassis. That basic design featureprobably reduces the risk to their drivers, and certainly reducesthe risk to other drivers. For example, the car-like body of ➢
ANNUAL DEATHS OF DRIVERS OF PRIMARY VEHICLES PER MILLION SOLD FROM 1995 TO 1999 FOR MOST MODELS
ANNU
AL D
EATH
S OF
DRI
VERS
OF
OTHE
R VE
HICL
ES P
ER M
ILLI
ON P
RIM
ARY
VEHI
CLES
SOL
D
0 25 50 75 100 125 150 175 200
150
125
100
75
50
25
0
Dodge Ram
Ford F-Series
Chevy C/K
GMC C/K
Ranger
Blazer Chevy S-10
Explorer
Avalon
CherokeeChevy Suburban
Tahoe
Cavalier/Sunfire
Escort/Tracer
Neon
Chevy Prizm
Stratus & Saturn
Taurus/Sable
Lumina
4Runner
Marquis
Civic
Corolla
LeSabre
AccordMaxima
Intrepid &Mazda 626
Jetta
Bonneville
Camry
Caravan, Voyager& Windstar
Chevy AstrovanAltima
Grand Am
Contour/Mystique
Minivans
Pickup trucks
SUVs
Subcompact cars
Compact cars
Midsize cars
Large cars
F IGURE 2 Differences in the models that are less than twenty percent are not statistically significant.
Sentra

6A C C E S S
the Grand Cherokee, an SUV, presents about twenty percentlower risk to its drivers than does the truck-based Cherokee (asuggestive result, although not statistically significant).
Pickup Trucks. Pickup trucks are riskier than any other typeof vehicle, excluding sports cars. Their average combined risk is more than twice that for large or midsize cars. Light trucks,especially pickups and to a lesser extent SUVs, are responsiblefor the deaths of many people in other vehicles, as shown by thevertical axis in Figure 1. This result mirrors earlier findings byHans Joksch, who examined the outcomes of two-vehiclecrashes as reported to the police. He found that there are twiceas many driver deaths in pickup-car crashes as in car-car crashesand 1.8 as many deaths in SUV-car crashes as in car-car crashes.To a substantial degree, the risks that light trucks impose onother drivers are associated with their basic design. The chassisof pickups and most SUVs are more rigid than those of cars, andthe bumpers are higher. Moreover, these deaths to others occurlargely in urban and suburban settings, where pickups are rarelyused to carry cargo.
The risk to drivers of pickups is a distinct issue. That risk isnot significantly different from that of average compact and sub-compact cars. The pickup risk is partly due to trucks driven inrural areas, where conditions are relatively less safe owing tohigh speeds on poorly designed and policed roads, as well as thetendency of some of these vehicles to roll over.
Import Luxury and Sports Cars. Import luxury cars have thelowest combined risk, while sports cars have the highest com-bined risk of all vehicle types we studied. It is likely that much ofthe high risk of sports cars is associated with aggressive driving.
EFFECT OF DRIVER AND ENVIRONMENT ON RISK
It is extremely difficult to determine the inherent safety of a vehicle type or model, because driver characteristics andbehavior (speed, use of seat belts, aggressive lane-changing,etc.) and environmental factors (such as road conditions) cannotbe adequately accounted for. Some car models, such as mostsports cars, attract relatively aggressive drivers, and theiraggression increases fatalities associated with those models,

7 A C C E S SN U M B E R 2 1 , F A L L 2 0 0 2
independent of their design. The Chevy Corvette illustrates thatboth vehicle design and driver variables are important. Like drivers of other sports cars, Corvette drivers face a higher risk(275) than drivers of other types of cars (way off scale to the rightof Figure 2). But, although Corvettes are driven dangerously, therisk to drivers of vehicles that collide with Corvettes (25) is lowerthan that of the average midsize car (34, in Figure 1). The low-slung design and plastic body of the Corvette probably accountfor its low risk to other drivers.
To explore some of the effects of driver behavior, we alsolooked at driver age and gender in fatal crashes. We found no evidence that either factor accounts for the differences in riskdiscussed here. In the future, we plan to explore the effects ofother driver characteristics and environmental variables in anattempt to refine our analysis.
CONCLUSIONS
Opponents of strengthened fuel-economy standards claimhigher standards will result in more traffic fatalities. If the newfleet were to be like the recent average light vehicle, trafficdeaths probably would increase, as shown by the increase inrisks to drivers as one goes from the average midsize and largecars to the average compact and subcompact cars, as shown inFigure 1. That simple conclusion mirrors the statistical analysesemphasized in the National Academy fuel-economy study. Butthat simple conclusion is probably wrong.
Many existing small-car models, built primarily by foreignmanufacturers, are as safe as their larger and heavier (and lessefficient) counterparts, as shown in Figure 2. There is reason toexpect that manufacturers can further improve the safety of vehicles by making them lighter without making them smaller,given such technological advances as smaller high-tech enginesand transmissions, unibody or space-frame structures replacingthe body-on-frame of most SUVs and pickup trucks, andincreased use of lightweight materials. While it is reasonable toexpect that increased fuel economy standards would make forlighter vehicles, we have shown that reduced vehicle weightdoes not imply reduced safety. ◆
Acknowledgment: Thanks to John DeCicco, David Greene, and Therese
Langer for valuable comments on the manuscript, and to Kenneth Campbell,
Charlie Compton, Hans Joksch, Carl Nash, and Matt Reed for trying to
educate us about traffic safety analysis. In spite of this help, the responsibility
for all opinions and any errors rests with the authors. We thank The Energy
Foundation for supporting this work.
F U R T H E R R E A D I N G
H.C. Gabler and William T. Hollowell. The Aggressivity of Light Trucks
and Vans in Traffic Crashes. SAE Technical Paper Series 980908.
Warrendale, Penn.: Society of Automotive Engineers. 1998.
William T. Hollowell and H.C. Gabler. “NHTSA’s Vehicle Aggressivity
and Compatibility Research Program,” in Proceedings of the Fifteenth
International Technical Conference on the Enhanced Safety of
Vehicles, Volume 1, pp. 576–592. Paper No. 96-S4-O-01. Washington,
D.C.: US Department of Transportation, National Highway Traffic
Safety Administration. 1996.
Insurance Institute for Highway Safety. Status Report Special Issue:
Driver Death Rates. Vol. 35, no. 7, August 19, 2000.
Hans Joksch. Vehicle Aggressivity: Fleet Characterization Using
Traffic Collision Data. NHTSA DOT HS 808 679. Washington, D.C.:
US Department of Transportation, National Highway Traffic Safety
Administration. 1998.
Hans Joksch. Vehicle Design versus Aggressivity. NHTSA DOT HS
809 194. www-nrd.nhtsa.dot.gov/pdf/nrd-11/DOT_HC_809194.pdf.
Washington, D.C.: US Department of Transportation, National
Highway Traffic Safety Administration. 2000.
National Academy, Effectiveness and Impact of Corporate Average
Fuel Economy (CAFE) Standards, National Research Council. 2001
Marc Ross and Tom Wenzel. An Analysis of Traffic Deaths by Vehicle
Type and Model. Washington, DC: American Council for an Energy
Efficient Economy. Report No. T021. 2001. www.aceee.org/pubs/
t021full.pdf