are self-employment training programs effective self-employment training programs effective?...
TRANSCRIPT

Are Self-Employment Training Programs Effective?
Evidence from Project GATE
Marios Michaelides IMPAQ International
Jacob Benus IMPAQ International
April 2012
Abstract
We examine the efficacy of providing self-employment training to unemployed and other
individuals interested in self-employment using data from Project GATE. This experimental
design program offered self-employment training services to a random sample of individuals
who expressed a strong interest in self-employment. We find Project GATE was effective in
helping unemployed participants to start their own business, leading to significant impacts in
self-employment and overall employment soon after program entry. The program also helped
unemployed participants remain self-employed and avoid unemployment even five years after
program entry. However, the program was not effective in improving the labor market outcomes
of participants who were not unemployed.
Keywords: self-employment, entrepreneurship, small business, unemployment, workforce development,
training, SEA, Project GATE.

Page 1
Introduction
Self-employment has historically played an important role in the U.S. economy. Many
workers in the U.S. view self-employment as an attractive alternative to salary employment
because it provides an opportunity for self-sufficiency, high earnings, and upward social mobility
(Bates, 1997; Fischer and Massey, 2000; Keister, 2000; Bucks et al., 2006). In fact, for the past
few decades, nearly 10 percent of U.S. workers have been self-employed (Bregger, 1996; Fairlie,
2004; Blanchflower, 2009). Self-employment is also important from a macroeconomic
perspective, since small businesses employ a large share of the workforce and produce important
innovations that contribute to the overall growth of the U.S. economy (Acs, 1999; Manser and
Picot, 1999; Lerner, 2002; Minniti and Bygrave, 2004; Davis et al., 2008).
To encourage the creation and growth of small businesses, U.S. policymakers have
established a variety of programs that provide self-employment training, technical support, and
financial assistance to unemployed and other individuals interested in self-employment
(Schreiner, 1999; Walker and Blair, 2002; Wandner, 2008). The objective of these programs is
to help aspiring business owners gain a better understanding of all aspects of starting and
operating a new business and obtaining access to start-up capital and credit. The expectation is
that self-employment programs will assist unemployed and other individuals in overcoming the
obstacles they face in pursuing self-employment, leading to the creation of viable small
businesses (Benus, 1994; Vroman, 1997; McKernan and Chen, 2005). Despite the growing
interest in self-employment programs, there is limited evidence on whether they are actually
effective in promoting self-employment participation and success.
This paper provides evidence on the efficacy of providing self-employment training services
without any financial support to unemployed and other individuals interested in self-

Page 2
employment. For our analyses, we use data from Project GATE (Growing America Through
Entrepreneurship), the most recent experimental design self-employment program implemented
in the U.S. Project GATE offered an array of self-employment training services to a random
sample of individuals who expressed a strong interest in self-employment. Unlike most programs
implemented in the U.S. and elsewhere, Project GATE did not provide participants with any type
of financial support, and it accepted applications from all interested individuals – unemployed,
employed, self-employed, or not in the labor force. The program’s design provides a unique
opportunity to examine the efficacy of providing self-employment training without any financial
support to unemployed and other individuals interested in self-employment.
In the remainder of this paper, we examine the impact of Project GATE on the following
participant outcomes: likelihood of starting a new business, likelihood of self-employment in a
new business, self-employment, salary employment, overall employment, and earnings. Our
results show that Project GATE was effective in assisting unemployed participants start their
own business, leading to significant gains in self-employment and overall employment in the
first months following program entry. The program was also effective in assisting unemployed
participants to remain self-employed even 5 years after program entry. However, we find no
evidence that the program was effective in assisting non-unemployed participants improve their
labor market outcomes. Based on these results, we conclude that U.S. state workforce agencies
should consider adopting self-employment training programs targeting the unemployed as part of
their workforce development agenda.

Page 3
1. Background
1.1. Self-Employment Programs in the U.S.
In the past 20 years, self-employment programs have received considerable attention from
various U.S. government agencies, including the U.S. Department of Labor (DOL). In the early
1990s, DOL funded two demonstration programs, the Washington Self-Employment and
Enterprise Development Program and the Massachusetts Enterprise Project. These experimental
design programs provided self-employment training and monetary assistance to unemployed
workers interested in self-employment (Benus et al., 1995). These programs were implemented
to assess if self-employment training combined with financial assistance is effective in
promoting the reemployment of unemployed workers through self-employment.
Following the success of these demonstrations, Congress authorized states to establish self-
employment assistance (SEA) programs for a 5-year period under the North America Free Trade
Agreement (NAFTA) Implementation Act of 1993. SEA programs provided states with the
ability to offer self-employment training to Unemployment Insurance (UI) recipients as a means
to promote their reemployment and facilitate their early exit from the UI system (Kosanovich et
al., 2002). SEA programs were permanently authorized by Congress in 1998. Since then, 11
states have passed SEA-enabling legislation; of these states, Delaware, Maine, Maryland,
Minnesota, Oregon, Pennsylvania, New Jersey, and New York implemented SEA programs as
part of their workforce development agenda. Unfortunately, participation in SEA programs in
these few states was limited by the fact that states lacked the necessary resources to provide
consistent and reliable self-employment training to interested individuals; thus, only between 1-2
percent of all UI claimants participated in SEA in recent years (Wandner, 2008).

Page 4
In recent years, there has been a growing interest in understanding the potential benefits of
providing self-employment training to all interested individuals, not just unemployed workers. In
2002, DOL partnered with the Small Business Administration (SBA) to sponsor Project GATE
(Growing America Through Entrepreneurship), an experimental design demonstration program
that provided self-employment training to individuals who expressed a strong interest in self-
employment. Project GATE, implemented in Maine, Minnesota, and Pennsylvania, was designed
as an experiment to examine whether self-employment training is effective for unemployed and
other individuals (Bellotti et al., 2006; Benus et al., 2009). During the implementation of Project
GATE, DOL issued a directive to states to expand their Workforce Investment Act (WIA)
funded activities to provide entrepreneurship training to all customers of the state workforce
development system.1 These efforts show the commitment of policymakers to expand the role of
self-employment training in the U.S. workforce development system.
In addition, several programs have been established to assist aspiring and existing small
business owners overcome limited access to start-up capital and credit. According to the Aspen
Institute’s directory of U.S. microenterprise programs (Walker and Blair, 2002), more than 600
microenterprise programs in 2002 provided a combination of financing subsidies, assistance with
government procurement, and business counseling to small businesses. Among these were 55
Federal programs, of which 37 were supported by the SBA. The importance of microenterprise
programs in supporting small businesses in the U.S. economy has since grown. A recent Aspen
Institute report shows that, from 2002 to 2008, these programs experienced significant growth in
1 Title I of the WIA Act of 1998 allows states to “provide adults and dislocated workers occupational skills training,
including training for nontraditional employment, and entrepreneurial training.” U.S. Department of Labor Training
and Employment Guidance Letter No. 16-04 (February 2005) requested states to “encourage local workforce
investment boards to consider entrepreneurial training programs for WIA customers as part of their menu of services
and to explore the appropriate partnerships to support these training programs.” The same letter encouraged states
“to include entrepreneurial training providers on their eligible training provider lists.”

Page 5
the number of participants (14 percent), the loan amounts disbursed (51 percent), and their total
microloan capital (85 percent).2 During the same period, SBA’s budget increased from $493
million in 2002 to $555 million in 2008. In fact, SBA’s budget has grown dramatically since
then; for 2011, SBA received a budget of nearly one billion dollars ($994 million) to support
small businesses, which is $170 million (21 percent) higher than the SBA’s 2010 budget.3
Despite the growing interest in self-employment programs, Benus et al. (1995) is the only
study that provides credible evidence on the efficacy of such programs in the U.S. Using data
from the Washington and Massachusetts experimental design demonstrations of the early 1990s,
that study shows that participants experienced significant gains in self-employment (44 percent),
overall employment (24 percent), and earnings (18 percent). The study concludes that providing
self-employment training and financial assistance to the unemployed is an effective
reemployment policy that should be widely adopted by state workforce agencies.
A study funded by DOL (Kosanovich et al., 2002) finds that SEA participants in Maine, New
Jersey, and New York were 55 percent more likely to enter self-employment and had 18 percent
higher total earnings than those who chose not to participate. However, the authors acknowledge
that, since the control group included individuals who declined SEA participation, these
differentials do not constitute reliable impact estimates. So, to date, there is no evidence whether
providing self-employment training without any financial support is an effective policy tool for
improving the labor market outcomes of unemployed or other individuals interested in self-
employment. Finally, there are no studies that provide evidence on the impacts of
microenterprise programs in the U.S., mainly due to lack of appropriate comparison groups
(McKernan and Chen, 2005).
2 U.S. Microenterprise Census Highlights, FY 2008 Data, The Aspen Institute, Washington, DC.
3 Source: Budget of the U.S. Government, Fiscal Year 2011, Office of Management and Budget.

Page 6
1.2. Self-Employment Programs in Other Countries
Interest in self-employment programs has also grown in other developed and developing
countries. Several countries have established national programs to assist unemployed workers in
pursuing self-employment as part of their active labor market programs. The British Enterprise
Allowance Scheme, for example, provides a weekly allowance to unemployed individuals while
they attempt to start their own business; the Chomeurs Createurs program in France assists
unemployed individuals in starting businesses by providing them with start-up capital through
lump-sum payments in lieu of unemployment benefits (Benus et al., 1995; Meager, 1996). In
Germany, the Start-Up Subsidy and Bridging Allowance programs provide periodic payments to
unemployed individuals interested in starting their own business (Baumgartner and Caliendo,
2008; Caliendo and Künn, 2010). Similar programs have been implemented in Belgium,
Denmark, Italy, and Spain (Meager, 1996; Wandner, 2008).
Moreover, several countries have programs that provide a combination of financial assistance
and self-employment technical support to unemployed individuals, including Australia (Kelly et
al., 2002), Argentina (Almeida and Galasso, 2007), Poland and Hungary (O’Leary et al., 1998),
and Romania (Rodriquez-Planas, 2010). Furthermore, entrepreneurship education has been
incorporated in secondary and post-secondary school curricula in many European countries,
including Denmark, Germany, and the Netherlands (European Commission, 2008; Oosterbeek et
al., 2010).
Evaluations of self-employment assistance programs implemented in European and other
countries provide some promising evidence. Previous work shows that providing financial
support to unemployed workers interested in self-employment in Germany (Baumgartner and
Caliendo, 2008; Caliendo and Künn, 2010) and Sweden (Carling and Gustafson, 1999) was

Page 7
effective in assisting them become self-employed and avoid unemployment. There is also
evidence that unemployed individuals who received a combination of financial assistance and
self-employment training in Argentina (Almeida and Gallasso, 2007), Romania (Rodriquez-
Planas, 2010), and New Zealand (Perry, 2006) experienced significant gains in self-employment
and overall employment. Other work shows that providing start-up capital and financial
assistance to small businesses in Spain (Cueto and Mato, 2006) and Australia (Kelly et al., 2002)
is associated with improved business sustainability. However, to our knowledge, there are no
evaluations of programs that provide self-employment training without any financial assistance
to unemployed and other individuals interested in self-employment.
1.3. The Role of Self-Employment Training
Many workers consider self-employment as an attractive option for improving their overall
earnings and socioeconomic status (Bates, 1997; Keister, 2000). Employed workers, for
example, may view self-employment as an alternative to salary employment or as a way to
supplement their salary income. Self-employment is particularly attractive for unemployed
workers, who may consider self-employment as their only option to exit unemployment or as a
way to avoid labor market discrimination (Meager, 1992; Bates and Servon, 2000; Glocker and
Steiner, 2007). In fact, previous research shows that unemployed workers are significantly more
likely than their peers to pursue and enter self-employment (Bates and Servon, 2000; Rissman,
2003; Glocker and Steiner, 2007).
Unemployed and other individuals interested in self-employment may be willing to work
hard and invest a substantial portion of their time in their efforts to successfully pursue self-
employment, but also face several obstacles. For example, many aspiring business owners lack
self-employment experience and business background, so they do not have an in-depth

Page 8
understanding of all the different aspects of starting and operating a business. Previous work
shows that, controlling for human capital characteristics, individuals who lack self-employment
experience and business background are significantly less likely than their peers to enter self-
employment, remain self-employed, and achieve high earnings (Hout and Rosen, 2000; Dunn
and Holtz-Eakin, 2000; Fairlie and Robb, 2007). Another major impediment in pursuing self-
employment is limited access to start-up capital and business credit. Evidence suggests that,
accounting for individual skills and other pertinent characteristics, individuals with low access to
financing are much less likely than their peers to start and sustain their own business
(Blanchflower and Oswald, 1998; Fonseca et al., 2001; Cavalluzzo and Wolken, 2005).
Self-employment training services, such as training courses and individual business
counseling, are expected to help unemployed and other individuals interested in self-employment
gain a better understanding of the self-employment process, from the initial planning phase and
the actual start of business operations to implementing strategies to sustain and grow the
business. This process includes, but is not limited to, developing a comprehensive business plan,
obtaining information on credit options, applying for credit, hiring staff, producing marketing
materials, and dealing with various legal issues. So, although self-employment training is not
expected to eliminate the obstacles faced by aspiring business owners, it may enhance their
entrepreneurial and business skills, thus improving their chances of successfully pursuing self-
employment. Self-employment training may also improve the human capital of participants –
particularly the unemployed – and if their self-employment pursuit is unsuccessful, this may help
them to find salary jobs, avoid unemployment, and improve their earnings potential.
Based on the conclusions of previous research, we know that self-employment participation
and success are positively affected by individual human capital, self-employment experience and

Page 9
business background, and access to credit. We also know that unemployed workers are more
likely than their peers to actively pursue self-employment as a means to avoid unemployment
and achieve self-sufficiency. However, very little is known about the role of self-employment
training in assisting unemployed and other individuals interested in self-employment to achieve
their goals. Is self-employment training an effective policy for promoting the reemployment of
unemployed individuals? Is self-employment training effective in assisting non-unemployed
individuals to improve their labor market outcomes? The objective of this paper is to address
these research gaps.
2. Project GATE Overview
2.1. Program Description
In 2002, DOL partnered with the SBA to sponsor Project GATE, an experimental design
demonstration program that offered an array of free training and counseling services to
individuals interested in self-employment. The objective of this demonstration program was to
assess the efficacy of offering free self-employment training through the public workforce
development system to all individuals interested in self-employment (Benus et al., 2009). DOL
implemented Project GATE from 2003 through 2005 in Pennsylvania, Minnesota, and Maine.4
Interested individuals registered for the program in designated One-Stop Career Centers in five
sites: Philadelphia, Pittsburgh, Minneapolis/St. Paul, rural Minnesota, and rural Maine.5 These
five sites were selected to include both urban and rural areas (Benus et al., 2009). Project GATE
4 For practical reasons, DOL wanted to implement Project GATE in states that had already passed SEA-enabling
legislation and were providing self-employment training through their workforce system. Maine, Pennsylvania, and
Minnesota were among the first states to do both – for a discussion, see Wandner (2010), pp. 289-334. 5 Project GATE was implemented in 21 One-Stop Career Centers (7 in Pittsburgh, 5 in Philadelphia, 4 in
Minneapolis/St. Paul, 2 in rural Minnesota, and 3 in Maine). One-Stop Career Centers were established under the
Workforce Investment Act of 1998 (Public Law 105-220) to provide the full range of available public workforce
development system services for job seekers, including UI application assistance, job training referrals, career
counseling, job listings, and labor market information.

Page 10
included an outreach campaign to identify and recruit individuals interested in self-employment,
with One-Stop Career Centers serving as focal points of recruitment. Program sites advertised
the program through brochures, fliers, and posters. Additionally, the outreach campaign included
a website, a mass media marketing campaign (advertisements, media events, and public service
announcements), and networking with local organizations and government agencies.6
Following registration, individuals received an invitation to attend a mandatory orientation
meeting at a designated One-Stop Career Center. To ensure that all potential applicants received
consistent information, the orientation meeting included a video detailing the important features
of Project GATE. The video provided information on the benefits and risks of self-employment,
the application process, the random assignment process, and the services available through
Project GATE for those randomly selected to participate. Following the orientation meeting,
people wishing to participate in Project GATE had to complete an extensive application form.
The application form included demographic characteristics, employment status, and self-
employment experience. Further, the application form requested the applicant’s phone and
address, as well as the contact information of three alternate contacts (e.g., applicant spouse,
parents, brothers, and friends). The application also included an informed consent statement
indicating that the applicant understood that only half of the applicants would be selected to
receive program services and that selection would be based on a random process.
The required orientation and rigorous application process was designed to attract applicants
who were willing to make a substantial effort to reach the random selection phase. Thus, this
process ensured that program applicants had a strong interest in self-employment. A total of
4,198 individuals applied for Project GATE; 2,095 were randomly assigned to the treatment
group and 2,103 were assigned to the control group. Project GATE thus represents the largest
6 For more details on the outreach campaign for Project GATE, see Bellotti et al. (2006), pp. 37-52.

Page 11
experimental design self-employment program implemented in the U.S., surpassing the 2,729
total applicants in the early 1990s demonstration programs in Washington and Massachusetts
(Benus et al., 1995). Project GATE applicants assigned to the treatment were offered program
services; those assigned to the control were not offered any program services but were free to
seek similar services elsewhere.
Program services were designed to help treatment group participants gain a better
understanding of the process of starting and operating a new business and to inform them of
various business financing options (Bellotti et al., 2006; Benus et al., 2009). Following random
assignment, treatment group members were invited to an individual assessment session with a
business counselor – nearly all treatment group members attended this session. The objective of
this assessment was for the counselor to recommend available program services that best met the
participant’s needs. Treatment group members were then offered an array of training courses
about the different aspects of starting and operating a business, including developing a business
plan, financing, marketing, hiring staff, and various legal issues. Advanced courses covered
topics such as business growth strategies, business planning, and customer relations.
Additionally, the program offered a business counseling session that provided an opportunity for
participants to meet one-on-one with a business counselor to discuss their business idea, receive
help producing or refining their business plan, and obtain information on various financing
sources, including the SBA MicroLoan program.
Findings from Project GATE’s implementation report (Bellotti et al., 2006) indicate that 90
percent of treatment group members attended the individual assessment session. Furthermore, 76
percent of all treatment group members received program services: 42 percent attended training
courses and received the business counseling session; 13 percent only attended training courses;

Page 12
and 21 percent only received the business counseling session. The average treatment group
member received 13.0 hours of Project GATE services – 1.2 hours for the individual assessment,
10.5 hours for various training courses, and 1.3 hours for the business counseling session. It is
important to note that control group members were free to receive similar self-employment
training elsewhere. Indeed, 35 percent of control group members did so: 10 percent attended
training courses and received individual business counseling; 20 percent attended training
courses; and 5 percent received individual business counseling.
Local service providers, selected through a competitive process, provided Project GATE
services. Interested service providers submitted capabilities statements, exhibiting their
experience and capacity for providing self-employment services. Based on this information, five
SBA Small Business Development Centers and nine nonprofit community-based organizations
were selected to provide program services. These organizations provided experienced business
counselors, who conducted the individual assessment and business counseling sessions and the
training courses. The average Project GATE cost per treatment group participant was $859
(Benus et al., 2009), which includes the amounts paid to service providers for program services
and all other costs related to providing services to program participants.
2.2. Characteristics of Project GATE Applicants
Project GATE outreach efforts were designed to reach a broad group of individuals interested
in obtaining self-employment training services. However, since One-Stop Career Centers played
a major role in the outreach effort, customers of the public workforce development system
constituted a key target group for applicant recruitment. As a result, program applicants may not
be broadly representative of all individuals interested in self-employment. To shed light on the

Page 13
representativeness of the Project GATE sample, Table 1 presents the characteristics of the U.S.
labor force, the self-employment population, and Project GATE applicants.7
As shown in Table 1, the gender distribution of applicants mirrored the gender distribution of
the U.S. civilian labor force in 2003: 54 percent men and 46 percent women. Women accounted
for 46 percent of program applicants and for 34 percent of the self-employed; a t-test comparison
indicated this difference was not statistically significant. The proportion of black applicants (31
percent) greatly exceeded the proportion of blacks in the labor force (11 percent) and in the self-
employed population (5 percent); these differences were statistically significant at the 5 percent
level. About one quarter (26 percent) of applicants had a high school diploma or lower education
compared to 64 percent of labor force participants and 60 percent of the self-employed. These
differences were statistically significant at the 1 percent level. Moreover, program applicants
were significantly more likely than labor force participants and self-employed workers to be in
the lowest household income bracket.
The employment status of program applicants is of particular interest. As shown in Table 1,
7 percent of the U.S. civilian force was unemployed in 2003 compared to 43 percent of Project
GATE applicants. The high proportion of unemployed applicants may be due to a variety of
factors, including the fact that One-Stop Career Centers were the focal point for outreach. This
is also an indication that unemployed individuals had a strong interest in pursuing self-
employment and in participating in self-employment training. The remaining program applicants
were employed in a salary job (28 percent), self-employed (16 percent), or not in the labor force
(13 percent) at the time of application.
7 The characteristics of the U.S. labor force and the self-employed population are from 2003 to correspond to the
start of the program’s implementation period.

Page 14
Table 2 presents selected characteristics of applicants who were unemployed at the time of
application and of other applicants (employed, self-employed, or not in the labor force). There
were only minor differences in characteristics across the four groups, and t-test comparisons
showed there were no statistically significant differences. Notably, only about a quarter of
unemployed, employed, or not in the labor force applicants had previous self-employment
experience. This indicates that many applicants lacked self-employment background and
experience, which is widely cited as an important obstacle in pursuing self-employment (e.g.,
Dunn and Holtz-Eakin, 2000; Fairlie and Robb, 2007). Nearly half of all applicants had poor
credit histories and nearly half of all applicants received financial support from family members
while pursuing self-employment. Furthermore, most applicants had an annual household income
of less than $75,000 at the time of application. These figures suggest that many applicants had
limited access to credit at the time of application, a major impediment in starting and sustaining
a business (e.g., Blanchflower et al., 2003; Cavalluzzo and Wolken, 2005).
2.3. Random Assignment
Following application, applicants were randomly assigned to the treatment or to the control
group; of the 4,198 total applicants, 2,095 were assigned to the treatment and 2,103 were
assigned to the control. If random assignment (RA) was successfully implemented, there should
not be any treatment-control group differences in observable and unobservable characteristics at
the time of application. To establish that RA was successful, we calculated treatment-control
group differences in means for each observable applicant characteristic and used t-tests to assess
whether these differences were statistically significant. Our results show no statistically

Page 15
significant differences in available characteristics between treatment and control group
members.8
Furthermore, we estimated a linear regression model where the dependent variable is the
likelihood of being assigned in the treatment group and the covariates include all available
applicant characteristics. If RA was successful, the estimated model parameters should not be
statistically significant, indicating there was no relationship between observed applicant
characteristics and treatment group assignment. Our regression results show that none of the
estimated parameters were statistically significant.9 Finally, to ensure that treatment and control
group members were identical in all observed characteristics and in the interactions of observed
characteristics, we used multivariate analysis of variance (MANOVA) tests. The MANOVA F-
statistic tests the null hypothesis that there were no treatment-control group differences in
characteristics and in the interactions of those characteristics.10
The MANOVA F-statistic was
0.89 with a p-value of .632, indicating that the null hypothesis cannot be rejected.11
These results
provide confidence that applicants were successfully randomized; thus any differences in post-
RA outcomes between treatment and control group members can be attributed to the program.
2.4. Applicant Responses to Follow-Up Surveys
Three follow-up surveys, conducted 6 months (Wave 1), 18 months (Wave 2), and 60 months
(Wave 3) after RA, documented applicants’ post-RA labor market outcomes. To trace applicants
for the follow-up surveys, program survey staff used the contact information of the applicant and
8 Similar results were obtained when we compared the treatment-control group characteristics separately for
unemployed and for non-unemployed applicants. Results are available upon request. 9 Note that similar results were obtained when we estimated this model separately for unemployed and for non-
unemployed applicants. Also, similar results were obtained using logistic and probit regressions to estimate these
models. Results are available upon request. 10
The MANOVA F-test can be produced based on four statistics: 1) Wilks’ lambda, 2) Lawley-Hotelling trace, 3)
Pillai’s trace, and 4) Roy’s largest root. The four methods produced identical F-statistics and p-values. 11
Similar results were obtained when we produced the MANOVA F-statistic separately for unemployed applicants
(p-value = .748) and for non-unemployed applicants (p-value = .613).

Page 16
three alternate contacts provided in the application form. Two weeks prior to survey
implementation, survey notification letters were sent to applicants notifying them of the
upcoming phone survey and requesting their input on the most convenient times to reach them.
Applicants were given the choice of providing this information either by calling a toll-free
number or through mail. The letter also specified that those who took the phone survey would
receive a $15 incentive payment.
The surveys started within 2 weeks of sending the letters. When survey staff was unable to
reach the applicant, the alternate contacts were contacted. In cases where alternate contacts
provided a new applicant address and telephone number, the survey notification letter was sent to
the new address and survey staff used the new phone number for completing the survey. As a
result of this process, 82 percent of all applicants responded to the Wave 1 survey; 88 percent of
Wave 1 respondents responded to the Wave 2 survey; and 81 percent of Wave 2 respondents
responded to the Wave 3 survey for a 58 percent cumulative 60-month response rate.
While the response rate at each survey exceeded 80 percent, reasonable concerns remain
about potential cumulative non-response bias. A careful examination of applicant characteristics
shows that the characteristics of applicants at RA were nearly identical to the characteristics of
the respondents at each survey (see Appendix Table A). Therefore, survey non-response did not
lead to substantial changes in the characteristics distribution of program applicants.
Furthermore, we conducted MANOVA tests to assess whether there were disparities in
characteristics between treatment and control group respondents at each survey. We did not find
any significant treatment-control differences in the three follow-up surveys.12
These analyses
12
MANOVA F-statistics were produced for all applicants (p-values: Wave 1 = .789; Wave 2 = .777; and Wave 3=
.659), unemployed applicants only (p-values: Wave 1 = .664; Wave 2 = .479; and Wave 3 = .683), and other
applicants only (p-values: Wave 1 = .533; Wave 2 = .780; and Wave 3 = .775).
Page 17
indicate that the treatment-control balance in observed characteristics was maintained for each
group of program applicants, mitigating concerns about survey non-response bias.13
Using responses to the three surveys, we constructed the following outcomes: started a new
business between RA and the time of the survey; self-employed at the time of the survey in a
business started within 6 months of RA; self-employed at the time of survey; employed in a
salary job at the time of survey; and employed (i.e., self-employed or employed in a salary job)
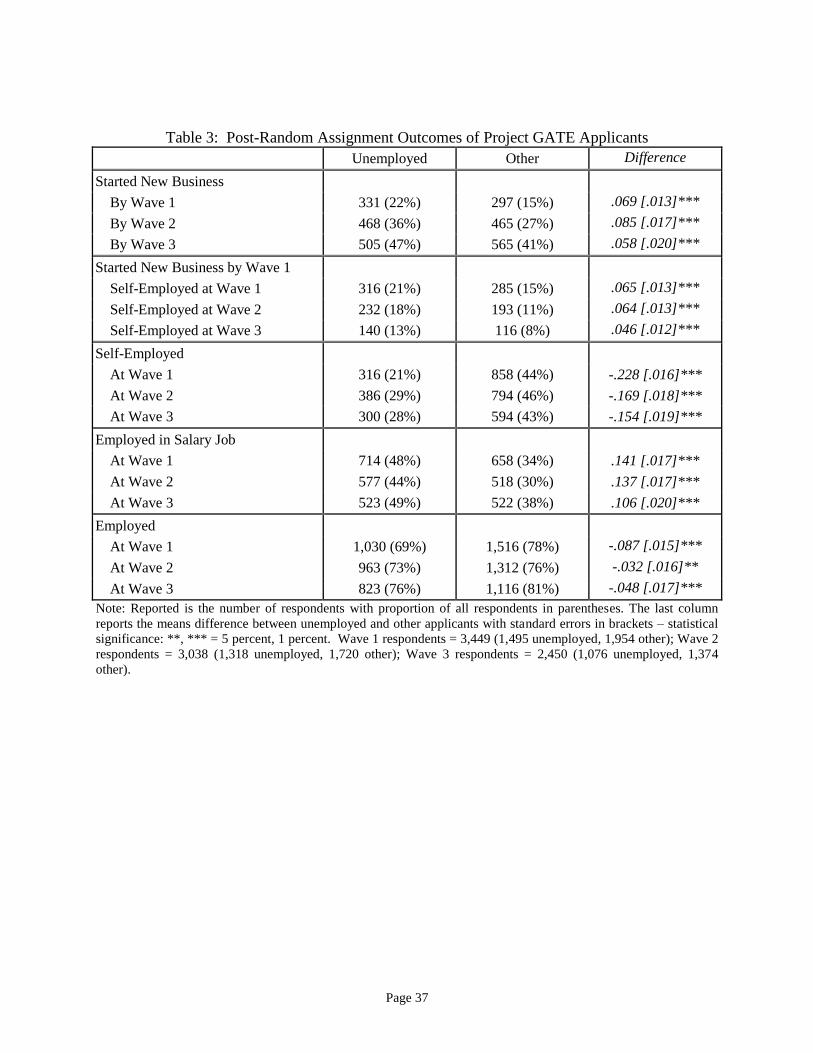
at the time of the survey. Table 3 presents these outcomes for unemployed and other applicants.
As shown in Table 3, 331 (22 percent) of unemployed applicants started a new business by
Wave 1, 468 (36 percent) started a new business by Wave 2, and 505 (47 percent) started a
business by Wave 3. As the last column of Table 3 shows, unemployed applicants were more
likely than non-unemployed applicants to start a new business by the time of each survey. As a
result, the unemployed were more likely than their peers to be self-employed in a new business
following program entry. For example, 21 percent of unemployed and 15 percent of other
applicants were self-employed at Wave 1 in a business started within 6 months of RA – the
difference was 6.5 percentage points and statistically significant at the 1 percent level. Similarly,
unemployed applicants were 6.4 and 4.6 percentage points more likely than their peers to be self-
employed in a new business at Wave 2 and Wave 3, respectively. These differences are
consistent with previous research that the unemployed are more likely than their peers to start a
new business and enter self-employment.
13
In general, if survey attrition is associated with post-program success among participants in a way that differs
from the attrition association in the control group, this may induce bias in program impact estimates. However, the
results of our tests show that attrition did not differ between the treatment and the control group based on participant
characteristics that predict post-program success. These results do not completely eliminate the possibility that there
is some sample attrition bias, but they do show that such bias is less plausible, since a mechanism that would induce
treatment-control differences in the association between attrition and outcome success, but not for characteristics
related to success, would be quite complex.

Page 18
Table 3 also shows that, despite the fact that the unemployed were more likely than non-
unemployed applicants to start a new business after program entry, they remained less likely to
be self-employed at each survey. On the other hand, unemployed applicants were significantly
more likely than other applicants to be employed in a salary job at each survey. Notably, the
self-employment proportion of unemployed (28 percent) and non-unemployed applicants (43
percent) at Wave 3 much exceeded the U.S. self-employment proportion (10 percent).14
This
may be partly attributed to the fact that Project GATE applicants were much more interested than
average in starting their own business and becoming self-employed. Furthermore, about 76
percent of treatment group members received Project GATE services and 35 percent of control
group members received similar services elsewhere. These services may have helped them start
their own business and remain self-employed long after program entry. Finally, Table 3 shows
that unemployed applicants were 8.7 percentage points less likely to be employed (i.e., self-
employed or in a salary job) at Wave 1 relative to other applicants. This gap was lower at Waves
2 and 3.
Survey respondents also provided information on their personal earnings at the time of each
survey.15
Table 4 presents the average self-employment earnings, salary earnings, and total
earnings at each survey for all unemployed and non-unemployed applicants. Unemployed
applicants had an average of $1,821 in self-employment earnings at Wave 1; this increased to
$2,483 at Wave 2 and to $3,505 at Wave 3.16
As the last column of Table 4 shows, unemployed
14
Source: Tabulations of the American Community Survey, 2008 and 2009. 15
Unfortunately, participants did not provide information on their finances (e.g., accumulated debts, whether they
filed for bankruptcy, and business loans), so it is not possible to examine their overall financial situation following
program entry. The implication is that in analyzing the self-employment and total earnings of program applicants,
we cannot account for whether their pursuit of self-employment led to accumulated debts or other financial
obligations which would mitigate their well-being as measured by earnings variables. 16
These figures represent averages for all unemployed applicants. The average self-employment earnings for
unemployed applicants who were self-employed at each survey were much higher: $7,853 at Wave 1, $10,166 at
Wave 2, and $13,898 at Wave 3.

Page 19
applicants had lower self-employment earnings at Wave 1 than other applicants, but there were
no statistically significant differences in self-employment earnings at Waves 2 and 3.17
Table 4
also shows that unemployed applicants experienced a substantial growth in salary earnings and
total earnings over time; at Wave 3, the average unemployed applicant had $40,472 salary
earnings and $43,978 total earnings. It is worth noting that the average total earnings for
unemployed applicants at Wave 3 were similar to the average total earnings of U.S. labor force
participants around the time Wave 3 was implemented,18
indicating that over time unemployed
applicants were able to achieve self-sufficiency. Separate analyses also show that unemployed
applicants who were self-employed at each survey had lower total earnings and a higher
coefficient of variation (standard deviation divided by the sample mean) than those who were not
self-employed at each survey. These analyses indicate that, among unemployed applicants, those
who were self-employed following program entry faced higher income risk than their peers.
Similar results were obtained for non-unemployed applicants.19
Finally, as seen in Table 4, there
were no statistically significant differences in salary earnings or in total earnings between
unemployed and other applicants at Wave 1. Interestingly, the unemployed experienced a steeper
growth in earnings over time; as a result, at Waves 2 and 3 they had higher salary earnings and
total earnings than other applicants.
17
Note also, that there were no statistically significant differences in self-employment earnings between
unemployed and other applicants who were self-employed at each survey. 18
The average total earnings per labor force participant in the U.S. from 2008 through 2009 were $44,057 (source:
tabulations of the American Community Survey, 2008 and 2009). 19
The mean (standard deviation) of total earnings for unemployed applicants who were self-employed at each
survey were: $16,654 (24,615) at Wave 1; $26,588 (32,037) at Wave 2; and $37,710 (46,622) at Wave 3. The mean
(and standard deviation) of total earnings for unemployed applicants who were not self-employed at each survey
were: $23,901 (28,578) at Wave 1; $32,780 (35,465) at Wave 2; and $42, 722 (39,683) at Wave 3.
Page 20
3. Impact Analyses
The primary objective of this paper is to estimate Project GATE’s impacts on the post-RA
outcomes of unemployed and other participants. Our focus is to estimate the program’s intent-
to-treat effect on participant outcomes, that is, the effect of being offered Project GATE
services.20
Our impact analyses rely on linear regression models that estimate program impacts
for unemployed and other applicants, controlling for applicant characteristics that may affect
self-employment and other labor market outcomes. For each outcome, we estimated the
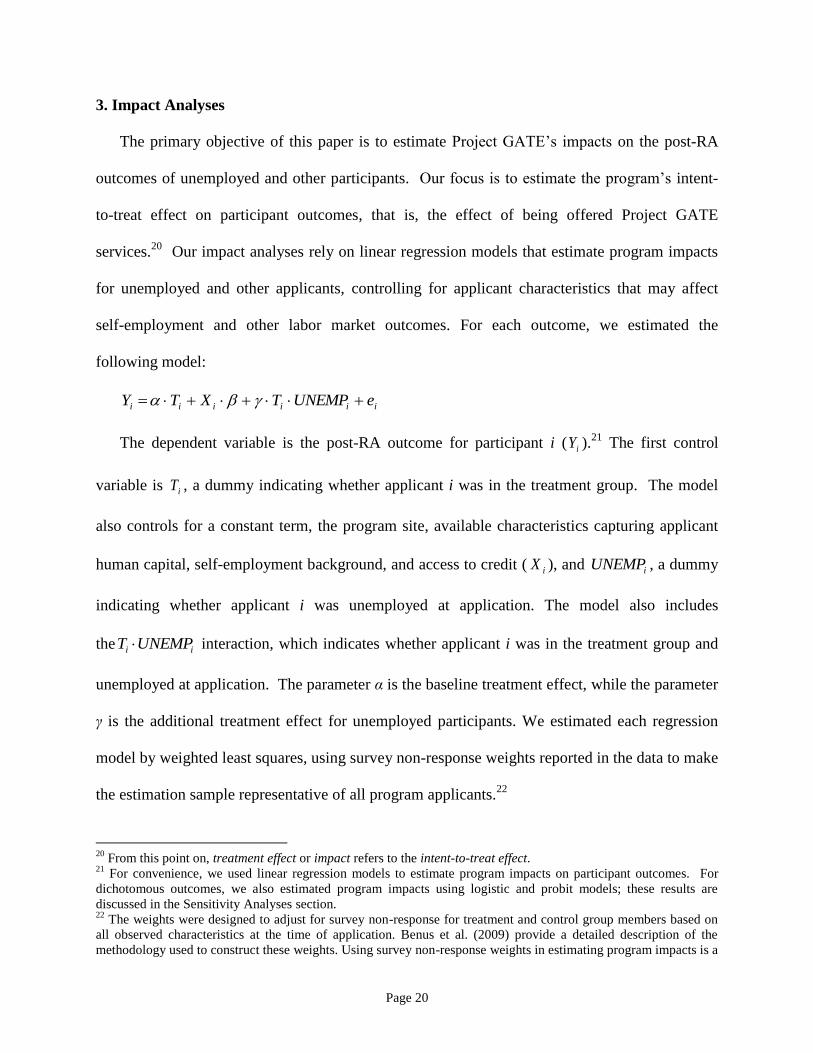
following model:
iiiiii eUNEMPTXTY
The dependent variable is the post-RA outcome for participant i ( iY ).21
The first control
variable is iT , a dummy indicating whether applicant i was in the treatment group. The model
also controls for a constant term, the program site, available characteristics capturing applicant
human capital, self-employment background, and access to credit ( iX ), and iUNEMP , a dummy
indicating whether applicant i was unemployed at application. The model also includes
the ii UNEMPT interaction, which indicates whether applicant i was in the treatment group and
unemployed at application. The parameter α is the baseline treatment effect, while the parameter
γ is the additional treatment effect for unemployed participants. We estimated each regression
model by weighted least squares, using survey non-response weights reported in the data to make
the estimation sample representative of all program applicants.22
20
From this point on, treatment effect or impact refers to the intent-to-treat effect. 21
For convenience, we used linear regression models to estimate program impacts on participant outcomes. For
dichotomous outcomes, we also estimated program impacts using logistic and probit models; these results are
discussed in the Sensitivity Analyses section. 22
The weights were designed to adjust for survey non-response for treatment and control group members based on
all observed characteristics at the time of application. Benus et al. (2009) provide a detailed description of the
methodology used to construct these weights. Using survey non-response weights in estimating program impacts is a

Page 21
3.1. Impact Results
Table 5 reports the two parameters of interest, α and γ, for the following dependent variables:
likelihood of starting a new business, likelihood of self-employment in a business started within
6 months of RA, likelihood of self-employment, likelihood of employment in a salary job, and
likelihood of employment.23
The last column of Table 5 reports the treatment effect for
unemployed participants on each outcome (α + γ) and, where this effect is significant, the
treatment effect expressed as a percentage of the outcome’s control group mean for unemployed
participants.
As Table 5 shows, Project GATE significantly increased the likelihood of starting a new
business following RA for unemployed participants, but had no impact for other participants.
For example, the baseline treatment effect at Wave 1 was .021 but statistically insignificant,
whereas the interaction treatment effect for the unemployed was .080 and significant. The total
treatment effect for the unemployed was 10.1 percentage points and significant at the 1 percent
level. Dividing the total treatment effect by the control group mean likelihood of starting a new
business for unemployed participants (16.9 percent, see Table 3), we find that the program led to
a 60 percent increase in this outcome for unemployed participants. The program’s impact on the
likelihood of starting a new business for unemployed participants declined over time (8.8 and 6.5
percentage points by Wave 2 and Wave 3, respectively), but remained statistically significant.
This decline suggests that the program’s impact on starting a new business occurred within 6
months of RA.
widely used method for making the estimation sample representative of all program applicants (e.g., McConnell et
al., 2006; Trenholm et al., 2007). Note that we did not find any significant differences between impact estimates
based on weighted least squares models and impact estimates based on ordinary least squares models. 23
Complete regression results are available upon request.

Page 22
As a result of the program’s large impact on starting a new business in the early months
following RA, the program was very effective in assisting unemployed participants to become
self-employed in a business started within 6 months of RA. Specifically, unemployed
participants experienced a 9.7 percentage-point (60 percent) increase in the likelihood of being
self-employed at Wave 1 in a business started within 6 months of RA. Moreover, the program
led to a 54 percent and a 53 percent increase in this outcome for unemployed participants at
Wave 2 and Wave 3, respectively. These results show that the program was not only effective in
assisting unemployed participants to become self-employed but also to sustain their new business
even 5 years after program entry. Thus, the program was effective in assisting the unemployed to
remain self-employed for long periods of time, avoid unemployment, and presumably reduce
their dependence on the UI system. In contrast, the program had no significant impact on these
outcomes for non-unemployed participants.
A number of underlying factors may explain the different program impacts for unemployed
and other participants. For example, the program may have helped participants learn more about
the potential rewards of self-employment which, compared to the time investment required and
associated risks, are typically low in the first few years of business ownership. This may have
discouraged many non-unemployed participants – particularly those employed in salary jobs –
from starting their own business and becoming self-employed following program entry. In
contrast, we would expect that this information had a less important deterrent effect on
unemployed participants, who probably had a lower opportunity cost to pursue self-employment
than their peers.24
Further, the program may have helped participants gain a better understanding
24
The view that unemployed workers may have a low opportunity cost to pursue self-employment is hardly a new
concept. Previous research suggests that, due to lack of acceptable employment options, unemployed workers may
view self-employment as the best alternative to return to productive employment (Meager, 1992; Bates and Servon,
2000; Rissman, 2003; Glocker and Steiner, 2007).

Page 23
of the requirements and substantial time commitment needed to start and operate a business.
Even though both unemployed and non-unemployed participants had a strong interest in self-
employment at program entry, we would expect that the unemployed had more available time
than those employed in salary jobs or those who were already self-employed at program entry to
invest in the self-employment process (e.g., produce a business plan, secure financing, and start a
new business) or to participate in additional entrepreneurship services. This may partly explain
why the unemployed were more successful than their peers in starting and sustaining their own
business following program entry.
Due to the program’s impact on new business starts and on self-employment in a business
started within 6 months of RA, unemployed participants experienced significant increases in
self-employment, even 5 years after RA. As shown in Table 5, Project GATE increased self-
employment for the unemployed by 59 percent at Wave 1, by 24 percent at Wave 2, and by 16
percent at Wave 3. Notably, the program’s impact on self-employment declined over time,
reflecting the fact that, following Wave 1, the program had no effect on new business starts,
while the program’s effect on the likelihood of self-employment in a business started within 6
months of RA declined. Again, the baseline treatment effects were not statistically significant,
indicating that there was no impact on self-employment for non-unemployed participants.
There is no evidence the program had an effect on salary employment for unemployed or
other participants, but our results show that Project GATE led to a 9.5 percentage-point (or 11
percent) increase in the likelihood of employment at Wave 1 for unemployed participants. This
impact is directly tied to the program’s impact on the likelihood of self-employment at Wave 1
for unemployed participants. However, partly due to the declining program impact on self-

Page 24
employment, the program did not have a statistically significant impact on total employment for
any participants at Waves 2 and 3.
Table 6 reports the treatment effects for self-employment earnings, salary earnings, and total
earnings.25
Our results show that Project GATE had a positive and statistically significant impact
on the Wave 1 self-employment earnings of unemployed participants. The program effects on
self-employment earnings for unemployed participants at Waves 2 and 3 had positive signs but
lacked statistical significance. The program’s effect on salary earnings for the unemployed had a
negative sign at Wave 1 and a positive sign at Waves 2 and 3, but these estimates were not
statistically significant. Finally, the program’s effect on total earnings for unemployed
participants had positive signs but lacked statistical significance. These results indicate that,
although Project GATE was effective in assisting unemployed participants in returning to
productive employment earlier than they would have in the absence of the program, the program
did not have a statistically significant effect on earnings after the first wave.
These results provide strong evidence that self-employment training is an effective policy
tool for assisting unemployed workers interested in self-employment to start their own business,
remain self-employed, and avoid unemployment for long periods after program entry. At the
time Project GATE’s implementation was completed in 2005, about 10 percent of U.S. workers
were self-employed. In fact, U.S. workers were more likely, on average, to be self-employed
and much more likely to be interested in self-employment relative to workers in other developed
countries, including Germany, France, Japan, and Great Britain (Blanchflower et al., 2001; Grilo
and Thurik, 2005).26
The effectiveness of Project GATE combined with the high interest in self-
25
Complete regression results are available upon request. 26
According to the 2004 Flash Eurobarometer Survey on Entrepreneurship, 67 percent of U.S. workers reported
they preferred self-employment over salary employment. Although interest in self-employment is likely inflated in

Page 25
employment, suggests that self-employment training should be more widely adopted by state
workforce agencies and offered through DOL One-Stop Career Centers. In the past decade,
about 15 million workers a year received services from One-Stop Career Centers, including UI
recipients, WIA training participants, and Employment Service recipients (Wandner, 2008;
Jacobson, 2009). It is unknown how many of these workers would be interested in self-
employment training offered through the workforce development system. However, given the
high interest in self-employment in the U.S. and the fact that many unemployed workers may
view self-employment as an attractive reemployment option, we would expect that self-
employment programs would attract many DOL One-Stop Career Centers customers. For
example, according to DOL’s Unemployment Insurance Data Summary, there were more than
7.9 million new UI recipients in 2005. Even if a modest 2 percent of those recipients were
interested in self-employment training, there would be nearly 160,000 interested participants
from the UI system alone.
3.2. Sensitivity Analyses
Our impact analyses show that the program had positive impacts for unemployed participants
but no impacts for non-unemployed participants. However, it is possible that the program was
effective for one or more of the groups in the “other participants” category. To examine this
possibility, we re-estimated our regression models, allowing for differential treatment effects for
participants who were unemployed, self-employed, and not in the labor force. Our results
confirm that the program had no significant impacts on the labor market outcomes of any of
these groups.
surveys (see Blanchflower et al., 2001 for a discussion), the U.S. proportion was markedly higher than the one in
other developed countries such as Germany (46 percent), France (45 percent), and United Kingdom (46 percent).

Page 26
There is a reasonable concern that program impacts may vary across key participant
characteristics associated with self-employment background (self-employment experience,
business plan), access to credit (bad/no credit history, income <$25,000), and human capital
(education, age, etc.). If such variation exists, the differential program impacts for unemployed
and non-unemployed participants may be due to the omission of interactions between the
treatment and key participant characteristics from the specification. To ensure that our analyses
were not ignoring important treatment interaction effects, we estimated several models that
included interactions between the treatment indicator and variables capturing self-employment
background, access to credit, and human capital. Our results provide no evidence that program
effects varied across these characteristics, providing further support to the conclusion that the
program was effective only for unemployed participants.
Another concern is that the use of linear regression models, instead of logistic or probit
models, to estimate program impacts for dichotomous outcomes may influence the impact
estimates. To eliminate these concerns, we estimated program impacts for dichotomous
outcomes using logistic and probit models. Our results show that the estimated treatment effects
for unemployed and other participants based on logistic and probit regression models are similar
in size and statistical significance to those produced using linear regression models.
Finally, an important concern about the validity of the impact analyses is whether sample
attrition may have caused some of the treatment-control group differences in outcomes for
unemployed participants. To mitigate these concerns, we showed that the characteristics
distribution of respondents to each survey reflected the characteristics distribution of all program
applicants and that there were no differences in characteristics between treatment and control
group respondents at each survey. To produce additional evidence that sample attrition did not

Page 27
taint our estimates, we estimated program impacts at Wave 1 using data only for those who
responded to Wave 2, as well as program impacts at Wave 1 and at Wave 2 using data only for
those who responded to Wave 3. These results did not produce impacts that were statistically
different from those produced using the full sample of respondents, providing confidence that
our impact estimates are not tainted by an underlying relationship between sample attrition and
the outcomes of interest.
4. Conclusion
Project GATE was a demonstration program designed to offer an array of self-employment
training services through the U.S. workforce development system to individuals interested in
self-employment. The program, implemented from 2003 through 2005 in Maine, Minnesota, and
Pennsylvania, included an outreach campaign for recruiting applicants, with designated One-
Stop Career Centers serving as central points of recruitment. At the end of the recruitment
period, 4,198 individuals applied for program participation and were randomly assigned to the
treatment group or to the control group; only those in the treatment group were offered program
services. Depending on their needs, participants were referred to training courses to help them
understand the different aspects of starting and operating a business and an individual business
counseling session. Aside from these services, Project GATE did not offer any type of financial
support to program participants.
Using Project GATE data, we examined the impact of self-employment training on the
outcomes of unemployed and non-unemployed participants. Our analyses show that Project
GATE was effective in assisting unemployed participants start their own business and become
self-employed soon after random assignment. As a result, in the early months following program
entry, unemployed participants experienced significant gains in self-employment and in total

Page 28
employment. The program also led to a substantial increase in the likelihood that unemployed
participants were self-employed in a new business even 5 years after program entry, indicating
that many of the businesses started by the unemployed were sustained for long periods of time.
Despite the program’s effect on the rapid reemployment of the unemployed through self-
employment, we found no evidence that the program led to significant impacts on total earnings.
Nevertheless, the average total earnings of unemployed applicants at 5 years after program entry
were similar to the U.S. average, indicating that they were able to achieve self-sufficiency
following program entry. Further, given the strong preference that program participants
expressed for self-employment, the higher levels of self-employment may well indicate greater
job satisfaction for program participants.
Our impact analyses for participants who were employed, self-employed, or not in the labor
force at the time of application, yielded substantially different results relative to the results for
the unemployed. We find no evidence that the program had significant impacts on new business
starts, self-employment, salary employment, or total employment for non-unemployed
participants. There is also no evidence the program led to a significant impact on total earnings
for these participants. Therefore, our analyses provide no evidence that self-employment
training is an effective intervention for employed, self-employed, or not in the labor force
individuals interested in self-employment.
This is the first paper that examines the efficacy of providing self-employment training
services without any financial support to unemployed and other individuals interested in self-
employment. Our results provide strong evidence that self-employment training is effective in
assisting unemployed individuals obtain a better understanding of the self-employment process
and become reemployed earlier than they would in the absence of such training. Perhaps more

Page 29
importantly, self-employment training is effective in assisting unemployed individuals remain
self-employed, avoid unemployment, and presumably reduce their dependence on the UI system
for an extensive time period following program entry. Based on these results, we conclude that
offering self-employment training services through the U.S. public workforce development
system may be an effective policy tool for promoting the rapid reemployment of unemployed
individuals interested in self-employment. Although state workforce agencies should consider
adopting self-employment training programs targeting the unemployed as part of their workforce
development agenda, there may be no value in providing self-employment training to individuals
who are employed, self-employed, or not in the labor force.

Page 30
References
Acs Z.J. (1999). Are Small Firms Important? Their Role and Impact. Kluwer Academic
Publishers, Boston, MA.
Almeida R. and Galasso E. (2007). Jump-Starting Self-Employment? Evidence Among Welfare
Participants in Argentina. IZA Discussion Paper No. 2902. Institute for the Study of Labor,
Bonn, Germany.
Bates T. (1997). Race, Self-Employment, and Upward Mobility: An Illusive American Dream.
Woodrow Wilson Center Press, Washington DC; Johns Hopkins University Press, Baltimore,
MD.
Bates T. and Servon L. (2000). Viewing Self-Employment as a Response to Lack of Suitable
Opportunities for Wage Work. National Journal of Sociology, Vol. 12, No. 2, pp. 23-55.
Baumgartner H.J. and Caliendo M. (2008). Turning Unemployment into Self-Employment:
Effectiveness of Two Start-Up Programmes. Oxford Bulletin of Economics and Statistics, Vol.
70, No. 3, pp. 347-373.
Bellotti J., McConnell S., and Benus J. (2006). Growing America Through Entrepreneurship:
Interim Report, U.S. Department of Labor, Washington, DC.
Benus J. (1994). Self-Employment Programs: A New Reemployment Tool. Entrepreneurship:
Theory and Practice, Winter 1994.
Benus J.M., Johnson T.B., Wood M., Grover N., and Shen T. (1995). Self-Employment
Programs: A New Reemployment Strategy: Final Report on the UI Self-Employment
Demonstration. Unemployment Insurance Occasional Paper No. 95-4. U.S. Department of
Labor, Washington DC.
Benus J., Shen T., Zhang S., Chan M., and Hansen B. (2009). Growing America Through
Entrepreneurship: Final Evaluation of Project GATE. U.S. Department of Labor, Washington
DC.
Blanchflower D.G. (2009). Minority Self-Employment in the United States and the Impact of
Affirmative Action. Annals of Finance, Vol. 5, No. 3, pp. 361-396.
Blanchflower D.G. and Oswald A.J. (1998). What Makes an Entrepreneur? Evidence on
Inheritance and Capital Constraints. Journal of Labor Economics, Vol. 16, No. 1, pp. 26-60.
Blanchflower D.G., Oswald A., and Stutzer A. (2001). Latent Entrepreneurship Across Nations.
European Economics Review, Vol. 45, No. 4-6, pp. 680-691.

Page 31
Bregger J.E. (1995). Measuring Self-Employment in the United States. Monthly Labor Review,
Vol. 119, No. 1-2, pp. 3-9.
Bucks B.K., Kennickell A.B., and Moore K.B (2006). Recent Changes in U.S. Family Finances:
Evidence from the 2001 and 2004 Survey of Consumer Finances. Federal Reserve Bulletin,
Vol. 92, pp. A1-A38.
Caliendo M. and Künn S. (2010). Start-up Subsidies for the Unemployed: Long-Term Evidence
and Effect Heterogeneity. Journal of Public Economics, Vol. 95, No. 3-4, pp. 311–331.
Carling K. and Gustafson L. (1999). Self-employment Grants vs. Subsidized Employment: Is
There a Difference in the Re-unemployment Risk? Working Paper 1999:6, IFAU – Institute for
Labour Market Policy Evaluation, Uppsala, Sweden.
Cavalluzzo K. and Wolken J. (2005). Small Business Loan Turndowns, Personal Wealth, and
Discrimination. Journal of Business, Vol. 78. No. 6, pp. 2153-2178.
Cueto B. and Mato J. (2006). An Analysis of Self-Employment Subsidies with Duration Models.
Applied Economics, Vol. 38, No. 1, pp. 23-32.
Davis S. J., Haltiwanger J., and Jarmin R. (2008). Turmoil and Growth: Young Businesses,
Economic Churning, and Productivity Gains. Ewing Marion Kauffman Foundation Report,
June 2008.
Dunn T. and Holtz-Eakin D. (2000). Financial Capital, Human Capital, and the Transition to
Self-Employment: Evidence from Intergenerational Links. Journal of Labor Economics, Vol.
18, No. 2, pp. 282-305.
European Commission Report (2008). Entrepreneurship in Higher Education, Especially in
Non-Business Studies. Final Report of the Expert Group, March 2008.
Fairlie R.W. (2004). Self-Employed Business Ownership Rates in the United States: 1979-2003.
Research Summary No. 243. Small Business Administration, Washington, DC.
Fairlie R.W. and Robb A. (2007). Families, Human Capital, and Small Business: Evidence from
the Characteristics of Business Owners Survey. Industrial and Labor Relations Review, Vol.
60. No. 2, pp. 225-245.
Fischer M. and Massey D. (2000). Residential Segregation and Ethnic Enterprise in U.S.
Metropolitan Areas. Social Problems, Vol. 47, No. 3, pp. 408-424.
Fonseca R., Lopez-Garcia P., and Pissarides C.A. (2001). Entrepreneurship, Start-Up Costs, and
Employment. European Economic Review, Vol. 45, No. 4-6, pp. 692-705.

Page 32
Glocker D. and Steiner V. (2007). Self-Employment: A Way to End Unemployment? Empirical
Evidence from German Pseudo-Panel Data. IZA Discussion Paper No. 2561. Institute for the
Study of Labor, Bonn, Germany.
Grilo I. and Roy T. (2005). Latent and Actual Entrepreneurship in Europe and the U.S.: Some
Recent Developments. International Entrepreneurship and Management Journal, Vol. 1, No. 4,
pp. 441-459.
Jacobson L. (2009). Strengthening One-Stop Career Centers: Helping More Unemployed
Workers Find Jobs and Build Skills. The Hamilton Project Policy Brief 2009-01.
Hout M. and Rosen H.S. (2000). Self-Employment, Family Background, and Race. Journal of
Human Resources, Vol. 35, No. 4, pp. 670-692.
Keister L.A. (2000). Wealth in America: Trends in Wealth Inequality. Cambridge University
Press, Cambridge, UK.
Kelly R., Lewis P., Mulvey C. and Dalzell B. (2002). A Study to Better Assess the Outcomes in
the New Enterprise Incentive Scheme. Working Paper, Centre for Labour Market Research,
University of Western Australia.
Kosanovich W.T., Fleck H., Yost B., Armon W. and Siliezar S. (2002). Comprehensive
Assessment of Self-Employment Assistance Programs. Employment and Training
Administration Occasional Paper No. 2002-01. U.S. Department of Labor, Washington DC.
Lerner J. (2002). Boom and Bust in the Venture Capital Industry and the Impact on Innovation.
Economic Review, Issue Q4, 2002, Federal Reserve Bank of Atlanta.
Manser M.E. and Picot G. (1999). The Role of Self-Employment in U.S. and Canadian Job
Growth. Monthly Labor Review, April 1999.
McConnell S., Stuart E., Fortson K., Decker P., Perez-Johnson I., Harris B., and Salzman J.
(2006). Managing Customers’ Training Choices: Findings from the Individual Training
Account Experiment. Mathematica Policy Research, Washington, DC.
McKernan S-M. and Chen H. (2005). Small Business and Microenterprise as an Opportunity-
and Asset-Building Strategy. Opportunity and Ownership Project Brief No. 3, The Urban
Institute, Washington, DC.
Meager N. (1992). Does Unemployment Lead to Self-Employment? Small Business Economics,
Vol. 4, No. 2, pp. 87-103.

Page 33
Meager N. (1996). From Unemployment to Self-Employment: Labour Market Policies for
Business Start-Up. In: Schmid G., O’Reilly J., and Schömann K. (editors), International
Handbook of Labour Market Policy and Evaluation, Edward Elgar, Cheltenham, UK, pp. 489-
519.
Minniti M. and Bygrave W. D. (2004). National Entrepreneurship Assessment, United States of
America. Global Entrepreneurship Monitor 2003 Executive Report.
O’Leary C.J., Kolodziejczyk P., and Lazar G. (1998). The Net Impact of Active Labour
Programmes in Hungary and Poland. International Labour Review, Vol. 137, No. 3, pp. 321-
346.
Oosterbeek H., Praag M., and Ijsselstein A. (2010). The Impact of Entrepreneurship Education
on Entrepreneurship Skills and Motivation. European Economic Review, Vol. 54, No. 3, pp.
442-454.
Perry G. (2006). Are Business Start-Up Subsidies Effective for the Unemployed: Evaluation of
Enterprise Allowance. Working Paper. Auckland University of Technology.
Rissman E.R. (2003). Self-Employment as an Alternative to Unemployment. Working Paper
No. 2003-34. Federal Reserve Bank of Chicago.
Robb A.M. and Fairlie R.W. (2007). Access to Financial Capital among U.S. Businesses: The
Case of African American Firms. Annals of the American Academy of Political and Social
Science, Vol. 613, no. 1, pp. 47-72.
Rodriguez-Planas N. (2010). Channels Through Which Public Employment Services and Small
Business Assistance Programs Work. Oxford Bulletin of Economics and Statistics, Vol. 72,
No. 4, pp. 458-485.
Schreiner M. (1999). Self-employment, Microenterprise, and the Poorest. Social Service Review,
Vol. 73, No. 4, pp. 496-523.
Trenholm C., Devaney B., Fortson K., Quay L., Wheeler J., and Clark M. (2007). Impacts of
Four Title V, Section 510 Abstinence Education Programs. Mathematica Policy Research,
Princeton, NJ.
Vroman, W. (1997). Self-Employment Assistance: Revised Report. The Urban Institute,
Washington DC.
Walker B.A. and Blair A.K. (2002). 2002 Directory of U.S. Microenterprise Programs. The
Aspen Institute, Washington, DC.

Page 34
Wandner S.A. (2008). Employment Programs for Recipients of Unemployment Insurance.
Monthly Labor Review, Vol. 131, No. 10, pp. 17-27.
Wandner S.A. (2010). Solving the Reemployment Puzzle: From Research to Policy. W.E.
Upjohn Institute for Employment Research, Kalamazoo, MI.

Page 35
Table 1: Characteristics of U.S. Labor Force Participants,
Self-Employed Workers, and Project GATE Applicants
U.S. Civilian
Labor Force
in 2003†
Self-Employed
in 2003†
Project GATE
Applicants††
Total 140.1 million 13.8 million 4,198
Men 54% 66% 54%
Women 46% 34% 46%
Race: White 78% 86% 57%
Race: Black 11% 5% 31%
Race: Other 11% 9% 11%
Hispanic 13% 9% 5%
Married 58% 72% 44%
Child Under 18 44% 47% 46%
Age: Less 25 Yrs 13% 3% 4%
Age: 25-34 Yrs 23% 14% 21%
Age: 35-44 Yrs 26% 27% 33%
Age: 45-54 Yrs 23% 29% 31%
Age: 55+ Yrs 15% 27% 11%
Less than High School 12% 11% 4%
High School Diploma 52% 49% 22%
Associate Degree/Some College 8% 7% 37%
College Degree 18% 19% 18%
Post-Graduate Degree 10% 14% 19%
Born in U.S. 85% 84% 90%
Disabled 2% 3% 8%
Income: < $25,000 18% 17% 35%
Income: $25,000-$74,999 49% 43% 51%
Income: $75,000≥ 33% 40% 14%
Unemployed 7% -- 43%
Employed 83% -- 28%
Self-Employed 10% -- 16%
Not in the Labor Force -- -- 13%
Note: Reported are proportions of the U.S. civilian labor force in 2003 (ages 18 years old or older), self-employed
workers (ages 18 years old or older), and Project GATE applicants. Source: †American Community Survey, 2003;
†† Project GATE application data.

Page 36
Table 2: Selected Characteristics of Project GATE Applicants
Unemployed Employed Self-Employed Not in the
Labor Force
Total Applicants 1,817 1,185 657 539
Treatment Group 49% 51% 49% 53%
Male 59% 45% 55% 50%
Race: White 65% 43% 61% 59%
Race: Black 26% 44% 26% 27%
Race: Other 9% 13% 12% 14%
Hispanic 5% 5% 4% 5%
Age: Less 25 Yrs 3% 8% 3% 4%
Age: 25-34 Yrs 19% 26% 17% 22%
Age: 35-44 Yrs 33% 33% 32% 31%
Age: 45-54 Yrs 34% 24% 34% 32%
Age: 55+ Yrs 12% 8% 14% 12%
Less than High School 3% 3% 2% 8%
High School Diploma 24% 21% 16% 27%
Associate Degree/Some College 36% 38% 38% 35%
College Degree 18% 20% 20% 14%
Post-Graduate Degree 19% 17% 24% 16%
Ever Self-Employed 25% 26% 100% 23%
Business Plan 20% 23% 29% 23%
Bad/No Credit History 44% 46% 42% 47%
Family Support 45% 43% 46% 48%
Income: < $25,000 33% 33% 40% 43%
Income: $25,000-$74,999 52% 56% 47% 43%
Income: $75,000 > 15% 11% 13% 14%
Site: Philadelphia 24% 38% 24% 27%
Site: Pittsburgh 16% 14% 11% 12%
Site: Minneapolis/St. Paul 42% 36% 47% 29%
Site: Rural Minnesota 6% 4% 4% 5%
Site: Maine 12% 8% 15% 27%
Note: Reported are proportions of Project GATE applicants.
Page 37
Table 3: Post-Random Assignment Outcomes of Project GATE Applicants
Unemployed Other Difference
Started New Business
By Wave 1 331 (22%) 297 (15%) .069 [.013]***
By Wave 2 468 (36%) 465 (27%) .085 [.017]***
By Wave 3 505 (47%) 565 (41%) .058 [.020]***
Started New Business by Wave 1
Self-Employed at Wave 1 316 (21%) 285 (15%) .065 [.013]***
Self-Employed at Wave 2 232 (18%) 193 (11%) .064 [.013]***
Self-Employed at Wave 3 140 (13%) 116 (8%) .046 [.012]***
Self-Employed
At Wave 1 316 (21%) 858 (44%) -.228 [.016]***
At Wave 2 386 (29%) 794 (46%) -.169 [.018]***
At Wave 3 300 (28%) 594 (43%) -.154 [.019]***
Employed in Salary Job
At Wave 1 714 (48%) 658 (34%) .141 [.017]***
At Wave 2 577 (44%) 518 (30%) .137 [.017]***
At Wave 3 523 (49%) 522 (38%) .106 [.020]***
Employed
At Wave 1 1,030 (69%) 1,516 (78%) -.087 [.015]***
At Wave 2 963 (73%) 1,312 (76%) -.032 [.016]**
At Wave 3 823 (76%) 1,116 (81%) -.048 [.017]***
Note: Reported is the number of respondents with proportion of all respondents in parentheses. The last column
reports the means difference between unemployed and other applicants with standard errors in brackets – statistical
significance: **, *** = 5 percent, 1 percent. Wave 1 respondents = 3,449 (1,495 unemployed, 1,954 other); Wave 2
respondents = 3,038 (1,318 unemployed, 1,720 other); Wave 3 respondents = 2,450 (1,076 unemployed, 1,374
other).

Page 38
Table 4: Post-Random Assignment Earnings of Project GATE Applicants
Unemployed Other Difference
Self-Employment Earnings
At Wave 1 $1,821 (8,781) $2,621 (13,258) -800 [396]**
At Wave 2 $2,483 (10,257) $2,812 (11,176) -329 [395]
At Wave 3 $3,505 (13,733) $3,729 (13,582) -224 [556]
Salary Earnings
At Wave 1 $20,709 (27,729) $21,458 (26,397) 740 [927]
At Wave 2 $27,990 (34,500) $23,409 (29,816) 4,581 [1,169]***
At Wave 3 $40,472 (44,275) $35,321 (39,536) 5,151 [1.697]**
Total Earnings
At Wave 1 $22,530 (28,122) $24,079 (28,544) -1,549 [975]
At Wave 2 $30,473 (34,500) $26,221 (30,689) 4,252 [1,195]**
At Wave 3 $43,978 (44,636) $39,051 (40,147) 4,927 [1,717]**
Note: Reported is the mean with standard deviation in parentheses. The last column reports the means difference
between unemployed and other applicants with standard errors in brackets – statistical significance: **, *** = 5
percent, 1 percent. Wave 1 respondents = 3,449 (1,495 unemployed, 1,954 other); Wave 2 respondents = 3,038
(1,318 unemployed, 1,720 other); Wave 3 respondents = 2,450 (1,076 unemployed, 1,374 other). Source: Project
GATE survey data.

Page 39
Table 5: Regression-Adjusted Treatment Effects, Self-Employment, and Employment
Dependent Variable
Regression Parameters Treatment Effect,
Unemployed Applicants Treatment Treatment
x Unemployed
Started New Business
By Wave 1 .021 (.016) .080 (.026)*** .101 [.021]***
+60%
By Wave 2 .031 (.022) .057 (.034)* .088 [.026]***
+28%
By Wave 3 .010 (.028) .055 (.042) .065 [.031]**
+15%
Started New Business by Wave 1
Self-Employed at Wave 1 .022 (.016) .075 (.026)*** .097 [.020]***
+60%
Self-Employed at Wave 2 .017 (.015) .056 (.025)** .073 [.020]***
+54%
Self-Employed at Wave 3 .018 (.015) .034 (.024) .051 [.019]***
+53%
Self-Employed
At Wave 1 .011 (.019) .084 (.028)*** .095 [.020]***
+59%
At Wave 2 -.004 (.022) .066 (.033)** .062 [.026]**
+24%
At Wave 3 .004 (.026) .037 (.032) .041 [.026]*
+16%
Employed in Salary Job
At Wave 1 -.016 (.020) -.004 (.033) -.020 [.026]
--
At Wave 2 .009 (.022) -.040 (.035) -.031 [.028]
--
At Wave 3 -.029 (.027) -.022 (.042) -.051 [.032]
--
Employed
At Wave 1 -.005 (.018) .080 (.030)*** .075 [.024]***
+11%
At Wave 2 .005 (.021) .024 (.033) .029 [.025]
--
At Wave 3 -.025 (.022) .012 (.036) -.013 [.028]
--
Note: Reported are the regression parameters for Treatment and Treatment x Unemployed with standard errors in
parentheses; see Appendix for complete estimation results. The last column reports the treatment effect for the
unemployed with standard errors in brackets and, where statistically significant, the treatment effect as a percentage
of the control group mean. Statistical significance: *, **, *** = 10 percent, 5 percent, 1 percent.

Page 40
Table 6: Regression-Adjusted Treatment Effects, Earnings
Regression Parameters Treatment Effect,
Unemployed Applicants Treatment Treatment x
Unemployed
Self-Employment Earnings
At Wave 1 -1,364 (607)** 2,302 (747)*** 938 [449]**
+67%
At Wave 2 -738 (526) 1,538 (760)** 800 [540]
--
At Wave 3 337 (679) 876 (1,042) 1,214 [796]
--
Salary Earnings
At Wave 1 38 (1,140) -778 (1,837) -740 [1,438]
--
At Wave 2 -157 (1,365) 222 (2,256) 64 [1,784]
--
At Wave 3 1,493 (2,039) -911 (3,260) 581 [2,507]
--
Total Earnings
At Wave 1 -1,326 (1,238) 1,524 (1,907) 197 [1,451]
--
At Wave 2 -895 (1,401) 1,759 (2,293) 864 [1,803]
--
At Wave 3 1,830 (2,059) -35 (3,257) 1,795 [2,489]
--
Note: Reported are the regression parameters for Treatment and Treatment x Unemployed with standard errors in
parentheses; see Appendix for complete estimation results. The last column reports the treatment effect for the
unemployed with standard errors in brackets and, where statistically significant, the treatment effect as a percentage
of the control group mean. Statistical significance: ** = 5 percent.

Page 41
Appendix
Table A: Characteristics of Project GATE Applicants and Survey Respondents
Project GATE Applicants
All Respondents
to Wave 1
Respondents
to Wave 2
Respondents
to Wave 3
Total Applicants 4,198 3,449 3,038 2,450
Treatment Group 50% 51% 51% 52%
Unemployed 43% 43% 43% 44%
Employed 28% 27% 27% 26%
Self-Employed 16% 17% 17% 18%
Not in the Labor Force 13% 13% 13% 13%
Male 54% 53% 52% 52%
Race: White 57% 60% 61% 65%
Race: Black 31% 30% 29% 26%
Race: Other 11% 10% 10% 9%
Hispanic 5% 5% 5% 5%
Age: Less 25 Yrs 4% 4% 3% 3%
Age: 25-34 Yrs 21% 20% 19% 17%
Age: 35-44 Yrs 33% 32% 32% 31%
Age: 45-54 Yrs 31% 32% 34% 36%
Age: 55+ Yrs 11% 12% 12% 13%
Less than High School 4% 3% 3% 2%
High School Diploma 22% 21% 21% 19%
Associate Degree/Some College 37% 37% 36% 35%
College Degree 18% 19% 20% 22%
Post-Graduate Degree 19% 20% 20% 22%
Ever Self-Employed 37% 38% 39% 39%
Business Plan 23% 22% 22% 21%
Bad/No Credit History 45% 43% 42% 40%
Family Support 45% 45% 46% 46%
Income: < $25,000 35% 34% 33% 31%
Income: $25,000-$74,999 51% 52% 52% 53%
Income: $75,000 > 14% 14% 15% 16%
Note: Reported are proportions of Project GATE applicants.