are sale signs less effective when more products have them?
TRANSCRIPT

0732-2399/01/2002/0121/$05.001526-548X electronic ISSN
MARKETING SCIENCE � 2001 INFORMSVol. 20, No. 2, Spring 2001, pp. 121–142
Are Sale Signs Less Effective When MoreProducts Have Them?
Eric T. Anderson • Duncan I. SimesterGSB, The University of Chicago, 1101 East 58th Street, Chicago, Illinois 60637
Sloan School of Management, MIT, E56-305, 38 Memorial Drive, Cambridge, Massachusetts [email protected] • [email protected]
AbstractWe analyze data from a variety of sources, including his-torical data from a women’s clothing catalog, a field studyin that catalog, survey responses to catalog stimuli, and gro-cery store data for frozen juice, toothpaste, and tuna. Theanalysis yields three conclusions. First, sale signs are lesseffective at increasing demand when more items have them.Second, total category sales are maximized when some butnot all products have sale signs. Third, placing a sale signon a product reduces the perceived likelihood that the prod-uct will be available at a lower price in the future, but theeffect is smaller when more products have sale signs. Byruling out alternative hypotheses, the findings suggest thatmoderation of the sale sign effect is in part due to reducedcredibility when they are used on more products.
The credibility argument is motivated in part by a recentpaper that presented an equilibrium model predicting thatcustomers who lack knowledge of market prices rely onpoint-of-purchase sale signs to help evaluate posted prices(Anderson and Simester 1998). The model predicts that salesigns increase demand but that the increase is smaller whenmore products have them. This moderating effect regulateshow many sale signs stores use and makes customer reli-ance on these cues an equilibrium strategy.
To evaluate whether the number of sale signs moderatestheir effectiveness we compare demand for items with salesigns when varying the number of sale signs on other prod-ucts. For this comparison we use two datasets describingdemand for products in a women’s clothing catalog. The firstdataset describes customer orders for the same set of itemsacross three sequential issues of the catalog. The second da-taset is a field test conducted by mailing different versionsof the catalog to randomly selected customer samples. Re-assuringly, although the datasets do not share the same lim-itations, the findings are consistent and indicate that salesigns are less effective when more products have them.
In addition to the credibility explanation there are at leasttwo alternative explanations for this result. First, using asale sign to make a product more attractive may lead tosubstitution of demand from other sale items within a store,and so demand may vary even if there is no change in the
credibility of the sale signs. To discriminate between thesubstitution and credibility explanations, we evaluatewhether total category demand is maximized when somebut not all products in the category have sale signs. Thecredibility explanation implies that adding another sale signwill eventually decrease total category sales when manyitems already have sale signs. In contrast, if adding a salesign to an item leads solely to substitution from other prod-ucts within (or outside) the category we will not observe adecrease in total category demand. We test the total categorysales prediction using grocery store scan data describing to-tal category demand for frozen juice, toothpaste, and cannedtuna. The findings reveal that in all three categories there isa significant reduction in aggregate demand.
A second alternative explanation is that sale signs focuscustomer attention on products with these cues. Distin-guishing between the attention and credibility explanationsis a difficult task. They both imply that sale signs deliverless information when there are too many sale signs. Thecredibility argument predicts that this occurs because thesigns are noticed but not believed. The attention explanationpredicts that the signs are less likely to be noticed whenattention is diluted by a large number of sale signs. To dis-criminate between the credibility explanation and this atten-tion effect we use survey measures to evaluate a third hy-pothesis. This hypothesis predicts both that placing a salesign on a product reduces the perceived likelihood that theproduct will be available at a lower price in the next period,and that this effect is smaller when more items have them.In an attempt to control for the attention effect we focussubjects’ attention on a set of focal items. Under these con-ditions it is unlikely that subjects overlook sale signs onthese items. More important, the likelihood of overlookingsale signs on the focal items is unlikely to depend on howmany other items also have sale signs. The results confirmboth that the presence of a sale sign reduced subjects’ ex-pectations that an item would be available at a lower pricein the future and that this effect is smaller when more itemshave sale signs.(Sale Signs; Retail Pricing; Promotions; Credibility; Signaling;Fashion Products)

ARE SALE SIGNS LESS EFFECTIVE WHEN MORE PRODUCTS HAVE THEM?
MARKETING SCIENCE/Vol. 20, No. 2, Spring 2001122
1. IntroductionAnderson and Simester (1998) recently presented anequilibrium model predicting that customers wholack knowledge of market prices rely upon point-of-purchase sale signs to help evaluate posted prices.The findings confirm that customer reliance on salesigns can be an equilibrium strategy, and illustratehow firms respond to this. The model predicts thatsale signs increase demand but that the increase issmaller when more products have them. It is thismoderating effect that regulates retailers’ use of salesigns and makes customer reliance on these cues anequilibrium strategy. This paper has two goals. First,we present evidence from several sources confirmingthat sale signs are less effective when more productshave them. We then investigate whether this findingcan be explained, at least in part, by Anderson’s andSimester’s (1998) credibility argument. In doing so,we acknowledge that there may exist other circum-stances in which alternative explanations lead to sim-ilar findings.
The Anderson and Simester (1998) ModelThe finding that placing sale signs on a product canincrease demand for that product is already well es-tablished. In a laboratory experiment, Inman et al.(1990) show that placing a sale sign on an item issufficient to increase demand for the item withoutchanging the actual price. Inman and McAlister(1993) then show that the result survives in a campusgrocery store using promotional cues combined withnegligible discounts. Further evidence can be foundin discrete choice models. After separately controllingfor the regular price and any price discount, there isstrong evidence that customers are more likely topurchase items that are accompanied by sale signs(see, for example, Guadagni and Little 1983 andGrover and Srinivasan 1989). The apparent effective-ness of sale signs is surprising; they are inexpensiveto produce, and stores generally make no commit-ment when using them. As a result, they can beplaced on any products, and as many products, asstores prefer.
Anderson and Simester’s explanation for why salesigns are effective begins by recognizing that many
customers lack information about market prices. Un-certainty about future discounts and prices at com-peting retailers prompt these customers to look foradditional cues to help evaluate whether to make animmediate purchase. Retailers respond by placingsale signs at the point of purchase to identify whichitems are discounted. Customer reliance on thesecues may then explain why sale signs are effective atincreasing demand. Anderson and Simester arguethat customers implicitly regulate the temptation toplace sale signs on every item by ascribing less cred-ibility to sale signs when they see them on more prod-ucts. This moderating effect, which has not previous-ly been tested in the literature, leads to the followingprediction:
HYPOTHESIS 1. Sale signs are less effective at increasingdemand when more products have them.
This prediction is an endogenous outcome of themodel. Customers use Bayes’ rule to update their be-liefs, which influence retailer strategies. These strat-egies are, in turn, consistent with customer beliefs inequilibrium. In particular, customers have prior be-liefs about the number of items that are truly dis-counted. If the number of sale signs exceeds custom-ers’ expectations, they infer that not all of the itemswith sale signs are truly discounted. This loss of cred-ibility makes sale signs less effective at convincingcustomers that they should purchase immediatelyrather than visit another store or wait for a futurediscount.
Alternative ExplanationsWe test Hypothesis 1 by observing whether the de-mand for items with sale signs is smaller when moreitems have them. We caution that there are at leasttwo alternative explanations for this result. First, us-ing a sale sign to make a product more attractive maylead to substitution of demand from other sale itemswithin a store, and so demand for these other saleitems may decrease even if there is no change in thecredibility of the sale signs. In support of this substi-tution explanation, Gupta (1988) presents evidencethat more than 84% of the sales increase due to pro-motion comes from brand switching. To discriminate

ANDERSON AND SIMESTERAre Sale Signs Less Effective?
MARKETING SCIENCE/Vol. 20, No. 2, Spring 2001 123
between the substitution and credibility explanations,we introduce a second prediction:
HYPOTHESIS 2. Total category demand is maximized whensome but not all products in the category have sale signs.
Hypothesis 2 implies that total category demandwill eventually decrease when more items within thecategory have sale signs. The benefit from placing asale sign on an additional item is eventually out-weighed by the loss of credibility among the existingsale signs. The resulting concavity regulates howmany sale signs a store uses. We caution that Hy-pothesis 2 focuses on the role of sale signs, not prices,and so we cannot conclude that total category salesever decrease when adding a sale sign together witha price reduction. Total category sales may continueto expand due to the simultaneous price reduction.For this reason, when testing Hypothesis 2 we ex-plicitly control for price differences.
The prediction assumes that varying the number ofsale signs within a category is sufficient to influencethe credibility of these sale signs, yet the theory issilent about the domain over which customers judgecredibility. If varying the number of sale signs withina category is not sufficient to influence the credibilityof these sale signs, the hypothesis will not hold. Therisk of rejection is further increased by the possibilityof substitution between categories. While total cate-gory demand provides an effective control for sub-stitution within the category, it does not control forsubstitution between categories. If using more salesigns within the category leads to substitution fromoutside the category, we would expect category ex-pansion rather than contraction. Note that any evi-dence supporting the hypothesis occurs despite, andnot because of, these difficulties.
A second alternative explanation is that sale signsfocus customer attention on products with these cues.This effect, which we label an attention effect, couldlead to sale signs losing their effectiveness if attentionis diluted when more items have sale signs (Hypoth-esis 1). It could also lead to a reduction in total cat-egory demand when more items have sale signs if athreshold level of attention is required to prompt pur-chase (Hypothesis 2). We introduce a third prediction
to discriminate between the credibility explanationand this attention effect. This hypothesis summarizescustomer beliefs underlying the credibility argument.
HYPOTHESIS 3. Placing a sale sign on a product reducesthe perceived likelihood that the product will be available ata lower price in the next period, but the effect is smallerwhen more products have them.
Note first that substitution makes no predictions re-garding customers’ expectations or how a sale sign’seffect on expectations will vary according to the num-ber of products with sale signs. With respect to atten-tion, a search of the literature reveals no support fora conclusion that focusing attention on an item willlead to expectations that the product is less likely tobe available at a lower price in the future. However,it is possible that customers are less likely to attendto a sale sign on an item when their attention is di-luted by a large number of sale signs. To address thispossibility, we test Hypothesis 3 under conditionsthat focus subjects’ attention on a set of focal items.Under these conditions, evidence supporting Hypoth-esis 3 is consistent with the credibility argument, butis unlikely to arise due to customers overlooking thesale signs on these focal items.
Empirical TestsThe literature offers little evidence supporting or re-jecting predictions Hypothesis 1, Hypothesis 2, andHypothesis 3. We test these predictions using datafrom several sources, beginning in §2 and 3 with datafrom a women’s clothing catalog. In §2 we presentanalysis of historical sales data, followed in §3 witha field test, conducted by mailing different versionsof a catalog to randomly selected customer samples.These two datasets allow us to evaluate whether theincrease in demand when placing a sale sign on aproduct (if any) is smaller when more products havesale signs (Hypothesis 1). The field data and historicalsales data have different limitations. The cost of un-dertaking studies in the field limits the extent towhich we can manipulate the experimental design.However, by varying the use of sale signs on the sameproduct we overcome the endogeneity limitations in-herent in historical data. In comparison, the analysis

ANDERSON AND SIMESTERAre Sale Signs Less Effective?
MARKETING SCIENCE/Vol. 20, No. 2, Spring 2001124
Table 1 Summary of Predictions, Theories, and Data
Predictions from EachTheory
Credi-bility Attention
Substi-tution Data Used to Test Each Prediction
Hypothesis 1
Hypothesis 2Hypothesis 3
Yes
YesYes
Yes
YesNo
Yes
NoNo
Catalog field studyHistorical catalog dataGrocery store data (3 categories)Survey data
of historical catalog data allows us to generalize thefindings to different product categories and to in-clude explicit controls for the degree of substitutabil-ity between products.
In §4 we use three grocery store datasets to test theprediction that aggregate demand is maximizedwhen some but not all products have sale signs (Hy-pothesis 2). The analysis enables us to evaluatewhether the findings from the catalog data hold inmarkets other than fashion clothing and helps us todiscriminate between the competing explanations forHypothesis 1. Finally, in §5 we use survey measuresto evaluate Hypothesis 3 by determining whether salesigns affect expectations about future availability andprices and whether this effect (if any) is smaller whenmore products have sale signs. In Table 1 we sum-marize the relationship between the three predictionsand the alternative explanations and the data used totest each prediction.
This combination of hypotheses and data affords atest of whether sale signs are less effective when moreproducts have them and a means to discriminate be-tween alternative hypotheses for this result. The find-ings also have broader implications for the estimationof choice models, the selection of retail promotionstrategies, and the testing of signaling models. Wediscuss these and other implications in §6.
Empirical ChallengesSeveral factors make the task of testing these predic-tions challenging. First, as noted, the theory is silentas to the domain over which customers judge credi-bility. In a mail-order catalog, the credibility of salesigns may depend upon the number of sale signs onan individual page, the number on a facing two-page
spread, the number within a single product category,or even the number in the entire catalog. In a grocerystore it may depend on the number of facings or thenumber of items within or across product categories.The relevant domain is an empirical question that weaddress by considering different domains. If the nec-essary conditions under which the predictions holdare not satisfied, the predictions will be rejected evenif they are accurate in other settings.
Second, the theory is also silent as to the specificcues that customers rely on. Inman et al. (1990) intro-duce the term promotion signal to describe any sign,marker, or other indicator of a price promotion, andrecognize that such signals may take on a variety offorms. We retain the term sale sign to maintain con-sistency with the Anderson and Simester terminologybut recognize that their findings may apply to any ofthe promotion signals envisaged by Inman et al.(1990). Indeed, the data include examples of severaldifferent types of promotion signals. For example, inthe women’s clothing catalog, promotional prices areidentified variously by the words ‘‘Sale,’’ ‘‘Pre-SeasonSale,’’ and ‘‘Clearance.’’ We might reasonably expectthe effectiveness of these cues to vary.
Third, the theory offers little guidance as to wheth-er customers are sensitive to the number or percent-age of items with sale signs. In the historical catalogdata we use the percentage rather than the numberbecause the number of items with sale signs is cor-related with the number of items on the page, intro-ducing a potential confound (see later discussion).However, in the grocery store data we report the find-ings for both the number and the percentage. Finally,it is also likely that sale signs perform more than onerole. For example, stores may use sale signs to influ-ence customers’ expectations about the overall priceimage of the store and/or to signal which customersa product is targeted at. The possibility that sale signsare serving an alternative role further increases therisk of false rejection.
2. Historical Catalog DataWe received data describing customer orders for threesequential issues of a mail-order catalog selling wom-
ANDERSON AND SIMESTERAre Sale Signs Less Effective?
MARKETING SCIENCE/Vol. 20, No. 2, Spring 2001 125
en’s clothing. For confidentiality reasons we are not ableto identify the name of the catalog, nor can we describeits target market in detail. The three issues were dis-tributed nationally, approximately 1 month apart, toover 600,000 addresses, including both new and exist-ing customers (although the distribution of the issuesoverlapped, they were not identical). They contained amixture of clearance items, sale items, and nonsaleitems, with the clearance items positioned together ina clearly identified section. Price descriptions for theseclearance items included both the regular and discount-ed price: ‘‘Reg $�� SALE $��.’’ Other sale items weredispersed throughout the catalog and included thesame price descriptions as the clearance items, ‘‘Reg $��
SALE $��.’’ Prices of the nonsale items were simply pre-sented as: ‘‘$��.’’
On the advice of the catalog managers, we omittedany items that had a clearance cue in any issue, assales of these items are likely to have been truncatedby the unavailability of inventory (stock outages forclearance items are common). The main (nonclear-ance) sections of the first two issues were identical,and contained 220 items, 20 of which were sale items.The main section of the third issue contained 243items, including 59 sale items. A total of 162 itemsappeared in the main sections of all three issues.Among these 162 items, 13 had sale signs in all threeissues, 1 had a sale sign only in the first and secondissues, and 28 had sale signs only in the third issue.As we discuss, the analysis controls for issue effects,so that the tendency for more sale signs to appear inthe third issue does not bias the results, even if de-mand is higher in that issue due to seasonal or dis-tribution differences.
Comparing the prices of the 162 items that appearedin all three issues confirmed that sale signs in this cat-alog are informative, revealing which items were lessexpensive in previous issues. Prices of the 41 items withsale signs in the third issue were on average 15% lessexpensive in that issue than in the first two issues. Incontrast, the 125 items without sale signs in the thirdissue were on average slightly more expensive in thatissue (the difference in these price comparisons is sig-nificant, p � 0.01). Further inspection reveals that thesale signs are not always accurate. Although all of the
items that were less expensive in the third issue hadsale signs in that issue, not all of the items with salesigns in the third issue were less expensive than in theprevious two issues. Eight of the 41 items with salesigns in the third issue had the same price as in thetwo earlier issues, and 2 of the items with sale signs inthe third issue were actually more expensive than inthe two previous issues. Anderson and Simester (1998)predict that sale signs offer a noisy signal of whichitems are discounted, with retailers preferring to firstplace sale signs on items that are truly discounted butalso placing sale signs on some items that are not yetdiscounted. Although not definitive, this comparisonsuggests that the placement of sale signs is consistentwith these predictions.
The availability of time series and cross-sectionaldata allows us to control for item and catalog differ-ences. We control for item differences by comparingdemand in the first and second issues with demandin the third issue. We then investigate the variance inrelative demand between issues explained by salesigns. In particular, we propose the following de-mand function for each item in each issue:
� � �X1 2 ijDemand � � � ItemPrice OtherPrices e . (1)ij j i ij ij
The variable Demandij represents the units sold forItem i in Issue j. The price variables ItemPriceij andOtherPricesij denote the price for Item i in Issue j andthe average price of other items on the same page asItem i in Issue j (respectively). For sale items we usedthe price paid by customers rather than the discount-ed price. The vector Xij measures the various market-ing variables (other than price), the parameter �j cap-tures issue-level effects (including distribution) andthe parameter �i captures item-level effects.
To control for the item effects (�i), demand in thefirst and second issue ( j � 1, 2) is divided by demandin the third issue ( j � 3). We then take logs of bothsides to facilitate estimation:
Demand ItemPriceij ijln � �̂ � � lnj 1� � � �Demand ItemPricei3 i3
OtherPricesij� � ln � �(X � X )2 ij i3� �OtherPricesi3
j � 1 or 2. (2)

ANDERSON AND SIMESTERAre Sale Signs Less Effective?
MARKETING SCIENCE/Vol. 20, No. 2, Spring 2001126
In this specification the price coefficients are mea-sures of price elasticity. Using the ratio of demand inIssues 1 and 2 relative to demand in Issue 3 controlsfor item-level differences (�i disappears). Seasonaland distribution differences between the three issuesare retained in the intercepts (note that there are sep-arate intercepts for each issue). We conclude that com-paring variance in relative demand between issuesprovides an effective control for both issue- and item-level differences. We caution that the data do not al-low us to control for possible interactions between theitems and the issues. To do so would require a sep-arate issue term for each item, which would consumetoo many degrees of freedom and confound some ofthe variables of interest.
Equation (2) is estimated using demand for 155items that appeared in the main sections of all threeissues. We omitted 7 items that appeared alone as theonly item on a page because it was not possible tocalculate a value for OtherPricesij for these items (thisomission had little effect on the coefficients of inter-est). Treating demand from Issues 1 and 2 separately(as a ratio of demand in Issue 3), this yielded 310observations. We estimated coefficients and standarderrors using generalized least squares (GLS) to con-trol for the panel nature of the data. To further in-vestigate the influence of serial correlation we alsoestimated separate models using relative demand inthe first issue ( j � 1) and relative demand in the sec-ond issue ( j � 2). This approach discards informationbut under reasonable assumptions ensures that serialcorrelation cannot affect the results. Reassuringly,Hypothesis 1 is supported in these separate analyses,as the results are almost identical to those reportedfor the pooled analysis.
Hypothesis TestingRecall that the objective of this analysis is to test theprediction that sale signs are less effective at increas-ing demand when more products have them (Hy-pothesis 1). We created several variables to identifythis moderating effect (if any), beginning with adummy variable identifying items with sale signs(Saleij). Second, we calculated the percentage of itemson each page that had sale signs (Totalij) and inter-
acted this term with the Salei variable. If placing a salesign on a product increases demand for that product,we should observe a positive association betweenSaleij and demand. If sale signs are less effective whenmore items have them, there should be a negativeassociation between demand and the interaction termSaleij∗Totalij. We interpret the sign of this relationshipas a test of Hypothesis 1. As we will discuss, speci-fying the interaction between Saleij and Total ij in thisway is statistically equivalent to including a main ef-fect for Total ij. However, the (1 � Saleij)∗Total ij speci-fication simplifies our testing of Hypothesis 1.
The alternative explanation that moderation of thesale sign effect is due to pure substitution suggeststhat using a sale sign may lead to substitution of de-mand from other products even if there is no changein the credibility of the sale signs. To explicitly controlfor this possibility, we identified substitute and com-plementary relationships between items. In particu-lar, the variable Substitutesij describes the number ofother items on the same page as Item i in Issue j thatare a substitute for Item i, where we defined a sub-stitute as any item that cannot be worn at the sametime as Item i. For example, two pairs of shoes wouldbe described as substitutes because they cannot beworn together. The variable Complementsij describesthe number of other items on the same page as Itemi in Issue j that is a complement for Item i. Items arepresented in the catalog by photographing them onmodels. We defined two items as complements if theywere pictured in the same outfit worn by a model.We anticipated that demand for an item would belower if there were more substitutes on the same pageand would be higher if there were more comple-ments. We further anticipated that these respectiveeffects would be accentuated if a substitute or com-plement item had a sale sign. Therefore we construct-ed additional variables describing the number ofcomplements and substitutes on the same page thathad sale signs. At the suggestion of a reviewer wealso investigated interacting the substitute and com-plement variables with the prices of other items onthe page (OtherPricesij). These interactions explainedlittle variance in the dependent variable and did notaffect the other coefficients, and so we exclude them

ANDERSON AND SIMESTERAre Sale Signs Less Effective?
MARKETING SCIENCE/Vol. 20, No. 2, Spring 2001 127
from the discussion. The expression �Xij included thefollowing variables and coefficients:
�X � � Sale � � Sale ∗Totalij 1 ij 2 ij ij
� � (1 � Sale )∗Total � � Substitutes3 ij ij 4 ij
� � Substitutes on Sale � � Complements5 ij 6 ij
� � Complements on Sale � . (3)7 ij
Replacing (1 � Saleij)∗Total ij with Total ij yields anequivalent specification, although testing Hypothesis1 under this alternative specification would requireinterpreting both �2 and �3. This can be seen by re-arranging �2Saleij∗Total ij � �3 (1 � Saleij)∗Total ij as (�2
� �3) Saleij∗Totalij � �3 Total ij. We also note that themultiplicative specification in Equation (1) anticipatesan interaction between a price reduction and the pres-ence of a sale sign. In a related study, Narasimhan etal. (1996) compare promotion elasticities across alarge range of product categories. Their findings sug-gest that sale signs are dramatically more effectivewhen accompanied by a price reduction, and thisspecification is consistent with this finding. The var-iables are defined as follows:
Saleij 1 if Item i in Issue j had a sale claimand zero otherwise;
Totalij Percentage of items on the same page asItem i in Issue j that have sale signs;
Substitutesij The number of items on the same pageas Item i in Issue j that were substi-tutes for that item;
Substituteson Saleij
The number of items on the same pageas Item i in Issue j that were substi-tutes for that item and had sale signs;
Complementsij The number of items on the same pageas Item i in Issue j that were comple-ments for that item;
Complementson Saleij
The number of items on the same pageas Item i in Issue j that were comple-ments for that item and had sale signs;
Stochastic error.
Summary statistics are reported in the Appendixwith a pairwise correlation table. We also investigatedwhether to include the claimed ‘‘regular’’ price to ac-count for any reference price effect. However, thismeasure was heavily confounded with the price var-
iable (the absolute correlation exceeded 0.98), and itsinclusion did not influence the coefficients of interest.
Adding a sale sign to an item may affect demandfor other items through both the credibility of theirsale signs and any substitute or complementary re-lationship between the items. We summarize theseeffects as follows:
1. Demand for other items that already have salesigns. Under the hypothesis that sale signs are lesseffective when used on more items, demand for theseitems will decrease, reflected in a negative value for�2. We interpret the sign of �2 as a test of Hypothesis1. The decrease in demand should be larger if theitem receiving the additional sale sign is a substitute,suggesting that �5 will be negative. If the item receiv-ing the additional sale sign is a complement, then thedecrease in demand should be mitigated, reflected ina positive value for �7.
2. Demand for other items that do not have salesigns. The hypothesis that sale signs are less effectivewhen used on more items does not speak to demandfor items that do not have sale signs. We do not ex-pect any change in the demand for these items otherthan through a substitute or complementary relation-ship with the item receiving the sale sign (reflectedin �6 and �8), and so do not anticipate that �3 will besignificantly different from zero.
ResultsWe report the coefficients in Table 2 where we includethree models, varying only in their inclusion of thesubstitute and complement controls. The significantnegative coefficients estimated for Saleij*Total ij offerstrong support for the prediction that sale signs areless effective when used on more products (Hypoth-esis 1). The Saleij coefficients are positive, indicatingthat placing a sale sign on a product increases de-mand for that product, however, the negativeSaleij∗Totalij coefficients indicate that this effect issmaller when more of the products already have salesigns. To illustrate, we used the coefficients for Model1 to calculate the change in demand for an item whenplacing a sale sign on it. If there are five items on thepage, relative demand for the item receiving the salesign increases on average by 17% if no other items

ANDERSON AND SIMESTERAre Sale Signs Less Effective?
MARKETING SCIENCE/Vol. 20, No. 2, Spring 2001128
Table 2 Analysis of Historical Catalog Demand
Variables Model 1 Model 2 Model 3
Saleij 0.274(0.138)
0.178(0.136)
0.236(0.144)
Saleij ∗ Totalij �0.578(0.194)
�0.702(0.199)
�0.783(0.218)
(1 � Saleij ) ∗ Totalij 0.079(0.110)
0.114(0.110)
0.058(0.157)
Log Item Priceij �3.235(0.463)
�3.863(0.472)
�3.759(0.481)
Log Other Pricesij 0.735(0.246)
0.620(0.242)
0.618(0.241)
Issue 1 0.169(0.035)
0.149(0.035)
0.152(0.035)
Issue 2 0.001(0.044)
�0.019(0.043)
�0.016(0.043)
Substitutesij �0.200(0.046)
�0.202(0.047)
Substitutes on Saleij 0.018(0.054)
Complementsij 0.076(0.175)
�0.245(0.335)
Complements on Saleij 0.256(0.222)
Adjusted R2
Sample size0.435
3100.469
3100.471
310
Notes: Table 2 presents GLS estimates of Equation (2). Numbers in pa-rentheses are robust standard errors (White 1980).
have sale signs and by 3% if just one other item hasa sale sign. However, it does not increase at all if thereare already sale signs on more than one of the otheritems on the page. For the sake of this illustration weassumed that the item that receives the additionalsale sign is neither a complement nor a substitute ofthe other items on the page.
The coefficients estimated for (1 � Saleij)∗Total ij areapproximately zero in all three models. The Substi-tutesij coefficients are both significant and have theirpredicted signs, while the other complement and sub-stitute variables are not significant. The ItemPriceij co-efficient is significant and a typical magnitude for es-timates of price elasticity (Tellis 1988). The positivesign of the OtherPricesij coefficient suggests that thisvariable can be interpreted as an additional controlfor substitute relationships between the items. Alter-natively, high prices of other items on the page may
serve as a favorable reference price, increasing de-mand for the focal item (Thaler 1985).
Recall that the concavity prediction does not definethe domain over which concavity will be observed.The number of items with sale signs may be mea-sured by the number on a page, the number on afacing two-page spread, or even the number in theentire catalog. In this analysis we considered thenumber of sale signs on the same page. As an alter-native, we also considered the number of sale signswithin the same two-page spread by re-estimatingthe model using a different version of the Totalij var-iable. We did not consider the number of sale signsin the entire issue, as any issue-level effects are con-founded with other issue differences (such as distri-bution differences). In the spread analysis, Total ij mea-sures the proportion of items that have sale signs onthe same two-page spread as Item i in Issue j. Thecoefficients revealed similar results, although thesample size is slightly lower because we omit itemson pages that shared spreads with clearance pages orthe order form.
We also considered the number rather than the per-centage of sale items on the page. However, the modelexplained less variance in relative demand, at least inpart because the number of items with sale signsmeasure was correlated with the total number ofitems on the page. This introduced collinearity withthe substitutes and complements measures, and re-sulted in a potential confound if more items on apage led to lower demand for each item.
3. Field DataIn the catalogs used to estimate the coefficients in Ta-ble 2, the assignment of sale signs and prices acrossitems is not random. This raises an important limi-tation. Discussions with the catalog managers (andinspection of the data) suggest that sale signs aremore likely to be placed on items that are finishingtheir seasons and for which there is a surplus of in-ventory remaining. We may be misattributing the salesign effect if these factors contribute to the result.Problems of endogeneity and selection bias affectmany studies of this type and are difficult to resolve

ANDERSON AND SIMESTERAre Sale Signs Less Effective?
MARKETING SCIENCE/Vol. 20, No. 2, Spring 2001 129
without sufficient instruments (Chintagunta et al.1998, Besanko et al. 1997, Villas-Boas and Winer1996). The field study reported in this section enablesus to address this limitation by replicating the find-ings in the historical data when simultaneously vary-ing the use of sale signs on the same items to differ-ent randomized experimental groups.
Two experimental versions of a catalog weremailed to two separate samples of 67,000 U.S. house-holds. The samples included both previous customersof the catalog and prospective customers identifiedfrom a purchased list. Assignment to the differentconditions was approximately random, with zipcodes randomly distributed across the conditions andall customers in a specific zip code receiving the sameversion. The catalog was mailed at the start of a sea-son and contained a preview of that season’s items,all of which are exclusive to the catalog (althoughcompeting retailers sell similar items). Recall that thecredibility argument requires that customers do notknow relative price levels. Using the first issue of theseason in a catalog that sells exclusive items is con-sistent with this assumption. The items were eithernew to the catalog or had not appeared for almost ayear (we do not have detailed item histories).
The company generously agreed to vary the use ofsale claims on five items from a single product cate-gory. We cannot identify the product category (wewill call it ‘‘dresses’’), but we can say that annualsales for this product category all occur in a singleseason. The test was conducted on four pages, posi-tioned close to the middle of the catalog, that con-tained a total of eight dresses and a single accessory.In the control condition, there were ‘‘sale signs’’ onjust three of the eight dresses and in the treatmentcondition there were sale signs on all eight dresses.Prices for all eight dresses were held constant across bothexperimental conditions. The price of the accessory wasalso the same in both conditions, and it did not havea sale sign in either condition. For ease of expositionwe label the five dresses that had a sale sign in thetreatment condition but not in the control conditionas ‘‘test dresses’’ and the three dresses that had salesigns in both conditions as ‘‘sale dresses.’’ The allo-cation of the dresses between these two categories
was determined by the catalog and was apparentlyarbitrary.
Sale signs were implemented by modifying theprice descriptions. Prices of items with sale signswere described as follows: ‘‘Pre-Season SALE $��.’’Prices of items without sale signs were presentedwith no elaboration: ‘‘$��.’’ Given the timing of thecatalog at the start of the season, the ‘‘Pre-SeasonSALE’’ cue was an unambiguous claim that the prod-uct was new and had not previously been discounted.The price descriptions were printed in approximately8-point type just below each item description. Be-cause of the variety of items and stimuli in the cata-log, these changes were relatively unobtrusive, mini-mizing the risk of demand artifacts (Shimp et al.1991, Sawyer 1975). In total, the catalog contained ap-proximately 300 items and more than 80 pages. Notethat the three sale dresses had preseason sale claimsin both conditions and included the regular price asa reference. In the treatment condition the test dresseshad a preseason sale claim, but the regular price wasnot provided.
ResultsBecause the assignment of customers to the differentconditions was not completely random, we comparedaggregate demand for items elsewhere in the issuethat did not contain experimental manipulations. Thedifferences were negligible, and controlling for themdid not affect the findings. We disguise demand byindexing it to 100 in the control condition, where de-mand represents the aggregate number of units sold.The results, which are presented in Table 3, replicatethe findings in §2 and provide further evidence thatsale signs are less effective when more products havethem (Hypothesis 1). Demand for the three saledresses was significantly (p � 0.05) higher in the con-trol condition, where they were the only items withsale signs, than in the treatment condition where thetest dresses also had sale signs. As expected, placinga sale sign on the test dresses in the treatment con-dition significantly increased demand for these dress-es compared to the control condition. There was al-most no variance in orders for the accessory.
The findings in Table 3 are consistent with the find-

ANDERSON AND SIMESTERAre Sale Signs Less Effective?
MARKETING SCIENCE/Vol. 20, No. 2, Spring 2001130
Table 3 Results of the Field Test
Item Treatment Control Prediction Treatment Control
Test dressesSale dressesAccessory
Sale signSale signNo sale sign
No sale signSale signNo sale sign
Higher demand in the treatment conditionLower demand in the treatment conditionNo difference between conditions
157*38*90
100100100
Notes: Table 3 describes the number of units purchased in each experimental condition aggregated across the respective items. The numbers in eachrow are indexed to 100 in the control condition (it is not appropriate to compare between rows). For example, the catalog sold 57% more of the five testdresses in the treatment condition than in the control condition.*Demand in the treatment condition was significantly higher (lower) than demand in the control condition (p � 0.05).
ing from the historical data that sale signs are moreeffective when fewer products have them. Recall thata major limitation of that finding was that the assign-ment of sale signs and prices across items in the his-torical data was not random, introducing problems ofendogeneity and selection bias. These concerns do notapply to the field test, and so it is reassuring that thefinding still holds. However, varying the content ofcatalogs is expensive (this study apparently cost over$20,000) and preserving the cooperation of a catalogretailer restricts discretion over the experimental de-sign. As a result, the field study has its own limita-tions. First, we cannot rule out the possibility that theeffects are limited to the test items or the dress cat-egory. Second, it is possible, though unlikely, that theomission of the regular price from the price descrip-tions for the test dresses in the treatment conditioncontributed to the diminished demand for the saledresses in that condition. Finally, perhaps the mostserious limitation is that the results in Table 3 areconsistent with both the credibility theory and a sub-stitution explanation. Placing sale signs on the testdresses may have reduced demand for the sale dress-es purely through substitution. Therefore, our findingthat demand for the sale dresses was lower when thetest dresses had sale signs (treatment condition) isconsistent with, but does not necessarily imply, thatthe sale signs on the sale dresses were less crediblein this condition. The substitution explanation doesnot apply to the historical data analyzed in §2. Inparticular, the historical data analysis described theimpact of varying sale signs on a much larger varietyof products and product categories. Moreover, we ex-plicitly controlled for substitute and complementaryrelationships between the products. We conclude that
it is reassuring that the analyses do not share thesame limitations yet they yield similar results.
It is not possible to calculate aggregate demand forall eight dresses from Table 3 (recall that demand isstandardized within each row). However, we can re-port that there was no significant difference in aggre-gate demand for the eight dresses across the two con-ditions. This raises the issue of total category sales.Recall that the argument predicts that the relation-ship between aggregate demand and the number ofitems with sale signs will be an inverted U (Hypoth-esis 2). Because we only compare two conditions,there is no prediction about whether demand for allitems will be higher when eight dresses have salesigns compared to when just three dresses have salesigns. Testing the prediction regarding total categorydemand (Hypothesis 2) in this field test would haverequired multiple comparisons varying the presenceof sale signs across all of the dresses in the catalog(rather than just the dresses on these four pages). In-stead, the field test focuses on Hypothesis 1, and weintroduce grocery store data in the next section to testthe category sales prediction (Hypothesis 2). As wewill discuss, these data provide a strong external con-trol for substitution and help to evaluate whether thefindings in these first two sections are generalizableto other markets and retail formats.
4. Grocery Store DataIn this section we test whether total category demandis maximized when some but not all of the items inthe category have a sale sign (Hypothesis 2). Thecredibility argument predicts that the benefit from
ANDERSON AND SIMESTERAre Sale Signs Less Effective?
MARKETING SCIENCE/Vol. 20, No. 2, Spring 2001 131
placing a sale sign on an additional product is even-tually outweighed by the loss of credibility amongthe existing sale signs. This implies that adding an-other sale sign will eventually decrease total categorysales when many items already have sale signs. Wetest this prediction using grocery store scan data de-scribing total category demand for frozen juice, tooth-paste, and canned tuna (all canned fish) at Domi-nick’s Finer Foods grocery stores in Chicago.
The analysis allows us to discriminate between thecredibility argument and a pure substitution expla-nation for the evidence in the previous two sectionsthat demand for items with sale signs is smaller whenmore items have sale signs. Total category demandprovides an effective control for substitution withinthe category. If adding a sale sign to an item leadssolely to substitution from other products within thecategory we will not observe a decrease in total cat-egory demand. We caution that this does not controlfor substitution between categories. However, if usingmore sale signs within the category makes theseitems more attractive, we do not expect cross-cate-gory substitution to cause category contraction.
The analysis also helps to evaluate whether the re-sults from the catalog data can be generalized to oth-er markets. Frozen juice, tuna, and toothpaste are fre-quently purchased products that are homogeneousacross stores. These characteristics are likely to resultin customers being more informed about prices forthese products than about prices for fashion clothing.However, a series of behavioral studies investigatingcustomers’ price knowledge of grocery products sug-gests that even in grocery stores many customers arepoorly informed about prices. Most of these studiesreveal that no more than half of customers questionedcan recall the prices of products that they have re-cently purchased (Allen et al. 1976, Conover 1986,Dickson and Sawyer 1990).
There are other differences between our previousanalysis and the analysis in this section that are wor-thy of discussion. First, prices in fashion markets varyover time due to seasonality in demand. However, thesource of price variance is not important to theirmodel, and so their findings should apply equally tomarkets in which prices vary due to supply shocks,
such as manufacturers’ trade discounts. Second, inthe previous analysis we evaluated the number ofitems on a page or a two-page spread, while for thegrocery markets we consider the number of items inthe category. As we discussed, the theory is silent asto the domain over which customers judge credibility,and so this domain remains an empirical question.Third, increases in category sales of frozen juice andtuna reflect a combination of purchase accelerationand category expansion. Category expansion is lesslikely with toothpaste, and so increases in categorydemand for toothpaste are more likely to be due topurchase acceleration (note that none of these prod-ucts is perishable). Because customers may purchasefrom a competing store in the future, both purchaseacceleration and category expansion (while control-ling for price changes) contribute directly to retailerprofits.
The data include weekly observations of total salesin each category for 169 weeks at approximately 80stores (the number of stores varies by category, seeAppendix). A complete description of the data foreach category, including the individual UPCs, is avail-able at http://gsbwww.uchicago.edu/research/mkt/Databases/DFF/W.html. The data include variablesindicating whether an item was sold on promotionthat week, together with the number of units sold,the price of each item, and whether a major holidayfell during that week. The nature of the variables isdescribed in some detail on the University of ChicagoWeb site. Unfortunately, the description of the pro-motion variable is not very complete. However, weinterpret the variable in the same way as Kadiyali etal. (2000). The promotion variable does appear to de-scribe in-store promotion rather than just advertising.
Hypothesis TestingThe objective of this analysis is to test whether cate-gory sales are maximized when some but not allproducts have sale signs. Because this prediction sug-gests a nonlinear relationship between category salesand the number of items with sale signs, we createda series of dummy variables that identify how manyitems in the category have sale signs. For example,the variable Number 0–5ij identifies observations

ANDERSON AND SIMESTERAre Sale Signs Less Effective?
MARKETING SCIENCE/Vol. 20, No. 2, Spring 2001132
(store-weeks) for which between zero and five itemsin the category have sale signs, while Number 6–10ij
identifies observations with between six and ten salesigns in the category. Using dummy variables tospecify the number of items with sale signs elimi-nates the need to fully specify the shape of the re-sponse function in advance. Instead, the model findsthe functional form that best fits the data. Construct-ing dummy variables to represent intervals of five en-sures that there are sufficient observations to reliablyestimate coefficients for each interval. As we wouldexpect, the findings are robust to varying the inter-vals over which the dummy variables are constructed.
Recall that the theory is silent as to the domain overwhich customers judge credibility, and does not de-scribe whether customers are sensitive to the numberor percentage of sale signs in a category (or both). Therelevant domain is an empirical question, which weaddress by considering both domains. We construct-ed a second set of dummy variables to identify theproportion of items with sale signs in increments of5%. For example, the variable Percent 6–10ij identifiesobservations where between 6% and 10% of the itemsin the category had sale signs. For completeness, weseparately report the findings for both the Percent andNumber variables.
Which items had sale signs is also likely to affecttotal category demand. We would expect that placinga sale sign on more popular brands and larger pack-age sizes will lead to more purchase acceleration andhave a bigger impact on aggregate demand than plac-ing a sale sign on a less preferred item. To control forthis variance, we calculated the average market shareof items with sale signs in each week at each store(Share of Sale Itemsij). To lessen the possibility that ag-gregation will mask any price changes that coincidewith the use of sale signs, we incorporate separateprice vectors for each of the major brands. The pricevectors were calculated as the average price for Brandb in each week at each store, weighted by the marketshare of each SKU (Priceijb). An ‘‘other’’ price vectorwas calculated for the minor brands. To avoid intro-ducing confounds with the weekly sales measure, weused the entire data period to calculate the marketshare measures used in the Priceijb and Share of SaleItemsij variables.
Other variables measured the number of items inthe category in each store each week (Number ofItemsij) and weeks in which major holidays fell (Hol-idayi). To calculate total category sales (Salesij) we ag-gregated across different package sizes using the netweight of the package. We summarize these variablesas follows:
Salesij Total category sales for Week i at Store j;Priceijb Average category price for Brand b in
Week i at Store j;Share of Sale
Itemsij
Average market share of items with salesigns in Week i at Store j;
Number ofItemsij
Number of unique brand-sizes in Weeki at Store j;
Holidayi 1 if a major holiday fell in Week i andzero otherwise;
Storej 1 if Store j and zero otherwise.
Summary statistics and a correlation matrix are pro-vided in the appendix. Although not directly observ-able in the category-level data, analysis of the item-level data confirms that there is a significant negativeassociation between prices and sale signs, indicatingthat sale signs are informative about which priceshave been discounted. Aggregating up to the brandlevel, we also replicated the analysis conducted on thehistorical catalog data (§2). This replication yieldedstrong evidence across all three categories that salesigns are less effective at increasing demand whenthey are used on more products (Hypothesis 1).
Adopting the same specification as the demandfunction used in our analysis of historical sales datafrom the women’s clothing catalog, we estimated thefollowing equation:
J B
ln Sales � � Store � � ln Price � �X . (4)� �ij j j b ijb ijj�1 b�1
The store coefficients account for geographical fluc-tuations in demand. To account for the panel natureof the data we estimated the parameters using GLSand used White’s (1980) method to correct the stan-dard errors. The �Xij expression included the follow-ing terms:

ANDERSON AND SIMESTERAre Sale Signs Less Effective?
MARKETING SCIENCE/Vol. 20, No. 2, Spring 2001 133
Table 4a Analysis of Grocery Store Data: Frozen Juice
Coefficient Coefficient
Number 6–10 0.247(0.011)
Percent 6–10 0.177(0.016)
Number 11–15 0.371(0.012)
Percent 11–15 0.292(0.016)
Number 16–20 0.339(0.012)
Percent 16–20 0.394(0.016)
Number over 20 0.279(0.014)
Percent 21–25 0.383(0.016)
Percent 26–30 0.382(0.017)
Percent 31–35 0.299(0.018)
Percent over 35 0.238(0.020)
Other VariablesLog Tropicana Price �0.088
(0.019)�0.079
(0.019)Log Minute Maid Price �0.062
(0.027)�0.123
(0.027)Log Store Brand Price �0.601
(0.033)�0.594
(0.034)Log Dole Price �0.235
(0.030)�0.295
(0.030)Log Welch’s Price �0.069
(0.053)�0.059
(0.053)Log Other Price �0.300
(0.057)�0.267
(0.057)Share of Sale Items 10.853
(0.401)10.622(0.399)
Number of Items �0.015(0.001)
�0.015(0.001)
Holiday �0.005(0.008)
0.018(0.008)
Intercept 7.608(0.160)
7.489(0.161)
R2
Sample size0.59
121990.59
12199
Notes: Table 4a presents GLS estimates of Equation (5) for the frozenjuice data. Store-specific coefficients are omitted. Numbers in parenthesesare robust standard errors (White 1980).
Table 4b Analysis of Grocery Store Data: Toothpaste
Coefficient Coefficient
Number 6–10 0.040(0.004)
Percent 6–10 0.032(0.004)
Number 11–15 0.044(0.004)
Percent 11–15 0.049(0.004)
Number 16–20 0.069(0.006)
Percent 16–20 0.045(0.005)
Number over 20 0.022(0.007)
Percent 21–25 0.079(0.007)
Percent 26–30 0.038(0.012)
Percent 31–35 0.012(0.017)
Percent over 35 0.001(0.022)
Other VariablesLog Crest Price �0.287
(0.037)�0.294
(0.037)Log Colgate Price �0.586
(0.029)�0.596
(0.029)Log Aquafresh Price �0.116
(0.025)�0.116
(0.025)Log Close Up Price �0.105
(0.022)�0.096
(0.022)Log Other Price 0.006
(0.015)0.002
(0.015)Share of Sale Items 4.218
(0.433)4.031
(0.439)Number of Items 0.010
(0.000)0.010
(0.000)Holiday 0.002
(0.004)0.004
(0.004)Intercept 5.663
(0.052)5.644
(0.051)R2
Sample size0.75
124040.78
12404
Notes: Table 4b presents GLS estimates of Equation (5) for the toothpastedata. Store-specific coefficients are omitted. Numbers in parentheses arerobust standard errors (White 1980).
G
�X � � Number � Share of Sale Items�ij g g 1 ijg�1
� Number of Items � Holiday � . (5)2 ij 3 i
We use the subscript g to distinguish between thedummy variables identifying the number of items
with sale signs. The first variable Number 0–5ij isomitted, so that the variables describe changes in cat-egory demand above or below this base level. In thepercentage analysis, the Numberg variables are re-placed with Percentg variables (omitting Percent 0–5ij ).
ResultsThe findings for each category are reported in Tables4a, 4b, and 4c. The coefficients are consistent with the
ANDERSON AND SIMESTERAre Sale Signs Less Effective?
MARKETING SCIENCE/Vol. 20, No. 2, Spring 2001134
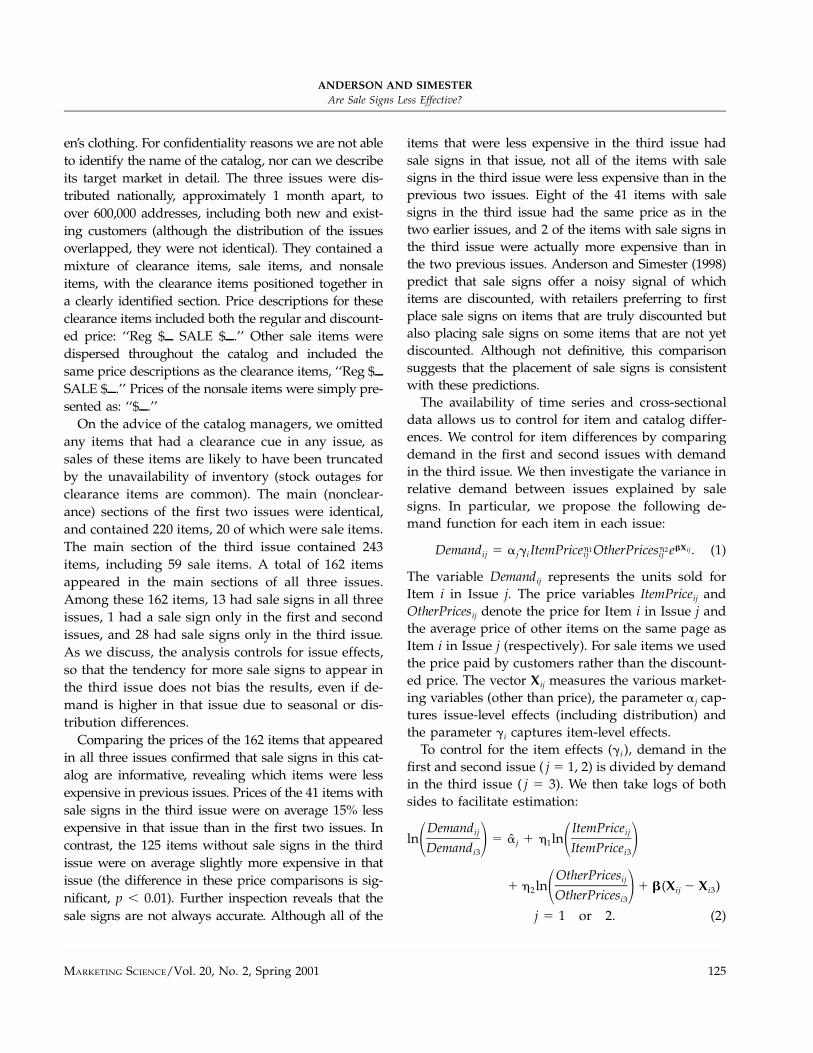
Table 4c Analysis of Grocery Store Data: Tuna
Coefficient Coefficient
Number 6–10 0.112(0.008)
Percent 6–10 0.008(0.017)
Number 11–15 0.128(0.009)
Percent 11–15 0.040(0.016)
Number 16–20 0.156(0.014)
Percent 16–20 0.036(0.016)
Number over 20 0.109(0.023)
Percent 21–25 0.172(0.016)
Percent 26–30 0.154(0.017)
Percent 31–35 0.128(0.018)
Percent over 35 0.134(0.018)
Other VariablesLog Chicken of the Sea
Price�1.397
(0.036)�1.333
(0.036)Log Starkist price �0.688
(0.039)�0.676
(0.039)Log Bumble Bee Price �0.113
(0.039)�0.094
(0.039)Log Other Price �0.194
(0.056)�0.128
(0.056)Share of Sale Items �2.049
(0.270)�1.867
(0.270)Number of Items �0.014
(0.001)�0.013
(0.001)Holiday �0.127
(0.008)�0.125
(0.008)Intercept 5.316
(0.152)5.525
(0.154)R2
Sample size0.47
139140.48
13914
Notes: Table 4c presents GLS estimates of Equation (5) for the cannedtuna data. Store-specific coefficients are omitted. Numbers in parenthesesare robust standard errors (White 1980).
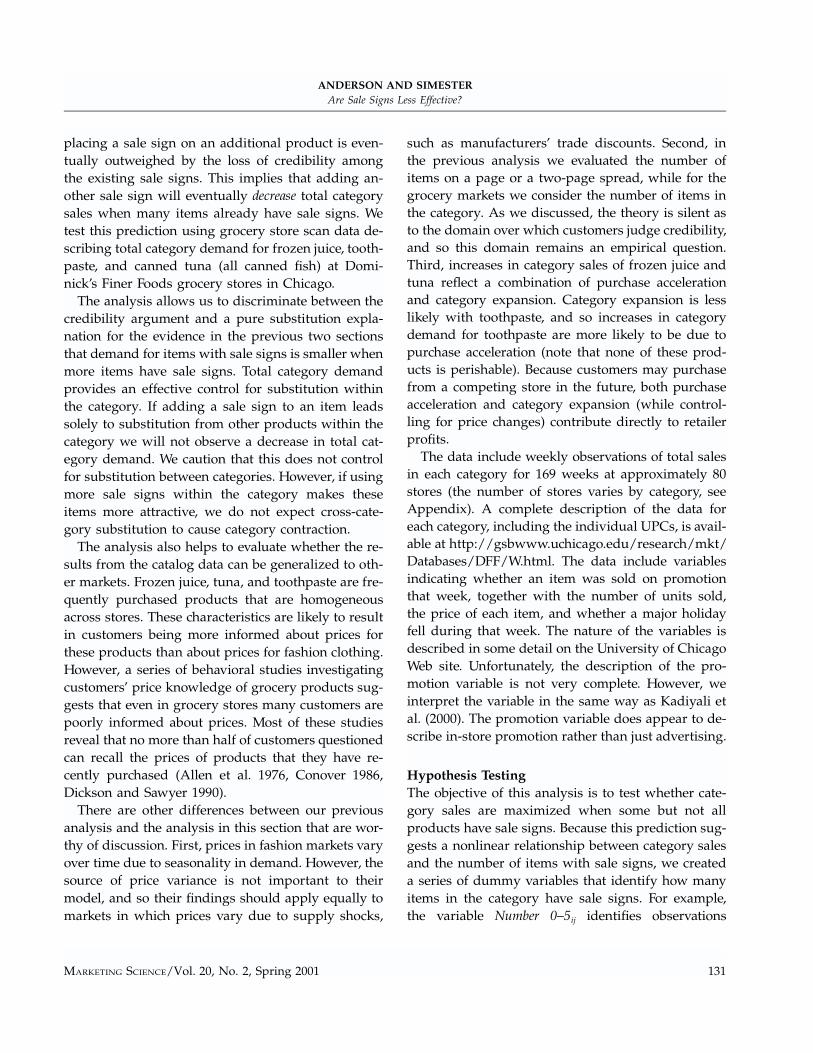
Figure 1 Total Category Demand and the Number of Items with SaleSigns
prediction that category sales are highest when some,but not all, products have sale signs (Hypothesis 2).Category demand in each category peaked when ap-proximately 25% of the items in the category had salesigns. Notably, in all three categories there is a sig-nificant reduction in aggregate demand from the re-spective peaks when more than 30% of items had salesigns. We depict the relationship between total cate-gory sales and the number of items with sale signsin Figure 1. For ease of comparison, we index the
curves to one when fewer than six items have salesigns. The curves are calculated using the coefficientsreported in Tables 4a, 4b, and 4c, together with theaverages of the Log Priceijb, Number of Itemsij, Share ofSale Itemsij, and Holidayi variables (see the appendix).
The curves suggest that sale signs have a largerimpact on the aggregate demand for frozen juice andtuna than on the demand for toothpaste. This is con-sistent with our earlier observation that category ex-pansion is less likely with toothpaste. We also notethat, on average, stores used fewer sale signs than thelevel at which category demand peaks. One expla-nation for this discrepancy is that the number of salesigns used in these categories affects the credibilityof other sale signs in the store. This will tend to resultin stores using fewer sale signs in a category thanrequired to maximize demand within that category.Consistent with this interpretation, Anderson and Si-mester (1998) describe a department store that has apolicy limiting the number of sale signs in any one

ANDERSON AND SIMESTERAre Sale Signs Less Effective?
MARKETING SCIENCE/Vol. 20, No. 2, Spring 2001 135
department. One would normally expect that individ-ual department managers would be best positionedto choose how many sale signs to use in their de-partment. A corporate policy limiting the discretionof department managers suggests that there are ex-ternalities that individual department managers over-look. Department managers may optimize the use ofsale signs for their own departments, but fail to in-ternalize the impact of additional sale signs on thecredibility of sale signs in other departments. Thisleads to an outcome that is similar to the grocerystore findings, with the store placing sale signs onfewer products within each department than is re-quired to maximize demand for that department.
We caution that the findings in Figure 1 focus onthe role of sale signs, not prices. The model controlsseparately for price changes using a series of brandprice vectors, and the coefficients estimated for theseprice vectors are negative. We cannot conclude thatadding sales signs, accompanied by price reductions,will decrease category sales. Total category sales maycontinue to expand due to the simultaneous reduc-tion in price, which always increases sales, and theaddition of a sale sign, which may or may not in-crease sales.
In other findings of interest, the Holidayij variable isnegative (where significant), indicating that demandis lower during holiday periods for frozen juice andtuna, although the demand for toothpaste is appar-ently unaffected. We also considered a variable iden-tifying weeks prior to a major holiday; however, thevariable explained little variance and did not affectthe other coefficients of interest. The Number of Itemsij
and Share of Sale Itemsij are significant in all threemodels, although their magnitudes and signs vary,indicating that these effects are specific to each cate-gory. Reassuringly, the finding that category sales arehighest when some but not all products have salesigns is just as strong if these variables are omitted.
The reduction in category sales when sale signs aremore prevalent cannot be explained by substitutionwithin the category, but is consistent with the predic-tion that sale signs are less credible when used onmore products. The results indicate that the benefitfrom placing a sale sign on an additional product is
eventually outweighed by the loss of credibilityamong the existing sale signs. Like the analysis of thehistorical data from the catalog, the major limitationof this analysis is the endogeneity in the number ofitems that have sale signs. If the events that promptvariance in the number of items with sale signs alsolead to variance in actual demand, we may be incor-rectly attributing the change in demand. Although itis not possible to rule out this limitation, it is difficultto identify events that would explain both an initialincrease and a subsequent decrease in category de-mand as the number of sale signs increases.
5. Customer BeliefsIn this section we use survey measures to evaluateHypothesis 3, which predicts both that placing a salesign on a product reduces the perceived likelihoodthat the product will be available at a lower price inthe next period, and that this effect is smaller whenmore items have signs. The analysis helps us to dis-criminate between the credibility explanation and anattention effect. Distinguishing between the two ex-planations is a difficult task. They both imply thatsale signs deliver less information when there are toomany signs. The credibility argument predicts thatthis occurs because the signs are noticed but not be-lieved. The attention explanation predicts that thesigns are less likely to be noticed when attention isdiluted by a large number of sale signs. We attemptto control for the attention effect by focusing subjects’attention on a set of focal items. Under these condi-tions, it is unlikely that subjects overlook sale signson these items. More important, the likelihood ofoverlooking sale signs on the focal items is unlikelyto depend on how many other items also have salesigns.
Respondents were presented with a two-pagequestionnaire, with a copy of either a treatment orcontrol version of a survey stimulus designed to por-tray pages from an actual catalog. The surveys werecompleted by a convenience sample of 79 undergrad-uate student respondents recruited from the campusof a large university. Potential respondents were ap-proached by a research assistant in the university li-

ANDERSON AND SIMESTERAre Sale Signs Less Effective?
MARKETING SCIENCE/Vol. 20, No. 2, Spring 2001136
brary and asked whether they would be willing tocomplete a short survey. The research assistant, whowas not informed about the goal of the study, re-ported that nearly all of the potential respondentswho were approached agreed to participate. The re-spondents were paid $2 for their participation.
The survey stimulus contained four pages withfour clothing products on each page, all selected fromthe pages of a clothing catalog whose target marketincludes students (the respondent population). Colorimages of the products were taken directly from thecompany’s Web site. The 16 products were chosenfrom different pages of the catalog and from differentproduct categories to minimize the likelihood thatthey were either substitutes or complements. The fourpages were then printed in color and arranged in asix-page booklet, with the first and last pages leftblank. The prices for all 16 items were the same inboth versions of the catalog. The only difference be-tween the versions was the number of sale signs oneach page. In particular, the price descriptions in thetreatment version for 3 of the 4 items on each pageindicated that the prices were discounted, as follows:‘‘SALE $X.’’ Prices of the other item were presentedsimply as: ‘‘$X.’’ In the control version, the sale cueappeared on just 1 item on each page (these itemshad sale cues in both versions). Given this design, wecan categorize the 16 items into three groups: 8 itemsthat had sale cues only in the treatment version (testgroup), 4 items that had sale cues in both versions(sale group), and 4 items that did not have sale cuesin either version (nonsale group).
Instructions at the start of the questionnaire ad-vised the respondents that the stimulus was a replicaof a current catalog and asked them to briefly browsethrough the catalog. For three items the subjects werethen asked both the likelihood that an item would beavailable in the future and the expected future priceof the item if it was available. Asking questions abouta small number of items ensured that these items re-ceived attention and made it unlikely that subjectswould overlook whether they had sale signs. The pos-sibility that subjects did not notice sale signs on otheritems reduces the difference between the conditions,making it less likely that we will observe significant
differences in responses between conditions (makingthe test more conservative). The actual wording of theavailability question was as follows: ‘‘If the next issueof this catalog is mailed out two months later, howlikely is the �item� to be available in the next issue.’’
Responses were collected on an 11-point semanticdifferential scale anchored at 0 by Definitely not avail-able and at 10 by Definitely available. The future pricequestion instructed respondents to assume that theitem was available in the next issue and asked them:‘‘What is your best guess of the price in the next issueof the catalog?’’
Respondents were asked to specify an actual price.No time limit was placed on the subjects, and theywere able to freely examine the catalog while com-pleting the survey. Extensive pretesting confirmedthat the questions were unambiguous and subjects re-ported no difficulty in responding to them. The threeitems were all located on different pages of the stim-ulus and were randomly selected, with one item fromeach of the three groups. For ease of exposition welabel them test item, sale item, and nonsale item, cor-responding to the group from which they weredrawn.
The theory is not explicit regarding the time frameof customers’ expectations. In Anderson and Simes-ter’s model (1998), products have two period seasons,and customers are initially unsure whether a productis in the first or second period of its season. In thisstudy we operationalize the time between periods asthe time between issues of a catalog. As we discussedin the Introduction, these difficulties operationalizingthe model’s parameters raise the risk that the predic-tions will be rejected even if they hold in other set-tings.
Hypothesis TestingRecall that the objective of this analysis is to test theprediction that placing a sale sign on a product re-duces the perceived likelihood that the product willbe available at a lower price in the future, and thatthis effect is smaller when more items have signs. Themeasurement of each effect mimics the design usedin the field study (§3). First, to evaluate whether plac-ing a sale sign on a product reduces the perceived

ANDERSON AND SIMESTERAre Sale Signs Less Effective?
MARKETING SCIENCE/Vol. 20, No. 2, Spring 2001 137
Table 5 Difference Between Treatment and Control
Item Treatment Control PredictionLikely to BeAvailablea Future Priceb
Test item Sale sign No sale sign Less likely to be available and higher futureprice (if available) in treatment condition
�0.97* 13%**
Sale item Sale sign Sale sign More likely to be available and lower futureprice (if available) in treatment condition
2.34** �6%*
Nonsale item No sale sign No sale sign No difference between conditions �0.46 1%aThe treament group average minus the control group average. A positive (negative) value indicates a higher (lower) likelihood of future availability in thetreament condition than in the control condition.bThe treament group average minus the control group as a percentage of the control group average. A positive (negative) value indicates a higher (lower)future price in the treament condition than in the control condition.**Average significantly larger (smaller) in the treatment group than in the control (p � .01).*Average significantly larger (smaller) in the treatment group than in the control (p � .05).
likelihood that the product will be available at a lowerprice in the future, we compare the response in eachcondition for the test item. This item has a sale signin the treatment condition but no sale sign in the con-trol, and serves an analogous role to the test dressesin the field test.
Second, to evaluate whether the number of itemswith sale signs moderates the effect, we compare theresponse in each condition for the sale item, whichhas a sale sign in both conditions. This item servesan analogous role to the sale dresses in the field test.Recall that in the field test we compared whether thedemand for items with sale signs is smaller whenmore items have them. In this study we comparewhether subjects believe that it is more likely that anitem with a sale sign will be available at a lower pricein the future when more items have sale signs. Inparticular, there are 12 items with sale signs in thetreatment condition compared with 4 items in thecontrol condition. If sale signs are less effective in thetreatment condition, subjects in that condition shouldbelieve that the sale item is more likely to be availablein the future and, if available, more likely to have alower price than should subjects in the control con-dition. Formally, let expectations about the futureavailability of this item be E � , where E are sub-jects’ expectations without sale signs and representsthe sale sign effect. The prediction is that E � T �E � C, which allows us to evaluate whether T � C, where the subscripts T and C denote treatmentand control, respectively.
Finally, as with the accessory in the field test, thetheory does not predict any difference between con-ditions in the response to items that do not have salesigns in either condition. Therefore, for the nonsaleitem, which does not have a sale sign in either con-dition, we expect to observe the same average re-sponse to the availability and future price in eachcondition.
ResultsA total of 39 respondents saw the control version ofthe catalog (sale signs on 4 items) and 40 respondentssaw the treatment version (sale signs on 12 items).The results, which are summarized in Table 5, offersupport for Hypothesis 3. The presence of a sale signreduced expectations that a product would be avail-able at a lower price in the future. Respondents in thetreatment condition all saw a sale sign on the testitem and indicated on average that it was both lesslikely to be available in the future and, if available,expected it to have a higher price compared to re-spondents in the control condition. Also consistentwith Hypothesis 3, the effectiveness of sale signs ap-pears to diminish when more products have salesigns. All respondents saw sale signs on the sale item,but those in the treatment condition saw sale signson 75% of the items, compared with respondents inthe control condition who saw sale signs on only 25%of the items. The findings for the sale item indicatethat, on average, subjects believe it is more likely that

ANDERSON AND SIMESTERAre Sale Signs Less Effective?
MARKETING SCIENCE/Vol. 20, No. 2, Spring 2001138
an item with a sale sign will be available at a lowerprice in the future if more items have sale signs.
We did not observe any significant differences be-tween conditions in the average response to eitherquestion for the nonsale item. This null result is re-assuring, and suggests that the respondents in thetwo groups were equivalent and that their price andavailability expectations for this item were not affect-ed by the experimental manipulations.
We caution that we did not collect process mea-sures to evaluate how many customers were aware ofthe presence or absence of sale signs on the three fo-cal items. For this reason, we are not able to conclu-sively rule out the possibility that the support for Hy-pothesis 3 is due to more customers noticing the salesigns on the sale item in the control condition (wherefewer items had sale signs). Although we believe thatthis is unlikely, further research directed at this issuewould complement these results.
6. Other ImplicationsThe findings have broader implications for the esti-mation of choice models, the selection of retail pro-motion strategies, and the testing of signaling mod-els. In this section we discuss these and otherimplications.
We earlier acknowledged that the discrete choiceliterature offers persuasive evidence that placing asale sign or other promotional cue on an item canincrease demand for that item (Guadagni and Little1983, Grover and Srinivasan 1989). The findings sug-gest that the specification of discrete choice modelscan be improved by recognizing that the effectivenessof sale signs is moderated by the number of itemsthat have them. To illustrate the importance of thisinteraction we estimated sales at the brand level usingthe tuna, toothpaste, and frozen juice data describedin §4. Consistent with our previous results, we foundstrong support for Hypothesis 1. In each category thetotal number of sale signs in the category significant-ly moderates the marginal value of adding a sale signto an item.
The data in this paper focus on sale signs placedon individual items, yet stores also engage in store-
wide sales events, such as grand opening, Anniver-sary, and one-day sales. Salop (1977) and others in-vestigate the use of periodic sales by monopolists.This work suggests that storewide events such as one-day sales enable retailers to price-discriminate be-tween customers who are time sensitive and othercustomers who are time insensitive. The findings inthis paper complement their work by predicting thatthese events will be more effective when they occurless frequently. Customers may question the credibil-ity of frequent storewide events (e.g., anniversarysales that occur more than once a year).
The findings also relate to Thaler’s (1985) model ofconsumer choice. Thaler introduces the notion oftransaction utility, reflecting the utility derived fromparticipating in a favorable transaction. More formal-ly, he defines transaction utility as a function of thedifference between the price paid and some referenceprice. The lower the price paid relative to the refer-ence price, the larger the transaction utility. The find-ings reported here may be interpreted as evidencethat sale signs provide a credible signal that raisescustomers’ references prices, which in turn raisestheir transaction utility. We note that Thaler’s modeldoes not predict which cues affect a customer’s ref-erence price or explain why such cues are credible.The two explanations are better thought of as com-plementary rather than competing.
While the present paper focuses on sale signs, ourempirical results may apply more broadly to othertypes of marketing-mix elements, such as price end-ings, promotional displays, and weekly store featureadvertisements. When marketers learn that these cuesare effective, there is a natural temptation to increaseusage, yet the effectiveness of the cues may be mod-erated by use. This suggests a similar trade-off to thatdocumented for sale signs: Increased usage of themarketing-mix elements will benefit those items thatreceive additional marketing support, but may de-crease demand for those items already receiving mar-keting support. For example, Berman and Evans(1992) and Mason and Mayer (1990) suggest that thedemand premium associated with 9-digit price end-ings, such as $9 or 99¢, may result from customersinterpreting these price endings as an indication that

ANDERSON AND SIMESTERAre Sale Signs Less Effective?
MARKETING SCIENCE/Vol. 20, No. 2, Spring 2001 139
a price is low relative to other market prices (see Stiv-ing and Winer 1997 for a review of the price endingsliterature). Under this interpretation, 9-digit priceendings serve an analogous role to sale signs. Thefindings in this paper suggest that the effectivenessof 9-digit price endings will diminish when they areused on more items.
Behavioral studies have investigated customers’price knowledge of grocery products. As we dis-cussed, most of these studies reveal that no more thanhalf of the customers questioned can recall the pricesof recently purchased items (Allen et al. 1976, Con-over 1986, Dickson and Sawyer 1990). The findings inthis paper may help to explain these findings. If salesigns are informative, customers need not remembermarket price levels to evaluate whether to visit a com-peting store or delay in the hope of a future discount.Instead, customers can rely on sale signs to helpguide their decisions. We conclude that customerswho are poorly informed about market prices mayrepresent an implication of the Anderson and Simes-ter (1998) model, rather than an assumption.
7. ConclusionsWe have presented data from several sources, includ-ing historical data from a women’s clothing catalog,a field study in that catalog, grocery store sales datafor frozen juice, toothpaste, and tuna; and survey re-sponses to catalog stimuli. Analysis of these datayields three conclusions. First, sale signs are less ef-fective at increasing demand when more items havethem. Second, total category sales are maximizedwhen some but not all products have sale signs.Third, placing a sale sign on a product reduces theperceived likelihood that the product will be availableat a lower price in the future, but the effect is smallerwhen more products have sale signs. By focusing onsettings that allows us to rule out alternative expla-nations, the findings suggest that the moderation of
the sale sign effect is in part due to reduced credi-bility when they are used on more products. We cau-tion that there may exist other circumstances in whichthese alternative explanations lead to similar find-ings. The consistency of these findings is particularlyreassuring given that limitations in the data do notextend across all of the data sources.
The results also offer empirical insights that havemore general application than testing the credibilitytheory. Promotional cues are important marketing-mix variables; adding a sale sign can have a demandeffect exceeding 50% without changing the price. Theevidence in this paper helps explain why they are soeffective, and cautions against overuse.
AcknowledgmentsThe paper has benefited from comments by Dan Ar-iely, Pradeep Chintagunta, John Hauser, Nanda Ku-mar, Nader Tavassoli, Birger Wernerfelt, reviewersand editors of this journal, together with seminar par-ticipants at Chicago, Duke, MIT, Notre Dame, Roch-ester, Wharton, and the University of New SouthWales. We also wish to acknowledge generous con-tributions of the mail order catalog company that pro-vided data for this study and the Marketing Groupat the GSB, University of Chicago, for the grocerystore data.
Appendix
Historical Catalog Data Summary Statistics
1st and 2nd Issues
MeanStandarddeviation
3rd Issue
MeanStandarddeviation
Item price 63.97 30.31 62.09 30.47Items with sale signs (%) 9.27 25.6Number of items of each page 4.79 2.87 4.88 2.47SubstitutesSubstitutes with sale signsComplementsComplements with sale signs
1.480.080.200.03
1.420.280.480.17
1.610.450.220.06
1.400.580.490.27
Sample size 155 155

ANDERSON AND SIMESTERAre Sale Signs Less Effective?
MARKETING SCIENCE/Vol. 20, No. 2, Spring 2001140
Pairwise Pearson Correlation Coefficient of Historical Catalog Data Variables (N � 162)
Log Quantity Log Price Sale Sale * Total(1 � Sale)
* Total SubstitutesSubstitutes
on Sale Complements
Log PriceSaleSale ∗ Total(1 � Sale) ∗ TotalSubstitutesSubstitutes on SaleComplementsComplements on Sale
�0.578**0.518**0.344**
�0.139�0.176*�0.096
0.0220.021
�0.844**�0.658**
0.248**�0.081
0.072�0.094�0.077
0.818**�0.300**�0.067�0.120
0.177*0.090
�0.329**�0.112�0.056
0.288**0.258**
0.199*0.686**0.1160.164*
0.290**�0.120�0.093
0.0730.113 0.870**
*p � 0.05. **p � 0.01.
Grocery Store Data Summary Statistics
Frozen Juice
MeanStandardDeviation
Toothpaste
MeanStandardDeviation
Tuna
MeanStandardDeviation
Log salesShare of sale itemsNumber of itemsNumber of items with sale signsHoliday
9.991.59
69.0913.21
0.17
0.460.8023.696.430.38
7.840.59
90.139.130.17
0.350.39
17.496.960.38
8.962.25
44.939.410.17
0.501.194.615.090.38
Number of storesSamples size
7812,199
7712,404
8613,911
Note: Missing observations reflect the absence of stores from the sample.
Pairwise Pearson Correlation Coefficients of Frozen Juice Variables
Log SalesShare of
Sale ItemsNumber of
ItemsNumber of Itemswith sale signs
Percentage of Itemswith sale signs Holiday
Share of sale itemsNumber of itemsNumber of items with sale signsPercent of items with sale signsHolidayLog Tropicana PriceLog Minute Maid PriceLog Store Brand PriceLog Dole PriceLog Welch’s PriceLog Other Price
0.44*0.217*0.058*0.032*0.008
�0.020*0.006
�0.068*�0.030*
0.041*0.075*
0.022*�0.352*�0.354*�0.018�0.151*
0.017�0.098*
0.111*0.150*0.058*
0.017�0.095*�0.026*�0.128*�0.179*�0.211*�0.019
0.043*0.213*
0.992*0.229*0.006
�0.200*0.066*
�0.258*�0.198*�0.031*
0.229*0.021
�0.182*0.091*
�0.256*�0.205*�0.055*
�0.092*�0.071*�0.028*
0.009�0.039*�0.034*
*p � 0.01.

ANDERSON AND SIMESTERAre Sale Signs Less Effective?
MARKETING SCIENCE/Vol. 20, No. 2, Spring 2001 141
Pairwise Pearson Correlation Coefficients of Toothpaste Variables
Log SalesShare of
Sale itemsNumber of
ItemsNumber of Itemswith sale signs
Percentage of Itemswith sale signs Holiday
Share of sale itemsNumber of itemsNumber of items with sale signsPercent of items with sale signsHolidayLog Crest PriceLog Colgate PriceLog Aquafresh PriceLog Close Up PriceLog Other Price
�0.051*0.564*0.187*0.052*
�0.018*�0.119*�0.022*�0.108*�0.122*
0.064*
�0.178*0.151*0.204*0.040*0.007
�0.075*0.135*0.091*
�0.191*
0.211*�0.041*�0.021
0.134*0.277*0.122*
�0.024*0.066*
0.950*�0.075*�0.031*�0.052*
0.029�0.016�0.129*
�0.076*�0.074*�0.134*�0.011�0.022�0.160*
�0.0010.025*0.011*0.017*
�0.046*
*p � 0.01.
Pairwise Pearson Correlation Coefficients of Tuna Variables
Log SalesShare of
Sale ItemsNumber of
ItemsNumber of Itemswith Sale Signs
Percentage of Itemswith Sale Signs Holiday
Share of sale itemsNumber of itemsNumber of items with sale signsPercent of items with sale signsHolidayLog Chicken of the Sea PriceLog Starkist PriceLog Bumble Bee PriceLog Other Price
�0.051*0.028*0.204*0.209*
�0.102*�0.218*�0.070*
0.032*�0.007
0.026*0.025*0.028*
�0.053*�0.014�0.093*�0.071*
0.010
0.208*0.031*
�0.052*�0.053*
0.0260.077*0.170*
0.979*0.002
�0.209*�0.172*�0.066*�0.070*
0.018�0.212*�0.189*�0.087*�0.108*
0.078*�0.043*
0.008�0.017
*p � 0.01.
ReferencesAllen, J. W., G. D. Harrell, M. D. Hutt. 1976. Price Awareness Study.
The Food Marketing Institute, Washington D.C.Anderson, Eric T., Duncan I. Simester. 1998. The role of sale signs.
Marketing Sci. 17(2) 139–155.Berman, Barry, Joel R. Evans. 1992. Retail Management: A Strategic
Approach. Macmillan, New York.Besanko, David, Sachin Gupta, Dipak Jain. 1997. Logit demand es-
timation under competitive pricing behavior: An equilibriumframework. Working paper, Northwestern University, Evans-ton, IL.
Chintagunta, Pradeep K., Vrinda Kadiyali, Naufel J. Vilcassim.1998. Competitive interactions in price and advertising: Ananalysis of the ‘share of voice to share of market’ rule.Working paper, University of Chicago, Chicago, IL.
Conover, Jerry. 1986. The accuracy of price knowledge: Issues inresearch methodology. Richard Lutz, ed. Advances in ConsumerResearch, vol. 13. Association for Consumer Research, Ann Ar-bor, MI, 589–593.
Dickson, Peter, Alan Sawyer. 1990. The price knowledge and searchof supermarket shoppers. J. Marketing 54 (July) 42–53.
Grover, Rajiv, V. Srinivasan. 1989. Evaluating the effects of retail pro-motions in segmented markets. Working paper #1059, StanfordUniversity, Stanford, CA.
Guadagni, Peter M., John D. C. Little. 1983. A logit model of brandchoice calibrated on scanner data. Marketing Sci. 2 (Summer)203–238.
Gupta, Sunil. 1988. Impact of sales promotions on when, what, andhow much to buy. J. Marketing Res. XXV (November) 342–355.
Inman, Jeffrey J., Leigh McAlister, Wayne D. Hoyer. 1990. Promotionsignal: Proxy for a price cut. J. Consumer Res. 17 (June) 74–81., . 1993. A retailer promotion policy model consideringpromotion signal sensitivity. Marketing Sci. 12(4) 339–356.
Kadiyali, Vrinda, Pradeep Chintagunta, Naufel Vilcassim. 2000.Manufacturer-retailer channel interactions and implications forchannel power: An empirical investigation of pricing in a localmarket. Marketing Sci. 19 (Spring) 127–148.
Mason, J. Barry, Morris L. Mayer. 1990. Modern Retailing: Theory andPractice. BPI/Irwin, Homewood, IL.

ANDERSON AND SIMESTERAre Sale Signs Less Effective?
MARKETING SCIENCE/Vol. 20, No. 2, Spring 2001142
Narasimhan, Chakravarthi, Scott A. Neslin, Subrata K. Sen. 1996.Promotional elasticities and category characteristics. J. Market-ing 60 (April) 17–30.
Salop, Steven. 1977. The noisy monopolist: Imperfect information,price dispersion, and price discrimination. Rev. Econom. Stud.44 393–406.
Sawyer, Alan G. 1975. Demand artifacts in laboratory experimentsin consumer research. J. Consumer Res. 1 (March) 20–30.
Shimp, Terence A., Eva M. Hyatt, David J. Snyder. 1991. A criticalappraisal of demand artifacts in consumer research. J. Consum-er Res. 18 (December) 273–283.
Stiving, Mark, Russell Winer. 1997. An empirical analysis of priceendings with scanner data. J. Consumer Res. 24 (June) 57–67.
Tellis, Gerard J. 1988. The price elasticity of selective demand: Ameta-analysis of econometric models of sales. J. Marketing Res.XXV (November) 331–341.
Thaler, Richard. 1985. Mental accounting and consumer choice. Mar-keting Sci. 4 (Summer) 199–214.
Villas-Boas, Miguel, Russell Winer. 1996. Endogeneity in brandchoice models. Working paper, University of California atBerkeley, Berkeley, CA.
White, H. 1980. A heteroskedasticity-consistent covariance matrixestimator and a direct test for heteroskedasticity. Econometrica48 817–330.
This paper was received March 20, 2000, and was with the authors 2 months for 2 revisions; processed by Scott Neslin.