are people ready for raster digital soil survey data? janis boettinger amy rohman utah state...
TRANSCRIPT

Are People Ready for Raster Digital Soil Survey Data?
Janis BoettingerAmy Rohman
Utah State University
Suzann Kienast-BrownUSDA-NRCS, Utah
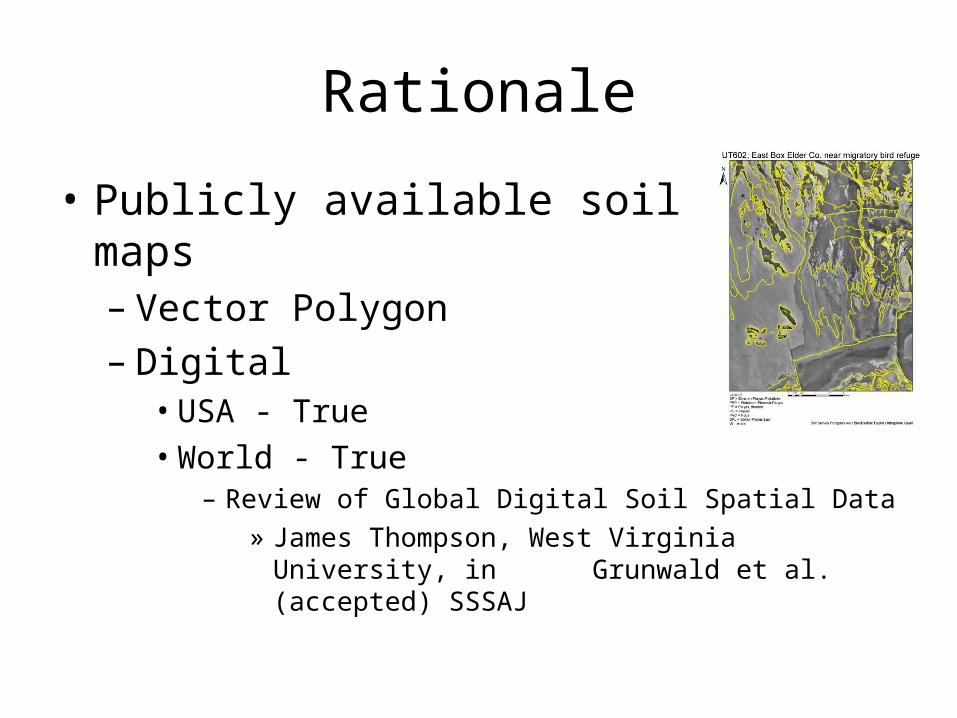
Rationale
• Publicly available soil survey maps– Vector Polygon– Digital• USA - True• World - True
– Review of Global Digital Soil Spatial Data» James Thompson, West Virginia University, in
Grunwald et al. (accepted) SSSAJ

Rationale
• If soil survey maps were available in alternate forms…– Raster (pixel) digital
…what would people’s perceptions & preferences be?
Are People Ready for Raster Digital Data?
Hypotheses
• People ARE ready for raster digital data• Perceptions & preferences of map influenced
by factors– Age– Area of work/study– Prior experience with soil survey maps

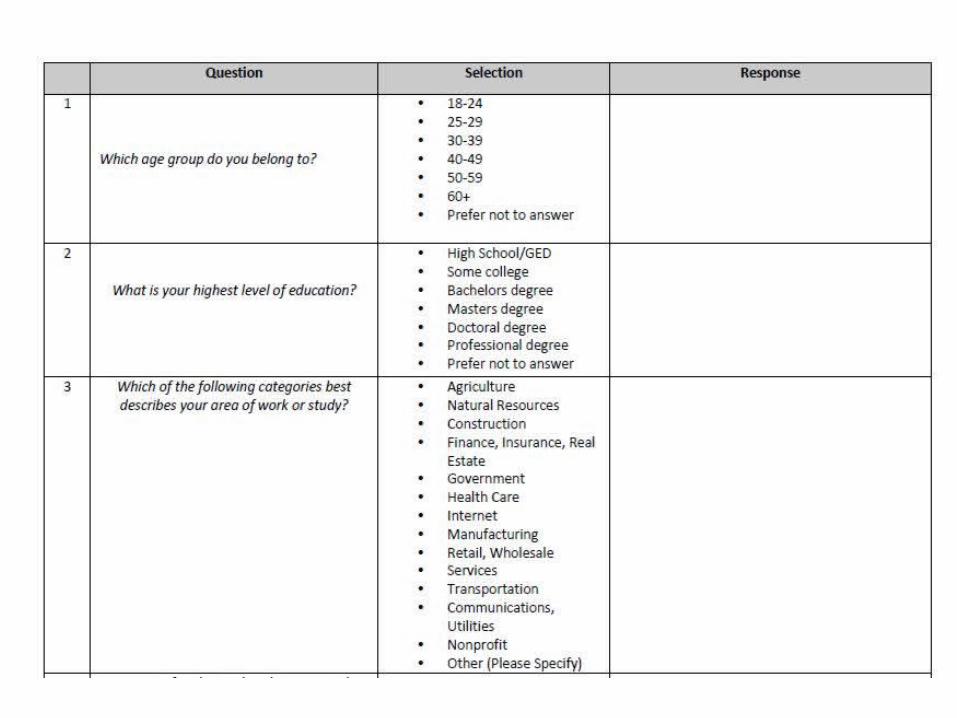
Methods & Materials• Developed interview questionnaire– Demographic information• Age groups• Education• Areas of Work/Study
– Assessed experience with soil survey• Establish baseline of experience
– Custom Soil Survey Report of Part of Cache Valley, Utah
– 3 Maps: UT602, Bear River Migratory Bird Refuge• 3 Qualities rated High, Medium, or Low


All interviewees shown a Digital Orthophoto Quad of the Survey Area before 3 maps.
Map Qualities
• Visual appeal• Conveying information about the spatial
distribution of soils• Determining the soil type(s) mapped at a
specific location– High– Medium– Low

Map A: Black & White DOQ withPolygons
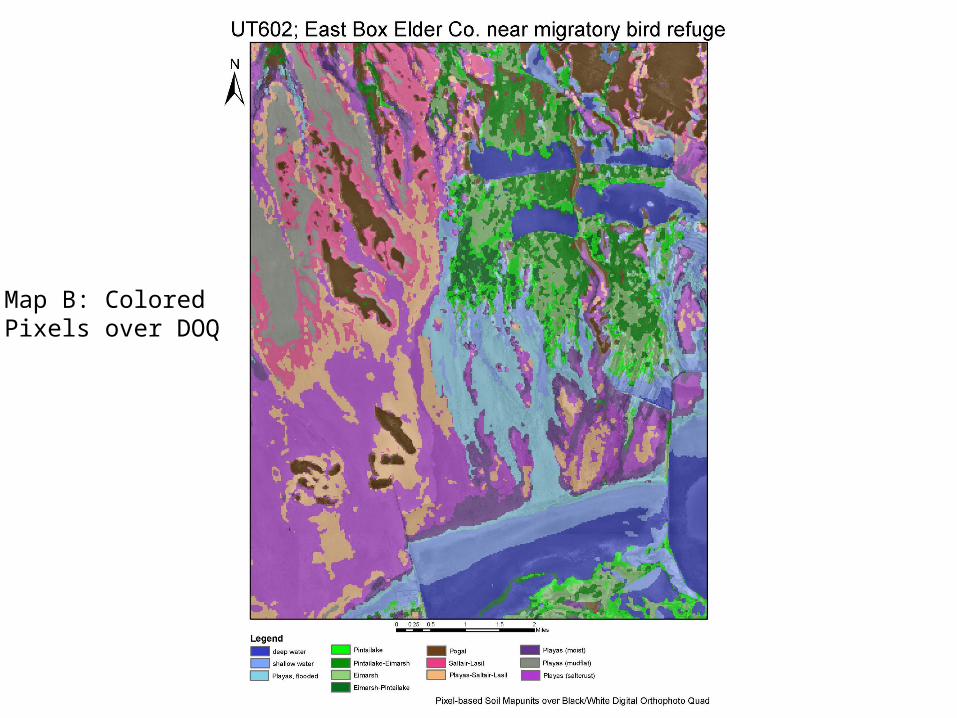
Map B: ColoredPixels over DOQ

Map C: ColoredPixels Only
Methods & Materials• 65 Interviews – conducted in person, one-on-one– Suzann Kienast-Brown
• NRCS Soil Scientist & RS-GIS Specialist, Utah• About 15 interviews
– NRCS, USFS, Arts community in northern Utah
– Amy Rohman • Undergraduate Research Assistant• Natural Resources major
– Summer and fall following freshman year
• About 50 interviews– Diverse sample of USU students & faculty, family, friends
• Opportunity to educate people about soil survey
Methods & Materials• Results summarized – Histograms, descriptive statistics– Categories High, Medium, Low
• Ranked 1, 2, 3, respectively
• Statistical analysis– Kolmogorov-Smirnov Test (K-S Test)
• Non-parametric – No assumptions regarding normality
• Compares cumulative distribution functions of two samples– D-statistic = Maximum distance between cumulative distribution
functions
• Significantly different at P=0.05

Results – All (N=65)

Visual Appearance
D = 0.446, P<0.001*

Ai vs. Bi
D

Visual Appearance
D = 0.446, P<0.001*

Bi vs. Ci

Visual Appearance
D = 0.431, P<0.001*

Visual Appearance
D = 0.446, P<0.001
D = 0.431, P<0.001
Color pixel maps (B and C) rated higher for visual appearance than B&W polygon map.No other statistically significant differences
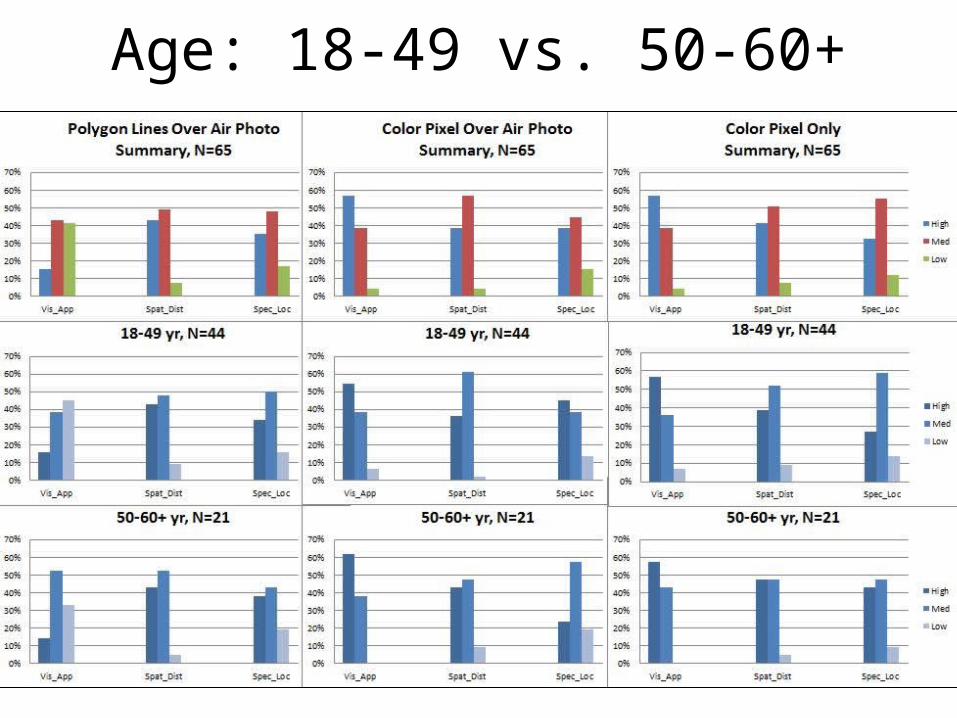
Age: 18-49 vs. 50-60+

Age: 18-49 vs 50-60+
No significant differences (at P=0.05) between groups for all 3 map qualities
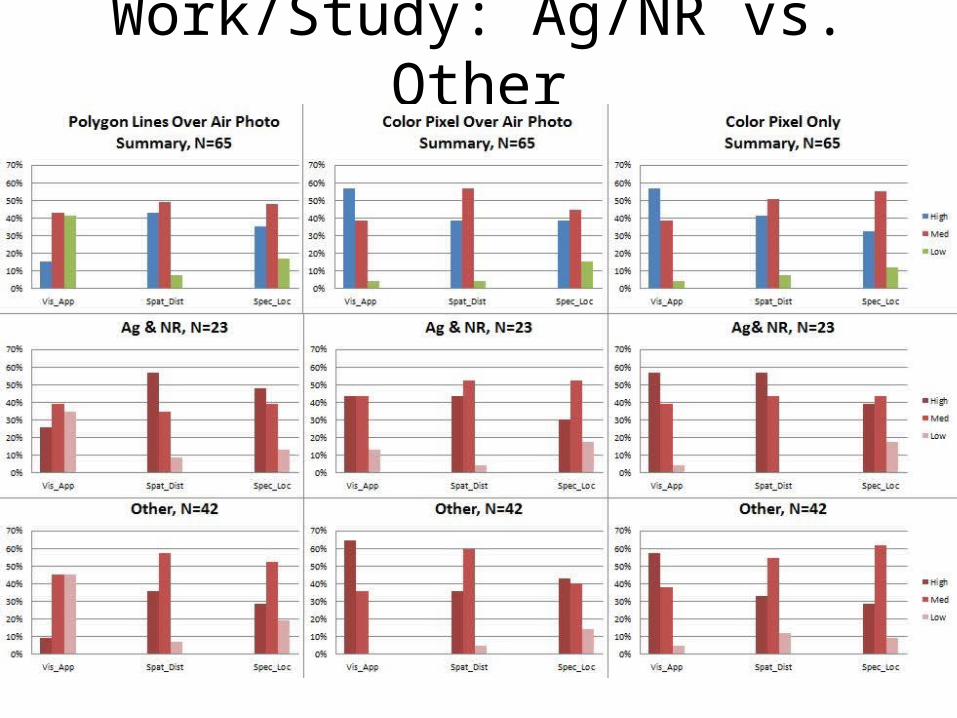
Work/Study: Ag/NR vs. Other
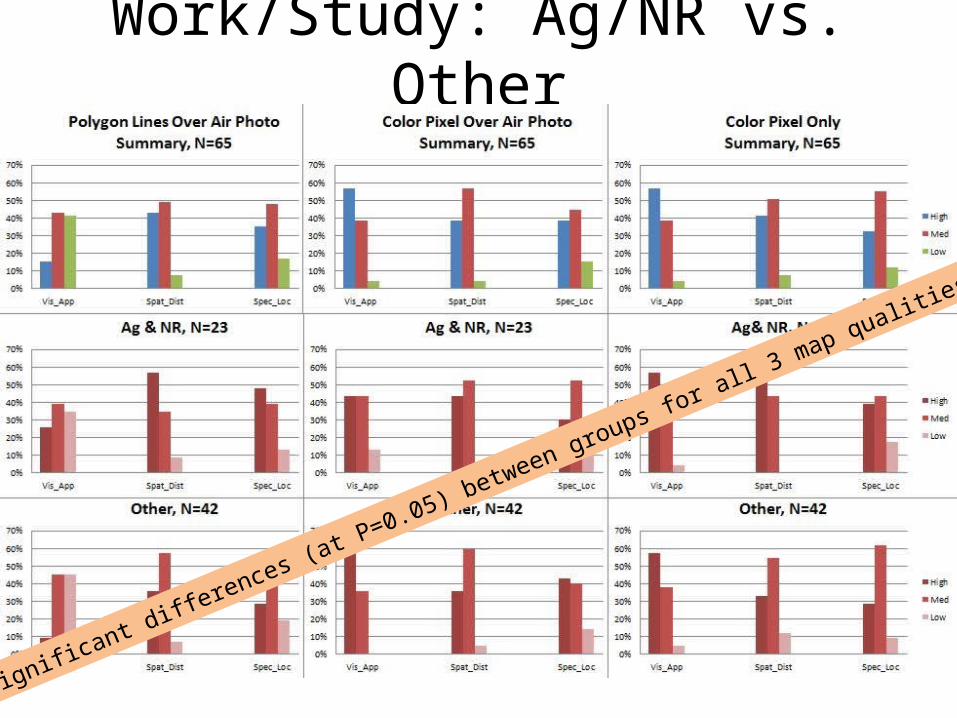
Work/Study: Ag/NR vs. Other
No significant differences (at P=0.05) between groups for all 3 map qualities

Prior SS Use vs. No Prior SS Use

Prior SS Use vs. No Prior SS Use
D = 0.349, P=0.048*; Polygon lines over air photo: Conveying info on soil spatial distribution

Prior SS Use vs. No Prior SS Use
D = 0.349, P=0.048*; Color pixel map over air photo: Visual Appearance

Prior SS Use vs. No Prior SS Use

Prior SS Use vs. No Prior SS Use
Prior SS Use: No significant differences (at P=0.05) between maps for all qualities

Prior SS Use vs. No Prior SS Use
Prior SS Use: No significant differences (at P=0.05) between maps for all qualities
D=0.580, P<0.001

Prior SS Use vs. No Prior SS Use
Prior SS Use: No significant differences (at P=0.05) between maps for all qualities
D=0.568, P<0.001
D=0.500, P<0.001
Summary
• Overall (N=65) – Color pixel maps (both) rated higher for visual
appearance that B&W polygon maps– No significant differences in rating B&W poygon
vs. color pixel maps for• Conveying info on spatial distribution of soils• Determining soil type(s) mapped for specific location
Summary
• B&W polygon map rated higher: Conveying information on spatial distribution of soils– Prior soil survey experience (N=21)
• Color pixel over air photo base map rated higher: Visual appearance– No prior soil survey experience (N=44)

Summary
• Prior soil survey use– No significant differences in ratings of map
qualities for all maps
• No prior soil survey use– Color pixel maps (both) rated higher for visual
appeal

Conclusions
• Prior soil survey use influenced ratings – Visual appeal of B&W polygon vs. color pixel– B&W polygon for conveying information on spatial
distribution of soils

Conclusions
• Prior soil survey use influenced ratings – Visual appeal of B&W polygon vs. color pixel– B&W polygon for conveying information on spatial
distribution of soils
• No differences between maps for gaining information, regardless of prior soil survey use– Spatial distribution of soils– Determining soil (s) mapped at specific location

Conclusions
People ARE ready for raster digital soil data!