are mussel shells environmental dna time capsules? a
TRANSCRIPT
Eastern Kentucky University Eastern Kentucky University
Encompass Encompass
Online Theses and Dissertations Student Scholarship
January 2017
Are Mussel Shells Environmental DNA Time Capsules? A Are Mussel Shells Environmental DNA Time Capsules? A
Comparison Of Extraction Methods For Obtaining DNA From Shell Comparison Of Extraction Methods For Obtaining DNA From Shell
Material. Material.
Kelsey Elizabeth Rogers Eastern Kentucky University
Follow this and additional works at: https://encompass.eku.edu/etd
Part of the Terrestrial and Aquatic Ecology Commons
Recommended Citation Recommended Citation Rogers, Kelsey Elizabeth, "Are Mussel Shells Environmental DNA Time Capsules? A Comparison Of Extraction Methods For Obtaining DNA From Shell Material." (2017). Online Theses and Dissertations. 488. https://encompass.eku.edu/etd/488
This Open Access Thesis is brought to you for free and open access by the Student Scholarship at Encompass. It has been accepted for inclusion in Online Theses and Dissertations by an authorized administrator of Encompass. For more information, please contact [email protected].
STATEMENT OF PERMISSION TO USE
In presenting this thesis in partial fulfillment of the requirements for a Master’s degree
at Eastern Kentucky University, I agree that the Library shall make it available to
borrowers under rules of the Library. Brief quotations from these documents are
allowable without special permission, provided that accurate acknowledgements of the
source is made. Permission for extensive quotation from or reproduction of this
document may be granted my major professor in his absence, by the Head of
Interlibrary Services when, in the opinion of either, the proposed use of the material is
for scholarly purposes. Any copying or use of the material in this document for
financial gain shall not be allowed without my written permission.
Date 11/10/2017

ARE MUSSEL SHELLS ENVIRONMENTAL DNA TIME CAPSULES? A
COMPARISON OF EXTRACTION METHODS FOR OBTAINING DNA FROM
SHELL MATERIAL.
By
KELSEY ELIZABETH ROGERS
Submitted to the Faculty of the Graduate School of
Eastern Kentucky University
in partial fulfillment of the requirements
for the degree of
MASTER OF SCIENCE
December, 2017

ii
Copyright © Kelsey Elizabeth Rogers, 2017
All Rights Reserved
iii
ACKNOWLEDGEMENTS
I would like to express gratitude and thanks to my mentor and advisor Dr. David Michael
Hayes for his constant support and guidance throughout my graduate career and thesis
research project. I would also like to extend this thanks to Dr. Sherry Harrel and Dr.
Oliver Oakley, members of my thesis committee, Dr. Valerie Peters and Grayson Patton,
for additional help and encouragement along the way. The completion of this research
project would not have been possible without funding from Arkansas Game and Fish
Commission through the State Wildlife Improvement Grant. I would like to thank Eastern
Kentucky University for providing me with many learning opportunities and additionally
for funding both my undergraduate and graduate studies by means of scholarships and
assistantships. Additionally, I would also like to thank my family, especially my parents,
Matt and Wendy Rogers, for their unconditional love and unwavering support.

iv
ABSTRACT
Freshwater mussels have become some of the most imperiled species in North
America and widespread populations have succumbed to pollution and many other
anthropogenic-related factors. With molecular techniques evolving, a recent interest in
ancient DNA and museum specimens has emerged and prompted a study to test the
ability of several extraction methods to isolate DNA from museum mussel specimens.
The purpose of this study was to determine if four DNA extraction methods had influence
on total DNA yield (ng/mg) from mussel tissue. The hinge ligaments of freshwater
mussels ranging in collection date (1984-2015) were used as the source of genetic
material for this study. Additionally, collection date was tested for influence on the total
DNA yield. An interaction between collection year and extraction method was also
explored. A total of 40 hinge ligaments were removed from dried museum shells and
subjected to four different DNA extraction methods. Total DNA yield (ng/mg) from the
extractions was quantified using a Qubit 3.0 Fluorometer and a Nanodrop 2000. A
modified CTAB extraction method was found to be statistically higher for extracting total
DNA compared to the other three methods. This suggests that chloroform-based
extractions may be optimal for DNA extraction from historic museum specimens
containing fragile and degraded DNA. Future research will be necessary to determine the
origin of DNA from the extracted genetic material. Now, with a more optimized
extraction method, the hinge ligaments from shells stored in museums can be used for
extraction of host DNA and potentially eDNA released from other organisms.

v
TABLE OF CONTENTS
SECTION PAGE
1. INTRODUCTION ...........................................................................................................1
1.1 Cyprogenia stegaria Background Information ..................................................7
1.2 Objective of Research and Project Goals...........................................................9
1.3 Outline of Hypotheses........................................................................................9
2. METHODS ....................................................................................................................10
2.1 Sample Selection ..............................................................................................10
2.2 Quality Control ................................................................................................10
2.3 Sample Preparation: The “Breakdown Steps” .................................................11
2.4 DNA Extraction ...............................................................................................12
2.4.1 Modified CTAB Extraction ..........................................................................13
2.4.2 MagJET Genomic DNA Extraction ...........................................................14
2.4.3 GeneClean for Ancient DNA Extraction ...................................................14
2.4.4 DNeasy Blood and Tissue DNA Extraction ..............................................15
2.5 Qubit Sample Preparation ................................................................................15
2.6 Nanodrop Sample Preparation .........................................................................16
3. ANALYSIS AND RESULTS ........................................................................................17
3.1 Data Analysis ...................................................................................................17
3.2 Results .............................................................................................................17
4. CONCLUSIONS AND DISCUSSION .........................................................................20
4.1 Learned and Discovered ..................................................................................20
4.2 Future Research and Goals ..............................................................................21
vi
4.3 Special Notes ...................................................................................................23
APPENDICES ...................................................................................................................25
A. Figures ...............................................................................................................26
B. Tables ................................................................................................................32
LITERATURE CITED ......................................................................................................36

vii
LIST OF TABLES
TABLE PAGE
Table 1. General Information for Cyprogenia stegaria Specimens ................................33
Table 2. Total DNA yield (ng/mg) and 260/280 and 260/230 Ratios* ...........................34
Table 3. Analysis of Variance Table Reporting F-Statistics for Collection Year,
Extraction Method, and Interaction (Factorial ANOVA) ................................................35
Table 4. Tukey’s Multiple Comparisons of only Significant Means for Extraction
Method (95% Family-wise Confidence Level) ...............................................................35
Table 5. Tukey’s Multiple Comparisons of only Significant Means for Collection Year
(95% Family-wise Confidence Level) .............................................................................35
Table 6. Tukey’s Multiple Comparisons of only Significant Means for Interaction (95%
Family-wise Confidence Level) ......................................................................................35
viii
LIST OF FIGURES
FIGURE PAGE
Figure 1. Representative shells of Cyprogenia stegaria .................................................27
Figure 2. Hinge ligament from a representative Cyprogenia stegaria shell ...................27
Figure 3. Boxplot comparing DNA extraction methods and total DNA yield (Factorial
ANOVA). ........................................................................................................................28
Figure 4. Boxplot comparing collection year and total DNA yield (Factorial
ANOVA). ........................................................................................................................29
Figure 5. Interaction line graph comparing the interaction between the collection year
and the extraction method on the total DNA yield. .........................................................30
Figure 6. Tukey’s Multiple Comparison of Means in extraction method using 95%
Family-wise Confidence level .........................................................................................31

1
1. INTRODUCTION
Freshwater mussels are known to play an important biological role in the
freshwater ecosystem specifically in nutrient cycling and biodeposition processes,
which provide clean water and food for many other fauna. These bivalves are also
known to aid in the removal of algae through filtering processes (Howard & Cuffey
2006; Nalepa et al., 1991; Vaughn et al., 2004;). Additionally, mussel beds provide
substrate stability and a home to many other aquatic organisms. Therefore, the decline
of mussel populations could be detrimental to many other freshwater fauna and could
negatively impact entire freshwater ecosystems (Haag 2012; Lydeard et al., 2004).
Freshwater mussels have become some of the most imperiled species in North
America and are constantly facing many anthropogenic-related hardships that affect
their stability in many aquatic ecosystems (Strayer et al., 2004; Williams et al., 1993;
Walker et al., 2014). Due to their sedentary and filter-feeding lifestyles, freshwater
mussels are extremely sensitive to rapid environmental and climatic changes, and can
perish easily during rapid habitat disturbances. Over 30 North American mussel taxa
have become extinct within the last 100 years and it is estimated that approximately
65% of the remaining taxa are endangered, threatened, or vulnerable (Haag & Williams
2014). These serious deteriorations of mussel populations can be attributed to many
reasons; loss of overall habitat, pollution, fish host reduction, and many other
anthropogenic causes. The loss of aquatic habitats often occurs through habitat
fragmentation and degradation and in many waterways a large proportion of pollution
comes from many industrial and farming practices (Haag & Williams 2014; Mock et al.,
2010; Makhrov et al., 2014). The reduction of fish can affect the distribution of many

2
mussel species, as most juvenile mussels are obligate parasites to fish during their early
stages of life and thus require fish hosts to continue their life cycle (Haag & Warren
1998; Schwalb et al., 2013). The loss of these important fish hosts can drastically
interrupt the life cycle of freshwater mussels. Other anthropogenic-related factors such
as construction of bridges, dams and highways can affect the overall health and
distribution of freshwater mussels. Because of serious deteriorations in many freshwater
mussel populations, finding a live mussel during field surveys can be very difficult,
particularly in cases of rare and evasive species.
However, even when these important organisms are no longer living in an
aquatic ecosystem, they can provide proof of their existence through the remains of
their shells. In the field, shells can be collected from dead organisms after episodes of
mortality usually without implicating negative effects on the remaining living
populations (Geist 2010). Mussel shells have been collected and stored in museums for
many decades in efforts to describe and document species dating back to the late 1700’s
(Baker 1921). And sometimes shells of stored museum specimens can serve as some of
the only archives of a rare or extinct animal’s existence and contain valuable genetic
information about a species. Before recent advancements in sequencing technologies
and molecular biology, malacologists and field biologists often relied solely on
morphological shell characteristics for both identification and occurrence data. These
morphological characteristics included things like; size, shape, and color, as well as
location found. Museum specimens were traditionally collected and stored for
preserving morphological characteristics but perhaps they can also serve as potential
archives of the past by storing genetic material within the shell layers like a time
3
capsule. With DNA sequencing technologies evolving rapidly there has been a recent
interest in analyzing historical museum specimens across many biological fields
(Burrell et al., 2016). However, analyses involving ancient DNA and museum
specimens still remains challenging to researchers because of degradation that occurs
after biological samples are not stored properly thus leading to DNA fragmentation
(Dabney et al., 2013). It is expected that DNA collected from ancient samples will be
fragmented and contain chemically modified bases and cross-links as well as a myriad
of other contaminants (Smith et al., 2015). These modifications make it extremely
difficult to amplify the DNA strand using traditional PCR (polymerase chain reaction)
methods, which are routinely used to detect and amplify a DNA marker before
sequencing begins (Burrell et al., 2016).
Nevertheless, previous studies have shown success in sequencing DNA from
museum specimens across many biological taxa including; insects, birds, and various
mammals (Besnard et al., 2014; Blaimer et al., 2016; Campbell et al., 2005; Hawkins et
al., 2016; McCormack et al., 2016). Samples from museum specimens generating even
as little as 1 ng/µl of DNA were found to be successful in sequencing when using Next
Generation Sequencing (NGS) methods (Sproul & Maddison 2013). The shells of
museum mussel specimens could potentially contain valuable genetic information about
the mussel itself and its surrounding environment. The problems between amplification
through PCR and ancient museum samples have led to the need for a method to extract
the most DNA molecules from museum specimens which are expected to contain a high
degree of DNA degradation. Therefore, the development of an optimal protocol for
extracting DNA from freshwater museum mussel shells could be beneficial to
4
researchers interested in isolating DNA from other ancient specimens while also
searching for additional environmental sources of DNA (eDNA). Answering some
missing information for optimizing a DNA extraction protocol for museum-stored shells
could work to help recreate entire historical ecosystems, delineate phylogenetic
relationships, and reveal cryptic gene diversity hidden within the genetic information
stored within the layers of the shells.
The idea of using shells to obtain additional information expanding beyond that
of morphological data is not a novel one, and many studies have exemplified this. In
previous studies, shells from mollusks have been found to be a source of several key
elements; DNA pertaining to the host species it was collected from, data from
fluctuating environmental conditions, and additionally records of DNA from the
surrounding environment. In previous studies involving freshwater mussels, DNA was
successfully extracted from shell material, amplified, and samples were genotyped
using a cytochrome oxidase 1 (COI) mitochondrial DNA gene marker (Geist et al.,
2008). Mitochondrial markers are genes that can be used for the identification of
species. In another study, DNA was effectively extracted from a freshwater mussel
hinge ligament and the DNA was sequenced and data was analyzed and used to make
inferences on past population genetic structure (Doherty et al., 2007). In addition to
providing information about the individual host itself, shells can also offer evidence
about the environment the animal once lived in. In several previous studies, there has
been success in using shell material to examine a range of environmental parameters.
These parameters include environmental conditions such as; climate, records of
vegetation, and times of nutrient influx. Shells can also provide growth estimations by

5
using the layers in the shells, comparable to botanists using rings in a tree, to estimate
the age of an ancient specimen. Climate can be estimated by evaluating isotopic
signatures using stable isotopes, such as carbon and oxygen, which are found stored
within shell material. These stable isotopic patterns have been derived from ancient
mollusk snail shell material in previous studies and used to reconstruct and mark
fluctuations in paleoclimates and vegetation records (Prendergast et al., 2015; Yanes et
al., 2009). Similar isotopes have also been used to record changes in the growth of
mollusk shells during times of nutrient pollution and eutrophication (Fritts et al., 2017;
Jones 1983; Jones & Quitmyer 1996; Schöne et al., 2003).
However, aside from providing genetic information about the host and records
of environmental conditions, shells can additionally be used for capturing
environmental DNA (eDNA) molecules, which are released from other organisms and
captured in-between the layers of the porous shells. In a recent study, marine mollusk
shells were positively identified as sources of eDNA by using DNA barcoding and
metabarcoding approaches to explore the shells for other aquatic taxa, including
microbial species’ (Sarkissan et al., 2017). By using marine clams shells, this study had
a success rate of only 29% for ancient shells, which they considered to be shells 60
years and older. In some cases, most or all of the shell material had to be used. They did
however, have success in some extraction of DNA and also with the taxonomic
identification of several species using a combination of mitochondrial DNA genomes,
barcoding, and metagenomic approaches. They were also able to identify microbial
communities such as a Vibrio species known to be pathonogenic to shellfish and were
also negatively affecting the clams (Sarkissan et al., 2017). Therefore, it is known that
6
shell material can be used as an eDNA time capsule to lock within its layers the DNA
that is released from other organisms in the environment. However, the question of
which DNA extraction method is best suited for extracting fragile DNA from hinge
ligament material in the most efficient way remains unanswered, and is what will be
primarily addressed in this study.
The shells of freshwater mussels are formed through an accretionary growth
process, making this protective outer-covering present and growing for the animal’s
entire lifetime. The shell is made of a protein and calcium-carbonate matrix that is
secreted by the mantle and the hinge ligament is the structure that attaches the two
halves of the shells and allows for movement between them (Doherty et al., 2007).
Hinge ligament is also present throughout an animals’ lifetime and, like shell material,
could also potentially contain genetic information inside. This ligament is an elastic
structure that contains several layers of lamellar and filamentous materials and is
primarily comprised of keratin and proteins (Ubukata 2003). These layers are porous
and can permit DNA molecules to become trapped within the layers, ultimately
allowing this non-cellular ligament to be a potential source of genetic material for both
host and eDNA like a time capsule (Doherty et al., 2007; Geist et al., 2008). The hinge
ligament is what was used in this study as the source of genetic material. Destructive
sampling is usually undesirable, particularly for rare and extinct museum specimens
which can be very precious. However, the hinge ligament was chosen for this study
because it is not usually taxonomically informative or used for morphological
identification purposes, making it an ideal candidate for removal from historical and
ancient specimens.
7
1.1 Cyprogenia stegaria Background Information
A bivalve of interest, Cyprogenia stegaria (Bivalvia: Unionoida) (Rafinesque,
1820), commonly known as the Fanshell mussel, is a critically endangered species that
was once abundant in many rivers spanning across Kentucky, Ohio and Tennessee. This
species was added to the federally endangered list in 1990 by the US Fish and Wildlife
Service (USFWS) following severe population declines (USFWS, 1991). Historically,
this species was endemic to the Ohio, Tennessee, and Cumberland rivers of the
Mississippi River drainage, USA (Ortmann 1918, 1919). Now, however, reproducing
populations of this species are extremely rare and have been limited to only three
known river systems in North America including; the Green and Licking rivers of
Kentucky, USA., and also the Upper Clinch River of Tennessee and Virginia, USA.
(Jones & Neves 2002). There may be a few potential relict populations still residing in
several rivers in Ohio, Illinois, Indiana, West Virginia, Kentucky and in Tennessee,
where the presence of this species was historically documented (USFWS, 1991).
Cyprogenia stegaria has a round shell that is greenish-yellow and covered in small
bumps and lined with dark green rays (USFWS, 2016).
Cyprogenia stegaria was selected as the study species for several reasons. This
mussel is a critically endangered species and therefore, any genetic information
harvested from this species could help aide in restoration of their declining population.
Secondly, at maturity these bivalves are also relatively large and can produce a large
hinge ligament, making it easier to remove and allowing more tissue to be harvested for
data collection compared to that of smaller species. Additionally, the Cyprogenia genus
has been the subject of several genetic studies which have supplied biologists with
8
important information for understanding genetic relationships within and among
different species in the genus (Serb 2006, Serb & Barnhart 2008). These studies
explored genetic relationships utilizing molecular tools such as mitochondrial DNA
(mtDNA) and microsatellite sequencing to determine if monophyletic clades exist
among the same river drainages and if those clades have any correlation with
morphological characteristics of shell features (Chong et al., 2016). Because of a high
degree of morphological similarities among mussel groups and great ranges of
variability within species, taxonomic uncertainties by morphological characteristics still
pose a potential problem to conservation management (Zieritz & Aldridge 2009).
Therefore, establishing a source of genetic material for both current and historic
populations of freshwater mussels and additionally other sources of eDNA may aide in
conservation efforts by identifying unique genetic characteristics and revealing other
environmental counterparts of importance. Cyprogenia stegaria has become critically
endangered due to many anthropogenic factors and with some populations becoming
increasingly isolated, extensive conservation and propagation efforts might become
necessary in the future (Campbell et al., 2005; Jones & Neves 2002). Both genetic and
ecological studies should be used in combinatory efforts for devising and maintaining
effective conservation strategies (Geist 2010). Harvesting genetic material from C.
stegaria museum specimens could contribute to their conservation by revealing genetic
variation and delineating phylogenetic relationships while simultaneously obtaining
information about other taxa present in the same environment to accurately describe and
potentially recreate historical ecosystems.
9
1.2 Objective of Research and Project Goals
The goal of this study was to assess the potential of using hinge ligament tissue from
museum mussel shells for a DNA-based analyses using the endangered Fanshell mussel
(C. stegaria) (Figure 1)1. The objective of this research project was to assess the
effects of four extraction protocols on extracting total DNA from hinge ligament tissue
on the total DNA yield (ng/mg) measured by fluorometric quantitation (Figure 2). The
collection date (more historic vs. most recent) was also analyzed to see if there was any
interaction between the time shells were collection and the total DNA derived from an
extraction method. Hinge ligament tissue weight ranged between the shells chosen for
collection (1.4 mg–217.1 mg), however, the total DNA obtained was standardized by
the starting dry tissue weight, thus removing tissue weight as a variable in extraction
success.
1.3 Outline of Hypotheses
Null Hypothesis for Extraction Method: There is no significant difference
between the total DNA obtained between the four extraction methods.
Null Hypothesis for Collection Year: There is no significant difference between
the total DNA obtained between collection years.
Null Hypothesis for the Interaction Effect between Extraction Method and
Collection Year: There is no significant interaction between the total DNA obtained and
the extraction method with collection year.
(1All figures and tables are presented in an appendix at the end of this thesis (Appendix A and B).
10
2. METHODS
2.1 Sample Selection
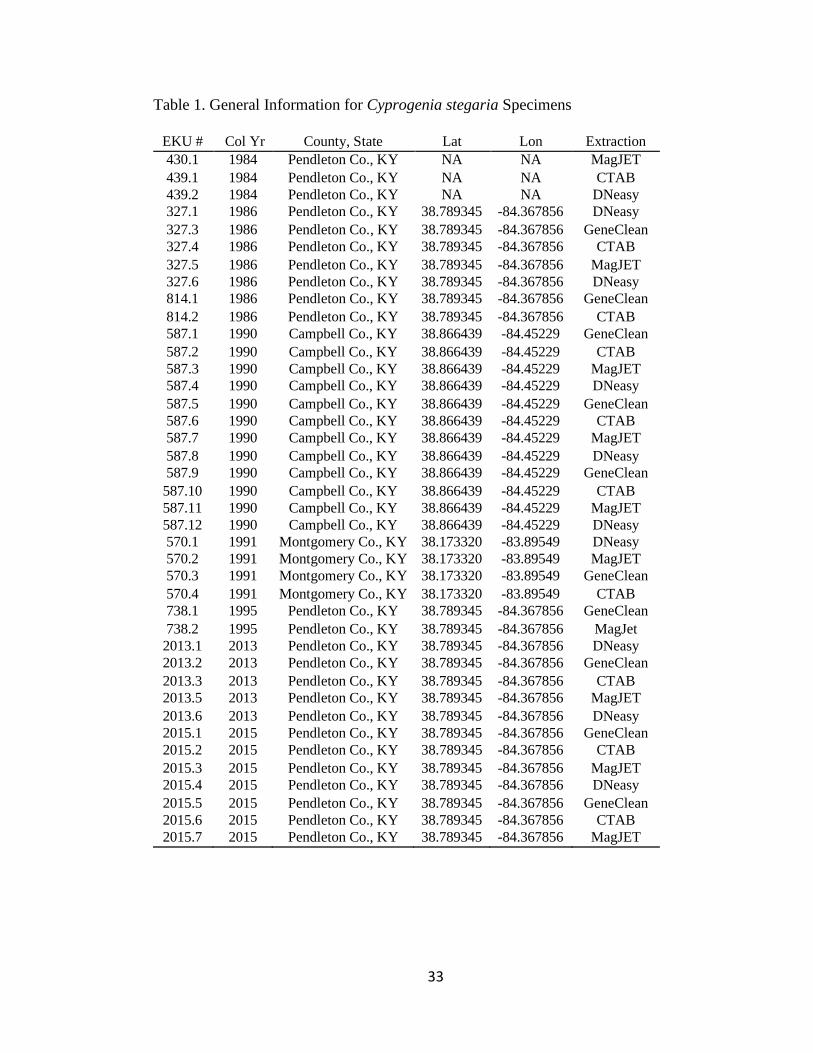
A total of 40 shells were obtained from the Branley A. Branson Museum of
Zoology, Eastern Kentucky University (Table 1). These mussels were harvested from
the Licking River during several collection bouts; two historical collections in 1984-
1986 and 1990-1995 and a more recent collection in 2013-2015. The hinge ligament
was removed from the 40 shells and randomly assigned to an extraction protocol only
after ensuring that at least one shell from the historic collections (1984-1995) and one
from the more recent collection (2013-2015) was included for each of the four
extraction processes.
2.2 Quality Control
Before sample preparation began, all countertops were decontaminated with a
10% bleach solution. Before any molecular techniques were implemented, all
equipment was exposed to UV light for a minimum of 30 minutes. Metal tools were
soaked in bleach and flame sanitized. Additionally, pipettes, pipette tips, and
microcentrifuge tubes were autoclaved at 121C before use. Filtered pipette tips were
also used. Extensive efforts were taken to ensure proper handling of the samples and
prevention of any potential contamination. All 40 specimens were subjected to a brief
wash using deionized water and then baked at 100C for 4 hours (Doherty et al., 2007;
Pedersen et al., 2014). This step was implemented to remove any exogenous DNA
present on the outside of the mussel shell and to also rid the sample of any potential
bacterial or fungal contamination which may have accumulated during sample storage.
11
2.3 Sample Preparation: The “Breakdown Steps”
The tissue was subjected to several lysing steps before a DNA extraction method
was used and these series of steps will be referred to as “Breakdown Steps” for the
remainder of this paper. During the first part of this sample preparation, the tissue was
attempted to be physically smashed by subjecting the hinge ligament tissue to
mechanical homogenizing. This homogenizing step was completed by using two
sterilized zinc-coated beads within a 1.5 ml microcentrifuge tube and then vortexing the
tube on high power and high speeds for five minutes. This was repeated several times.
This mechanical force did break up some of the softer hinge ligament into smaller
pieces but it was not sufficient in breaking the larger and more calcified tissue pieces
up.
Therefore, a second part of the “Breakdown Steps” was implemented, and all
tissue samples were subjected to an additional chemical lysis step. This chemical lysis
contained several steps and was initiated by a 48-hour pre-soak of the hard tissue in a
solution of 0.5 M EDTA (Ethylenediaminetetraacetic acid) at room temperature
accompanied by gentle shaking using an orbital shaker (Villanea et al., 2016). The
addition of EDTA, a chelating agent, renders DNases inactive and thus enabling more
DNA molecules to survive the extraction process and avoid being dissolved by
enzymes. After this initial pre-soak in EDTA, several incubations using; proteinase K
(20 mg/ml) and -Mercaptoethanol (CAS # 60-24-2) were included, with volumes
dependent on each extraction method. Proteinase K is known to cleave peptide bonds
and digest proteins and was utilized in all four extractions methods. -Mercaptoethanol
was added because of its known activity in reducing disulfide bonds in proteins and by

12
reducing other inhibitors such as tannins. -Mercaptoethanol is commonly used in other
extraction methods such as the RNeasy Mini Kit extraction (Qiagen, USA), and was
adopted for all extraction methods. An additional solvent, 10% sodium dodecyl sulfate
(SDS), was used for only one extraction method per manufacture suggestion. SDS is a
strong anionic detergent and can remove lipid and protein membranes. Temperatures for
the overnight soaking were determined by the suggestion of each extraction method per
manufacture protocols and these vary among the four methods as well as the core
components of the soak. The additional chemical soak was still not sufficient in
breaking down all parts of the hinge ligament and filamentous tissue into a desired fluid
sample so all samples were subjected to a polyethylene microcentrifuge column. This
column worked to remove and filter larger particles of ligament out from the aqueous
solution and the remaining liquid, which included any genetic material, was then
subjected to the four different extraction methods (See 4.3 Special Notes).
2.4 DNA Extraction
Four extraction protocols were compared at their ability and efficiency to isolate
DNA from the hinge ligaments of 40 Cyprogenia stegaria museum specimens ranging
in collection years (1984-2015). One modified Cetyltrimethylammonium bromide
(CTAB) (GBiosciences, MO, USA.) extraction based upon chloroform was selected. In
addition to the CTAB method, three commercially available extraction kits including
DNeasy Blood and Tissue Kit (Qiagen, Germany), GeneClean for Ancient DNA Kit
(MPBiomedicals, CA, USA.), and MagJET Genomic DNA Kit (Thermoscientific,
MA, USA.), were selected and all four extraction methods were compared. A total of
ten hinge ligament tissue samples per extraction method were prepared and used.
13
Additionally, a sample of deionized water was used as a negative control for each
extraction protocol and included all reagents used for each extraction process. This was
to account for any genetic material present in the kits or any contaminant that may have
been introduced during an extraction process.
2.4.1 Modified CTAB Extraction
A slightly modified CTAB and chloroform extraction process was used for the
extraction of genomic DNA from hinge ligament tissue. CTAB is a classic chloroform-
based extraction method and is commonly used for the extraction of DNA from many
different sample types. Samples were incubated at 55C for 48 hours to complete the
“Breakdown Steps” by using 7 µl -Mercaptoethanol and 10 µl proteinase K. 700 µl of
premixed CTAB Extraction Solution (GBiosciences) was added to the starting
samples and incubated at 55C for an additional 24 hours before the extraction process
began. This additional incubation period was implemented because of success in
previous studies for optimal DNA extraction by using dried freshwater mussel tissue
(Inoue et al., 2013). Following the extended incubation period, the manufacture
protocols were followed. Samples were incubated at 65C for one hour and cooled to
room temperature. Then 700 µl of chloroform (CAS# 67-66-3) was added and the
samples were centrifuged at 10,000 g and the supernatant was isolated and precipitated
with 600 µl of 100% isopropanol (CAS # 67-63-0). Samples were centrifuged again at
10,000 g and a pellet of DNA was collected and washed with 70% ethanol twice. The
pellet was re-suspended in 100 µl of molecular grade water and stored at -20C.
14
2.4.2 MagJET Genomic DNA Extraction
This method was used for the isolation and purification of genomic DNA from
hinge ligament tissue by utilization of magnetic bead capture methods. This is a basic
bind, wash, and elution method. The magnetic beads are coated with a silica surface and
this will allow for selective DNA binding under high chaotropic salt conditions, and
then the DNA is later removed from the surface of the bead through the force of a
magnet and under low salt conditions. These samples were incubated at 56C for 48
hours and the “Breakdown Steps” were implemented in a solution including: 20 µl
proteinase K, 200 µl Digestion Solution, and 2 µl -Mercaptoethanol. Then the
samples were extracted following manufacture instructions under Protocol E: Manual
genomic DNA purification from up to 20 mg tissue, rodent tail, and insects. Samples
were eluted into an elution buffer of 100 µl and stored at -20C. Three samples during
the extraction processes were destroyed and later removed from the dataset. In these
destroyed samples, the microcentrifuge tubes became thick with a white substance that
hindered the completion of the extraction process because the magnetic beads could not
move through the dense matrix. These samples were possibly destroyed through an
unexpected protein denaturation reaction, however additional research will be required
to identify a true explanation.
2.4.3 GeneClean for Ancient DNA Extraction
This DNA extraction method is designed for the purification of
fragmented/damaged DNA from preserved or ancient samples, making it suitable for
extracting DNA from stored museum specimens. This method uses GLASSMILK™, a
suspension silica matrix solution that is used to isolate and purify DNA. The
15
“Breakdown Steps” were implemented and samples were incubated at 37C for 48
hours in a solution consisting of: 5 µl 0.5 EDTA, 200 µl 10% SDS, and 200 µl 20
mg/ml proteinase K at 37C. SDS was included in this extraction method as a detergent
to remove lipid membranes. Samples then followed the manual extraction protocol
listed in the manufacturer instructions and a 100 µl elution step was completed using
DNA free elution solution provided by the kit and samples were stored at -20C.
2.4.4 DNeasy Blood and Tissue DNA Extraction
This DNA extraction kit was used for the isolation of genomic DNA from hinge
ligament tissue by using a spin column binding in combination with a specific buffer
system. This method uses a bind, wash, and elution process of the DNA. The DNA will
bind to the silica membrane under high salt conditions, however proteins and other
polysaccharides will not usually bind to this column and are washed away during the
alcohol wash step. The DNA can then be eluted under low salt conditions using a
buffer. After the 48-hour “Breakdown Steps” were implemented at 56C using 20 µl
proteinase K and 7 µl -Mercaptoethanol, and then manufacturer protocol was followed
for the extraction method Purification of Total DNA from Animal Tissues (Spin-Column
Protocol). The DNA was eluted into 100 µl of Buffer AE and the samples were stored
at -20C.
2.5 Qubit Sample Preparation
Quantification of DNA was performed using a Qubit™ 3.0 Fluorometer (Life
Technologies). The Qubit dsDNA HS (high sensitivity) assay kit and two standards
(high and low) were used following the manufacturer protocol. For a total of 200 µl
solution, 195 µl of Qubit working solution was added to 5 µl of each sample DNA. The

16
volume of 5 µl of sample was determined through previous studies on similar hinge
ligament tissue, and additionally a midpoint for the company’s recommendation on
volume usage. The solution containing the DNA and Qubit working solution was
incubated for 2 minutes at room temperature (25C) and then sample DNA
concentration was read using the fluorometer (Table 2). This instrument was selected
because it uses a fluorescent molecule that is only reported when it is bound to target
DNA, ultimately minimizing the chance to read free particulates such as RNA, proteins,
and other contaminants that may still be present in the sample.
2.6 Nanodrop Sample Preparation
All samples were quantified using a Nanodrop™ 2000 spectrophotometer to
evaluate purity of the DNA samples. Only 1 µl of each sample was used and the results
for the 260/280 nm and 260/230 nm absorbance ratios were recorded (Table 2). The
ratios of absorbance at 260 nm and 280 nm are often used to assess DNA purity. It is
generally considered that a ratio of ~1.8 for 260/280 nm absorbance is a “pure” genomic
DNA sample. The 260/230 ratio is also used as a secondary measure of DNA purity,
and a generally accepted ratio is within the range of 2.0–2.2 (Thermoscientific, 2009).
This machine does not use a florescent reporter molecule and it can measure other
particulates and contaminants such as proteins and phenols present within the sample.
17
3. ANALYSIS AND RESULTS
3.1 Data Analysis
All statistical analyses were completed using R version 3.3.1 (R Core Team,
2016). The dataset was assessed for normality using a QQ plot and then transformed by
the square root of the dataset. A factorial ANOVA was conducted to compare the effect
extraction method and collection year, and the interaction between extraction method
and collection year on the total DNA yield collected (Full Model). Several Tukey’s Post
Hoc multiple pairwise comparison tests were completed to compare means of both
variables and their interaction. A customized R function was included to report only the
significant pairwise comparisons for the full model (p≤0.001). Two boxplots were
generated to illustrate the differences between the means for extraction method and
collection year on the total DNA yield collected. An interaction plot was generated to
illustrate the differences for the interaction between the two variables; extraction
method and collection year.
3.2 Results
The total DNA yield (ng/mg) was measured using the Qubit and DNA quality
absorbance ratios (260/280 nm and 260/230 nm) were measured using the Nanodrop.
This difference in machinery can account for a few samples which were unable to be
analyzed by the Qubit but the Nanodrop was still able to assign quality ratios. In these
few samples the amount of total DNA may have been too low to be analyzed by the
Qubit, however the remaining free particulates were able to be detected by the
Nanodrop and the absorbance ratios were measured. The lowest 260/280 nm absorbance
ratio was 1.16. There were several outliers with large 260/280 nm absorbance ratios
18
(e.g. 76.46, 8.86, 5.71), which indicate those samples may contain contaminants such as
proteins. The lowest 260/230 nm absorbance ratio was 0.05 and the highest nm
absorbance ratio was 1.46. Most samples contained a low 260/230 ratio, suggesting
some samples may contain a high amount of contaminate such as EDTA, which has an
absorbance around 230 nm.
The means for total DNA yield (ng/mg) were calculated for the non-transformed
data for each of the four extraction methods and reported with the standard deviation.
The GeneClean extraction produced the lowest mean when compared to the other
methods (0.7420 ng/mg ± 0.09894 ng/mg). The DNeasy extraction and MagJET
produced similar means to each other (2.2989 ng/mg ± 0.3017 ng/mg and 2.6955 ng/mg
± 0.4894 ng/mg, respectively). The modified CTAB extraction produced the largest
mean when compared to the other three methods (47.9181 ng/mg ± 6.0087 ng/mg).
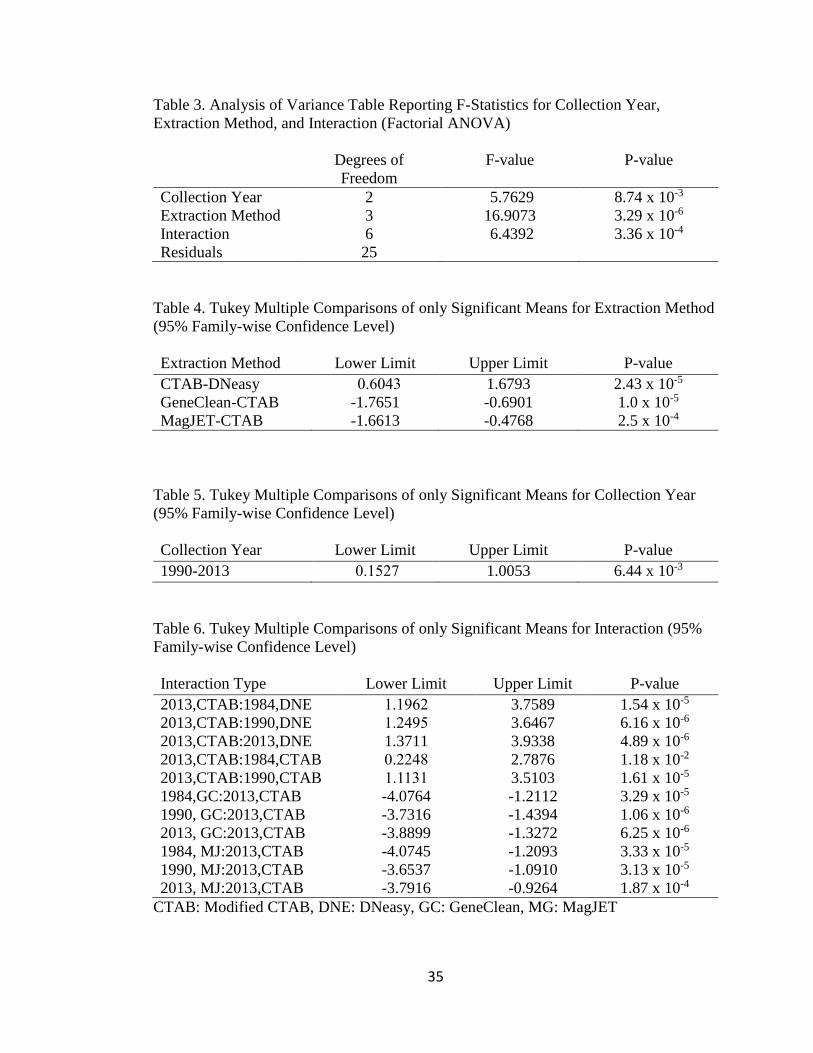
A factorial ANOVA was conducted on the influence of two variables; extraction
method and collection year, and their interaction, on the total DNA obtained. Collection
year included three collection bouts (1984-1986, 1990-1995, 2013-2015) and extraction
method included four extraction methods (DNeasy, Modified CTAB, GeneClean,
MagJET). This ANOVA revealed that all variables had a statistically significant effect
on the total DNA obtained (p ≤0.001 ) (Table 3, Figure 5). To further analysis, a
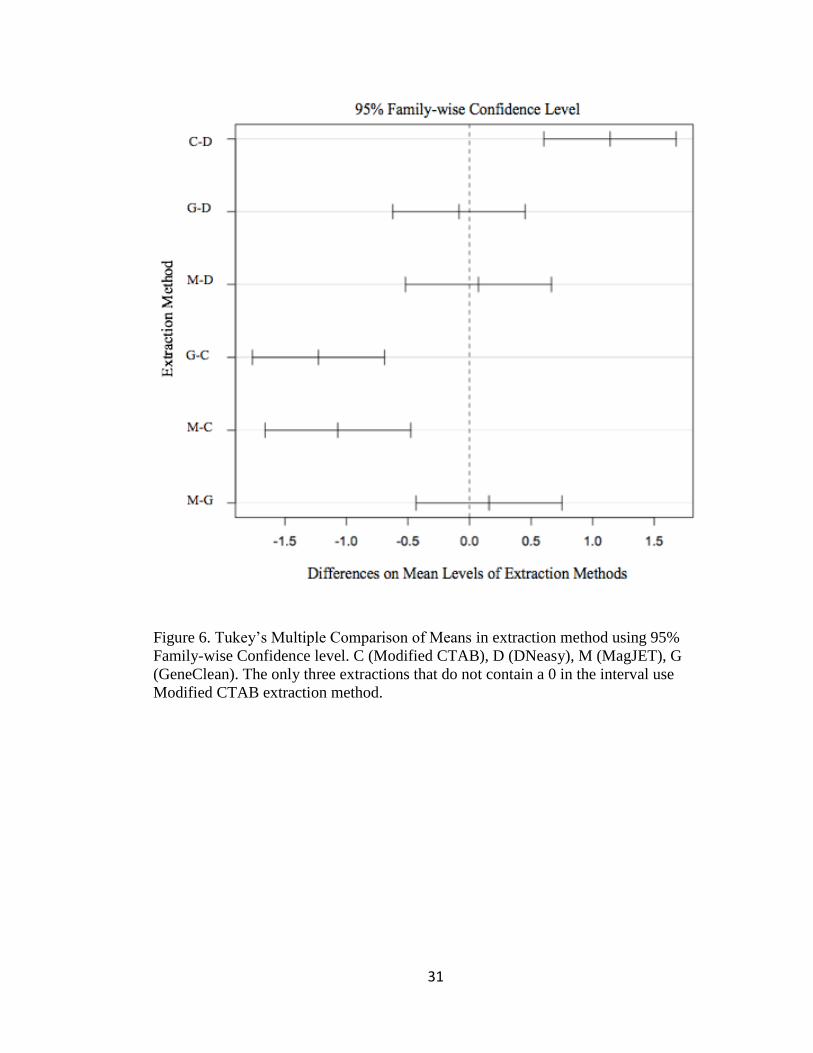
Tukey’s Post Hoc pairwise comparison analysis was used to determine differences in
the means for the extraction method and the total DNA yield rates the modified CTAB
extraction protocol was found to be significantly different than the yield obtained by the
MagJET, GeneClean, and DNeasy Kit (Tukey’s, α=0.05, p ≤0.001) (Figure 6, Table 4).
The modified CTAB extraction method (a) was the only method found the be

19
statistically different than the other methods (b) in extracting total DNA (Figure 3). A
Tukey’s Post Hoc pairwise comparison analysis test was used to determine differences
in the means for the collection year and, unsurprisingly, the total DNA yield rates from
the most recent collection bout (2013-2015) were found to be significantly different
than those obtained by the other two historical collections (Tukey’s, α=0.05, p ≤0.001)
(Figure 4, Table 5). Another Tukey’s Post Hoc pairwise comparison analysis test was
used and the total DNA yield rates from the all interactions which contained CTAB
extraction method were significantly different than those obtained by the other
interactions that did not include CTAB (Table 6). This suggests that the Modified
CTAB extraction method does have an interaction with the most recent collection year
(2013-2015), however it is still able to extract the most DNA from hinge ligament tissue
when compared to the other three methods.
20
4. CONCLUSSIONS AND DISCUSSION
4.1 Learned and Discovered
The hinge ligament of freshwater mussel shells is a source of DNA and all four
extraction methods were successful in extracting DNA. Despite the overall success,
DNA yield rate in the individual hinge ligament samples varied within, and across, each
of the four extraction methods. All negative controls had DNA concentrations too low
to be read by the Qubit, suggesting that no contamination was present within the
samples. The modified CTAB extraction method was found to perform the best in
extracting total DNA (ng/mg) from mussel hinge ligament tissue when compared to the
other three methods. These findings suggest that a CTAB extraction method and
potentially other chloroform-based extractions such as phenol-chloroform, may be best
suited for total genomic DNA extraction from museum and ancient specimens. The
interaction between extraction method and collection year was strongest between the
Modified CTAB extraction method and the 2013-2015 collection bout. This suggests
that the most recent collection could recover more genetic material than the historical
collections.
I hypothesize that the modified CTAB extraction method performed the best in
terms of isolating total DNA yield collection in comparison to the other methods
because the CTAB method did not rely on silicon binding like the other three methods
did. Because DNA obtained from museum specimens is expected to contain a high
degree of fragmentation, the fragments isolated from the ligament tissue were perhaps
too small and unable to bind to the magnetic beads or the silicon binding membrane.
Due to this inability to bind, some of the DNA fragments may have been washed away

21
and lost to the remainder of the extraction process. However, the modified CTAB
extraction was the only extraction method that did not rely on silicon binding of the
DNA fragments. This method might have worked best because the small/degraded
DNA fragments were able to survive the extraction process because they were never
filtered out by means of a binding column or beads.
4.2 Future Research and Goals
Now that a more optimized extraction method has been determined, future
research will be necessary to identify how much of the total DNA yield is genetic
material obtained from the host mussel and how much is eDNA from the surrounding
environment. Because DNA from museum specimens is expected to be fragmented,
traditional PCR methods are not normally successful in amplification. However, with
recent molecular advancements, PCR-free target capture methods have been developed
and shown to be successful in sequencing DNA by using high throughput sequencing
methods, even from museum specimens with DNA of low molecular weight (Sproul &
Maddison 2013). These methods will be implemented in future research projects
specifically by using MyBaits, a targeted molecular probe approach, to perform
targeted gene enrichment. This targeted probe approach generally works by utilizing
small starting quantities of DNA and targeting only a specific region of the DNA for
enrichment through NGS. This is completed through the hybridization of target DNA
using many customized and complementary biotinylated RNA baits (MYcroarray,
The Oligo Library Company™) and can enable researchers to sequence only desired
portions of the DNA while disregarding other DNA which could cloud analysis. A
variety of markers will be designed for Cyprogenia stegaria and other freshwater
22
mussels as well as for other aquatic organisms such as; fish, crayfish, and insects, that
are anticipated to be present in the same environment as the mussels. Then the eDNA
from these aquatic organisms can be extracted from the mussel hinge ligament tissue.
Despite the presence of diverse communities comprised of freshwater
invertebrates, the overall genetic diversity of many mussel species is still poorly
understood (Geist and Kuehn 2005). The genetic information derived from a targeted
probe approach can help to alleviate this lack of genetic knowledge by identifying
cryptic diversity in mussels and other aquatic organisms in the environment. These
targeted approaches can provide genetic data that can be used in a variety of ways such
as; recreating historical ecosystems and aiding in conservation management programs.
Studies using genetic markers, such as the COI marker, have been used to establish
presence of genetic diversity and additionally facilitated discovery of important
haplotypes in other freshwater fauna while also establishing an important basis for
conservation status (Helms et al., 2014). Identifying how ecosystems, and counterparts
of ecosystems, have responded to environmental disturbances and stressors in the past,
can also provide an insight on how they may respond to future environmental
disruptions. The genetic information that can be derived from historical mussel shells
can be used to create phylogenies showing patterns of evolutionary ecological processes
for both freshwater mussels and their community counterparts. Therefore, by using
genetic data to reconstruct historical ecosystems, data can be collected to predict the
stability, resilience, and potential fluctuations that an ecosystem might encounter in the
future and, moreover, used for management and restoration projects for current
environments in need (Barak et al., 2016).

23
Using freshwater mussel shells as DNA reservoirs could open many
opportunities for biologists expanding across many scientific fields interested in
answering some of the missing genetic and evolutionary components of freshwater
mussel history. Now, a more optimized DNA extraction method used for obtaining the
fragile DNA from museum specimens can aide scientists in the identification process of
individuals and could reveal unknown biodiversity within the aquatic community.
Museums full of historical shells can be used to obtain both DNA from the individual
while also searching for eDNA released from organisms in the surrounding
environment. Acquiring eDNA from museum specimens could facilitate biological
studies focused on the reconstruction of ancient and historical ecosystems, and this
information can be applied to perfecting management strategies for current
communities. This optimized method will enable scientists to use mussel shells as DNA
time-capsules to obtain optimal DNA from the host specimen and other potential eDNA
sources simultaneously. This genetic information that can be obtained from the hinge
ligament can provide a snapshot of aquatic fauna that was present in the same
ecosystem as the mussel, which will allow scientists to rebuild entire historic
communities from shell material and instill a deeper knowledge in what counterparts are
necessary for conservation of current aquatic ecosystems.
4.3 Special Notes
To improve upon the “Breakdown Steps” methodology of this research, some
additional options for chemical and mechanical lysing may be considered. A more
efficient way of grinding ligament tissue into a powdered sample by use of a sterile and
DNA-free homogenizer or grinding tool may be necessary. If the tissue is unable to be

24
ground into a powdered sample and must be filtered through a polyethylene
microcentrifuge tube, weighing the particulates is suggested for maximum accuracy
when standardizing starting tissue weight into the total DNA obtained. Also, longer
EDTA soaks may necessary to release more DNA molecules into the aqueous sample.
Extended EDTA soaks are commonly used for the DNA extraction from hard and
calcified materials such as bone and teeth (Cho et al., 2010; Higgins et al., 2014).
Additionally, smaller elution volumes for each extraction method could be implemented
to obtain a higher DNA concentration. Furthermore, researchers interested in already
processed samples could use ethanol precipitation to re-concentrate DNA that was
eluted into larger volumes.

25
APPENDICES
26
APPENDIX A:
Figures

27
Figure 1. Representative shells of Cyprogenia stegaria
Figure 2. Hinge ligament from a representative Cyprogenia stegaria shell

28
Figure 3. Boxplot comparing DNA extraction methods and total DNA yield (Factorial
ANOVA). Modified CTAB extraction is the only extraction method found to be
statistically different (a) from the other three methods, which are not statistically
different from each other (b).

29
Figure 4. Boxplot comparing collection year and total DNA yield (Factorial ANOVA).
The 2013-2015 recent collection is the only collection bout found to be statistically
different (a) from the other two collection bouts which are not statistically different
from each other (b).

30
Figure 5. Interaction line graph comparing the interaction between the collection year
and the extraction method on the total DNA yield. Collection year 1984: (1984-1986),
collection year 1990: (1990-1995), collection year 2013: (2013-2015). The Modified
CTAB extraction has a strong correlation with the most recent collection bout 2013-
2015.
31
Figure 6. Tukey’s Multiple Comparison of Means in extraction method using 95%
Family-wise Confidence level. C (Modified CTAB), D (DNeasy), M (MagJET), G
(GeneClean). The only three extractions that do not contain a 0 in the interval use
Modified CTAB extraction method.

32
APPENDIX B:
Tables
33
Table 1. General Information for Cyprogenia stegaria Specimens
EKU # Col Yr County, State Lat Lon Extraction
430.1 1984 Pendleton Co., KY NA NA MagJET
439.1 1984 Pendleton Co., KY NA NA CTAB
439.2 1984 Pendleton Co., KY NA NA DNeasy
327.1 1986 Pendleton Co., KY 38.789345 -84.367856 DNeasy
327.3 1986 Pendleton Co., KY 38.789345 -84.367856 GeneClean
327.4 1986 Pendleton Co., KY 38.789345 -84.367856 CTAB
327.5 1986 Pendleton Co., KY 38.789345 -84.367856 MagJET
327.6 1986 Pendleton Co., KY 38.789345 -84.367856 DNeasy
814.1 1986 Pendleton Co., KY 38.789345 -84.367856 GeneClean
814.2 1986 Pendleton Co., KY 38.789345 -84.367856 CTAB
587.1 1990 Campbell Co., KY 38.866439 -84.45229 GeneClean
587.2 1990 Campbell Co., KY 38.866439 -84.45229 CTAB
587.3 1990 Campbell Co., KY 38.866439 -84.45229 MagJET
587.4 1990 Campbell Co., KY 38.866439 -84.45229 DNeasy
587.5 1990 Campbell Co., KY 38.866439 -84.45229 GeneClean
587.6 1990 Campbell Co., KY 38.866439 -84.45229 CTAB
587.7 1990 Campbell Co., KY 38.866439 -84.45229 MagJET
587.8 1990 Campbell Co., KY 38.866439 -84.45229 DNeasy
587.9 1990 Campbell Co., KY 38.866439 -84.45229 GeneClean
587.10 1990 Campbell Co., KY 38.866439 -84.45229 CTAB
587.11 1990 Campbell Co., KY 38.866439 -84.45229 MagJET
587.12 1990 Campbell Co., KY 38.866439 -84.45229 DNeasy
570.1 1991 Montgomery Co., KY 38.173320 -83.89549 DNeasy
570.2 1991 Montgomery Co., KY 38.173320 -83.89549 MagJET
570.3 1991 Montgomery Co., KY 38.173320 -83.89549 GeneClean
570.4 1991 Montgomery Co., KY 38.173320 -83.89549 CTAB
738.1 1995 Pendleton Co., KY 38.789345 -84.367856 GeneClean
738.2 1995 Pendleton Co., KY 38.789345 -84.367856 MagJet
2013.1 2013 Pendleton Co., KY 38.789345 -84.367856 DNeasy
2013.2 2013 Pendleton Co., KY 38.789345 -84.367856 GeneClean
2013.3 2013 Pendleton Co., KY 38.789345 -84.367856 CTAB
2013.5 2013 Pendleton Co., KY 38.789345 -84.367856 MagJET
2013.6 2013 Pendleton Co., KY 38.789345 -84.367856 DNeasy
2015.1 2015 Pendleton Co., KY 38.789345 -84.367856 GeneClean
2015.2 2015 Pendleton Co., KY 38.789345 -84.367856 CTAB
2015.3 2015 Pendleton Co., KY 38.789345 -84.367856 MagJET
2015.4 2015 Pendleton Co., KY 38.789345 -84.367856 DNeasy
2015.5 2015 Pendleton Co., KY 38.789345 -84.367856 GeneClean
2015.6 2015 Pendleton Co., KY 38.789345 -84.367856 CTAB
2015.7 2015 Pendleton Co., KY 38.789345 -84.367856 MagJET

34
Table 2. Total DNA yield (ng/mg) and 260/280 and 260/230 Ratios*
*DNA Yield (ng/µl) measured using Qubit and 260/280 and 260/230 ratios measured
using Nanodrop
Sample
#
Starting
Tissue
Weight (mg)
DNA
Yield
(ng/µl)
DNA
Yield x
100 µl
Total DNA
Yield
(ng/mg)
260/280
Ratio
260/230
Ratio
327.1 101.4 0.3090 30.90 0.3047 1.69 0.13
327.3 217.1 0.0540 5.40 0.0249 1.19 1.46 327.4 163.4 2.3401 234 1.4321 1.64 0.67
327.5 72.6 0.0220 2.20 0.0303 1.31 0.21
327.6 122.0 0.3960 39.60 0.3246 1.15 0.63
430.1 201.7 0 0 0 5.71 0.19
439.1 15.0 1.4012 140 9.3333 2.43 0.15 439.2 14.7 0.0304 3.040 0.2068 2.24 0.24
570.1 31.8 0.0481 4.80 0.1509 3.05 0.10
570.2 108.8 0.0422 4.20 0.0386 2.31 0.46
570.3 91.0 0 0 0 1.99 0.46
570.4 80.4 0.728 72.8 0.9055 2.57 0.11 587.1 10.3 0.0324 3.24 0.3145 2.30 0.39
587.2 8.9 0.0248 2.48 0.2786 2.48 0.14
587.3 35.6 0.1012 10.1 0.2837 1.34 0.59
587.4 49.5 0.1113 11.1 0.2242 4.82 0.02
587.5 50.3 0.0332 3.32 0.0660 1.80 0.04 587.6 33.5 0.2942 29.4 0.8776 2.27 0.13
587.8 14.1 0.1431 14.3 1.0141 1.59 0.47
587.9 38.9 0 0 0 1.45 0.10
587.10 112.3 0.4520 45.2 0.4025 1.38 0.58
587.11 5.5 0.0716 7.16 1.3018 1.60 0.52 587.12 70.3 0.0516 5.16 0.07339 1.16 0.61
738.1 187.0 0.2650 26.50 0.1417 1.36 0.42
814.1 27.7 0 0 0 1.58 0.24
814.2 133.4 0.7601 76 0.5697 1.63 0.62
2013.1 3.5 0 0 0 76.46 0.07 2013.2 30.0 0.0320 3.20 0.1066 1.5 0.12
2013.3 11.6 2.0100 201 17.3275 2.36 0.13
2013.6 60.2 0 0 0 2.68 0.03
2015.1 198.5 0.1750 17.50 0.0881 1.32 0.49
2015.2 1.4 0.1640 16.40 11.7142 2.27 0.15 2015.3 34.4 0.2750 27.50 0.7994 1.36 0.61
2015.4 6.4 0 0 0 8.86 0.09
2015.5 14.4 0 0 0 1.82 0.04
2015.6 13.0 0.6602 66 5.0769 2.53 0.11
2015.7 14.4 0.0348 3.48 0.2416 1.39 0.49
35
Table 3. Analysis of Variance Table Reporting F-Statistics for Collection Year,
Extraction Method, and Interaction (Factorial ANOVA)
Degrees of
Freedom
F-value P-value
Collection Year
Extraction Method
Interaction
2
3
6
5.7629
16.9073
6.4392
8.74 x 10⁻³
3.29 x 10⁻⁶
3.36 x 10⁻⁴
Residuals 25
Table 4. Tukey Multiple Comparisons of only Significant Means for Extraction Method
(95% Family-wise Confidence Level)
Extraction Method Lower Limit Upper Limit P-value
CTAB-DNeasy
GeneClean-CTAB
MagJET-CTAB
0.6043
-1.7651
-1.6613
1.6793
-0.6901
-0.4768
2.43 x 10⁻⁵
1.0 x 10⁻⁵
2.5 x 10⁻⁴
Table 5. Tukey Multiple Comparisons of only Significant Means for Collection Year
(95% Family-wise Confidence Level)
Collection Year Lower Limit Upper Limit P-value
1990-2013 0.1527 1.0053 6.44 x 10⁻³
Table 6. Tukey Multiple Comparisons of only Significant Means for Interaction (95%
Family-wise Confidence Level)
Interaction Type Lower Limit Upper Limit P-value
2013,CTAB:1984,DNE
2013,CTAB:1990,DNE
2013,CTAB:2013,DNE
2013,CTAB:1984,CTAB
2013,CTAB:1990,CTAB
1984,GC:2013,CTAB
1990, GC:2013,CTAB
2013, GC:2013,CTAB
1984, MJ:2013,CTAB
1990, MJ:2013,CTAB
2013, MJ:2013,CTAB
1.1962
1.2495
1.3711
0.2248
1.1131
-4.0764
-3.7316
-3.8899
-4.0745
-3.6537
-3.7916
3.7589
3.6467
3.9338
2.7876
3.5103
-1.2112
-1.4394
-1.3272
-1.2093
-1.0910
-0.9264
1.54 x 10⁻⁵
6.16 x 10⁻⁶
4.89 x 10⁻⁶
1.18 x 10⁻²
1.61 x 10⁻⁵
3.29 x 10⁻⁵
1.06 x 10⁻⁶
6.25 x 10⁻⁶
3.33 x 10⁻⁵
3.13 x 10⁻⁵
1.87 x 10⁻⁴
CTAB: Modified CTAB, DNE: DNeasy, GC: GeneClean, MG: MagJET
36
LITERATURE CITED
Baker, F. C. (1921). “Preparing Collections of the Mollusca for Exhibition and Study.”
American Microscopical Society 40(1): 31–46. doi: 10.2307/3221953
Barak, R. S., Hipp, A. L., Cavender-Bares, J., Pearse, W. D., Hotchkiss, S. C., Lynch,
E. A., Callaway, J. C., Calcote, R., Larkin, D. J. (2016). “Taking the Long View:
Integrating Recorded, Archeological, Paleological and Evolutionary Data into
Ecological Restoration.” Internal Journal of Plant Sciences. 177(1): 90–102. doi:
10.1086/683394
Besnard, G., Christin, P., Malé, P. G., Lhuillier, E., Lauzeral, C., Coissac, E., &
Vorontsova, M. S. (2014). “From Museums to Genomics: Old Herbarium
Specimens Shed Light on a C3 to C4 Transition.” Journal of Experimental Botany
65(22): 6711–21. doi:10.1093/jxb/eru395
Blaimer, B. B., Lloyd, M. W., Guillory, W. X., & Brady, S. G. (2016). “Sequence
Capture and Phylogenetic Utility of Genomic Ultraconserved Elements Obtained
from Pinned Insect Specimens.” PLoS ONE 11(8): 1–20.
doi:10.1371/journal.pone.0161531
Burrell, A. S., Disotell, T. R., & Bergey, C. M. (2016). “The Use of Museum
Specimens with High-Throughput DNA Sequencers.” Journal of Human Evolution
0: 35–44. doi:10.1016/j.jhevol.2014.10.015
Campbell, D. C., Serb, J. M., Buhay, J. E., Roe, K. J., Minton, R. L., & Lydeard, C.
(2005). “Phylogeny of North American Amblemines (Bivalvia, Unionoida):
Prodigious Polyphyly Proves Pervasive across Genera.” Invertebrate Biology
124(2): 131–64. doi: 10.1111/j.1744-7410.2005.00015.x.
Cho, A., Suzuki, S., Hatakeyama, J., Haruyama, N., & Kulkarni, A. B. (2010). “A
Method for Rapid Demineralization of Teeth and Bones.” The Open Dentistry
Journal. 21(4): 23–29. doi: 1874-2106/10
Chong, J. P., Harris, J. L., & Roe, K. J. (2016). “Incongruence between mtDNA and
Nuclear Data in the Freshwater Mussel Genus Cyprogenia (Bivalvia: Unionidae)
and Its Impact on Species Delineation.” Ecology and Evolution 6(8): 2439–52. doi: 10.1002/ece3.2071
37
Dabney, J., Meyer, J., & Paabo, S. (2013). “Ancient DNA Damage.” Cold Spring
Harbor Perspectives Biology: 1–7. doi: 10.1101/cshperspect.a012567
Doherty, S., Gosling, E., & Was, A. (2007). “Bivalve Ligament — a New Source of
DNA for Historical Studies.” Aquatic Biology 1(1): 161–65. doi: 10.3354/ab00020
Fritts, A. K., Fritts, M. W., Hagg, W. R., DeBoer, J. A., Casper, A. F. (2017). “Science
of the Total Environment Freshwater Mussel Shells ( Unionidae ) Chronicle
Changes in a North American River over the Past 1000 Years.” Science of the
Total Environment 575: 199–206. doi: 10.1016/j.scitotenv.2016.09.225
Geist, J., & Kuehn, R. (2005.) “Genetic Diversity and Differentiation of Central
European Freshwater Pearl Mussel (Margaritifera Margaritifera L .) Populations:
Implications for Conservation and Management.” Molecular Ecology 14(1): 425–
39. doi: 10.1111/j.1365-294X.2004.02420.x
Geist, J., Wunderlich, H., & Kuehn, R. (2008.) “Use of Mollusc Shells for DNA-Based
Molecular Analyses.” Journal of Molluscan Studies 74(4): 337–43.
doi:10.1093/mollus/eyn025
Geist, J. (2010). “Strategies for the Conservation of Endangered Freshwater Pearl
Mussels (Margaritifera Margaritifera L.): A Synthesis of Conservation Genetics
and Ecology.” Hydrobiologia 644(1): 69–88. doi: 10.1007/s10750-010-0190-2
Haag, W. R. & Warren, M. L. (1998) Role of ecological factors and reproductive
strategies in structuring freshwater mussel communities. Canadian Journal of
Fisheries and Aquatic Sciences 55(19): 297–306. doi: 10.1139/f97-210
Haag, W. R. (2012). North American Freshwater Mussels: Natural History, Ecology,
and Conservation. New York, NY: Cambridge University Press. ISBN: 978-0-521-
19938-4
Haag, W. R., & Williams, J. D. (2014). “Biodiversity on the Brink: An Assessment of
Conservation Strategies for North American Freshwater Mussels.” Hydrobiologia
735(1): 45–60. doi: 10.1007/s10750-013-1524-7
Hawkins, M. T. R., Leonard, J. A., Helgan, K. M., McDonough, M. M., Rockwood, L.
L., Maldonado, J. E. (2016). “Evolutionary History of Endemic Sulawesi Squirrels
Constructed from UCEs and Mitogenomes Sequenced from Museum Specimens.”
BMC Evolutionary Biology 16(1): 1-16. doi: 10.1186/s12862-016-0650-z
38
Helms, B. S., Suciu, S. K., Vaught, R. C., & Santos, S. R. (2015). “Cryptic Diversity
within Two Endemic Crayfish Species of the Southeastern US Revealed by
Molecular Genetics and Geometric Morphometrics.” Hydrobiologia 755(1) :283–
298. doi: 10.1007/s10750-015-2311-4
Higgins, D., Kaidonis, J, Townsend, G., & Austin, J. J. (2014). “Evaluation of Carrier
RNA and Low Volume Demineralization for Recovery of Nuclear DNA from
Human Teeth.” Forensic Science, Medicine and Pathology 10(1): 56–61. doi:
10.1007/s12024-013-9519-2
Howard, J. K., & Cuffey, K. M. (2006). “The Functional Role of Native Freshwater
Mussels in the Fluvial Benthic Environment.” Freshwater Biology 51(3): 460–474.
doi: 10.1111/j.1365-2427.2005.01507.x.
Inoue, K., Hayes, D. M., Harris, J. L., & Christian, A. D. (2013). “Phylogenetic and
Morphometric Analyses Reveal Ecophenotypic Plasticity in Freshwater Mussels
Obovaria Jacksoniana and Villosa Arkansasensis (Bivalvia: Unionidae).” Ecology
and Evolution 3(8): 2670–2683. doi: 10.1002/ece3.649
Jones, D. S. (1983). “Sclerochronology: Reading the Record of the Molluscan Shell:
Annual Growth Increments in the Shells of Bivalve Molluscs Record Marine
Climatic Changes and Reveal Surprising Longevity.” American Scientist 71(4):
384–91. URL: http://www.jstor.org/stable/27852138
Jones, T. W., & Neves, R. J. (2002). “Life History and Propagation of the Endangered
Fanshell Pearlymussel , Cyprogenia Stegaria Rafinesque (Bivalvia : Unionidae).”
Journal of the North American Benthological Society 21(1): 76–88. URL:
http://www.jstor.org/stable/1468301
Jones, D. S, & Quitmyer, I. R. (1996). “Marking Time with Bivalve Shells: Oxygen
Isotopes and Season of Annual Increment Formation.” Palaios 11(4): 340–346.
doi: 10.2307/3515244.
Lydeard, C., Cowie, R. H., Ponder, W. F., Bogan, A. E., Bouchet, P., Clark, S. A.,…
Thompson, F. G. (2004). “The Global Decline of Nonmarine Mollusks.”
BioScience 54(4): 321–330. doi: 10.1641/0006-3568
39
Makhrov, A., Bespalaya, J., Bolotov, I., Vikhrev, I., Gofarov, M., Alekseeva, Y., &
Zotin, A. (2014). “Historical Geography of Pearl Harvesting and Current Status of
Populations of Freshwater Pearl Mussel Margaritifera Margaritifera (L.) in the
Western Part of Northern European Russia.” Hydrobiologia 735(1): 149–59. doi:
10.1007/s10750-013-1546-1
McCormack, J. E., Tsai, W. L. E., & Faircloth, B. C. (2016). “Sequence Capture of
Ultraconserved Elements from Bird Museum Specimens.” Molecular Ecology
Resources 16(5): 1189–1203. doi: 10.1111/1755-0998.12466
Mock, K. E., Brim Box, J. C., Chong, J. P., Howard, J. K., Nez, D. A., Wolf, D.,
Gardner, R. S. (2010). “Genetic Structuring in the Freshwater Mussel Anodonta
Corresponds with Major Hydrologic Basins in the Western United States.”
Molecular Ecology 19(3): 569–91. doi: 10.1111/j.1365-294X.2009.04468.x
Nalepa, T. F., Gardner W. S., & Malczyk, J. M. (1991). “Phosphorus Cycling by
Mussels (Unionidae : Bivalvia) in Lake St. Clair.” Hydrobiologia 219(1): 239–50.
doi: 10.1007/BF00024758
Ortmann, A. E. (1918). The nayades (freshwater mussels) of the upper Tennessee
drainage with notes on synonymy and distribution. Proceedings of the American
Philosophical Society 57:521–626. URL: http://www.jstor.org/stable/984465
Ortmann, A. E. (1919). A monograph of the naiades of Pennsylvania, Part III.
Systematic account of the genera and species. Memoirs of the Carnegie Museum
8:1–384. URL: http://dx.dio.org/10.5962/bhl.title.10794
Pedersen, M. W., Overballe-Petersen, S., Ermini, L., Sarkissan, C. D., Haile, J.,
Hellstrom, M.,…Willerslev, E. (2014). “Ancient and Modern Environmental
DNA.” Philosophical Transactions 370(1): 1–11. doi: 10.1098/rstb.2013.0383
Prendergast, A. L., Stevens, R. E., Hill, E. A., Barker, G.W., Hunt, C., O’Connell, T.C.
(2015). “Carbon Isotope Signatures from Land Snail Shells: Implications for
Palaeovegetation Reconstruction in the Eastern Mediterranean.” Quaternary
International 1:1–10. doi: 10.1016/j.quaint.2014.12.053
R Core Team (2016). R: A language and environment for statistical computing. R
Foundation for Statistical Computing, Vienna, Austria. URL: https://www.R-
project.org/
40
Sarkissian, C. D., Pichereau, V., Dupont, C., Ilsøe, P. C., Perrigault, M., Butler, P.,…
Orlando, L. (2017). “Ancient DNA Analysis Identifies Marine Mollusc Shells as
New Metagenomic Archives of the Past.” Molecular Ecology Resources 1–3. doi:
10.1111/1755-0998.12679
Schöne, B. R. Oschmann, W., Rössler, J., Castro, A. D. F., Houk, S. D., Kröncke
(2003). “North Atlantic Oscillation Dynamics Recorded in Shells of a Long-Lived
Bivalve Mollusk.” Geology 31(12): 1037–40. doi: 10.1130/G20013.1
Schwalb, A. N, Morris, T. J., & Mandrak, N. E. (2013). “Distribution of Unionid
Freshwater Host Fishes on a Regional Scale.” Diversity Distributions 19(1): 446–
54. doi: 10.1111/j.1472-4642.2012.00940.x
Serb, J. M. (2006). “Discovery of Genetically Distinct Sympatric Lineages in the
Freshwater Mussel Cyprogenia Aberti (Bivalvia: Unionidae).” Journal of
Molluscan Studies 72(4): 425–34. doi:10.1093/mollus/eyl021
Serb, J. M, & Barnhart, M. C. (2008). “Congruence and Conflict Between Molecular
and Reproductive Characters When Assessing Biological Diversity in the Western
Fanshell Cyprogenia Aberti (Bivalvia, Unionidae).” Annals of the Missouri
Botanical Garden 95(2): 248–61. doi: 10.3417/2006103
Smith, R. W. A., Monroe, C., & Bolnick, D. A. (2015). “Detection of Cytosine
Methylation in Ancient DNA from Five Native American Populations Using
Bisulfite Sequencing.” PLoS ONE 10(5): 1–23. doi:10.1371/journal.pone.0125344
Sproul, J. S., & Maddison, D. R. (2013). “Sequencing Historical Speciments:
Successful Preparation of Small Specimens with Low Amounts of Degraded
DNA.” Molecular Ecology Resources 541(1): 0–34. doi:10.3837/tiis.0000.00.000
Strayer, D. L., Downing, J. A., Haag, W. R., King, T. L., Layzer, J. B., Newton, T., &
Nichols, S. J. (2004). “Changing Perspectives on Pearly Mussels, North
American’s Most Imperiled Animals.” BioScience 54(5): 429–439. doi:
10.1641/0006-3568
Thermoscientific. (2009). “T042‐Technical Bulletin: 260/280 and 260/230 Ratios”
(2009, March). Retrieved from URL: https://www.researchgate.net/
Ubukata, T. (2003). “A Theoretical Morphologic Analysis of Bivalve Ligaments.”
Paleobiology 29(3): 369–80. doi: 10.1666/0094-8373
41
USFWS. (1991). “Fanshell (Cyprogenia stegaria (= C. irrorata)) recovery plan.” US
Fish and Wildlife Service, Atlanta, Georgia. (Available from: Fish and Wildlife
Reference Service, Suite 110, 5430 Grosvenor Lane, Bethesda, Maryland 20814
USA.)
USFWS. (2016). “Fanshell: Cyprogenia stegaria.” (2016, November 2). Retrieved from
URL: https://www.fws.gov/southeast/wildlife/mussels/fanshell/
Vaughn, C. C., Gido, K. B., & Spooner, D. E. (2004). “Ecosystem Processes Performed
by Unionid Mussels in Stream Mesocosms: Species Roles and Effects of
Abundance.” Hydrobiologia 527(1): 35–47. doi :
10.1023/B:HYDR.0000043180.30420.00
Villanea, F. A., Parent, C. E.,& Kemp, B. M. (2016). "Reviving Gala´ pagos snails:
ancient DNA extraction and amplification from shells of probably extinct endemic
land snails" Molluscan Studies 82(1): 449–456. doi: 10.1093/mollus/eyw011
Walker, K. F., Jones H. A., & Klunzinger, M. W. (2014). “Bivalves in a Bottleneck:
Taxonomy, Phylogeography and Conservation of Freshwater Mussels (Bivalvia:
Unionoida) in Australasia.” Hydrobiologia 735(1): 61–79. doi: 10.1007/s10750-
013-1522-9
Williams, J. D., Warren, M. L. Jr.,Cummings, K. S., Harris, J. L., & Neves, R. J.
(1993). “Conservation Status of Freshwater Mussels of the United States and
Canada.” Fisheries 18(9): 6–22. doi: 10.1577/1548-8446
Yanes, Y., Romanek, C. S., Delgado, A., Brant, H. A., Noakes, J. E., Alonso, M. R., &
Ibáñez, M. (2009). “Oxygen and Carbon Stable Isotopes of Modern Land Snail
Shells as Environmental Indicators from a Low-Latitude Oceanic Island.”
Geochimica et Cosmochimica Acta 73(14): 4077–99. doi:
10.1016/j.gca.2009.04.021
Zieritz, A., & Aldridge, D. C. (2009). “Identification of ecophenotypic trends within
three European freshwater mussel species (Bivalvia: Unionoida) using traditional
and modern morphometric techniques.” Biological Journal of the Linnean Society
98(4): 814–825. doi: 10.1111/j.1095-8312.2009.01329.x