are magnet schools attracting all families equally ? naralys estevez ’06 cities, suburbs, and...
TRANSCRIPT
Are Magnet Schools Attracting All Families Equally?
Naralys Estevez ’06Cities, Suburbs, and Schools research project
at Trinity College, Hartford CT
http://www.trincoll.edu/depts/educ/css
July 18, 2005

Sheff and School Segregation
1996 Sheff vs. O’Neill ruled that that the state must desegregate schools in metropolitan Hartford to address educational inequalities

Sheff and School Segregation
1996 Sheff vs. O’Neill ruled that that the state must desegregate schools in metropolitan Hartford to address educational inequalities
Finding a remedy remains a challenge to this day

Magnet Schools as a Solution?
2003 Sheff settlement focused on inter-district magnet schools as a key desegregation remedy
Popular voluntary approach, with 19 magnet schools for 2005-06

Magnet Schools as a Solution?
2003 Sheff settlement focused on inter-district magnet schools as a key desegregation remedy
Popular voluntary approach, with 19 magnet schools for 2005-06
Not Pictured: MLC (Bloomfield), EHG & CT IB Acad (East Hartford), GPA (Manchester)
Learning Corridor

Magnet School Controversy
Magnet schools are designed to attract a special mix of students

Magnet School Controversy
Magnet schools are designed to attract a special mix of students
But critics charge that magnets “cream” the best students from neighborhood schools
- race
- socio-economic status
- achievement

Magnet School Controversy
Magnet schools are designed to attract a special mix of students
But critics charge that magnets “cream” the best students from neighborhood schools
- race
- socio-economic status
- achievement
Although designed to equalize society, magnet schools may create an unexpected second tier of inequality

Research Question
Are magnet schools attracting all families equally?

Research Question
Are magnet schools attracting all families equally?

Research Question
Are magnet schools attracting all families equally?
My study uses Geographic Information System (GIS) to conduct spatial analysis of the “creaming” controversy by using smaller geographic units of analysis.

Research Question
Are magnet schools attracting all families equally?
My study uses Geographic Information System (GIS) to conduct spatial analysis of the “creaming” controversy by using smaller geographic units of analysis.
GIS training funded by National Institute for Technology & Liberal Arts Education (NITLE) and Trinity College Academic Computing

Four Levels of Investigating Creaming1. Individual magnet school

Four Levels of Investigating Creaming1. Individual magnet school
2. Categories of inequalityRaceSocio-economic statusAchievement

Four Levels of Investigating Creaming1. Individual magnet school
2. Categories of inequalityRaceSocio-economic statusAchievement
3. Geographic unit of analysisSchool DistrictNeighborhood

Four Levels of Investigating Creaming1. Individual magnet school
2. Categories of inequalityRaceSocio-economic statusAchievement
3. Geographic unit of analysisSchool DistrictNeighborhood
4. Stages of magnet admissions processApplication (Which students apply?)Acceptance (Which applicants are accepted?)Enrollment (Which students actually enroll?)

Sample Statistical Test of Creaming

Sample Statistical Test of Creaming1. Individual magnet school
Montessori Magnet School (2000-2005)2. Categories of inequality
RaceSocio-economic statusAchievement
3. Geographic unit of analysisSchool DistrictNeighborhood
4. Stages of magnet admissions processApplication (Which students apply?)Acceptance (Which applicants are accepted?)Enrollment (Which students actually enroll?)

Sample Statistical Test of Creaming
District Enroll (Bloomfield 5yr)
Total White Students
Observed Percent
12,560 630 5%

Sample Statistical Test of Creaming
District Enroll (Bloomfield 5yr) MMS Applicants (Blmfd 5yr)
Total White Students Total White Applicants
Observed Percent Observ Pct
12,560 630 5% 105 8 7%

Sample Statistical Test of Creaming
District Enroll (Bloomfield 5yr) MMS Applicants (Blmfd 5yr)
Total White Students Total White Applicants
Observed Percent Observ Pct Expected
12,560 630 5% 105 8 7% 5.25

Sample Statistical Test of Creaming
District Enroll (Bloomfield 5yr) MMS Applicants (Blmfd 5yr)
Total White Students Total White Applicants
Observed Percent Observ Pct Expected
12,560 630 5% 105 8 7% 5.25
Calculate Chi-Square goodness of fit test to determine statistical significance
Chi-Square = 1.516 P>.05
Difference in percentage of White Bloomfield MMS applicants, compared to Whites in the district, is not statistically significant

Sample Statistical Test of Creaming
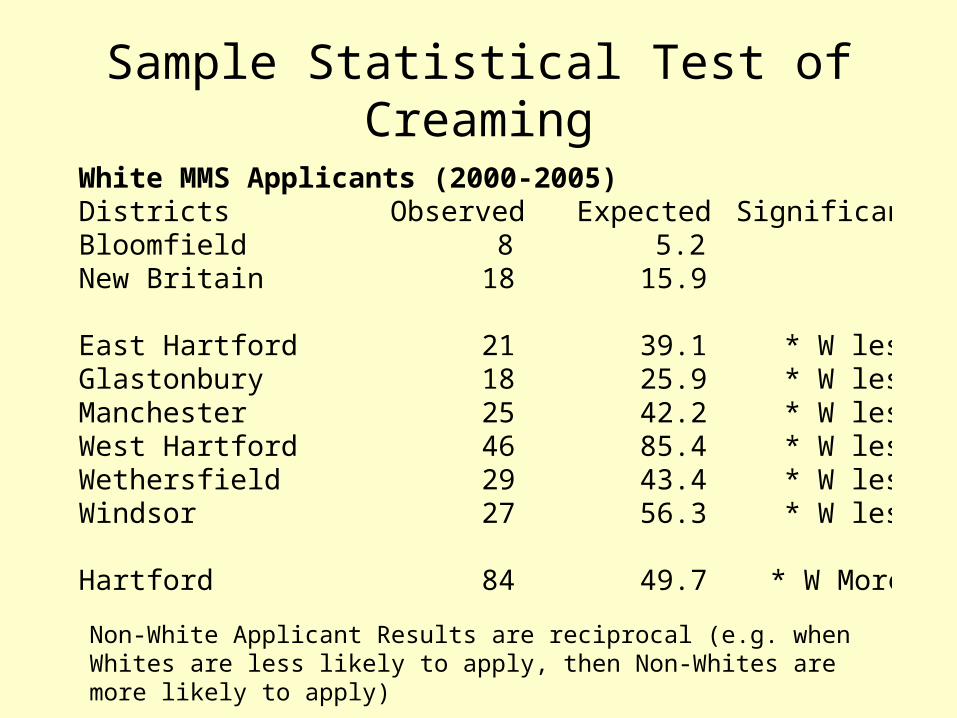
White MMS Applicants (2000-2005)Districts Observed Expected SignificanceBloomfield 8 5.2New Britain 18 15.9
East Hartford 21 39.1 * W lessGlastonbury 18 25.9 * W lessManchester 25 42.2 * W lessWest Hartford 46 85.4 * W lessWethersfield 29 43.4 * W lessWindsor 27 56.3 * W less
Hartford 84 49.7 * W More
Sample Statistical Test of Creaming
White MMS Applicants (2000-2005)Districts Observed Expected SignificanceBloomfield 8 5.2New Britain 18 15.9
East Hartford 21 39.1 * W lessGlastonbury 18 25.9 * W lessManchester 25 42.2 * W lessWest Hartford 46 85.4 * W lessWethersfield 29 43.4 * W lessWindsor 27 56.3 * W less
Hartford 84 49.7 * W More
Non-White Applicant Results are reciprocal (e.g. when Whites are less likely to apply, then Non-Whites are more likely to apply)

Purple = Significant
White Dots = White Students
< less likely to apply> more likely to apply
Significant Differences in MMS Applications and School District Enrollment, by Race, 2000-2005
Sample Statistical Test of Creaming

Future Statistical Tests

Future Statistical Tests1. Individual magnet school
2. Categories of inequality
RaceSocio-economic statusAchievement
3. Geographic unit of analysisSchool DistrictNeighborhood
4. Stages of magnet admissions processApplication (Which students apply?)Acceptance (Which applicants are accepted?)Enrollment (Which students actually enroll?)

Future Statistical Tests
3. Geographic unit of analysisSchool DistrictNeighborhood
Census Block Group = 1500 residents
With Census 2000 demographic data for race, SES, educational attainment
Requires magnet applicant addresses

Future Statistical Tests
Limitations and Factors to Consider

Future Statistical Tests
Limitations and Factors to ConsiderCensus data – only available every decade
Application form data – some magnets do not ask raceApplication process
– depends upon marketing (varies by magnet management and individual school)
- student eligibility lottery requirements (eg GHAA audition)
- type of lottery system (open to all vs. selected districts only)Achievement analysis- Requires compiled CMT scores