are ireland's immigrants integrating into its labour market?
TRANSCRIPT
IZA DP No. 2838
Are Ireland’s Immigrants Integratinginto its Labour Market?
Alan BarrettDavid Duffy
DI
SC
US
SI
ON
PA
PE
R S
ER
IE
S
Forschungsinstitutzur Zukunft der ArbeitInstitute for the Studyof Labor
June 2007
Are Ireland’s Immigrants Integrating
into its Labour Market?
Alan Barrett Economic and Social Research Institute
and IZA
David Duffy Economic and Social Research Institute
Discussion Paper No. 2838 June 2007
IZA
P.O. Box 7240 53072 Bonn
Germany
Phone: +49-228-3894-0 Fax: +49-228-3894-180
E-mail: [email protected]
Any opinions expressed here are those of the author(s) and not those of the institute. Research disseminated by IZA may include views on policy, but the institute itself takes no institutional policy positions. The Institute for the Study of Labor (IZA) in Bonn is a local and virtual international research center and a place of communication between science, politics and business. IZA is an independent nonprofit company supported by Deutsche Post World Net. The center is associated with the University of Bonn and offers a stimulating research environment through its research networks, research support, and visitors and doctoral programs. IZA engages in (i) original and internationally competitive research in all fields of labor economics, (ii) development of policy concepts, and (iii) dissemination of research results and concepts to the interested public. IZA Discussion Papers often represent preliminary work and are circulated to encourage discussion. Citation of such a paper should account for its provisional character. A revised version may be available directly from the author.
IZA Discussion Paper No. 2838 June 2007
ABSTRACT
Are Ireland’s Immigrants Integrating into its Labour Market?*
Ireland has experienced a remarkable change in its migratory patterns in recent years and has moved from experiencing large-scale emigration to receiving significant inflows. In this paper, we use data from a nationally representative sample of immigrants and natives drawn in 2005 to assess the occupational attainment of immigrants in Ireland relative to natives. It is found that immigrants, on average, are less likely to be in high-level occupations controlling for factors such as age and education. When looked at by year of arrival, it appears as if immigrants who arrived more recently have lower occupational attainment relative to earlier arrivals, thereby suggesting a process of integration. However, a closer analysis shows that the observation of better occupational attainment for earlier arrivals can be explained by a change in the national origin mix of Ireland’s immigrants, with immigrants from the New Member States of the European Union having the lowest occupational attainment. Within national groups there is generally no clear evidence of improved occupational attainment over time. JEL Classification: J61 Keywords: immigrants, labour market integration, Ireland Corresponding author: Alan Barrett Economic and Social Research Institute Whitaker Square Sir John Rogerson’s Quay Dublin 2 Ireland E-mail: [email protected]
* We would like to acknowledge the helpful comments of John FitzGerald, David Jaeger, Brian Nolan, Philip O’Connell and participants at a seminar at the ESRI.
Are Ireland’s Immigrants Integrating into its Labour Market?
Section 1: Introduction
In his influential paper published in 1978, Chiswick appeared to show that the wages
of immigrants converged on those of natives as they spent longer in the host country.
Since then, the issue of immigrant integration in the labour market of their host
countries has received further attention (for example, Borjas 1985, and, more recently,
Amuedo-Dorantes and de la Rica, 2006). In this paper, we add to the literature by
exploring the issue in the context of one of the world’s new immigrant-receiving
countries, Ireland. Having undergone a rapid economic transformation in recent years,
Ireland has also seen a remarkable change in its migration patterns. From being a
country of emigrants, Ireland is now a recipient of significant inflows. This provides
migration researchers with a new laboratory to explore issues, including that of
integration.
While many studies show immigrants experiencing labour market disadvantages
relative to natives, this is unsurprising in the case of newly arrived immigrants. These
new arrivals may lack location-specific human capital such as language and
knowledge of the local labour market. Hence, it would be expected that their earlier
period in the host country would see them earning less or holding lower level jobs.
Concerns arise, however, for the immigrants themselves and for the host countries if
immigrants are unable to overcome these initial disadvantages. A failure to integrate
into the labour market, by which we mean that immigrants experience the same levels
of labour market success as comparable natives, can result in immigrants becoming an
excluded minority with implications for social cohesion. The persistence of
immigrants in lower paid and less skill-intensive occupations may also lead to a
productivity loss for the host economy.
We look at the issue of labour market integration by drawing on a large-scale
nationally representative sample of immigrants and natives in Ireland drawn in 2005.
As the data include information on the occupations of respondents, we use this as an
indicator of labour market position. As the data also include information identifying
immigrants and the year in which they arrived in Ireland, we are able to compare
labour market outcomes across immigrants and natives, and across immigrants by
2
year of arrival. We should note that although we have information on whether the
individuals are unemployed, we do not analyse the move between unemployment and
employment as another indicator of immigrant integration, as is done by Amuedo-
Dorantes and de la Rica (2006) and by Antecol et al (2003). The reason for this is that
immigrants in Ireland show no statistically significant differences in terms of
unemployment propensity relative to natives2. However, as will be seen below,
patterns of occupational attainment differ across immigrants and natives and across
different categories of immigrants.
While the data allow us to generate insights into labour market outcomes across
recent arrivals and earlier arrivals, we need to be cautious in interpreting any patterns.
As we are not using panel data we cannot tell, for example, if any patterns of
improved labour market outcomes are the result of integration, cohort effects or
selective out-migration. Repeated cross-sections can sometimes be used to construct
“synthetic cohorts” (see, for example, Borjas, 1987) but this is not possible with the
data used below. Although the data have been collected on a quarterly basis since
1997, information on the year of arrival of immigrants is only available to us for the
2005 Quarter 2 Survey. In spite of these limitations, the data do allow us to uncover a
number of interesting findings.
The paper is structured as follows. In Section 2, we discuss some important features
of Ireland’s recent experience of immigration by way of providing a context for the
subsequent analysis. In Section 3, we briefly set out some of the main papers on the
topic of immigrant integration and in particular a paper by Chiswick, Lee and Miller
et al (2005). Our analysis is based on the approach taken in that paper and so it is
useful to describe it. In Section 4 we describe the data and present the results. We
conclude in Section 5.
Section 2: Ireland’s Recent Immigration Experience
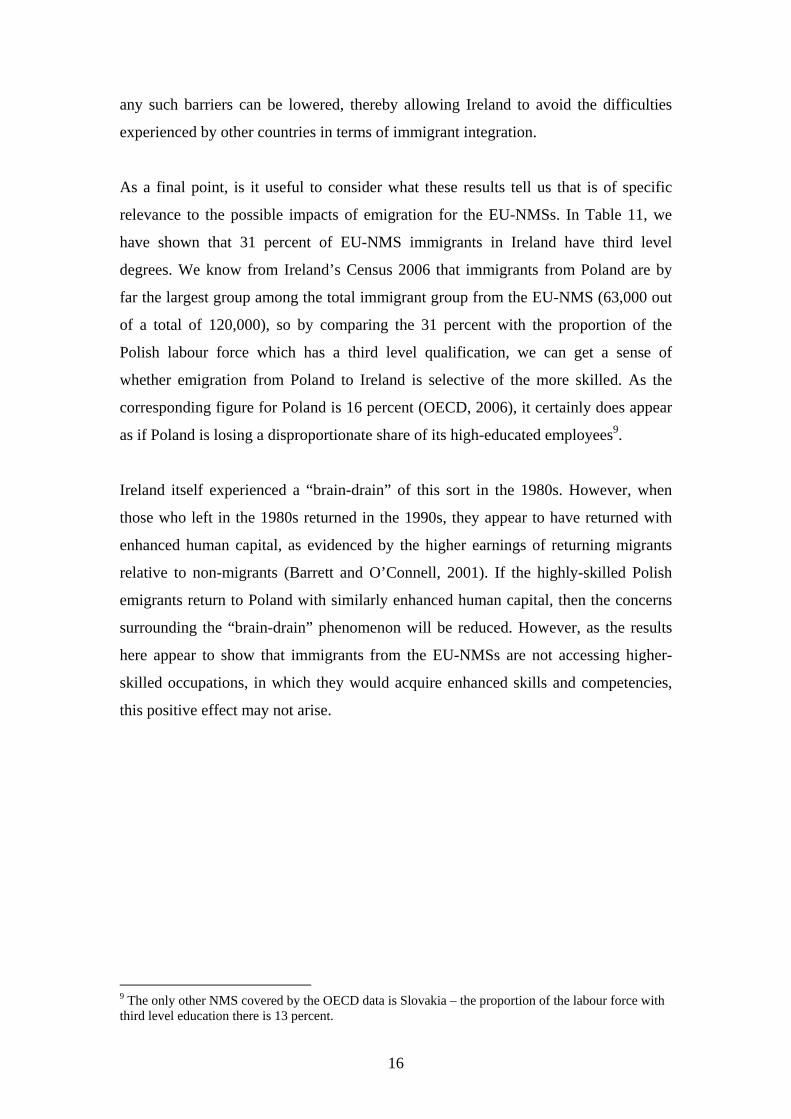
We will begin this brief review of Ireland’s recent migration experience by drawing
on Figure 1 which shows net inflows and outflows to and from Ireland over the last
2 This finding of there being no difference in the probability of being unemployed across immigrants and natives is interesting in itself. It suggests that Ireland is absorbing immigrants very successfully in terms of employment.
3
twenty years. A number of points can be distilled from the figure. As recently as the
late 1980s, Ireland was a country of emigration. As can be seen from the negative
flows in the figure, Ireland was losing over 40,000 of its population per annum in the
late 1980s. As the population at that time was about 3.5 million, population losses of
over 40,000 amounted to over 1 percent of the population. For the decade 1981 to
1991, the net outflow was over 200,000 or almost 6 percent of the population.
Figure 1 here
Around the mid-1990s, the economy of Ireland experienced a rapid turnaround and
began to experience the highest growth rates in Europe3. As a consequence of this, the
population outflows were reversed and net inflows began. Initially, the inflows were
made up of roughly equal proportions of non-Irish immigrants and former Irish
emigrants returning to Ireland. Since the mid-1990s these inflows have generally
increased and the national mix has shifted from being 50 percent Irish to being about
20 percent Irish. From 2004, an acceleration in the inflow has been seen due to the ten
New Member States of the EU (referred to hereafter as EU-NMS) being given full
access to the Irish labour market. In the year ended April 2006, 86,000 people arrived
in Ireland, with almost 40,000 of them being from the EU-NMS. Ireland was one of
only three existing members of the EU to allow full access to its labour market to the
EU’s new citizens from the date of accession. The other two were Sweden and the
UK.
As regards the administrative measures underpinning immigration into Ireland, there
are a number of strands. First, all citizens of EU countries (with the exception of
Bulgaria and Romania) are free to work in Ireland without restriction. Second, for
non-EU members, a work-permit system operates. In essence, if an employer can
show that no EU citizen is available to fill a vacancy, they can apply for a work
permit and can recruit a non-EU national4. Since the opening up of the labour market
to all EU citizens in 2004, the number of new work permits issued has fallen. For
example, in 2003 almost 22,000 new permits were issued. In 2006, this had fallen to 3 For an analysis of Ireland’s economic turnaround, see Walsh and Honohan (2002) 4 At the time of writing, a new system of admission was being legislated for which would operate along the lines of a “greencard” system for certain immigrants, typically the more highly skilled. However, this new system is not relevant for the immigrants analysed here as the data were collected in 2005.
4
6,300 and was a direct result of the government’s decision to balance the opening up
of the labour market to the New Member Sates with a more conservative approach to
work permit numbers. Refugees have full entitlements to work but this is not the case
for asylum seekers whose cases are being dealt with. They are generally not allowed
to work and so must rely on state transfers.
Existing research looking at the labour market characteristics of immigrants in Ireland
and their experiences has produced a number of insights. Ireland’s immigrant
population is a highly educated one, with the proportion of degree holders exceeding
that of the domestic population (Barrett et al, 2006; Minns, 2005). However, they do
not appear to be accessing jobs that fully reflect their education levels (Barrett et al,
2006) and appear to be earning significantly less than comparable natives (Barrett and
McCarthy, 2006). The findings with respect to poor labour market outcomes could
well be the result of the relatively recent arrival of most immigrants as they are likely
to be lacking location specific human capital such as language skills. None of these
papers have had access to data on the year of arrival for the immigrants and so none
have been able to shed any light on the issue of integration.
We noted in the Introduction that Ireland has become a new laboratory for the study
of migration. It is useful here, in the light of the discussion of the nature of
immigration into Ireland, to set out what makes Ireland of particular interest for
migration researchers. First, as inward migration into Ireland has occurred over a
period when the economy has been growing at an exceptionally high rate, the
economic conditions have been favourable for immigrant success in the labour
market. Second, as much of the immigration into Ireland has been from other
European countries, many of Ireland’s immigrants will not be subject to multiple
forms of possible discrimination such as those based on religion or skin colour. Both
of these factors should operate in a way that would see immigrants in Ireland doing
relatively well when compared to natives.
A third useful feature of immigration into Ireland is the concentration of Eastern
Europeans in the latest inflow. This allows us to generate insights into this new source
of population movements, namely from the new EU to the old EU. By generating
insights on who these new immigrants are and how they are performing in their host
5
countries, we can draw conclusions on the possible impacts of emigration from the
EU-NMS.
Section 3: Literature on Integration
Chiswick et al (2005) provide a useful framework in which to analyse immigrant
integration so we will set out the details. In their model, immigrants experience a “U-
shaped” pattern of occupational attainment. In moving between their last job in their
home country and the first job in the host country, immigrants are likely to experience
downward occupational mobility. As their skills are unlikely to be directly
transferable to the new setting, they may need to work in lower level occupations at
the point of their arrival in the host country. As time goes on, the immigrants will
acquire location-specific human capital and this will allow them to move up the
occupational ladder. In time, they may be able to move into an occupation at the same
level as the one they left. By plotting their occupational attainment over time, the U-
shape is seen.
According to Chiswick et al (2005), the pattern just described should be particularly
pronounced for high-skilled immigrants and for immigrants from countries where
skills are less readily transferable to the host. In the case of high-skill immigrants,
there is more room to drop down the occupational ladder when migrating and more
scope for upward mobility following migration, relative to less-skilled immigrants. In
the case of immigrants from countries with very different labour markets, the move
from one country to another is more likely to involve downward mobility but, as with
high-skilled immigrants, as location-specific human capital is acquired, upward
mobility is possible.
We should note that unlike Chiswick et al (2005), our data do not allow us to observe
immigrants before they migrate and neither do we have longitudinal data. As such, we
cannot test the hypotheses in the manner undertaken in the 2005 paper. Nonetheless,
as we have data on immigrants by year of arrival, we can think in terms of immigrant
outcomes differing according to the length of time spent in Ireland and explore how
they differ, for example, across skill groups. In so doing, we are mindful not to make
strong conclusions in respect of integration over time based our cross-sectional data as
other forces, such as selective out-migration, could be at work.
6
Chiswick et al (2005) find evidence of occupation integration for immigrants in
Australia. For example, those with higher levels of pre-immigration skills were found
to show greater improvements in occupational status, within a timeframe of three
years and six months. For Spain, Amuedo-Dorantes and de la Rica (2006) show that
immigrants from the EU do not display any occupational disadvantage relative to
natives, which appears supportive of the Chiswick et al (2005) hypotheses on
migration between similar countries. They also find evidence of integration among
other European immigrants and Latin Americans but not among African immigrants.
Green (1999) finds evidence of occupational mobility among immigrants to Canada
but the precise pattern of mobility was not consistent with a general pattern on
integration. Much of the mobility observed by Green occurred in the late 1980s but
not at other times. In addition, immigrants with different lengths of time in Canada
appeared to experience the same type of mobility in the late 1980s. This suggested to
Green that what was observed was a different reaction to economic events in the late
1980s for immigrants relative to natives. Many other studies have looked at the issue
of immigrant integration but through earnings as opposed to occupation. Among these
papers are Baker and Benjamin (1994) and Borjas (1985), both of which found little
evidence of integration.
Section 4: Data and Results
4(a) – Data
The data used in the analysis are from the Quarterly National Household Survey
(quarter 2 of 2005, referred to from here on as QNHS). The survey is undertaken by
Ireland’s official statistical agency, the Central Statistics Office (CSO). The main
purpose of the QNHS is to produce quarterly official information on labour market
variables such as employment, unemployment and participation. Throughout the year
3,000 households are surveyed each week; hence each quarterly sample contains
39,000 households5. The CSO make the micro-data available, although some of the
collected data is omitted or aggregated. The sample has over 91,000 observations,
which amounts to over 2 percent of the population. We only look at labour force
5 A full description of the sampling techniques can be found in CSO (2005).
7
participants in our analysis and so the dataset on which we conduct the analysis
contains just under 35,000 individuals.
Our next task is to set out precisely how we define “immigrants” and the groups of
“natives” against which we will compare them. We define immigrants in the
following way: people who describe their nationality as being other than Irish and
were not born in Ireland. We only look at immigrants who arrived in Ireland in 1995
or later so that our attention is focused on immigrants who arrived in the context of
Ireland’s changed economic fortunes. We compare this group with people who
describe themselves as Irish nationals and who say they were born here. This means
we omit Irish nationals who were born outside of Ireland6. These selections, along
with the omission of individuals for whom we do not have a complete set of data,
produce two sub-populations – 32,536 natives and 1,634 immigrants. The immigrants
are divided in five regional categories: UK, USA, EU-13 (i.e. the EU-15 less Ireland
the UK), the New Member States of the EU and “other”. Specific country identifiers
are not provided in the data, apart from the UK and the USA.
4(b) – Results (descriptive)
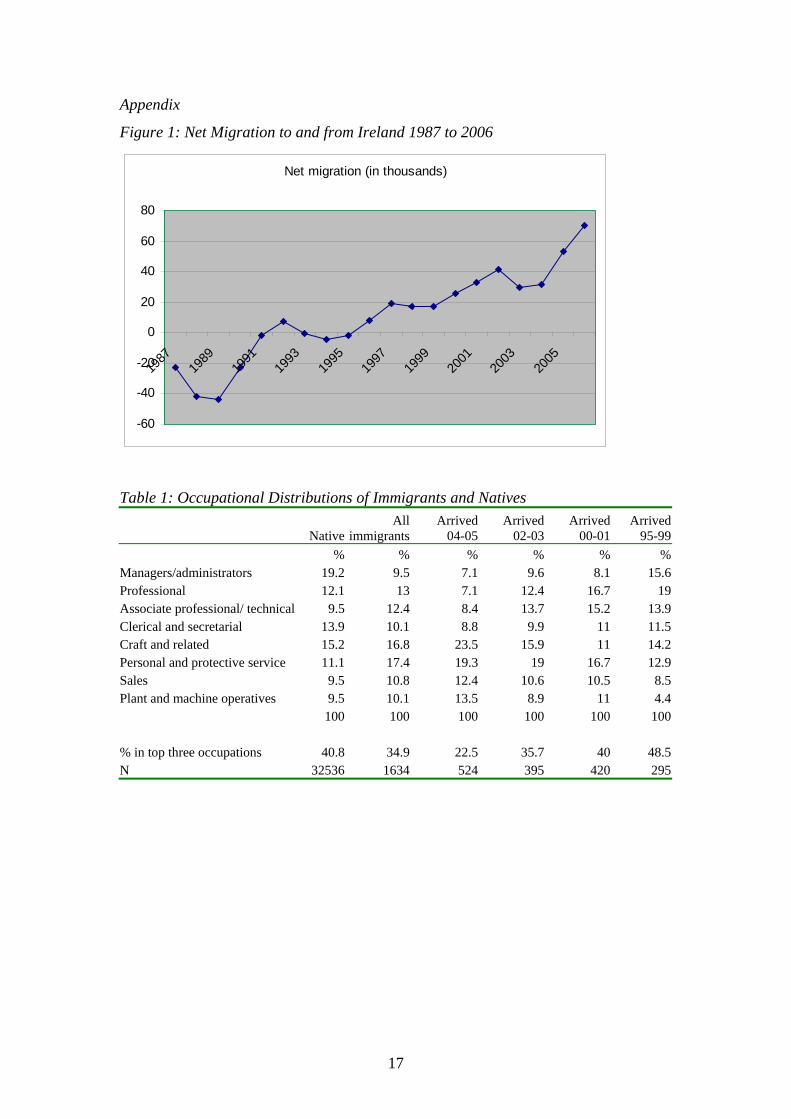
We begin our analysis of the occupational attainment of Ireland’s immigrants by
looking at the distribution of immigrants across occupational categories. In Table 1,
we show the distribution for all immigrants (who have arrived since 1995)
collectively and also by period of arrival. The distribution for the native population is
also shown. A number of interesting points emerge.
If we compare the distributions of all immigrants and natives we see that immigrants
are more heavily concentrated in the lower end of the distribution. While slightly over
40 percent of natives are in the top three occupational categories, the corresponding
figure for all immigrants is 35 percent. However, if we look across the immigrants
when they are grouped by year of arrival, a different picture emerges. The most
recently arrived immigrants show the lowest degree of concentration in the top three
6 Because of Ireland’s long history of emigration, there is a small group of people living there who were born outside of Ireland to Irish parents and who then returned to Ireland. These people are not immigrants in the standard sense. However, as they may have spent significant time outside of Ireland between their births and when they came to live in Ireland, it would not be entirely correct to categorise them as natives. For this reason, we exclude them from the analysis
8
occupational categories. This proportion increases for immigrants who arrived in
earlier periods. For those who arrived in the period 1995-1999, the proportion in the
top three occupational groups exceeds that of natives.
Table 1 here
The pattern shown in Table 1 is consistent with an integration story but it is clear that
other explanations could underpin the pattern and so it is necessary to explore this
much further. Before moving on to the regression analysis below, we can look at other
possible explanations for this apparent integration, namely, educational attainment
and national mix7. If the most recently arrived immigrants have lower levels of
education, this would partly explain the pattern in Table 1 and what is observed is a
compositional effect as opposed to integration. Similarly, if the most recent arrivals
are more heavily drawn from countries whose immigrants generally do less well in
Ireland’s labour market, this too could partly explain the pattern in Table 1.
In Table 2, we show the educational distributions of immigrants and natives. Before
looking at the immigrants by year of arrival, it should be noted that collectively
immigrants in Ireland are a remarkably educated group. This point has emerged from
analyses of earlier QNHSs (Barrett and Trace, 1998; Barrett et al, 2006) and also from
an analysis of the 2002 Census (Minns, 2005). The most recently arrived immigrants
have lower levels of education relative to the earliest arrivals so this may partly
explain their lower level of occupational attainment relative to earlier arrivals.
However, there is no difference between the 2000-01 group and the 1995-99 group
and so education cannot explain the 8.5 percentage point gap in their proportions in
the higher level occupations.
Table 2 here
In Table 3, we show the nationality distribution of immigrants by year of arrival and a
striking picture emerges. In the period 1995-1999, over 50 percent of the immigrants
arriving were from the UK, with only a small proportion (2.4 percent) coming from
7 Of course, a changing national mix among immigrants could lead to a change in the educational attainment of immigrants.
9
the countries which now make up the EU-NMS. In the most recent period, these
proportions have been reversed, with over half of the new arrivals being from the EU-
MNS. Referring back to Chiswick et al (2005), if the thesis is correct that immigrants
from countries that are similar to the host country will have better labour market
outcomes, then this shift between the UK and the EU-NMS could explain the
changing occupational pattern seen in Table 1.
Table 3 here
4(c) – Results (regression)
At this point, we will move beyond the descriptive statistics and will employ
regression analysis to distil the relative impact of different factors on occupational
attainment. The sets of regressions that are presented below are probit analyses in
which the dependent variable is 1 if the individual is in one of three higher-level
occupations shown in Table 1 and zero otherwise. Given this set up, we are modelling
the likelihood of being in higher-level occupations based on a set of explanatory
variables. These explanatory variables include dummy variables indicating age
categories and educational categories, and also dummy variables indicating gender
and marital status. We also include dummy variables indicating immigrants and
natives, with the immigrants being further divided into different groups in later
models. This approach is identical to that taken by Barrett et al (2006).
In Table 4, we present the results from a probit regression in which all immigrants and
all natives are included. Rather than presenting coefficient estimates, we show the
marginal impacts for each variable as these can be interpreted as differences in
probabilities. Before discussing the immigrant marginal impact, we will take a brief
look at the other variables in order to confirm that the model produces sensible
results. For the age variables, the omitted category is people aged 15-19 years and so
the positive and significant marginal impacts are what we would expect. For the
education dummy variables the signs and significance are also as expected. The
omitted category is “no formal qualifications”. As can be seen from the marginal
impacts, the likelihood of being in a higher-level occupation increases with level of
education. Time with one’s current employer also has a positive and significant
impact. For the gender/marital status dummy variables, the omitted category is single
10
female. A statistically significant difference is only found between single men and
single women, with single men being less likely to be in high-level occupations.
Table 4 here
Turning to the immigrant dummy variable, the estimated marginal impact suggests
that immigrants are 10 percent less likely to be in the higher level occupations,
controlling for factors such as age and education. This repeats the finding of Barrett et
al (2006) - using the 2003 QNHS, the immigrant dummy variable in the same probit
model of occupational attainment was 7 percent. Barrett et al labelled this finding the
“occupational gap” and pointed out that it implied a loss of output in the Irish
economy as it suggested that immigrants were working below their full potential.
As the data that Barrett et al (2006) were working with did not identify the year of
arrival for each immigrant, they were not able to explore if the “occupational gap” fell
with years in Ireland. Our data allow us to examine this point. In Table 5, we show
results from a probit regression which is similar to that shown in Table 4 but in which
the immigrant group are broken up into four categories depending on their year of
arrival. It should be noted that although the table only shows the coefficients on the
immigrant dummy variables, the variables that are shown in Table 4 were included in
the model.
Table 5 here The first point to be taken from Table 5 is that immigrants in the arrival cohorts 2004-
05, 2002-03 and 2000-01 all show lower probabilities of being in higher level
occupations relative to natives, controlling for the factors shown in Table 3. However,
the 1995-99 group are statistically as likely to be in higher-level occupations relative
to natives. Although the marginal impacts decline across the arrival cohorts (as
suggested by the descriptive statistics shown in Table 1), t-tests show no statistical
differences between the three most recent arrivals. However, the marginal impacts for
these three groups do differ statistically from the marginal impacts for the 1995-1999
group and so we can conclude that there is a difference in terms of occupational
attainment between the earliest arrivals and those arriving more recently.
11
The results in Table 5 are consistent with a process of immigrant integration in the
labour market. However, the changing national mix (as shown in Table 3) could
generate the same result if the national groups that make up a larger share of the most
recent arrivals have lower levels of occupational attainment. For this reason, we re-ran
the occupational attainment probit but this time replacing the year of arrival
immigrant dummy variables with dummy variables indicating the immigrants’
nationalities. The results are presented in Table 6 and a striking result emerges.
Immigrants from the UK do not experience an “occupational gap” relative to natives.
If anything, they experience an occupational advantage (albeit at the 10% level of
statistical significance). In contrast, immigrants from the EU-NMS have the largest
occupational disadvantage, at 23 percent.
Table 6 here
The results in Table 6 raise doubts about whether a process of immigrant integration
is at work in Ireland but in order to examine it more closely, we need to control for
the changing national mix of immigrants into Ireland. We do this by estimating
probits with the same variables as used in the model in Table 5, i.e. the set of socio-
economic controls plus year-of-arrival indicators for immigrants, but comparing each
national group of immigrants to natives in separate regressions. As we have five
nationality groups, this leads to a set of five regressions. We only report the results for
the UK and the EU-NMS here as these are the groups that dominated the inflows in
the earliest and latest periods respectively. The results for the other three groups are
discussed in brief below.
In Table 7, we present the results from a regression in which we estimate the
occupational attainment of UK immigrants by years of arrival, relative to natives. As
there is no discernable pattern in the size of the occupational gap (or advantage) over
time, we cannot say that there is any evidence of assimilation. However, this would
have been expected based on Chiswick et al (2005). As UK immigrants are coming
from a similar country with similar labour market institutions, they should be able to
find employment that is closely aligned to their skills.
12
Table 7 here
In Table 8, we present the occupational attainment probit for the EU-NMS. It should
be recalled from Table 6 that this group experienced the largest occupational gap. Our
interest here is in seeing if it diminishes according to the year of arrival of the
immigrants. The results show that this is not the case and that the occupational gap is
generally quite consistent. The earliest arrivals appear to have identical occupational
attainment relative to natives but the relevant cell size is too small for anything
meaningful to be concluded. Hence, we are not finding evidence of integration. It
could be that the time period over which we are observing the immigrants is simply
too short to capture a pattern of integration. It could also be that our cell sizes,
although allowing us to capture statistically significant differences between
immigrants and natives, are not allowing us to capture within-immigrant differences.
For these reasons, we need to stress that we all we can conclude is that we are not
finding evidence of integration.
Table 8 here
Referring back again to Chiswick et al (2005), we would expect immigrants with
higher levels of education to be more likely to experience upward occupational
mobility. Based on this, we re-estimated the probit model for the EU-NMS immigrant
but this time restricted the sample to those immigrants and natives with third level
qualifications. The results are presented in Table 9 and a mixed picture emerges. The
most recent arrivals show a large occupational gap relative to natives who also have
third level qualifications. The measured occupation gap is also larger for the 2004/05
arrivals relative to the 2002/03 (the difference between the coefficients has a t-statistic
of 2.16). However, the difference between the 2004/05 coefficient and the 2000/01
coefficient is not statistically significant. Hence, we are at best finding patchy
evidence on integration, with immigrants from the EU-NMS who arrived in the period
2000/2002 still experiencing an occupation gap of almost 40 percent relative to
comparable natives in 2005.
Table 9 here
13
Before leaving the issue of integration, we should note that little further evidence of
such integration emerged from the analysis of the three other national groups – USA,
EU-13 and “other”. In general, there was no readily observable pattern in the
occupational gap by year of arrival and even when there was, the differences in the
coefficient estimates were not statistically significant. One small exception emerged
when we ran the model for immigrants from the EU-13 with third level qualifications.
The results are shown in Table 10. With the obvious exception of the earliest arrivals,
we do see a declining occupational gap, with the difference between the 2004/04 and
the 2000/01 groups being statistically significant (t-statistic is 1.98). However, this is
relatively weak evidence of increased integration over time.
Table 10 here
Section 5: Conclusion and Discussion
The occupational attainment of Ireland’s immigrants relative to natives, controlling
for age and education, is lower for more recent arrivals. However, this does not
appear to be the result of increased labour market integration over time. Instead, it is
related to a changing national mix in the immigrant inflow into Ireland. Immigrants
from the EU-NMS are heavily represented among the most recent arrivals and they
suffer the largest occupational gap. In addition, there appears to be no lessening over
time in the occupational gap experienced by immigrants from the EU-NMS. Hence,
we are not finding evidence of immigrant labour market integration over time.
The focus of the analysis was on the occupational gap, controlling for age and
education. In the context of our findings on that point, it is useful to return to an issue
looked at above, namely, the educational distribution of immigrants. In Table 2, we
looked at the distribution of educational qualifications by year of arrival. In Table 11,
we again show the distribution of educational qualifications of immigrants but this
time by nationality. The point that emerges is that immigrants from the EU-NMS have
the lowest level of education attainment, as measured by the proportion with third
level degrees. This implies that the changing national mix is contributing to a reduced
educational attainment for the newest arrivals in Ireland (see Table 2) and also a lower
occupational attainment controlling for education (see Table 5).
14

With respect to educational qualifications, it should be noted that the proportion of
immigrants with third level qualifications (31.8 percent) is identical to the proportion
with third level qualifications in the native Irish population. For this reason, the
conclusion should not be drawn that immigration into Ireland is becoming low skilled.
Instead, the more modest conclusion can be drawn that the exceptionally high-skilled
nature of Irish immigration, noted in earlier studies, is being weakened as a result of
increased immigration from the EU-NMS. This policy-induced switch in the national
origin mix of immigrants and the consequent change in human capital characteristics
is reminiscent of the effects in the US of the 1965 Amendments to the Immigration
and Naturalisation Act, as discussed in Borjas, 1987. As much of the analysis of the
economic impacts of immigration to Ireland has been based on the inflow being
highly-skilled (Barrett et al, 2002; Barrett et al, 2006), one implication of the findings
here is that the estimates of the impacts may need to be re-estimated.
Table 11 here
These findings with respect to education and occupational attainment might be of
more limited concern if evidence of increased integration over time was found but this
is generally not the case. As these immigrants had been free to work in Ireland for a
full year at the time the sample was drawn8, it is somewhat surprising that a greater
degree of upward mobility was not found. It could be that the immigrants who arrived
before 2004, i.e. before full rights to work applied, were working illegally and that a
“scarring” effect has arisen whereby it is difficult to break out of a weak labour
market situation. Other possible explanations for the lack of integration include
language skills and the non-recognition of qualifications. It could also be that the
timeframe is simply too short for integration to be observed. For this reason, it will be
important to re-examine this issue as more data becomes available.
Whether the lack of integration is short-term or long-term, it is not possible to get a
clear sense of what might be causing it from the data used here. However, it is
important to highlight the possible existence of barriers to mobility in Ireland so that
8 The New Member States entered the EU on 1 May, 2004; the data was collected in the Spring of 2005.
15
any such barriers can be lowered, thereby allowing Ireland to avoid the difficulties
experienced by other countries in terms of immigrant integration.
As a final point, is it useful to consider what these results tell us that is of specific
relevance to the possible impacts of emigration for the EU-NMSs. In Table 11, we
have shown that 31 percent of EU-NMS immigrants in Ireland have third level
degrees. We know from Ireland’s Census 2006 that immigrants from Poland are by
far the largest group among the total immigrant group from the EU-NMS (63,000 out
of a total of 120,000), so by comparing the 31 percent with the proportion of the
Polish labour force which has a third level qualification, we can get a sense of
whether emigration from Poland to Ireland is selective of the more skilled. As the
corresponding figure for Poland is 16 percent (OECD, 2006), it certainly does appear
as if Poland is losing a disproportionate share of its high-educated employees9.
Ireland itself experienced a “brain-drain” of this sort in the 1980s. However, when
those who left in the 1980s returned in the 1990s, they appear to have returned with
enhanced human capital, as evidenced by the higher earnings of returning migrants
relative to non-migrants (Barrett and O’Connell, 2001). If the highly-skilled Polish
emigrants return to Poland with similarly enhanced human capital, then the concerns
surrounding the “brain-drain” phenomenon will be reduced. However, as the results
here appear to show that immigrants from the EU-NMSs are not accessing higher-
skilled occupations, in which they would acquire enhanced skills and competencies,
this positive effect may not arise.
9 The only other NMS covered by the OECD data is Slovakia – the proportion of the labour force with third level education there is 13 percent.
16
Appendix
Figure 1: Net Migration to and from Ireland 1987 to 2006
Net migration (in thousands)
-60
-40
-20
0
20
40
60
80
1987
1989
1991
1993
1995
1997
1999
2001
2003
2005
Table 1: Occupational Distributions of Immigrants and Natives
NativeAll
immigrantsArrived
04-05Arrived
02-03Arrived
00-01 Arrived
95-99 % % % % % %Managers/administrators 19.2 9.5 7.1 9.6 8.1 15.6Professional 12.1 13 7.1 12.4 16.7 19Associate professional/ technical 9.5 12.4 8.4 13.7 15.2 13.9Clerical and secretarial 13.9 10.1 8.8 9.9 11 11.5Craft and related 15.2 16.8 23.5 15.9 11 14.2Personal and protective service 11.1 17.4 19.3 19 16.7 12.9Sales 9.5 10.8 12.4 10.6 10.5 8.5Plant and machine operatives 9.5 10.1 13.5 8.9 11 4.4 100 100 100 100 100 100 % in top three occupations 40.8 34.9 22.5 35.7 40 48.5N 32536 1634 524 395 420 295
17
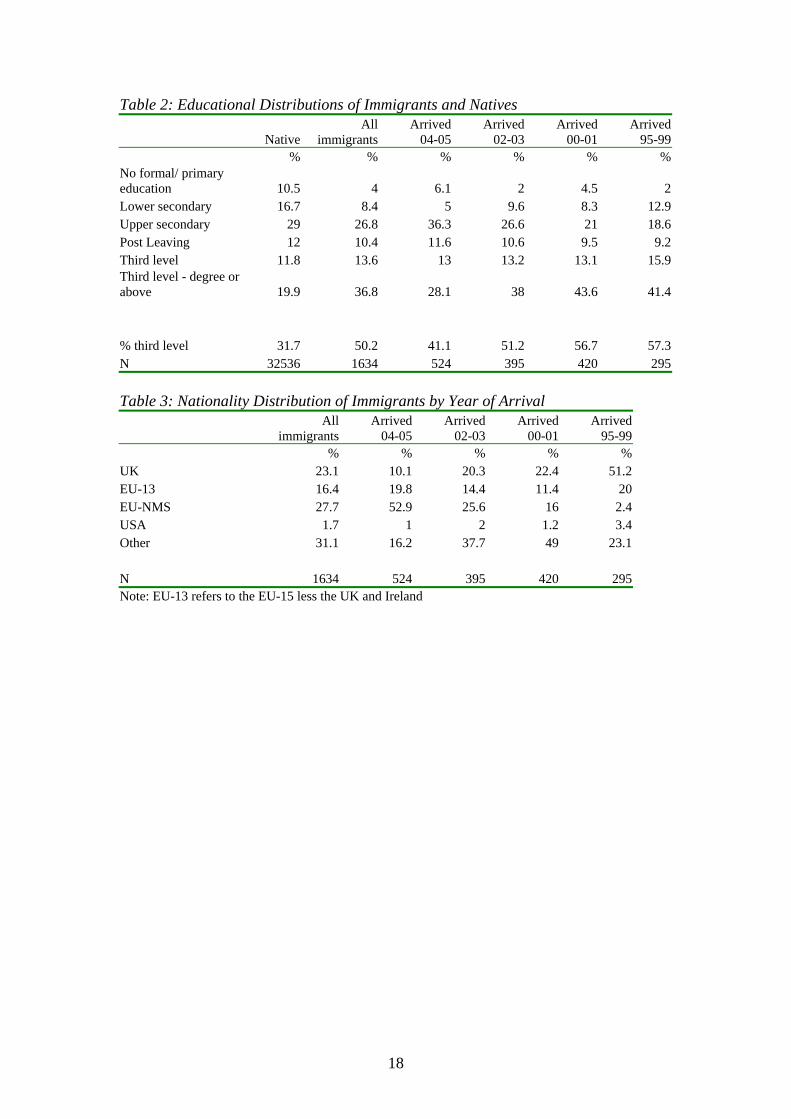
Table 2: Educational Distributions of Immigrants and Natives
Native All
immigrantsArrived
04-05Arrived
02-03Arrived
00-01 Arrived
95-99 % % % % % %
No formal/ primary education 10.5 4 6.1 2 4.5 2Lower secondary 16.7 8.4 5 9.6 8.3 12.9Upper secondary 29 26.8 36.3 26.6 21 18.6Post Leaving 12 10.4 11.6 10.6 9.5 9.2Third level 11.8 13.6 13 13.2 13.1 15.9Third level - degree or above 19.9 36.8 28.1 38 43.6 41.4 % third level 31.7 50.2 41.1 51.2 56.7 57.3N 32536 1634 524 395 420 295 Table 3: Nationality Distribution of Immigrants by Year of Arrival
All
immigrantsArrived
04-05Arrived
02-03Arrived
00-01Arrived
95-99 % % % % %
UK 23.1 10.1 20.3 22.4 51.2 EU-13 16.4 19.8 14.4 11.4 20 EU-NMS 27.7 52.9 25.6 16 2.4 USA 1.7 1 2 1.2 3.4 Other 31.1 16.2 37.7 49 23.1 N 1634 524 395 420 295 Note: EU-13 refers to the EU-15 less the UK and Ireland
18
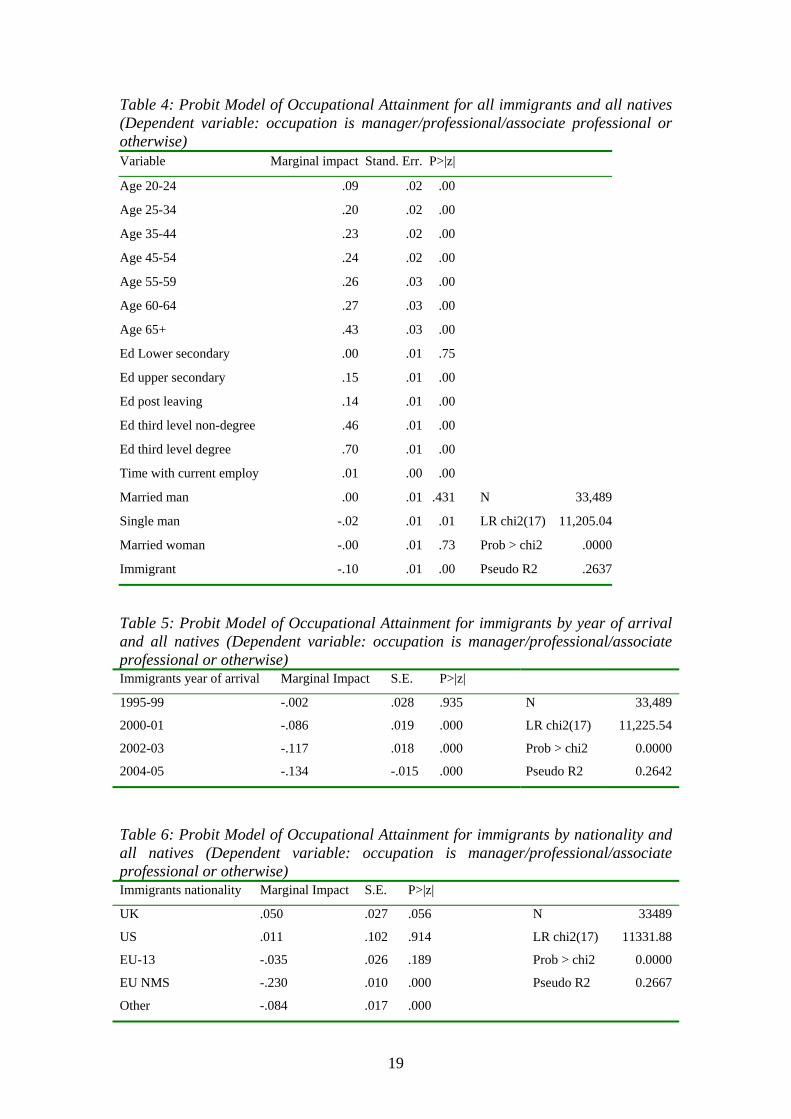
Table 4: Probit Model of Occupational Attainment for all immigrants and all natives (Dependent variable: occupation is manager/professional/associate professional or otherwise) Variable Marginal impact Stand. Err. P>|z|
Age 20-24 .09 .02 .00
Age 25-34 .20 .02 .00
Age 35-44 .23 .02 .00
Age 45-54 .24 .02 .00
Age 55-59 .26 .03 .00
Age 60-64 .27 .03 .00
Age 65+ .43 .03 .00
Ed Lower secondary .00 .01 .75
Ed upper secondary .15 .01 .00
Ed post leaving .14 .01 .00
Ed third level non-degree .46 .01 .00
Ed third level degree .70 .01 .00
Time with current employ .01 .00 .00
Married man .00 .01 .431 N 33,489
Single man -.02 .01 .01 LR chi2(17) 11,205.04
Married woman -.00 .01 .73 Prob > chi2 .0000
Immigrant -.10 .01 .00 Pseudo R2 .2637
Table 5: Probit Model of Occupational Attainment for immigrants by year of arrival and all natives (Dependent variable: occupation is manager/professional/associate professional or otherwise) Immigrants year of arrival Marginal Impact S.E. P>|z|
1995-99 -.002 .028 .935 N 33,489
2000-01 -.086 .019 .000 LR chi2(17) 11,225.54
2002-03 -.117 .018 .000 Prob > chi2 0.0000
2004-05 -.134 -.015 .000 Pseudo R2 0.2642
Table 6: Probit Model of Occupational Attainment for immigrants by nationality and all natives (Dependent variable: occupation is manager/professional/associate professional or otherwise) Immigrants nationality Marginal Impact S.E. P>|z|
UK .050 .027 .056 N 33489
US .011 .102 .914 LR chi2(17) 11331.88
EU-13 -.035 .026 .189 Prob > chi2 0.0000
EU NMS -.230 .010 .000 Pseudo R2 0.2667
Other -.084 .017 .000
19
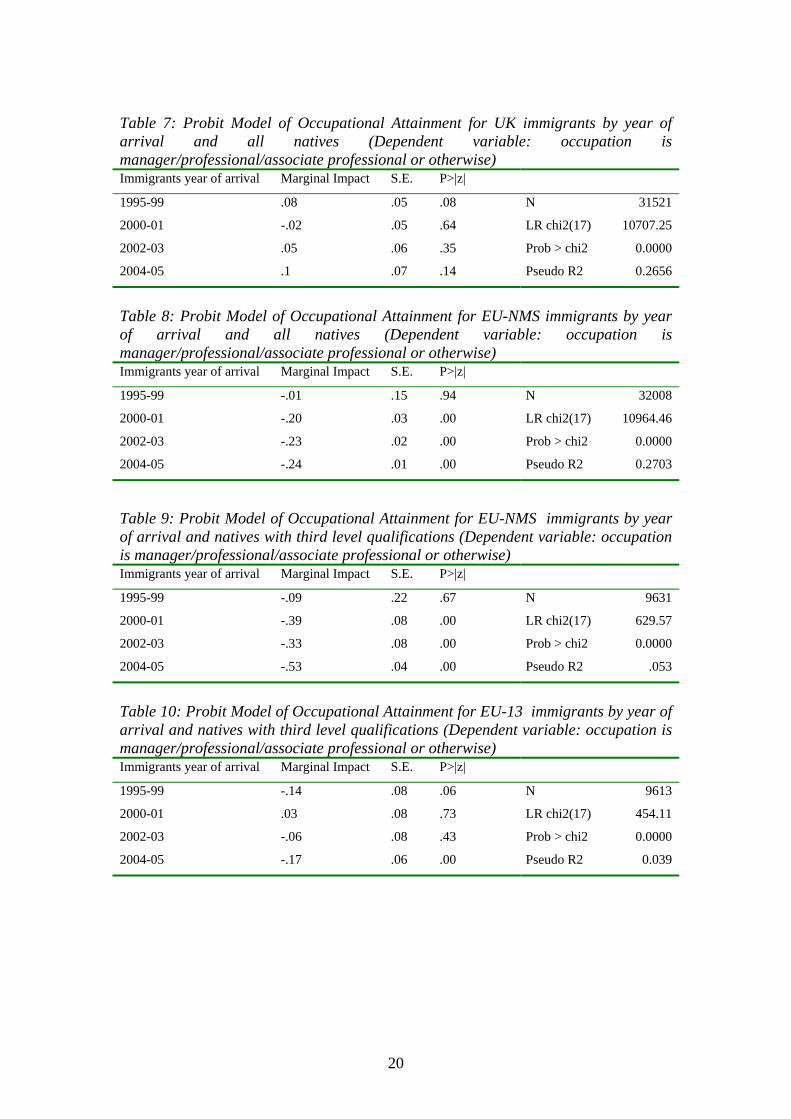
Table 7: Probit Model of Occupational Attainment for UK immigrants by year of arrival and all natives (Dependent variable: occupation is manager/professional/associate professional or otherwise) Immigrants year of arrival Marginal Impact S.E. P>|z|
1995-99 .08 .05 .08 N 31521
2000-01 -.02 .05 .64 LR chi2(17) 10707.25
2002-03 .05 .06 .35 Prob > chi2 0.0000
2004-05 .1 .07 .14 Pseudo R2 0.2656
Table 8: Probit Model of Occupational Attainment for EU-NMS immigrants by year of arrival and all natives (Dependent variable: occupation is manager/professional/associate professional or otherwise) Immigrants year of arrival Marginal Impact S.E. P>|z|
1995-99 -.01 .15 .94 N 32008
2000-01 -.20 .03 .00 LR chi2(17) 10964.46
2002-03 -.23 .02 .00 Prob > chi2 0.0000
2004-05 -.24 .01 .00 Pseudo R2 0.2703
Table 9: Probit Model of Occupational Attainment for EU-NMS immigrants by year of arrival and natives with third level qualifications (Dependent variable: occupation is manager/professional/associate professional or otherwise) Immigrants year of arrival Marginal Impact S.E. P>|z|
1995-99 -.09 .22 .67 N 9631
2000-01 -.39 .08 .00 LR chi2(17) 629.57
2002-03 -.33 .08 .00 Prob > chi2 0.0000
2004-05 -.53 .04 .00 Pseudo R2 .053
Table 10: Probit Model of Occupational Attainment for EU-13 immigrants by year of arrival and natives with third level qualifications (Dependent variable: occupation is manager/professional/associate professional or otherwise) Immigrants year of arrival Marginal Impact S.E. P>|z|
1995-99 -.14 .08 .06 N 9613
2000-01 .03 .08 .73 LR chi2(17) 454.11
2002-03 -.06 .08 .43 Prob > chi2 0.0000
2004-05 -.17 .06 .00 Pseudo R2 0.039
20

Table 11: Educational Distributions of Immigrants by National Group UK EU-13 EU-NMS Other USA All immigrants % % % % % % No formal/ primary education 2.4 1.1 6.4 4.7 0.0 4.0 Lower secondary 18.3 2.2 9.3 3.5 7.1 8.4 Upper secondary 19.6 22.4 37.8 25.2 17.9 26.8 Post Leaving 11.4 8.2 14.6 7.1 10.7 10.4 Third level 15.1 14.2 12.6 13.6 3.6 13.6 Third level - degree or above 33.3 51.9 19.2 45.9 60.7 36.8 100 100 100 100 100 100 N 378 268 452 508 28 1634
21
References
Amuedo-Dorantes, Catalina and Sara de la Rica (2006), “Labor Market Integration of Recent Immigrants in Spain”, IZA Discussion Paper No. 2104 Antecol, Heather, Peter Kuhn and Stephen Trejo (2003), “Integration via Prices or Quantities: Labour Market Institutions and Immigrant Earnings Growth in Australia, Canada and the United States”, IZA Discussion Paper No. 802 Baker, Michael and Dwayne Benjamin (1994), “The Performance of Immigrants in the Canadian Labour Market”, Journal of Labor Economics Vol. 12 pp. 369-405 Barrett, Alan, Adele Bergin and David Duffy (2006), “The Labour Market Characteristics and Labour Market Impacts of Immigrants in Ireland”, Economic and Social Review Vol. 37 pp. 1-26 Barrett, Alan, John FitzGerald and Brian Nolan (2002), “Earnings Inequality, Returns to Education and Immigration into Ireland”, (2002), Labour Economics, Vol. 9 No. 5 Barrett, Alan and Yvonne McCarthy (2006), “Immigrants in a Booming Economy: Analysing their Earnings and Welfare Dependence”, IZA Discussion Paper No. 2457 Barrett, Alan and Philip J. O’Connell (2001), “Is there a Wage Premium For Returning Irish Migrants”, Economic and Social Review Vol. 32 No. 1 Barrett, Alan and Fergal Trace (1998), “Who is Coming Back? The Educational Profile of Returning Migrants in the 1990s”, Irish Banking Review, Summer pp. 38-52 Borjas, George (1987), “Self-Selection and the Earnings of Immigrants”, American Economic Review Vol. 77 No. 4 Borjas, George J. (1985), “Integration, Changes in Cohort Quality and the Earnings of Immigrants”, Journal of Labor Economics Vol. 3 pp. 463-489 Central Statistics Office (2005), Quarterly National Household Survey Quarter 2 2005, Dublin: CSO Chiswick, Barry R. (1978), “The Effect of Americanisation on the Earnings of Foreign-born Men”, Journal of Political Economy Vol. 86 pp. 897-921 Chiswick, Barry R., Yew Liang Lee and Paul Miller (2005), “Longitudinal Analysis of Immigrant Occupational Mobility: A Test of the Immigrant Integration Hypothesis”, International Migration Review Vol. 39 pp. 332-353 Green, David A. (1999), “Immigrant Occupational Attainment: Integration and Mobility over Time”, Journal of Labour Economics, Vol. 17 pp. 49-79 Honohan, Patrick and Brendan Walsh (2002), “Catching Up with the Leaders: The Irish Hare”, Brookings Papers on Economic Activity Vol. 2002 pp 1-57
22

Minns, C. (2005), “How Skilled Are Irish Immigrants? Evidence and Implications”, paper delivered to the Statistical and Social Inquiry Society of Ireland, 24 February. OECD (2006), Education at a Glance, Paris: OECD.
23