are ipo underwriters paid for the services they provide? annual meetings... · 1 are ipo...
TRANSCRIPT

1
Are IPO underwriters paid for the services they provide?
Michele Meoli a,b
, Andrea Signori a
, Silvio Vismara a,b
January 13, 2012
Abstract
More reputable underwriters are paid more for taking companies public, in that they are expected to be able
to provide a better service. However, independently from their reputation, underwriters provide a list of
different ancillary services to the firms they take public. We question whether such different levels in the
services provided lead to different gross spreads charged. Based on the declarations reported in the
prospectus of Italian IPOs, we find that the availability to stabilize the price increases the spread. Issuers can
choose a cheaper way to go public by renouncing this service. We investigate whether underwriters‟
declarations are actually pursued and find that underwriters follow different patterns in providing ancillary
services in the aftermarket. Nevertheless, the fees charged are not informative about their support. Instead,
other factors, such as negative price revisions and negative (or low) underpricing, drive the provision of
these services. Underwriters seem to act properly by stabilizing those IPOs that in fact need it.
Keywords: IPOs, Underwriters, Investment banks, Gross spread, Price stabilization.
JEL Code: G15, G24
a Department of Economics and Technology Management, University of Bergamo, Italy
b CCSE, University of Bergamo, Italy, and University of Augsburg, Germany
* We are grateful to Wolfgang Bessler, Fabio Braga, Arif Khurshed, Stefano Paleari, Enrico Pellizzoni, Jay Ritter, and
participants at the 2011 FMA European Conference in Porto and seminars at the Italian Stock Exchange for helpful
comments. Contact author: viale Marconi 5, 24044 Dalmine (BG), Italy, [email protected].

2
1 Introduction
The level of competition in the industry of IPO underwriting has come under discussion after that Chen and
Ritter (2000) pointed at an unusual clustering of gross spreads at seven percent, for almost all moderate-sized
IPOs in the US. They argue that an implicit form of collusion (strategic pricing) might have been adopted.
Eleven years later, Liu and Ritter (2011) address the inconsistency of perfect competitive models and study
the US underwriting market as a series of local oligopolies. They argue that market power is based also on
quality, which involves the reputation of the underwriters, their industry expertise as well as the ancillary
services they provide.
Chen and Ritter (2000) and Liu and Ritter (2011) deal with IPOs in the United States. Underwriting IPOs in
Europe is a different story: fees are sensibly lower (Ljungqvist et al. 2003) and less clustered (Torstila 2003).
Our evidence confirms that there is an average three percent gap in underwriting fees between US and
Europe. Several reasons have been proposed to justify this difference, such as the higher quality of
underwriting services in the US (Torstila 2003) or the stronger litigation exposure (Lowry and Shu 2002). A
recent paper by Abrahamson et al. (2011), however, argues that such a gap is only barely justified by the
higher marketing costs, legal expenses and litigation exposure of US underwriters. A more plausible
explanation is ascribed to the different levels of competition of the two underwriting markets, together with
an effect of path dependency.
Underwriting fees are not as clustered in Europe as they are in the US. We find that most of the firms going
public in Europe pay fees between 3 and 5 percent, but sometimes they are as low as 1.25% (e.g., the IPO of
the Peacock Group in London in 1999, or Snam Rete Gas in Milan in 2001). As a term of comparison, only
12% of European IPOs is clustered at the median value of 4 percent, while 76% of US IPOs has a seven
percent spread. This variability makes of Europe a privileged setting where to investigate a basic question for
the role of financial intermediaries involved in the IPO process: what are they paid for?
This paper relates the fees paid to underwriters (gross spread) to the level of service they provide. Some of
the services are indeed granted in every IPO (e.g., due diligence, roadshows, book building and placement),
some are compulsorily provided only in some markets (e.g., liquidity support), and others are completely
optional (e.g, price stabilization). We assume that the quality of the „standard‟ services required in every IPO
can be proxied by the reputation of the underwriter, whereas the „ancillary‟ services are specific to the deal
between the issuer and the underwriter. Ceteris paribus, investment banks will ask for higher fees when
required to offer ancillary services. Among them, the price stabilization and the liquidity support are crucial
for the success of an IPO (Ellis et al. 2000), and for its cost.
We model the underwriter‟s remuneration as a function of three elements: (1) firm-specific, (2) underwriter-
specific, and (3) IPO-specific. First, the nature of the company going public is expected to affect the level of
fees. For instance, larger firms pay relatively less, as well as privatizations and ECOs (Torstila 2001b).
Second, the reputation of the underwriter is expected to be a perceived quality, or anyway a source of

3
bargaining power, that raises fees (Fang 2005). Thus, we control for the ranking and internationality of the
underwriter. Third, the level of services provided. Herein in particular lies the main contribution of the paper,
that investigates whether the formal commitment of the underwriter to provide ancillary services leads to
higher fees.
Information on the services granted is taken from the official offering prospectus, where it is disclosed
whether underwriters are „expected‟ to provide liquidity support and/or to stabilize the price in the first
month of trading. However, if it is clear when they are not required to provide such services, it is not the
same for when they are supposed to actually offer them. We therefore move forward by investigating two
key issues: first, whether such commitments are substantiated in the aftermarket; second, whether higher fees
are related to the actual ex-post provision of these services. To this extent, we employ Heckman and Tobit
regression models to investigate the determinants of the decision to grant price stabilization and liquidity
support. We include firm- and underwriter-specific variables, so to address a third research question: do
underwriters support those firms that actually need it?
The empirical setting of our paper is based in Italy, where we are able to access unique data provided by the
stock exchange (Borsa Italiana), including detailed information on the fees charged by underwriters as well
as on their services. Investigating the Italian underwriting market may be instructive for three reasons. First,
it provides an institutional setting similar to most continental European countries but different from the US
market (Abrahamson et al. 2011). Allocation policies in US IPOs are discretionary for both retail and
institutional investors (Ljungqvist and Wilhelm 2003), while shares offered to retail investors cannot be
discretionarily allocated in Europe (Jenkinson and Jones 2004). Second, it is interesting to investigate the
role of financial intermediaries in a stable environment like Italy, where book building has been adopted as
the unique pricing and allocation methodology in IPOs already in 1994. Third, the Italian market can be
considered a laboratory for the study of the going public decision outside of the Anglo-Saxons financial
systems (Pagano et al. 1995). Both the UK and US have a well-developed equity market and, relatedly, an
industry of financial intermediation centered in providing equity (La Porta et al. 1997). Our analysis sheds
light on the financial intermediation in IPOs, in a bank-centered system.
Results reveal that firm and offer characteristics drive underwriting fees, since economies of scale are
strongly influential. Underwriters are paid for their availability to stabilize stock price: issuers can choose a
cheaper way to go public by renouncing this service. Of the IPOs requiring this service, only half is then
actually stabilized after going public. Underwriters seem to act properly by stabilizing IPOs that actually
need it. Stabilized IPOs have indeed negative price revision, considerable claw-backs to retail investors and
weak first day returns. The nationality and the reputation of the underwriter are also crucial in the
stabilization decision: foreign and highly ranked banks are less prompt to support stock price. Liquidity
support is instead provided in 90% of the cases in which the underwriter was paid to provide such service.
The declared availability to provide this service does not influence the level of the fees.
4
The remainder of the paper is organized as follows. Section 2 provides a review of the literature about
competition in the underwriting industry and gross spread determinants. Section 3 describes the IPO
underwriting industry in Europe. Section 4 illustrates the research design and the methodologies. Results are
outlined in Section 5, and Section 6 concludes the article.
2 Literature review
In US IPOs, the „seven percent solution‟ is widely adopted regardless of offer size and underwriting costs
(Chen and Ritter 2000). Moreover, underwriters who persistently underprice IPOs experience superior
market share growth, instead of being penalized for leaving money on the table (Hoberg 2007). Such
empirical evidence of spread clustering and underwriter persistence is inconsistent with most of the
asymmetric information-based models attempting to explain IPO equilibrium, such as the winner‟s curse
(Rock 1986), signaling (Allen and Faulhaber 1989) and litigation (Beatty 1993) theories. Rather than a
perfect competition, Liu and Ritter (2011) argue that the underwriting market in the US is better
characterized by a series of local oligopolies, in which the quality of ancillary services determines market
power, and underwriters exercise their market power through underpricing rather than by charging higher
fees. Hence, in equilibrium, neither underpricing nor spread are at competitive levels.
Chen and Ritter‟s implicit collusion hypothesis is challenged by an opposite line of thought, supporting an
efficiency-based justification. Hansen (2001) claims that seven percent is an efficient contract that best suits
the IPO market. Low concentration and weak entry barriers are indeed inconsistent with collusive practices.
Torstila (2003) documents that clustering occurs also outside the US, though less pervasively, and need not
be collusive. Yeoman (2001) emphasizes that spreads are arranged at the beginning of the IPO process, in
still very uncertain conditions. This prevents to identify the optimal spread and favors the seven percent
solution to drop contracting costs.
However, efficiency-based models are unable to justify the 3% gap between European and US fees.
Abrahamson et al. (2011) find that this difference persists also by subtracting legal costs, which are not
included in European spreads, from US spreads. They wonder why, given that the same banks dominate both
markets, US issuers are not charged European fees. The most plausible explanation relies on the higher level
of competition of the underwriting market in Europe.
The issuer‟s and the underwriter‟s characteristics are widely recognized as two crucial elements in
determining the level of fees. Fees decrease with offer size due to substantial economies of scale (Ritter
1987; Lee et al. 1996). Torstila (2001b) shows that privatizations have even lower levels of underwriter
compensation that their large size would imply, because of the high bargaining power of governments. On
the underwriter‟s side, reputation is crucial. US banks underwriting European IPOs are more costly, because
of superior valuation and industry expertise in case the IPO has to be marketed in the US (Torstila 2001b).
Carter and Manaster (1990) and Fang (2005) show that prestigious underwriters charge a fee premium due to

5
their reputational effect. Syndicate size is also influential, because large syndicates allow to share the IPO
risk (Torstila 2001b). However, despite the growing interest in the gross spread charged by IPO
underwriters, existing studies do not distinguish the price-relevant role played by ancillary services. The only
exception is Torstila (2001a), whose prediction that stabilization costs are anticipated by the level of fees
finds no empirical support anyway.
3 IPO underwriting in Europe
Figure 1 shows the gross spread of US IPOs compared to Europe in the period 1999-2008. More than half of
US IPOs have fees at seven percent, whereas there is a difference of 2% between the first and third quartile
of European IPOs. This paper focuses on the IPO market in Italy, for which we have complete data for the
entire population of IPOs in the period 1999-20081.
[FIGURE 1]
The services requested to underwriters vary according to the market where the firm is going public. In Italy,
issuers can choose among three public markets managed by Borsa Italiana. The MTA (Mercato Telematico
Azionario) is the main market, the Expandi is the market dedicated to small companies (the minimum
capitalization required is one million euro), and the Nuovo Mercato for young firms in high-tech industries.
The phases of the IPO process in Italy are briefly outlined in Table 1. The pre-listing phase includes
„standard‟ services, i.e. the typical marketing, pricing and placement activities, which are mandatory in all
IPOs. The underwriter‟s mandate does not end with the beginning of trading, since it often guarantees the
subscription of all or part of the unsold shares, if any. Moreover, it is involved together with the specialist in
aftermarket services2. Specifically, stabilization is never mandatory, though the availability to provide it is
required by almost all issuers. Liquidity support is compulsory for firms going public in the Star segment3
and in the Nuovo Mercato.
1 Data on underwriter services in the aftermarket provided by Borsa Italiana are limited to 2008.
2 In Italian IPOs, the underwriting syndicate is typically composed of three members: the lead underwriter (labeled
„global coordinator‟), the sponsor, in charge of complying disclosure and transparency rules, and the specialist, whose
main purpose is to provide liquidity in the aftermarket. The lead underwriter, besides managing the typical phases of an
IPO, is in charge of some aftermarket activities. One of them is price stabilization, discussed in detail in the next
section. Liquidity support is instead provided by the specialist, though in about one third of the IPOs of our sample lead
underwriter and specialist are the same entity. This service consists in facilitating the trading of stocks that suffer from
scarce liquidity, by posting bid and ask proposals in the aftermarket. 3 Star is one of the three segments of the MTA, dedicated to firms with high standards of governance and transparency.
The other segments are Standard, for medium cap, and Blue Chip, for large cap (> €1 billion) IPOs.

6
[TABLE 1]
4 Research design
4.1 Data and variables
We collected a first set of publicly available information on the characteristics of the firm, the offer and the
underwriting syndicate from IPO prospectuses. A second set of information was provided by Borsa Italiana
through the MarketConnect database, regarding price stabilization and liquidity support, allowing to identify
IPOs that are price-stabilized and/or liquidity-supported by underwriters, and to what extent4. In particular,
we accessed the amount of shares bought and sold by the intermediaries for stabilization and liquidity
support purposes throughout the first month of trading.
We cross-sectionally regress the percentage gross spread charged by underwriters to study its determinants.
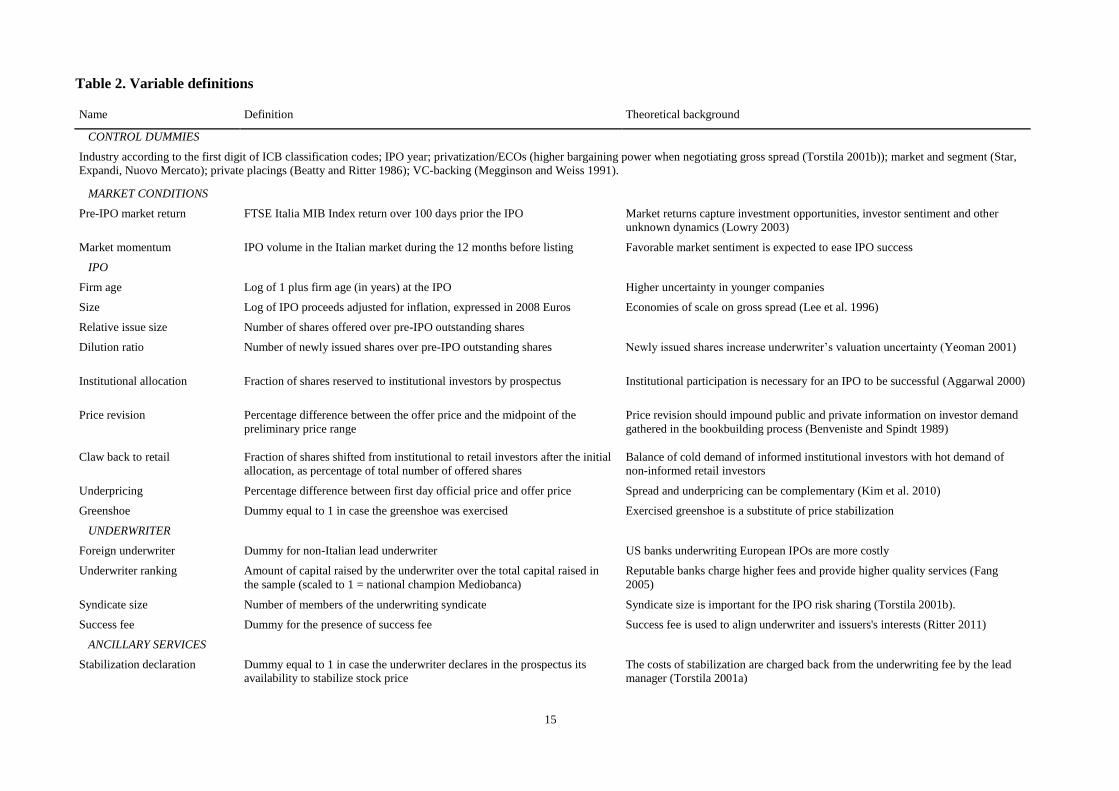
The definition and the theoretical justification of the variables are summarized in Table 2. Three different
dimensions are considered: (1) firm and offer characteristics; (2) underwriter characteristics; (3) prospectus
declarations and aftermarket provisions, aimed at testing our hypotheses on ancillary services. In the first
group, we employ market return of the FTSE Italia MIB index 100 days before listing date (pre-IPO market
return), and the number of IPOs in the previous twelve months (market momentum). Underwriting IPOs in a
very hot period may indeed require lower effort by investment banks, with potential reductions in fees. Firm
age at the IPO is a proxy for maturity, while size (inflation-adjusted IPO proceeds) controls for economies of
scale. Relative issue size (number of shares offered over pre-IPO outstanding shares), dilution ratio (number
of newly issued shares over pre-IPO outstanding shares) and institutional allocation (fraction of shares
reserved to institutional investors) are included to detect the existence of any specific allocative patterns. We
also consider some factors subsequent to the definition of the spread, with the aim of investigating whether
these services are in some way anticipated by the level of fees. These are price revision, the greenshoe
option, claw back clauses5 and underpricing.
The second set of determinants is related to the underwriter. Foreign banks involved in European IPOs may
play a certification role, hence a dummy for non-Italian banks is included. Reputation is proxied by
underwriter ranking, based on market share (proceeds) in the Italian market6. The size of the underwriting
syndicate is also included. In the third group, two dummies account for the issuer‟s request for price
4 While aftermarket data about price stabilization are available for all IPOs, information on liquidity support are
available for only 46 of the 86 offerings in which a specialist was designated. 5 Claw back clauses are allocation revisions by which the underwriter can shift shares from an investor category to
another, after the initial allocation, in order to manage different levels of oversubscription. Bertoni et al. (2008) find that
underwriters in Italy systematically increase the fraction of the shares allotted to the public when the first day return is
negative. 6 We also define the underwriter ranking with reference to the number of IPOs, instead of the capital raised, finding
similar results.

7
stabilization and liquidity support, with the aim of testing whether the formal underwriter‟s commitment is
remunerated through higher fees. We also test whether the fees anticipate the actual level of service by
studying those cases in which a declared service is not subsequently provided.
[TABLE 2]
4.2 Sample
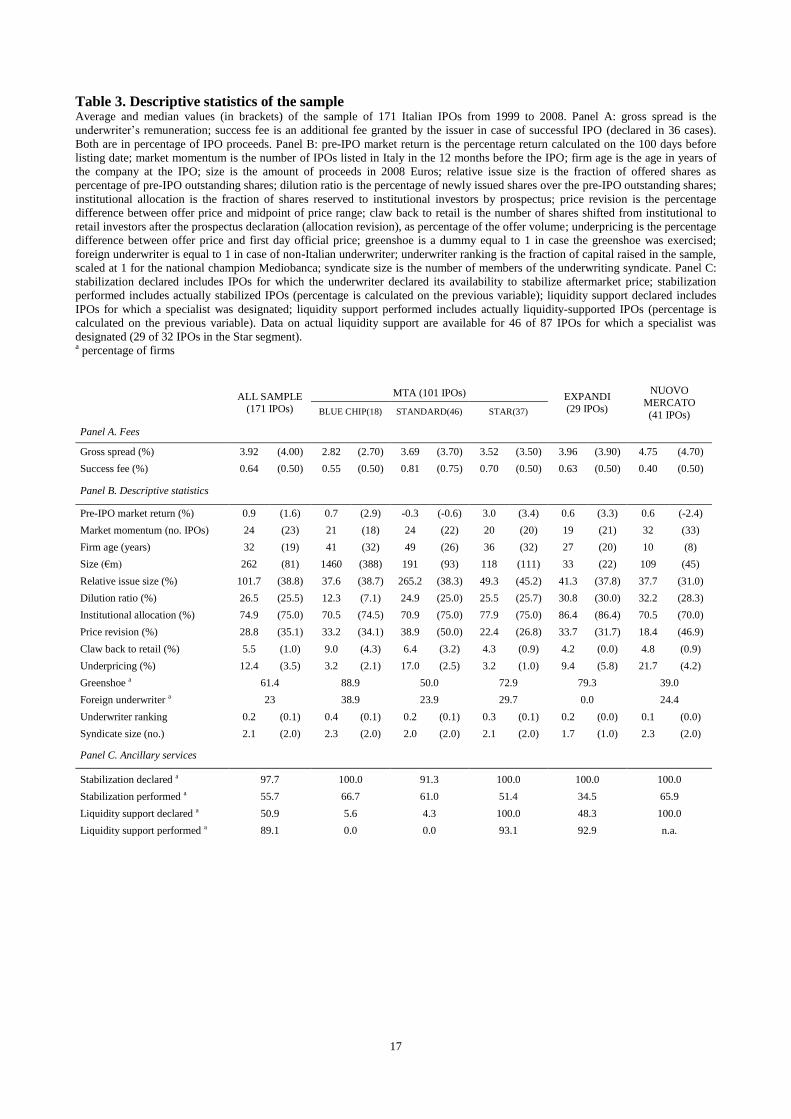
The sample consists of 171 IPOs taking place in Italy in the period from 1999 to 2008. The median gross
spread in Italy is 4%, as reported in panel A of Table 3. Two important effects are affecting its level. The
first one is the presence of economies of scale. In the Blue Chip segment, where the size of IPOs averages at
1.5€ billions, the median spread drops to 2.7%. The second effect is uncertainty. The highest fees are indeed
charged in the Nuovo Mercato, where young (8 years old at IPO, in median) and high tech firms (Vismara et
al. 2012) go public. Here the median remuneration for underwriters is 4.7%. In 36 IPOs the issuer declares
the presence of a success fee (0.5% in median), additionally granted in case of successful offer.
[TABLE 3]
Panel B of Table 3 highlights some peculiarities of the Nuovo Mercato. First, IPOs in this market benefit
from the most favorable market momentum, with 39 offerings on average in the year before their listing,
since almost all of them are concentrated during the internet bubble period. They also show the highest
dilution ratio (32% on average), due to small size and young age, and the deepest underpricing, 21.7% on
average7. The 23% of the sample is underwritten by foreign banks, that do not deal with small companies.
The Blue Chip segment, where the presence of foreign underwriters peaks at 38%, is characterized by the
highest ranking.
Panel C of Table 3 shows that the availability of the underwriters to stabilize stock price is required by
almost all the issuers. The only exceptions are four IPOs by financial companies. 55.7% of the offerings with
declaration are then actually stabilized. Liquidity support is instead declared in half the cases (very rarely in
the Blue Chip (5.6%) and Standard (4.3%) segments) and occurs in 89% of these cases.
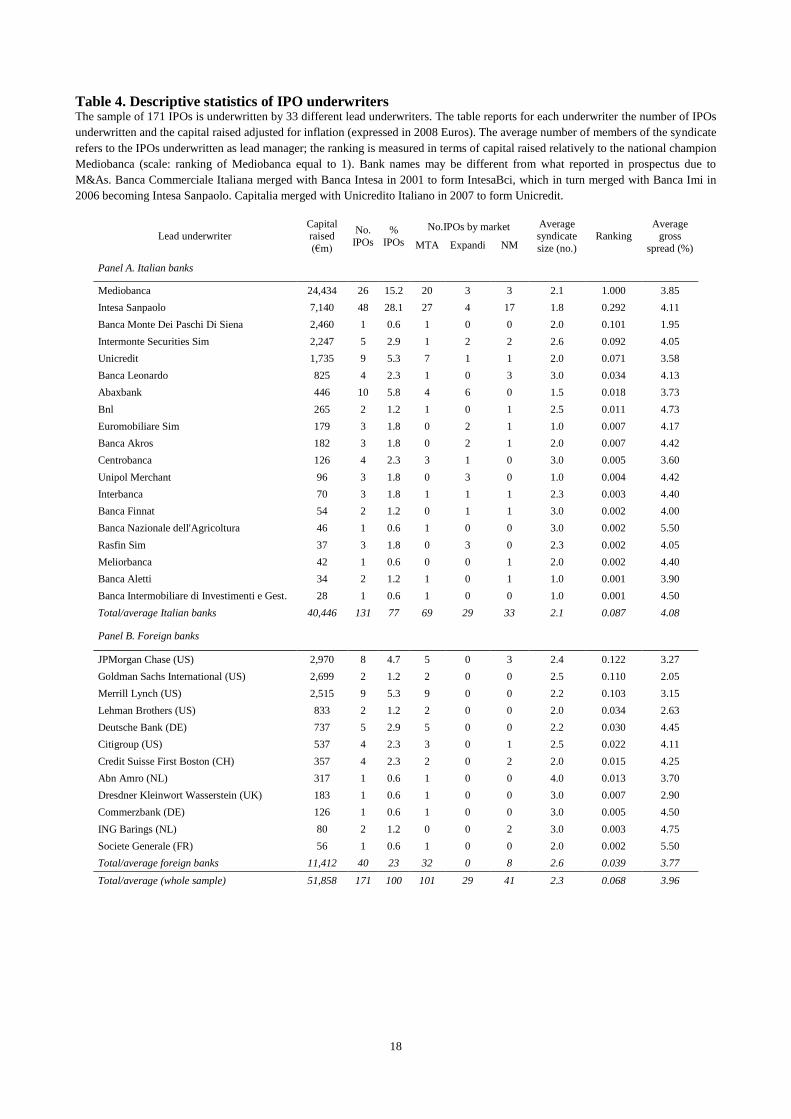
The 171 IPOs of the sample are underwritten by 31 different investment banks, as reported in Table 4. Italian
banks underwrite approximately three quarters of the IPOs in the sample (Panel A of Table 4). Mediobanca
is the national champion, raising the largest amount of capital (24 €m, almost half of the total), while Intesa
7 The average value of the Standard segment is sensibly inflated by the 532.6% of Finmatica, that went public on the
main market in November 24, 1999, and then transferred to the newly launched Nuovo Mercato in October 16, 2000.

8
Sanpaolo is the most active in terms of number of deals (48 IPOs, 28% of the sample). Among foreign
banks, five of the first six underwriters are from the US. These are involved in larger syndicates: the average
size is 2.6, while Italian banks are more willing to operate in smaller groups or often alone. Contrarily to
their domestic behavior and to the results documented by Torstila (2001b), US banks are among the cheapest
when operating in Italy. Their average fees span from 2.05% of Goldman to 4.11% of Citigroup. However,
this evidence is mainly due to the large size of the offers that they underwrite.
[TABLE 4]
4.3 Methodology
We run three types of regressions. First, we use an OLS model to investigate the determinants of fees
charged by underwriters (gross spread). Second, we study the ancillary service of price stabilization. Since
the intensity of this activity is observable only when they decide to intervene, we correct for selection bias by
employing a two-step Heckman procedure. In the first step, the dependent variable is a dummy related to the
underwriter‟s decision. The critical determinant is aftermarket return, that is endogenous since it is in turn
influenced by the underwriter‟s intervention. Thus, we employ a set of instrumental variables related to
market and offer characteristics, aimed at identifying bad performing IPOs8. An analogous selection issue
arises for liquidity support. However, since declaration is not substantiated in only 6 cases, the estimation of
Heckman‟s first step would become ineffective. Thus, we employ a Tobit model.
5 Results
5.1 Gross spread determinants
Table 5 reports the regression results. Predictably, firm and offer characteristics affect the level of
underwriting fees. In particular, there are at least three explanations for the negative impact of size. First,
IPOs have fixed costs such as prospectus preparation, marketing and advisory, that become less significant as
offerings grow larger. Second, issue size is inversely related to IPO riskiness. Third, large IPOs are the most
sought after by investment banks, so competition may result in lower fees. These effects are confirmed by
the negative coefficient of the post-bubble period, when listings of small and risky issuers become less
frequent. Underwriters are paid to be ready to support stock price when needed, since the presence of
stabilization declaration in prospectus raises gross spread. Consequently, issuers have the possibility to
8 These are pre-IPO market return, institutional allocation, price revision and underpricing. We checked the validity of
the instruments by testing their relevance (correlation with the endogenous explanatory variable) and exogeneity (no
correlation with the error terms).

9
choose a cheaper way to go public by renouncing a priori the price stabilization service. Conversely, we find
liquidity support declaration not significant in determining the level of fees.
[TABLE 5]
5.2 Underwriter’s behavior in the aftermarket
We shed light on the underwriters‟ conduct in providing price stabilization and liquidity support. Allocation
devices such as overallotment, naked short position and greenshoe option are critical in defining both the
decision and the extent of price stabilization9. Figure 2 provides a clear picture of how underwriters usually
cover the initial short position. This is expressed in percentage of the actual short position (100%
corresponds to the sum of overallotment and naked short), observations are divided in four groups according
to the number of days in the first month during which the stock price was below the issue price.
[FIGURE 2]
The largest part of the short position is covered using the greenshoe, independently from price trends.
Predictably, price stabilization is heavier in bad performing offers. However, inspection of Figure 2 reveals
that it occurs even when stock price never falls behind the offer level. On average, the combination of
greenshoe and stabilization never covers the exact amount of the short position. This means that underwriters
keep purchasing shares after the first month, or make „pure stabilization‟, i.e. buy shares in excess to what is
strictly required by short covering. The first case should occur when the stock price keeps going down, so
that the underwriter‟s support has to go beyond the overallocated amount. However, such an unpredictable
pattern raises some questions. For instance, underwriters stabilize also well performing offerings, and
exercise the greenshoe option when aftermarket price is lower than the issue price, in both cases bearing
additional costs.
9 Overallotment occurs when the underwriter sells a higher amount of securities than available, by borrowing additional
shares from pre-IPO shareholders. It can be covered by giving back money (greenshoe) and/or shares (stabilization) to
the lenders. In the first case, the underwriter has the possibility to exercise the greenshoe option by one month after the
listing, and pay back the shares at the offer price independently from the current market valuation. In the second case,
the underwriter buys shares from the aftermarket and gives them back to the lenders. A naked short position occurs
when the overallotment is higher than 15% of the offer volume. The presence of a naked short position itself implies
stabilization, since the greenshoe is limited to a maximum of 15% of the offer volume. The greenshoe option and
stabilization are not mutually exclusive tools used to cover overallotment. What determines their adoption is
aftermarket stock price: if it raises, buying shares would be more costly than exercising the greenshoe, whose strike
price is the offer price. Hence, stabilization is typically associated with bad performing offerings in order to prevent
price drops.

10
We empirically investigate underwriters‟ behavior with the aim of clarifying its determinants, using a
Heckman selection model. We use overallotment, naked short and greenshoe dummies to control for short
covering (i.e. “non discretional” stabilization). Other variables such as firm size and offer characteristics are
expected to influence the intensity of the stabilization activity. Results reported in Table 6 show that
underwriters seem to actually support bad performing IPOs. Negative price revision, large shifting of shares
towards retail investors and low underpricing are indeed all associated with a higher probability to be
supported. We argue that offerings with such characteristics will underperform in the aftermarket. The nature
of the underwriter is also influential, since foreign and prestigious underwriters are less prone to stabilize
stock price. Conversely, its remuneration is not important: both gross spread and success fee seem to be
ineffective incentives in increasing the underwriter‟s effort. Surprisingly, overallotment, greenshoe and
naked short dummies are not significant. Although these should be crucial in the stabilization decision (short
covering), results point out that underwriters still act with discretion. The second column documents that
neither offer size nor the extent of the short position (overallotment and naked short) are influential on the
intensity of stabilization. The negative coefficient of the exercised greenshoe confirms instead its
substitutability.
[TABLE 6]
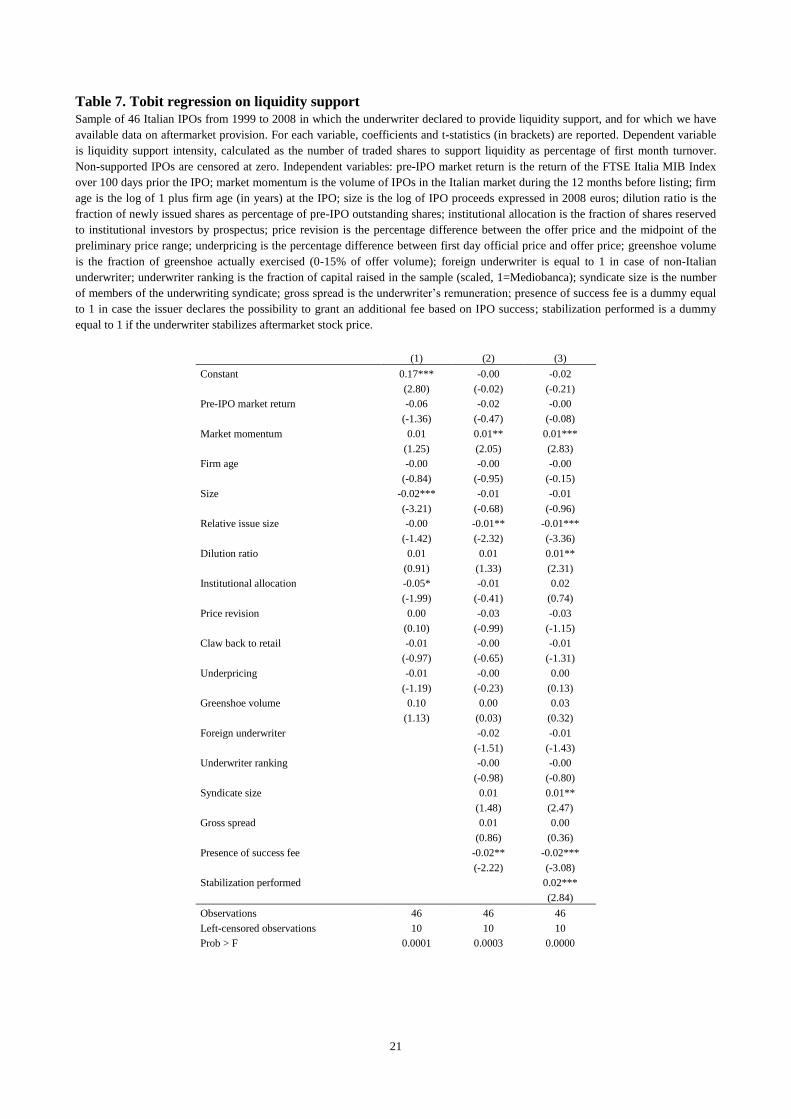
Table 7 reports the results of the Tobit regression models on the provision of liquidity support in the
aftermarket. We find that a positive market momentum is surprisingly associated with a higher probability
and intensity of liquidity support. This may raise an issue of alignment of incentives between the issuer and
the underwriter. Performance-related indicators such as price revision and underpricing do not significantly
impact the provision of this service, as well as the underwriter‟s characteristics. When a success fee is
declared, liquidity support becomes less likely. Finally, the significance of the stabilization dummy
documents a synergy between the two activities: when underwriters engage in price stabilization, they tend
also to support liquidity.
[TABLE 7]

11
6 Conclusions
This paper investigates the relationship between the gross spread paid to IPO underwriters and the level of
service they provide, in a sample of 171 IPOs in Italy from 1999 to 2008. We focus on the level of service
both formally (prospectus declaration) and concretely (aftermarket intervention), and consider two ancillary
services such as price stabilization and liquidity support. Results show that underwriters are paid for their
availability to stabilize stock price, so that issuers can choose a cheaper way to go public by renouncing this
service. On the contrary, liquidity support announcement is not significantly remunerated. We also observe
that underwriters adopt different behaviors in the actual provision of the two services. While only half of the
IPOs with stabilization declaration is then actually supported, almost all liquidity declarations are fulfilled in
the aftermarket. We thus investigate what determines the underwriters‟ decision. In general, they seem to act
according to the issuer‟s interest: IPOs with negative price revision, large claw-backs to retail investors and
low underpricing are the most price-supported. Hence, underwriters sustain IPOs that actually need it. We
also test whether the level of fees anticipates the actual provision of these ancillary services, but results do
not show any predictive power.
This study provides a valuable contribution to the literature on the remuneration of IPO underwriters. While
extensive research in the last decade highlighted the clustering of gross spreads in the US, less effort has
been spent in investigating the variability of European fees. In particular, the relevance of ancillary services
as determinants of fees is still an unexplored issue. Our analysis sheds new light on their role by
documenting a significant impact of the underwriters‟ commitments on the level of fees. This has direct
implications for financial intermediaries. Some of the services they provide are indeed found to increase their
reward, opening a new perspective on the potential sources of market power and differentiation in the
underwriting industry. This study also points out the behavioral patterns followed by underwriters in the
actual provision of these services, opening new potential research directions. For instance, companies going
public can negotiate a contracting scheme that combines the level of fees granted and the services required,
with the aim of effectively aligning the underwriter‟s interest with their own.
12
References
Abrahamson M, Jenkinson T, Jones H (2011) Why Don't U.S. Issuers Demand European Fees for IPOs? The Journal of
Finance 66:2055-2082
Aggarwal R (2000) Stabilization Activities by Underwriters after Initial Public Offerings. The Journal of Finance
55:1075-1103
Allen F, Faulhaber GR (1989) Signalling by underpricing in the IPO market. Journal of Financial Economics 23:303-
323
Beatty RP (1993) The Economic Determinants of Auditor Compensation in the Initial Public Offerings Market. Journal
of Accounting Research 31:294-302
Beatty RP, Ritter JR (1986) Investment banking, reputation, and the underpricing of initial public offerings. Journal of
Financial Economics 15:213-232
Benveniste LM, Spindt PA (1989) How Investment Bankers Determine the Offer Price and Allocation of New Issues.
Journal of Financial Economics 24:343-361
Bertoni F, Lugo S, Giudici G (2008) The Strategic (Re)Allocation of IPO Shares. Working paper, Politecnico di Milano
Carter R, Manaster S (1990) Initial Public Offerings and Underwriter Reputation. Journal of Finance 1045-1067
Chen HC, Ritter JR (2000) The seven percent solution. The Journal of Finance 55:1105-1131
Ellis K, Michaely R, O'Hara M (2000) When the Underwriter Is the Market Maker: An Examination of Trading in the
IPO Aftermarket. The Journal of Finance 55:1039-1074
Fang LH (2005) Investment bank reputation and the price and quality of underwriting services. The Journal of Finance
60:2729-2761
Hansen RS (2001) Do investment banks compete in IPOs?: the advent of the “7% plus contract”. Journal of Financial
Economics 59:313-346
Hoberg G (2007) The underwriter persistence phenomenon. The Journal of Finance 62:1169-1206
Jenkinson T, Jones H (2004) Bids and Allocations in European IPO Bookbuilding. The Journal of Finance 59:2309-
2338
Kim D, Palia D, Saunders A (2010) Are Initial Returns and Underwriting Spreads in Equity Issues Complements or
Substitutes? Financial Management 39:1403-1423
La Porta R, Lopez-De-Silanes F, Shleifer A, Vishny RW (1997) Legal Determinants of External Finance. The Journal
of Finance 52:1131-1150
Lee I, Lochhead S, Ritter J, Zhao Q (1996) The costs of raising capital. Journal of Financial Research 19:59-74
Liu X, Ritter JR (2011) Local underwriter oligopolies and IPO underpricing. Journal of Financial Economics
Ljungqvist A, Wilhelm WJ (2003) IPO Pricing in the Dot-com Bubble. The Journal of Finance 58:723-752
Ljungqvist AP, Jenkinson T, Wilhelm J, William J. (2003) Global Integration in Primary Equity Markets: The Role of
U.S. Banks and U.S. Investors. Review of Financial Studies 16:63-99
Lowry M (2003) Why does IPO volume fluctuate so much? Journal of Financial Economics 67:3-40
13
Lowry M, Shu S (2002) Litigation risk and IPO underpricing. Journal of Financial Economics 65:309-335
Megginson WL, Weiss KA (1991) Venture capitalist certification in initial public offerings. Journal of Finance 879-903
Ritter JR (1987) The costs of going public. Journal of Financial Economics 19:269-281
Ritter JR (2011) Equilibrium in the Initial Public Offerings Market. Annual Review of Financial Economics 3:347-374
Rock K (1986) Why new issues are underpriced. Journal of Financial Economics 15:187-212
Torstila S (2001a) The distribution of fees within the IPO syndicate. Financial Management 25-43
Torstila S (2001b) What determines IPO gross spreads in Europe? European Financial Management 7:523-541
Torstila S (2003) The Clustering of IPO Gross Spreads: International Evidence. Journal of Financial and Quantitative
Analysis 38:673-694
Vismara S, Paleari S, Ritter JR (2012) Europe‟s Second Markets for Small Companies. European Financial
Management , forthcoming.
Yeoman JC (2001) The optimal spread and offering price for underwritten securities. Journal of Financial Economics
62:169-198

14
Table 1. The roles of the underwriting syndicate in Italy
List of activities provided by an underwriting syndicate through the IPO process. The „in charge to‟ column defines whom, among
the members of the underwriting syndicate, is in charge of providing the service, while the last column reports the markets/segments
where the service is compulsory.
Service Description In charge to Compulsory
Panel A: pre-listing activities
Syndicate coordination Coordination of the activities of the underwriting syndicate Lead Underwriter All markets
Due diligence Valuation of going public company as potential investment Lead Underwriter, Sponsor All markets
Pre-IPO marketing Roadshow, meetings between top management and institutional investors Lead Underwriter All markets
Book building Gathering information on institutional demand Lead Underwriter, Specialist All markets
Pricing Definition of the offer price Lead Underwriter All markets
Placement Distribution of shares among investors Lead Underwriter, Sponsor All markets
Panel B: post-listing activities
Underwriting Subscription of the unsold shares in case of incomplete distribution Lead Underwriter None
Liquidity support Posting of bid and ask proposals in the aftermarket Specialist STAR, NM
Price stabilization Purchase of shares in the aftermarket Lead Underwriter None
Reporting Publication of reports and disclosure of price sensitive information Sponsor, Specialist All markets
15
Table 2. Variable definitions
Name Definition Theoretical background
CONTROL DUMMIES
Industry according to the first digit of ICB classification codes; IPO year; privatization/ECOs (higher bargaining power when negotiating gross spread (Torstila 2001b)); market and segment (Star,
Expandi, Nuovo Mercato); private placings (Beatty and Ritter 1986); VC-backing (Megginson and Weiss 1991).
MARKET CONDITIONS
Pre-IPO market return FTSE Italia MIB Index return over 100 days prior the IPO Market returns capture investment opportunities, investor sentiment and other
unknown dynamics (Lowry 2003)
Market momentum IPO volume in the Italian market during the 12 months before listing Favorable market sentiment is expected to ease IPO success
IPO
Firm age Log of 1 plus firm age (in years) at the IPO Higher uncertainty in younger companies
Size Log of IPO proceeds adjusted for inflation, expressed in 2008 Euros Economies of scale on gross spread (Lee et al. 1996)
Relative issue size Number of shares offered over pre-IPO outstanding shares
Dilution ratio Number of newly issued shares over pre-IPO outstanding shares Newly issued shares increase underwriter‟s valuation uncertainty (Yeoman 2001)
Institutional allocation Fraction of shares reserved to institutional investors by prospectus Institutional participation is necessary for an IPO to be successful (Aggarwal 2000)
Price revision Percentage difference between the offer price and the midpoint of the
preliminary price range
Price revision should impound public and private information on investor demand
gathered in the bookbuilding process (Benveniste and Spindt 1989)
Claw back to retail Fraction of shares shifted from institutional to retail investors after the initial
allocation, as percentage of total number of offered shares
Balance of cold demand of informed institutional investors with hot demand of
non-informed retail investors
Underpricing Percentage difference between first day official price and offer price Spread and underpricing can be complementary (Kim et al. 2010)
Greenshoe Dummy equal to 1 in case the greenshoe was exercised Exercised greenshoe is a substitute of price stabilization
UNDERWRITER
Foreign underwriter Dummy for non-Italian lead underwriter US banks underwriting European IPOs are more costly
Underwriter ranking Amount of capital raised by the underwriter over the total capital raised in
the sample (scaled to 1 = national champion Mediobanca)
Reputable banks charge higher fees and provide higher quality services (Fang
2005)
Syndicate size Number of members of the underwriting syndicate Syndicate size is important for the IPO risk sharing (Torstila 2001b).
Success fee Dummy for the presence of success fee Success fee is used to align underwriter and issuers's interests (Ritter 2011)
ANCILLARY SERVICES
Stabilization declaration Dummy equal to 1 in case the underwriter declares in the prospectus its
availability to stabilize stock price
The costs of stabilization are charged back from the underwriting fee by the lead
manager (Torstila 2001a)

16
Liquidity support declaration Dummy equal to 1 in case a specialist is designated in the prospectus to
support aftermarket liquidity
Declaration of additional services should raise fees
Stabilization performed Dummy equal to 1 in case the underwriter stabilizes aftermarket stock price Price support gives underwriters the incentive to reduce the ex-ante price risk of
IPOs
Liquidity support performed Dummy equal to 1 in case the specialist supports aftermarket liquidity Aftermarket trading activity is on average profitable for underwriters (Ellis et al.
2000)
Stabilization missing Dummy equal to 1 in case price stabilization was declared in prospectus but
not performed in the aftermarket
Liquidity support missing Dummy equal to 1 in case liquidity support was declared in prospectus but
not performed in the aftermarket
Overallotment Dummy equal to 1 in case the underwriter allocates more shares than offered
by the issuer
Critical determinant for the decision to provide aftermarket support
Naked short Dummy equal to 1 in case the underwriter overallocates more than 15% of
the offer volume
Critical determinant for the decision to provide aftermarket support
Overallotment volume Amount of shares over-allocated, as percentage of offer volume Critical determinant for the intensity of aftermarket support
Greenshoe volume Fraction of greenshoe actually exercised (0-15% of offer volume) Critical determinant for the intensity of aftermarket support
Naked short volume Fraction of over-allocated shares exceeding the 15% threshold Critical determinant for the intensity of aftermarket support
17
Table 3. Descriptive statistics of the sample Average and median values (in brackets) of the sample of 171 Italian IPOs from 1999 to 2008. Panel A: gross spread is the
underwriter‟s remuneration; success fee is an additional fee granted by the issuer in case of successful IPO (declared in 36 cases).
Both are in percentage of IPO proceeds. Panel B: pre-IPO market return is the percentage return calculated on the 100 days before
listing date; market momentum is the number of IPOs listed in Italy in the 12 months before the IPO; firm age is the age in years of
the company at the IPO; size is the amount of proceeds in 2008 Euros; relative issue size is the fraction of offered shares as
percentage of pre-IPO outstanding shares; dilution ratio is the percentage of newly issued shares over the pre-IPO outstanding shares;
institutional allocation is the fraction of shares reserved to institutional investors by prospectus; price revision is the percentage
difference between offer price and midpoint of price range; claw back to retail is the number of shares shifted from institutional to
retail investors after the prospectus declaration (allocation revision), as percentage of the offer volume; underpricing is the percentage
difference between offer price and first day official price; greenshoe is a dummy equal to 1 in case the greenshoe was exercised;
foreign underwriter is equal to 1 in case of non-Italian underwriter; underwriter ranking is the fraction of capital raised in the sample,
scaled at 1 for the national champion Mediobanca; syndicate size is the number of members of the underwriting syndicate. Panel C:
stabilization declared includes IPOs for which the underwriter declared its availability to stabilize aftermarket price; stabilization
performed includes actually stabilized IPOs (percentage is calculated on the previous variable); liquidity support declared includes
IPOs for which a specialist was designated; liquidity support performed includes actually liquidity-supported IPOs (percentage is
calculated on the previous variable). Data on actual liquidity support are available for 46 of 87 IPOs for which a specialist was
designated (29 of 32 IPOs in the Star segment). a percentage of firms
ALL SAMPLE (171 IPOs)
MTA (101 IPOs) EXPANDI (29 IPOs)
NUOVO
MERCATO
(41 IPOs) BLUE CHIP(18) STANDARD(46) STAR(37)
Panel A. Fees
Gross spread (%) 3.92 (4.00) 2.82 (2.70) 3.69 (3.70) 3.52 (3.50) 3.96 (3.90) 4.75 (4.70)
Success fee (%) 0.64 (0.50) 0.55 (0.50) 0.81 (0.75) 0.70 (0.50) 0.63 (0.50) 0.40 (0.50)
Panel B. Descriptive statistics
Pre-IPO market return (%) 0.9 (1.6) 0.7 (2.9) -0.3 (-0.6) 3.0 (3.4) 0.6 (3.3) 0.6 (-2.4)
Market momentum (no. IPOs) 24 (23) 21 (18) 24 (22) 20 (20) 19 (21) 32 (33)
Firm age (years) 32 (19) 41 (32) 49 (26) 36 (32) 27 (20) 10 (8)
Size (€m) 262 (81) 1460 (388) 191 (93) 118 (111) 33 (22) 109 (45)
Relative issue size (%) 101.7 (38.8) 37.6 (38.7) 265.2 (38.3) 49.3 (45.2) 41.3 (37.8) 37.7 (31.0)
Dilution ratio (%) 26.5 (25.5) 12.3 (7.1) 24.9 (25.0) 25.5 (25.7) 30.8 (30.0) 32.2 (28.3)
Institutional allocation (%) 74.9 (75.0) 70.5 (74.5) 70.9 (75.0) 77.9 (75.0) 86.4 (86.4) 70.5 (70.0)
Price revision (%) 28.8 (35.1) 33.2 (34.1) 38.9 (50.0) 22.4 (26.8) 33.7 (31.7) 18.4 (46.9)
Claw back to retail (%) 5.5 (1.0) 9.0 (4.3) 6.4 (3.2) 4.3 (0.9) 4.2 (0.0) 4.8 (0.9)
Underpricing (%) 12.4 (3.5) 3.2 (2.1) 17.0 (2.5) 3.2 (1.0) 9.4 (5.8) 21.7 (4.2)
Greenshoe a 61.4 88.9 50.0 72.9 79.3 39.0
Foreign underwriter a 23 38.9 23.9 29.7 0.0 24.4
Underwriter ranking 0.2 (0.1) 0.4 (0.1) 0.2 (0.1) 0.3 (0.1) 0.2 (0.0) 0.1 (0.0)
Syndicate size (no.) 2.1 (2.0) 2.3 (2.0) 2.0 (2.0) 2.1 (2.0) 1.7 (1.0) 2.3 (2.0)
Panel C. Ancillary services
Stabilization declared a 97.7 100.0 91.3 100.0 100.0 100.0
Stabilization performed a 55.7 66.7 61.0 51.4 34.5 65.9
Liquidity support declared a 50.9 5.6 4.3 100.0 48.3 100.0
Liquidity support performed a 89.1 0.0 0.0 93.1 92.9 n.a.
18
Table 4. Descriptive statistics of IPO underwriters The sample of 171 IPOs is underwritten by 33 different lead underwriters. The table reports for each underwriter the number of IPOs
underwritten and the capital raised adjusted for inflation (expressed in 2008 Euros). The average number of members of the syndicate
refers to the IPOs underwritten as lead manager; the ranking is measured in terms of capital raised relatively to the national champion
Mediobanca (scale: ranking of Mediobanca equal to 1). Bank names may be different from what reported in prospectus due to
M&As. Banca Commerciale Italiana merged with Banca Intesa in 2001 to form IntesaBci, which in turn merged with Banca Imi in
2006 becoming Intesa Sanpaolo. Capitalia merged with Unicredito Italiano in 2007 to form Unicredit.
Lead underwriter Capital raised
(€m)
No.
IPOs
%
IPOs
No.IPOs by market Average syndicate
size (no.)
Ranking Average
gross
spread (%) MTA Expandi NM
Panel A. Italian banks
Mediobanca 24,434 26 15.2 20 3 3 2.1 1.000 3.85
Intesa Sanpaolo 7,140 48 28.1 27 4 17 1.8 0.292 4.11
Banca Monte Dei Paschi Di Siena 2,460 1 0.6 1 0 0 2.0 0.101 1.95
Intermonte Securities Sim 2,247 5 2.9 1 2 2 2.6 0.092 4.05
Unicredit 1,735 9 5.3 7 1 1 2.0 0.071 3.58
Banca Leonardo 825 4 2.3 1 0 3 3.0 0.034 4.13
Abaxbank 446 10 5.8 4 6 0 1.5 0.018 3.73
Bnl 265 2 1.2 1 0 1 2.5 0.011 4.73
Euromobiliare Sim 179 3 1.8 0 2 1 1.0 0.007 4.17
Banca Akros 182 3 1.8 0 2 1 2.0 0.007 4.42
Centrobanca 126 4 2.3 3 1 0 3.0 0.005 3.60
Unipol Merchant 96 3 1.8 0 3 0 1.0 0.004 4.42
Interbanca 70 3 1.8 1 1 1 2.3 0.003 4.40
Banca Finnat 54 2 1.2 0 1 1 3.0 0.002 4.00
Banca Nazionale dell'Agricoltura 46 1 0.6 1 0 0 3.0 0.002 5.50
Rasfin Sim 37 3 1.8 0 3 0 2.3 0.002 4.05
Meliorbanca 42 1 0.6 0 0 1 2.0 0.002 4.40
Banca Aletti 34 2 1.2 1 0 1 1.0 0.001 3.90
Banca Intermobiliare di Investimenti e Gest. 28 1 0.6 1 0 0 1.0 0.001 4.50
Total/average Italian banks 40,446 131 77 69 29 33 2.1 0.087 4.08
Panel B. Foreign banks
JPMorgan Chase (US) 2,970 8 4.7 5 0 3 2.4 0.122 3.27
Goldman Sachs International (US) 2,699 2 1.2 2 0 0 2.5 0.110 2.05
Merrill Lynch (US) 2,515 9 5.3 9 0 0 2.2 0.103 3.15
Lehman Brothers (US) 833 2 1.2 2 0 0 2.0 0.034 2.63
Deutsche Bank (DE) 737 5 2.9 5 0 0 2.2 0.030 4.45
Citigroup (US) 537 4 2.3 3 0 1 2.5 0.022 4.11
Credit Suisse First Boston (CH) 357 4 2.3 2 0 2 2.0 0.015 4.25
Abn Amro (NL) 317 1 0.6 1 0 0 4.0 0.013 3.70
Dresdner Kleinwort Wasserstein (UK) 183 1 0.6 1 0 0 3.0 0.007 2.90
Commerzbank (DE) 126 1 0.6 1 0 0 3.0 0.005 4.50
ING Barings (NL) 80 2 1.2 0 0 2 3.0 0.003 4.75
Societe Generale (FR) 56 1 0.6 1 0 0 2.0 0.002 5.50
Total/average foreign banks 11,412 40 23 32 0 8 2.6 0.039 3.77
Total/average (whole sample) 51,858 171 100 101 29 41 2.3 0.068 3.96

19
Table 5. Determinants of gross spread Sample of 171 Italian IPOs from 1999 to 2008. Gross spread in percentage of IPO proceeds is the dependent variable. Control
dummies (coefficients not reported for brevity): industry, year, privatizations, ECOs, private placings, markets, VC-backing.
Independent variables: post-bubble is a dummy equal to 1 in case the IPO occurred after the internet bubble, i.e. from 2001; pre-IPO
market return is the return of the FTSE Italia MIB Index over 100 days prior the IPO; market momentum is the volume of Italian
IPOs in the 12 months before listing; firm age is ln(1+firm age at the IPO); size is the log of IPO proceeds expressed in 2008 Euros;
relative issue size is the offer volume in percentage of pre-IPO outstanding shares; dilution ratio is the fraction of newly issued shares
as percentage of pre-IPO outstanding shares; institutional allocation is the fraction of shares reserved to institutional investors by
prospectus; price revision is the percentage difference between offer price and midpoint of the price range; claw back to retail
investors is the fraction of shares shifted from institutional to retail investors, as percentage of the offer volume; underpricing is the
percentage difference between first day price and offer price; greenshoe is a dummy equal to 1 in case the greenshoe was exercised;
foreign underwriter is equal to 1 in case of non-Italian underwriter; underwriter ranking is the fraction of capital raised in the sample
(scaled, 1=Mediobanca); syndicate size is the no. of members in the underwriting syndicate; stabilization declaration is a dummy
equal to 1 in case the underwriter declares the availability to stabilize stock price; liquidity support declaration is a dummy equal to 1
if a specialist is designated; stabilization (liquidity support) missing is a dummy equal to 1 in case stabilization (liquidity support)
was declared but not performed. Coefficients and t-statistics (in brackets) are reported. T-statistics are computed using White‟s
(1980) heteroskedasticity-consistent standard errors.
(1) (2) (3)
Constant -15.03 -14.72 -16.17
(-1.36) (-1.31) (-1.37)
Post-bubble -0.10*** -0.12*** -0.12**
(-2.82) (-3.01) (-2.51)
Pre-IPO market return -0.22 -0.20 -0.17
(-0.96) (-0.96) (-0.83)
Market momentum 0.00 0.00 0.00
(1.65) (1.39) (1.15)
Firm age -0.00 -0.00 -0.00
(-0.18) (-0.23) (-0.27)
Issue size -0.14*** -0.16*** -0.17***
(-5.10) (-4.87) (-4.83)
Relative issue size 0.01** 0.01*** 0.01***
(2.46) (2.71) (3.81)
Dilution ratio 0.00 0.00 0.00
(0.44) (0.59) (0.41)
Institutional allocation -0.22* -0.22* -0.23*
(-1.78) (-1.96) (-1.95)
Price revision 5.14 5.10 5.50
(1.60) (1.56) (1.60)
Claw back to retail -0.08 -0.10 -0.13*
(-1.05) (-1.38) (-1.68)
Underpricing -0.05** -0.04** -0.04*
(-2.41) (-2.14) (-1.95)
Greenshoe -0.01 -0.02 -0.03
(-0.50) (-0.85) (-1.01)
Foreign underwriter
0.02 0.01
(0.55) (0.45)
Underwriter ranking
0.10* 0.10*
(1.67) (1.70)
Syndicate size
0.01 0.00
(0.37) (0.01)
Stabilization declaration
0.11**
(2.15)
Liquidity support declaration
-0.01
(-0.27)
Stabilization missing
-0.02
(-0.75)
Liquidity support missing
-0.09
(-1.05)
Observations 171 171 171
Adjusted R-squared 0.54 0.56 0.56

20
Table 6. Heckman selection model on stabilization activity Sample of 167 Italian IPOs from 1999 to 2008 in which the underwriter declared to stabilize stock price if needed. Coefficients and
z-statistics (in brackets) are reported. Stabilization dummy (1 in case the underwriter stabilizes aftermarket stock price) and
stabilization intensity (number of traded shares to stabilize stock price as percentage of first month turnover) are the dependent
variables in step 1 and 2 respectively. Control dummies (coefficients not reported for brevity): industry, year, privatizations, ECOs,
private placings, markets, VC-backing. Independent variables: pre-IPO market return, market momentum, firm age, size, relative
issue size, dilution ratio, institutional allocation, price revision, claw back to retail investors, underpricing, foreign underwriter,
underwriter ranking, syndicate size, gross spread, presence of success fee are the same as defined in Table 5. Overallotment is a
dummy equal to 1 in case of overallotment; greenshoe is a dummy equal to 1 in case the greenshoe was exercised; naked short is a
dummy equal to 1 in case the underwriter overallocates more than 15% of the offer volume; overallotment volume is the
overallocated volume in percentage of offer volume; greenshoe volume is the fraction of greenshoe exercised (0-15% of offer
volume); naked short volume is the amount of naked short in percentage of offer volume.
Step 1. Stabilization decision Step 2. Stabilization intensity
Constant -0.63 -0.31
(-0.38) (-0.81)
Pre-IPO market return -1.34
(-0.70)
Market momentum 0.25
(0.99)
Firm age
0.03
(1.31)
Size
0.06
(1.29)
Relative issue size
-0.08
(-0.50)
Dilution ratio
0.25
(1.52)
Institutional allocation -1.65
(-1.18)
Price revision -2.85***
(-2.82)
Claw back to retail 2.25**
(1.99)
Underpricing -1.77***
(-2.82)
Foreign underwriter -0.62*
(-1.79)
Underwriter ranking -1.10**
(-2.41)
Syndicate size 0.20
(1.23)
Gross spread -0.15
(-0.92)
Presence of success fee 0.46
(1.54)
Overallotment dummy -0.08
(-0.14)
Greenshoe dummy -0.10
(-0.17)
Naked short dummy 0.95
(1.50)
Overallotment volume
-0.50
(-1.50)
Greenshoe volume
-0.81**
(-2.01)
Naked short volume
1.42
(0.67)
Observations 167
Censored 74
Wald Chi-square 47.3
21
Table 7. Tobit regression on liquidity support
Sample of 46 Italian IPOs from 1999 to 2008 in which the underwriter declared to provide liquidity support, and for which we have
available data on aftermarket provision. For each variable, coefficients and t-statistics (in brackets) are reported. Dependent variable
is liquidity support intensity, calculated as the number of traded shares to support liquidity as percentage of first month turnover.
Non-supported IPOs are censored at zero. Independent variables: pre-IPO market return is the return of the FTSE Italia MIB Index
over 100 days prior the IPO; market momentum is the volume of IPOs in the Italian market during the 12 months before listing; firm
age is the log of 1 plus firm age (in years) at the IPO; size is the log of IPO proceeds expressed in 2008 euros; dilution ratio is the
fraction of newly issued shares as percentage of pre-IPO outstanding shares; institutional allocation is the fraction of shares reserved
to institutional investors by prospectus; price revision is the percentage difference between the offer price and the midpoint of the
preliminary price range; underpricing is the percentage difference between first day official price and offer price; greenshoe volume
is the fraction of greenshoe actually exercised (0-15% of offer volume); foreign underwriter is equal to 1 in case of non-Italian
underwriter; underwriter ranking is the fraction of capital raised in the sample (scaled, 1=Mediobanca); syndicate size is the number
of members of the underwriting syndicate; gross spread is the underwriter‟s remuneration; presence of success fee is a dummy equal
to 1 in case the issuer declares the possibility to grant an additional fee based on IPO success; stabilization performed is a dummy
equal to 1 if the underwriter stabilizes aftermarket stock price.
(1) (2) (3)
Constant 0.17*** -0.00 -0.02
(2.80) (-0.02) (-0.21)
Pre-IPO market return -0.06 -0.02 -0.00
(-1.36) (-0.47) (-0.08)
Market momentum 0.01 0.01** 0.01***
(1.25) (2.05) (2.83)
Firm age -0.00 -0.00 -0.00
(-0.84) (-0.95) (-0.15)
Size -0.02*** -0.01 -0.01
(-3.21) (-0.68) (-0.96)
Relative issue size -0.00 -0.01** -0.01***
(-1.42) (-2.32) (-3.36)
Dilution ratio 0.01 0.01 0.01**
(0.91) (1.33) (2.31)
Institutional allocation -0.05* -0.01 0.02
(-1.99) (-0.41) (0.74)
Price revision 0.00 -0.03 -0.03
(0.10) (-0.99) (-1.15)
Claw back to retail -0.01 -0.00 -0.01
(-0.97) (-0.65) (-1.31)
Underpricing -0.01 -0.00 0.00
(-1.19) (-0.23) (0.13)
Greenshoe volume 0.10 0.00 0.03
(1.13) (0.03) (0.32)
Foreign underwriter
-0.02 -0.01
(-1.51) (-1.43)
Underwriter ranking
-0.00 -0.00
(-0.98) (-0.80)
Syndicate size
0.01 0.01**
(1.48) (2.47)
Gross spread
0.01 0.00
(0.86) (0.36)
Presence of success fee
-0.02** -0.02***
(-2.22) (-3.08)
Stabilization performed
0.02***
(2.84)
Observations 46 46 46
Left-censored observations 10 10 10
Prob > F 0.0001 0.0003 0.0000

22
Figure 1. Gross spread distribution by country The graph plots the distribution of gross spreads of the IPOs from 1999 to 2008. The US sample includes all IPOs except unit offers,
American Depository Receipts, closed-end funds, Real Estate Investment Trusts, bank and S&L IPOs, limited partnerships and IPOs
with proceeds below $20 millions, because the compensation in small offerings is much higher due to the diseconomies of scale. The
European sample includes IPOs listed in Milan, London, Frankfurt and Euronext, both in main and second markets, with proceeds of
at least €15 millions. US data are from Jay Ritter‟s website and Abrahamson et al. (2011), European data are from the EurIPO
database. The number of observations (IPOs) is reported below the country labels. On each grey box, the black central mark is the
median, the edges of the box are the 25th and 75th percentiles, and the dots represent maximum and minimum values.

23
Figure 2. Short covering activity by underwriters The graph shows how the short position taken by underwriters is covered. Dark grey is the fraction covered by greenshoe option,
light grey is the fraction covered by price stabilization. Y-axis reports the percentage of initial short position, where 100% is the sum
of overallotment and naked short if present. Groups on the x-axis refer to the number of days in which the official daily price of the
stocks was below the offer price, during the first month of trading.