are international fund flows related to exchange rate ...€¦ · brooks et al. (2004) conclude...
TRANSCRIPT

University of Groningen
Are international fund flows related to exchange rate dynamics?Li, Suxiao; de Haan, Jakob; Scholtens, Bert
Published in:Open Economies Review
DOI:10.1007/s11079-017-9469-5
IMPORTANT NOTE: You are advised to consult the publisher's version (publisher's PDF) if you wish to cite fromit. Please check the document version below.
Document VersionPublisher's PDF, also known as Version of record
Publication date:2018
Link to publication in University of Groningen/UMCG research database
Citation for published version (APA):Li, S., de Haan, J., & Scholtens, B. (2018). Are international fund flows related to exchange rate dynamics?Open Economies Review, 29(1), 31-48. https://doi.org/10.1007/s11079-017-9469-5
CopyrightOther than for strictly personal use, it is not permitted to download or to forward/distribute the text or part of it without the consent of theauthor(s) and/or copyright holder(s), unless the work is under an open content license (like Creative Commons).
Take-down policyIf you believe that this document breaches copyright please contact us providing details, and we will remove access to the work immediatelyand investigate your claim.
Downloaded from the University of Groningen/UMCG research database (Pure): http://www.rug.nl/research/portal. For technical reasons thenumber of authors shown on this cover page is limited to 10 maximum.
Download date: 26-05-2020

RESEARCH ARTICLE
Are International Fund Flows Related to Exchange RateDynamics?
Suxiao Li1,2,3 & Jakob de Haan2,4,5&
Bert Scholtens2,6
Published online: 19 October 2017# The Author(s) 2017. This article is an open access publication
Abstract Employing monthly data for 53 countries between 1996 and 2015, weinvestigate the relationship between international fund flows and exchange rate dy-namics. We find strong co-movement between funds flows (as measured with theEPFR Global data base) and bilateral real exchange rates vis-à-vis the USD. This holdsboth for equity flows and bond flows. However, bond flows have a more significantrelationship with RER appreciation than equity flows in developing countries, while indeveloped countries equity flows play a more important role. Under a more flexibleexchange rate regime the real exchange rate appreciation associated with fund flows ishigher.
Keywords International fund flows . Exchange rates . Exchange rate regime . Dynamicpanel data model
JEL Classification E44 . F30 . F31 . G15 . G23
Open Econ Rev (2018) 29:31–48DOI 10.1007/s11079-017-9469-5
* Suxiao [email protected]
1 Postdoctoral workstation, Industrial and Commercial Bank of China, Taipingqiao Street No. 96,Xicheng District, Beijing, China
2 University of Groningen, Groningen, the Netherlands3 School of Economics and Management, University of Chinese Academy of Sciences, Beijing,
China4 De Nederlandsche Bank, Amsterdam, the Netherlands5 CESifo, Munich, Germany6 University of Saint Andrews, Scotland, UK

1 Introduction
Explaining exchange rate dynamics has been an important issue in internationalfinance since the breakdown of the Bretton Woods System (De Grauwe andDewachter 1993; Williamson 2009; An and Wang 2012; Balke et al. 2013;Tang and Zhou 2013). Due to their significant increase during the past fewdecades, the role of international capital flows in exchange rate dynamicsreceived considerable attention in this line of literature (see, for instance,Brooks et al. 2004; Calvo et al. 1993; Caporale et al. 2015; Combes et al.2012; Jongwanich and Kohpaiboon 2013; Gyntelberg et al. 2014; Kosteletouand Liargovas 2000).1 There is evidence that large capital inflows lead to realexchange rate appreciation, but not all types of capital flows may have thesame effects (Combes et al. 2012). This paper investigates the relationshipbetween one type of international capital flows, namely international fundflows, and exchange rate dynamics.
International fund flows are cross-border investments in domestic equity and bondinstruments by global funds, including mutual funds, exchange traded funds (ETFs),closed-end funds, insurance-linked funds and hedge funds (Li et al. 2015). We focus oninternational fund flows for the following reasons. First, due to increased financialintegration and capital market liberalization, international fund flows have increasedrapidly since the 1990s. The assets under management by international funds (coveredby the EPFR Global database) increased more than 150 times, expanding from 0.15trillion US dollars in 2000 to 25 trillion US dollars in 2015. Compared with long-termcapital flows, fund flows are more volatile and play an increasingly important role inthe transmission of shocks (Jinjarak et al. 2011; Raddatz and Schmukler 2012; Gelos2013). Given the rapid incrase and high volatility of fund flows, it is of great academicand policy relevance to investigate their impact on exchange rate dynamics. Second,existing studies suggest that financial portfolio investments play a more important rolein exchange rate dynamics than other types of capital flows such as FDI and bank loans(Combes et al. 2012; Jongwanich and Kohpaiboon 2013). International fund flows aremainly portfolio investments.
The following questions are addressed in this research: (i) What is the relationshipbetween international fund flows and real exchange rate (RER) dynamics? (ii) Is thisrelationship different for developed and developing countries? To answer these ques-tions, we employ dynamic panel data models. We use fund flow data from the EPFRGlobal database. These data are monthly, which enables us to detect the influence offund flows on exchange rate dynamics very accurately. Our sample consists of 53countries over the period from January 1996 to June 2015, including 18 developingcountries and 35 developed countries.
We find strong evidence for co-movement between fund flows and bilateral realexchange rates vis-à-vis the USD. This holds both for equity flows and bond flows.However, bond flows have a more significant relationship with RER appreciation thanequity flows in developing countries, while in developed countries equity flows play amore important role. We also examine the role of the exchange rate regime and
1 International capital flows (measured as the sum of all capital inflows) rose from less than 7% of world GDPin the 1990s to over 20% in 2007 (Milesi-Ferretti and Tille 2011).
32 S. Li et al.

financial openness.2 Our results suggest that under a more flexible exchange rate theRER appreciation associated with fund inflows is higher, both for equity and bondflows. Furthermore, we find that the coefficient on equity flows tends to be higher incountries with high financial openness, while the coefficient on bond flows is smaller inthese countries.
The rest of the paper is organized as follows. Section 2 briefly discusses relatedstudies. Section 3 describes the data. Section 4 examines whether fund flows are relatedto exchange rate dynamics and section 5 investigates the role of the exchange rateregime and financial openness in this relationship. Section 6 concludes.
2 Related Literature
Two strands of literature are related to our research: (i) studies on the impact ofinternational capital flows on exchange rates; and (ii) research on fund flows.
2.1 Literature on Capital Flows and Exchange Rates
Several studies have examined the role of capital flows in determining exchange rates.For example, Calvo et al. (1993) find that capital inflows to Latin American in the late1980s and early 1990s are associated with a real exchange rate appreciation and withincreased exchange rate volatility. Subsequent studies have examined the impact ofdifferent types of international capital flows. For instance, using bilateral exchangerates of the euro and the Japanese yen against the US dollar from 1988Q1 to 2000 Q3,Brooks et al. (2004) conclude that portfolio flows from the euro area to US stockmarkets closely track the movements between the euro and the US dollar, while FDIflows appear to be less important. Jongwanich and Kohpaiboon (2013) reach a similarconclusion using data of Asian emerging countries during 2000 to 2009. Given theimportant role of portfolio investments, it is surprising that only few studies focus onthe role of portfolio equity and bond flows in exchange rate dynamics. A noteworthyexception is the work by Caporale et al. (2015). Employing monthly bilateral data forUS vis-à-vis eight Asian emerging countries, they find that equity inflows tend to leadto high exchange rate volatility. So this suggests that equity and bond flows may have adifferent impact on exchange rate dynamics. In our study, we differentiate between bothtypes of fund flows.
2.2 Literature on Fund Flows
International fund flows have been examined in several studies. These studiescan be divided into two groups: fund-level studies and country-level studies.Fund-level studies focus on the money flowing into or out of each fund,whereas country-level studies concentrate on aggregated funds flowing into orout of a country.
2 Combes et al. (2012) analyze the impact of capital inflows on the real effective exchange rate for a sample of42 emerging and developing countries over the period 1980–2006 and find that a more flexible exchange ratecould dampen the exchange rate appreciation associated with capital inflows.
Are International Fund Flows Related to Exchange Rate Dynamics? 33

An example of the first group of studies is the work by Raddatz and Schmukler(2012). They find that investors and fund managers show pro-cyclical behavior, whichhelps transmit crises across countries. Investors tend to pull out of funds that invest incountries undergoing crises and invest more in funds when conditions in their countryof origin improve.
An example of the second group is the work by Fratzscher (2012) who investigatespush and pull factors driving fund flows based on a sample of 50 countries. He findsthat common shocks (push factors) exert a larger effect on fund flows than domesticshocks (pull factors), especial in crisis periods.
In contrast to these studies, this paper investigates the relationship between interna-tional fund flows and exchange rate dynamics, which has, to the best of our knowledge,not been examined before.
3 Data
3.1 Data on International Fund Flows
Our data for international fund flows come from EPFR Global, which tracks theasset allocations of more than 62,500 funds globally (as of September 15th, 2014).3
The database offers a wide industry and geographic coverage and data are reported at ahigh frequency (daily, weekly and monthly). It tracks around 98%–99% of emergingmarket equity funds, over 95% of ETF assets globally, around 90% of funds in USAand 70%–75% of funds in developed European markets.4
International fund flows have increased rapidly since the 1990s. During that time,industrial countries deregulated their financial markets. Emerging markets also in-creased their capital and trade openness, which have rendered them more attractive tointernational investors (Gelos 2013). These reforms made it easier for foreign investorsto access the local market and for domestic investors to allocate their assets globally(Bekaert and Harvey 1998; Gelos 2013). Consequently, the volume of internationalfund flows surged over the last two decades. As shown in Fig. 1, assets undermanagement by international funds (covered by the EPFR Global database) increasedmore than 150 times, expanding from 0.15 trillion US dollars in 2000 to 25 trillion USdollars in 2015. Notably the volume of equity flows increased from less than onebillion US dollars in 2000 to 77.4 billion US dollars in 2013.
Depending on their investment target, funds can be classified as equity funds, bondfunds, money market funds, balanced funds and alternative funds. Due to data limita-tions, we only use the fund flows of equity funds (equity flows for short) and bondfunds (bond flows for short), which accounts for more than 70% of assets under
3 Some previous studies also used this database (cf. Jinjarak et al. 2011; Fratzscher 2012; Raddatz andSchmukler 2012; Yeyati and Williams 2012; and Puy 2016). Using data for 29 major emerging markets from2005 to 2013, Moussavi (2014) concludes that trends in EPFR Global data largely coincide with trends ingross portfolio capital flows recorded by Balance of Payment statistics.4 The coverage of EPFR Global has increased over the past two decades. Although the coverage of EPFRGlobal is limited at the very beginning, it is still representative for the fund flow trends. Based on data for 29major emerging markets from 2005 to 2013, Moussavi (2014) concludes that trends in EPFR Global datalargely coincide with trends in gross portfolio capital flows recorded by Balance of Payment statistics.
34 S. Li et al.

management by all funds. These flows capture the inflows (outflows) of equity/bondfunds into (out of) a specific country. Following Puy (2016), we scale the fund flows byasset under management (AUM) of each receiving county, which reports the total assetsinvested in the receiving country by all funds. (In some of our robustness checks wescale fund flows by GDP, which does not affect our findings in a qualitative way.)
We first clean the data. We excluded countries with less than 24 continuousobservations and countries whose assets are less than five million U.S. dollars. Wedelete countries for which macroeconomic data are not available and we omit theUnited States, because the U.S. dollar is used as reference to calculate the real exchangerate. As a result, we end up with 53 countries in our sample, for the period January1996 to June 2015 for equity flows and for January 2004 to June 2015 for bond flows.The countries in our sample are listed in Appendix Table 8.
3.2 Data on Exchange Rates
We employ countries’ bilateral real exchange rate vis-à-vis the U.S. dollar. We definethe bilateral RER (domestic currency against the U.S. dollar) as follows:
RERd=/ ¼NERd=/*CPIUS
CPId;
where NERd/$ is the nominal exchange rate (measured as the domestic currency perU.S. dollar), CPIUS and CPId are the Consumer Price Index of the U.S. and domesticcountries, respectively. An increase of RERd/$ indicates a depreciation of the domesticcurrency. The log change of the real exchange rate is employed in the empirical models.
3.3 Real Exchange Rate and Fund Flow Nexus: a First Look at the Data
Figure 2 shows fund flows (scaled by AUM) and the RER for a few selected countries.The figure suggests that, generally, fund inflows are associated with an appreciation ofthe RER. For example, in Brazil the strong increase in fund inflows during 2003–2007
Fig. 1 Total net asset of funds covered by EPFR Global (USD trillions)
Are International Fund Flows Related to Exchange Rate Dynamics? 35

is accompanied by an appreciation of Brazil’s RER in the same period. During theGlobal Financial Crisis, global funds tended to withdraw their investments in Braziland the Real depreciated suddenly and sharply at the same time. Afterwards, fund flowsreturned which coincided with a real appreciation of the Brazilian exchange rate. In2013 and 2014, the economic downturn in Brazil led to large-scale outflows of fundinvestments, which was accompanied by a real depreciation of the Real. The experienceof Canada, Korea, and India confirm that fund inflows (outflows) are associated with acurrency appreciation (depreciation).
Table 1 shows the accumulated change of the RER during periods with fund inflowsand fund outflow for some major developing and developed economies. The tablesuggests that in periods with fund inflows the RER generally appreciates, whereas inperiods with fund outflows the RER depreciates; this holds true especially for equityflows. There are exceptions, though. For instance, the Chinese Renminbi con-tinued to appreciate both in periods with equity inflows and equity outflows.However, the accumulated real appreciation of the Chinese currency is larger inperiods with equity inflows.
In the following sections, we further investigate the relationship betweenfund flows and exchange rate dynamics using econometric models. We alsoexamine whether this relationship differs across developed and developingcountries and across countries with different exchange rate regimes and withdifferent levels of financial openness.
Fig. 2 Fund flows and real exchange rates in some selected countries
36 S. Li et al.

4 Empirical Results
4.1 Model
A dynamic panel data model is employed to investigate the relationship between fundflows and real exchange rates. The dependent variable is the log change of RER, asdescribed in section 3.2. The explanatory variables of interest are equity flows (EF) andbond flows (BF). The results of Jongwanich and Kohpaiboon (2013) suggest that anincrease in portfolio capital flows and bank loans quickly results in a real exchange rateappreciation, while the effect of FDI occurs with a lag. We therefore include contem-poraneous fund flows as well as lagged fund flows in the model. The dynamic paneldata model is as follows:
si;t ¼ ∑mj¼1α jsi;t− j þ β0Bi;t þ β1Bi;t−1 þ γZi;t−1 þ ui þ εi;t; ð1Þ
where si , t = (ln(RERi , t) − ln(RERi , t − 1))∗100, Bi , t = [EFi , t, BFi , t], Bi , t − 1 =
[EFi , t − 1, BFi , t − 1], EF and BF are equity flows and bond flows, respectively, andZi , t − 1 = [PRODi , t − 1, CAi , t − 1, TOTi , t − 1, OPENi , t − 1, IRi , t − 1], α , β , γ areparameters to be estimated, while ui is a country fixed effect and εi , t~N 0;σ2
ε
� �. Subscripts i and t denote country i and time t, respectively. According to
Kiviet (1995), if the T of panel data is large enough (T > 30), the Least-Squares DummyVariable (LSDV) estimator is valid and more efficient than other estimators. Therefore,
Table 1 Accumulated log change of the real exchange rate during periods with fund inflows and fundoutflows for some selected countries
Equity flows >0 Equity flows <0 Bond flows >0 Bond flows <0
Developing countries
Brazil −181.314 218.059 −111.542 78.578
China −6.762 −1.246 −8.852 0.844
India −77.238 44.643 −63.407 35.643
Indonesia −106.374 15.338 −45.365 37.887
Malaysia −45.419 79.528 −39.047 33.378
Mexico −85.991 72.983 −39.498 54.188
South Africa −62.651 107.002 −24.969 42.320
Developed countries
Canada −58.261 40.257 −22.715 26.612
France −24.407 8.265 14.204 −0.654Germany −20.358 4.954 15.893 −3.241Korea −59.753 80.223 −39.926 29.480
Singapore −38.347 43.757 −39.471 14.299
United Kingdom −34.190 24.536 −9.339 19.580
This table presents the accumulated log change of the RER during periods with fund inflows and outflows. Anegative (positive) value indicates exchange rate appreciation (depreciation)
Are International Fund Flows Related to Exchange Rate Dynamics? 37

the LSDV method is employed to estimate the model. We also use a GMM estimator totest the robustness of the results.
Following related research (Athukorala and Rajapatirana 2003; Brooks et al.2004; Combes et al. 2012; Jongwanich and Kohpaiboon 2013), we includeseveral macroeconomic variables as controls, including a proxy for the produc-tivity differential (PROD), the current account balance (CA), a terms of tradevariable (TOT), trade openness (OPEN), and the short-term interest rate differ-ential (IR). All the control variables are lagged one period to avoid endogeneityproblems. The productivity differential is included to capture the Balassa-Samuelson effect, according to which the increase in productivity in the trad-able sector tends to be associated with an exchange rate appreciation due to thehigher price increase of non-tradable goods than that of tradable goods (cf.Tang and Zhou 2013). Following Combes et al. (2012), Jongwanich andKohpaiboon (2013) and Tang and Zhou (2013), the productivity differential ismeasured as the ratio of real GDP per capita in the domestic country to GDPper capita in the U.S. An increase in this variable implies a productivityimprovement in the domestic country. The terms of trade variable is definedas the relative price of a country’s export compared to its imports (Tang andZhou 2013). In constructing this variable, we employ the ratio of the unit valueof exports to the unit value of imports. Following Tang and Zhou (2013), forcountries for which this data is not available, we instead use the ratio ofexports to imports. 5 Following Jongwanich and Kohpaiboon (2013), tradeopenness is calculated as the sum of exports and imports divided by nominalGDP. Finally, we include the short-term interest rate differential, which isproxied by a country’s 3-month interest rate minus the U.S. three-month T-billrate (Brooks et al. 2004). Table 2 shows the definition and sources of all theexplanatory variables.
4.2 Empirical Results
Table 3 presents the estimation results of Eq. (1), using data of 53 countries betweenJanuary 1996 and June 2015. The dependent variable is the log change of the realexchange rate. We include contemporaneous as well as lagged fund flows in the modelto examine the time lag in the relationship between fund flows and exchange rates.Table 3 provides several interesting results. First, as shown in Column (1), a contem-poraneous increase in equity flows and bond flows is associated with a decrease of theRER, that is, an appreciation of the real exchange rate. This result is consistent with thefindings of previous studies (cf. Combes et al. 2012; Jongwanich and Kohpaiboon2013), which conclude that portfolio flows lead to an exchange rate appreciation in thesame period.
Second, lagged fund flow also have explanatory power for RER dynamics, as shownin Column (2) in Table 3. However, the coefficient on the lag of the funds flow variableis smaller than that of contemporaneous fund flows as reported in column (1).
5 These countries are: Austria, Bulgaria, Chile, China, Croatia, Czech Republic, Egypt, Estonia, Indonesia,Kazakhstan, Lithuania, Malaysia, Mexico, Nigeria, Philippines, Portugal, Qatar, Romania, Russian, Slovenia,South Africa, Switzerland, Tunisia, Ukraine.
38 S. Li et al.

Third, following Jongwanich and Kohpaiboon (2013), we include both contempo-raneous as well as lagged fund flows in one model. Column (3) in Table 3 provides theresult. For equity flows, the coefficients on both contemporaneous and lagged equityflows are significant, but the coefficient on contemporaneous fund flows is larger and
Table 2 Definition of variables
Variable Definition/ Calculation Reference Frequency &Data source
Real exchange rate(RER)
RERd=/¼ NERd=/*CPIUSCPId
st = (ln(RERt) − ln(RERt − 1))∗100
Athukorala and Rajapatirana2003; Kodongo and Ojah2012, Jongwanich andKohpaiboon 2013
Monthly,CEIC, IFS
Nominal exchange rate(NER)
st = (ln(NERt) − ln(NERt − 1))∗100 Monthly,CEIC
Real effectiveexchange rate(REER)
st = (ln(REERt) − ln(REERt − 1))∗100 Combes et al. 2012; Tang andZhou 2013
Monthly,CEIC
Equity flows (EF) International equity fund flows scaledby assets under management ofeach receiving country (or scaledby nominal GDP)
Monthly,EPFR Global
Bond flows (BF) International bond fund flows scaledby assets under management ofeach receiving country (or scaledby nominal GDP)
Monthly,EPFR Global
Productivitydifferential (PROD)
Ratio of real GDP per capita indomestic country to GDP per capitain the U.S.
Combes et al. 2012;Jongwanich andKohpaiboon 2013; Tangand Zhou 2013
Annual,CEIC
Terms of trade (TOT) Ratio of unit value of export to unitvalue of import (or ratio of exportsto imports in case of missing data)
Jongwanich and Kohpaiboon2013; Combes et al. 2012;Tang and Zhou 2013
Monthly,CEIC, IFS
Trade openness(OPEN)
Sum of exports and imports divided bynominal GDP
Athukorala and Rajapatirana2003; Jongwanich andKohpaiboon 2013;Combes et al. 2012; Tangand Zhou 2013
Monthly,CEIC
Short-term interest ratedifferential (IR)
Country’s three-month interests rateminus U.S. three-month T-bill in-terest rate
Siourounis 2004; Brookset al. 2004
Monthly,CEIC
Current accountbalance (CA)
Current account balance as percentageof GDP
Exchange rate regime(ERA)
Classification of exchange rateregimes
Reinhart and Rogoff 2004;Ilzetzki et al. 2009
Monthly, dataonlinea
Financial opennessindex (KAOPEN)
Takes a higher value if the country ismore financial integrated (lowercapital controls).
Chinn and Ito 2008 Annual, data onlinetill 2014b; 2015takes the samevalue as 2014
a Data available online at: http://www.carmenreinhart.com/research/publications-by-topic/exchange-rates-and-dollarization/b Data available online at: http://web.pdx.edu/~ito/Chinn-Ito_website.htm
Are International Fund Flows Related to Exchange Rate Dynamics? 39

more significant. For bond flows, contemporaneous fund inflows are related to acurrency appreciation, but lagged bond flows are associated with a RER depreciation.One possible explanation is that large bond inflows increase demand in the FX marketto such an extent that it may lead to overshooting of the exchange rate, which iscorrected in the following month.
Table 3 Fund flows and the real exchange rate
(1)Fund flows
(2)Lagged fund flows
(3)Both
RER(−1) 0.274*** 0.303*** 0.287***
(17.14) (18.54) (18.11)
RER(−2) −0.127*** −0.119*** −0.110***
(−7.23) (−6.97) (−6.33)RER(−3) 0.0633*** 0.0759*** 0.0701***
(5.17) (5.87) (5.48)
Equity flows −0.199** −0.175**
(−2.48) (−2.35)Bond flows −0.174*** −0.305***
(−7.17) (−7.81)Equity flows(−1) −0.110** −0.0257
(−2.67) (−0.95)Bond flows(−1) −0.00355 0.200***
(−0.23) (6.87)
Productivity differential(−1) 0.121 1.125** 0.206
(0.23) (2.02) (0.40)
Current account balance(−1) 0.0167** 0.0118 0.0158**
(2.16) (1.61) (2.12)
Interest rate differential(−1) 0.0350 0.0453* 0.0432*
(1.43) (1.83) (1.73)
Terms of trade(−1) −0.101 −0.152 −0.0928(−1.16) (−1.50) (−1.10)
Trade openness(−1) −0.0228 0.207 −0.0882(−0.09) (0.72) (−0.32)
Constant −0.937** −1.308*** −1.111***
(−2.47) (−3.70) (−2.96)N 5534 5497 5497
Country fixed effects Yes Yes Yes
Time fixed effects No No No
R-squared 0.1482 0.1091 0.1621
Root MSE 2.277 2.3332 2.2632
Dependent variable: log change of RER. Columns (1), (2), and (3) describe the result for the model thatincludes contemporaneous fund flows only, lagged fund flows only and both contemporaneous and laggedfund flows, respectively. Standard errors are clustered by country; t-statistics in parentheses; * , ** and ***
indicate significance at the 10%, 5% and 1% level, respectively
40 S. Li et al.

Table 4 shows the results if we split up the sample in developed and developingcountries.We conclude that bond flows aremore significantly related to a RER appreciationthan equity flows in developing countries, while in developed countries equity flows play amore important role. A reason might be that developed countries attract more equity fundflows as they have more mature stock markets, and therefore the influence of equity flows
Table 4 Fund flows and the real exchange rate: developed versus developing countries
Developed countries Developing countries
(1)Fundflows
(2)Lagged fundflows
(3)Both
(4)Fundflows
(5)Lagged fundflows
(6)Both
RER(−1) 0.259*** 0.279*** 0.263*** 0.274*** 0.320*** 0.303***
(13.15) (12.76) (13.21) (10.04) (17.89) (16.07)
RER(−2) −0.0946*** −0.0952*** −0.0860*** −0.184*** −0.176*** −0.161***
(−4.49) (−4.59) (−4.08) (−7.31) (−7.00) (−6.06)RER(−3) 0.0767*** 0.0830*** 0.0825*** 0.0266 0.0549** 0.0359
(5.84) (5.83) (6.09) (1.21) (2.36) (1.63)
Equity flows −0.318*** −0.243*** −0.133 −0.130(−4.46) (−3.16) (−1.63) (−1.63)
Bond flows −0.121*** −0.225*** −0.243*** −0.411***
(−6.62) (−7.04) (−5.04) (−5.34)Equity flows(−1) −0.294*** −0.181*** −0.0208 0.0359
(−5.63) (−3.06) (−1.03) (1.24)
Bond flows(−1) 0.0353* 0.179*** −0.0483** 0.240***
(1.94) (5.46) (−2.42) (4.77)
Productivitydifferential(−1)
−0.855 −0.221 −1.038* 6.068*** 8.861*** 6.538***
(−1.57) (−0.43) (−1.88) (5.28) (6.25) (5.33)
Current accountbalance(−1)
0.0216** 0.0196** 0.0221** 0.0205 0.0120 0.0174
(2.11) (2.07) (2.08) (1.53) (0.92) (1.53)
Interest ratedifferential(−1)
0.0844** 0.0910*** 0.0851*** 0.0203 0.0330 0.0300
(2.74) (2.83) (2.75) (0.73) (1.33) (1.13)
Terms of trade(−1) −0.0141 −0.0404 0.00292 −0.634 −0.863* −0.592(−0.25) (−0.69) (0.05) (−1.63) (−2.09) (−1.69)
Trade openness(−1) −0.202 −0.0811 −0.360 0.696** 1.027*** 0.718**
(−0.69) (−0.26) (−1.19) (2.51) (3.00) (2.43)
Constant −1.469*** −1.692*** −1.439*** −0.710 −1.332** −1.035(−3.32) (−3.78) (−3.30) (−0.99) (−2.46) (−1.72)
N 3446 3420 3420 2088 2077 2077
Country fixed effects Yes Yes Yes Yes Yes Yes
Time fixed effects No No No No No No
Dependent variable: log change of RER. Countries are classified according to the World Bank’s classificationin July 2015. Developed countries include high-income countries and other countries are categorized asdeveloping countries. Standard errors are clustered by country; t-statistics in parentheses; * , ** and ***
indicate significance at the 10%, 5% and 1% level, respectively
Are International Fund Flows Related to Exchange Rate Dynamics? 41

on the RER is more significant. As emerging countries tend to receive more bond flows(Combes et al. 2012), these are more strongly related to a currency appreciation.
4.3 Robustness Analysis
To address potential endogeneity problems, we re-estimate our models using theArellano-Bond GMM estimator (Arellano and Bond 1991). We include 3-lagged depen-dent variables in the dynamic panel data model, and set fund flows as endogenousvariables. Further lagged levels of these variables are used as instruments. Table 5 presents
Table 5 Robustness analysis: GMM estimation results
(1)Fullsample
(2)Fullsample
(3)Developedcountries
(4)Developedcountries
(5)Developingcountries
(6)Developingcountries
RER(−1) 0.0486 0.0932** 0.0496 0.0994** −0.228 −0.0132(1.45) (2.31) (1.34) (1.99) (−0.82) (−0.03)
RER(−2) −0.244*** −0.210*** −0.200*** −0.181*** −0.542*** −0.309(−11.64) (−8.30) (−5.33) (−4.77) (−2.58) (−1.64)
RER(−3) −0.120*** −0.0943** −0.0811 −0.0446 −0.581 0.0866
(−3.16) (−2.12) (−1.55) (−0.75) (−1.34) (0.32)
Equity flows −0.256*** −0.210** −0.431** −0.337 −0.567** 0.296
(−2.82) (−2.27) (−2.37) (−1.06) (−2.08) (0.83)
Bond flows −0.366*** −0.399*** −0.327** −0.275** −0.201 −1.163**
(−7.16) (−5.41) (−2.50) (−2.21) (−1.22) (−2.56)Equity flows(−1) −0.0247 −0.379 0.937
(−0.20) (−1.40) (1.60)
Bond flows(−1) 0.121** 0.140 −0.854(2.28) (1.00) (−1.57)
Productivitydifferential(−1)
8.147 6.516 6.200 5.242 22.59 −168.8(1.47) (1.30) (0.89) (0.82) (0.14) (−1.27)
Current accountbalance(−1)
0.0103 −0.00238 0.0173 0.0167 0.186* −0.0892(0.74) (−0.19) (0.60) (0.74) (1.79) (−0.50)
Interest ratedifferential(−1)
−0.0389 0.0350 −0.0752 −0.0353 0.00422 0.0312
(−0.45) (0.40) (−0.95) (−0.18) (0.04) (0.25)
Terms oftrade(−1)
−0.160 −0.117 −0.139 −0.763 −15.76 9.040
(−0.81) (−0.85) (−0.85) (−0.52) (−1.51) (0.66)
Tradeopenness(−1)
−0.567 0.413 −0.591 −1.147 −15.81 12.77
(−0.50) (0.32) (−0.34) (−0.42) (−0.69) (1.39)
Constant −3.196 −3.689 −3.872 −1.950 23.13 3.703
(−1.25) (−1.59) (−0.59) (−0.36) (0.58) (0.18)
N 5484 5447 3414 3388 2070 2059
Dependent variable: log change of RER. To address potential endogeneity problems, we re-estimate themodels of Table 4 using GMM. Standard errors are clustered by country; t-statistics in parentheses; * , ** and*** indicate significance at the 10%, 5% and 1% level, respectively
42 S. Li et al.

the result. Arellano-Bond tests indicate that there is no serial correlation in the disturbanceterms, and the Sargan tests show that over-identifying restrictions for instrument variablesare valid, suggesting that our model is appropriate.
The results reported in Table 5 are quite similar to those of our baseline model.Contemporaneous fund flows are negatively related with the log change of the RER,implying that large inflows of international fund investments are related to acurrency appreciation. Lagged equity flows are not significant and lagged bondflows are positively related with RER dynamics. Regarding the differencebetween developed and developing countries, the GMM estimates also suggestthat bond flows have a more significant effect on RER appreciation than equityflows in developing countries.
Table 6 shows some further robustness checks. Following Combes et al. (2012) andTang and Zhou (2013), we first replace the real exchange rate (RER) with the realeffective exchange rate (REER) in Column (1). An increase in REER indicates theappreciation of domestic currency. We conclude that contemporaneous fund flows areassociated with currency appreciation, but it is not significant. This may not besurprising. Most cross-border fund investments are conducted in U.S. dollars. There-fore, the price-adjusted bilateral exchange rate vis-à-vis the U.S. dollar is more sensitiveto fund flows than the REER. In Column (2), the RER is replaced by the nominalexchange rate giving similar results as for the real exchange rate. Finally, in Column (3)we scale fund flows by nominal GDP instead of AUM (see also Jongwanich andKohpaiboon 2013). Our main findings do not change.
5 The Role of the Exchange Rate Regime and Financial Openness
Combes et al. (2012) conclude that a more flexible exchange rate regime couldeffectively dampen the REER appreciation associated with capita inflows. To examinewhether it is also the case with fund flows, we include the interaction term of fundflows and exchange rate regime indicators (ERA) in our second model. We employ thede facto classification of regimes developed by Reinhart and Rogoff (2004) andupdated by Ilzetzki et al. (2008). They code exchange rate regimes on a scale from 1to 6.6 The estimated model is as follows:
si;t ¼ ∑mj¼1α jsi;t− j þ β0Bi;t þ θ1Bi;t
*ERAi;t þ η1ERAi;t þ γZi;t−1 þ ui þ εi;t: ð2Þ
The setting is the same as for Eq. (1) except that we add the exchange rateregime indicator and an interaction term of fund flows and ERA. θ1 is the
6 The index is one for four exchange rate arrangements: no separate legal tender, pre-announced peg orcurrency board arrangement, pre-announced horizontal band that is narrower than or equal to +/−2%, and defacto peg. It is two for four exchange rate arrangements: pre-announced crawling peg, pre-announced crawlingband that is narrower than or equal to +/−2%, de facto crawling peg, and de facto crawling band that isnarrower than or equal to +/−2%. The index is three for regimes with a pre-announced crawling band that iswider than or equal to +/−2%, with a de facto crawling band that is narrower than or equal to +/−5%, movingband that is narrower than or equal to +/−2% (i.e., allows for both appreciation and depreciation over time),and with managed floating. It is four for exchange rates that are freely floating. The index is five for countriesthat are freely falling, and six for countries with a dual market and where parallel market data is missing.
Are International Fund Flows Related to Exchange Rate Dynamics? 43

parameter for the interaction term of fund flows and ERA. If the parameter θ1< 0, fund flows tend to be stronger associated with a RER appreciation incountries with more flexible exchange rate regimes.
Similarly, we also examine whether the financial openness of an economy influencesthe relationship between fund flows and the RER. We employ the KAOPEN index as ameasure of financial openness, which is a de jure index of capital controls calculated by
Table 6 Robustness analysis: other variables
(1)Log change of REER
(2)Log change of NER
(3)Fund flows scaled by GDP
Y(−1) 0.271*** 0.319*** 0.304***
(12.57) (17.31) (18.42)
Y(−2) −0.0809** −0.0949*** −0.110***
(−2.44) (−6.19) (−6.59)Y(−3) 0.0111 0.0706*** 0.0723***
(0.70) (5.87) (5.69)
Equity flows 0.0404 −0.177** −31.51**
(0.94) (−2.57) (−2.04)Bond flows 0.0548 −0.301*** −89.28***
(1.27) (−7.61) (−4.26)Equity flows(−1) 0.00457 −0.0347 3.208
(0.23) (−1.34) (0.51)
Bond flows(−1) −0.0245 0.180*** 49.14***
(−0.77) (5.89) (2.75)
Productivity differential(−1) −0.200 0.389 0.728
(−0.63) (0.91) (1.41)
Current account balance(−1) −0.00826 0.0114* 0.0119
(−1.36) (1.87) (1.62)
Interest rate differential(−1) −0.0157 0.0608*** 0.0480*
(−0.86) (2.75) (1.97)
Terms of trade(−1) 0.529* −0.179* −0.110(1.75) (−1.70) (−1.22)
Trade openness(−1) −0.0904 0.266 0.251
(−0.44) (1.13) (0.98)
Constant −0.225 0.390 −1.329***
(−0.51) (1.59) (−3.97)N 5771 5963 5492
Country fixed effects Yes Yes Yes
Time fixed effects No No No
This table presents the results of some robustness tests. In column (1), the dependent variable is the log changeof REER. In column (2), the dependent variable is the log change of NER. In column (3), we scaleequity flows and bond flows by nominal GDP instead of assets under management. Standard errorsare clustered by country; t-statistics in parentheses; * , ** and *** indicate significance at the 10%,5% and 1% level, respectively
44 S. Li et al.
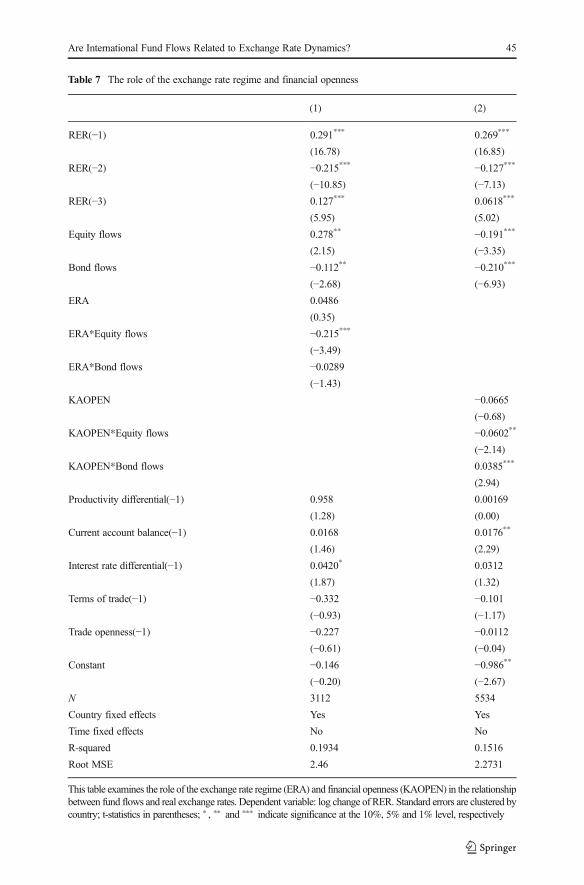
Table 7 The role of the exchange rate regime and financial openness
(1) (2)
RER(−1) 0.291*** 0.269***
(16.78) (16.85)
RER(−2) −0.215*** −0.127***
(−10.85) (−7.13)RER(−3) 0.127*** 0.0618***
(5.95) (5.02)
Equity flows 0.278** −0.191***
(2.15) (−3.35)Bond flows −0.112** −0.210***
(−2.68) (−6.93)ERA 0.0486
(0.35)
ERA*Equity flows −0.215***
(−3.49)ERA*Bond flows −0.0289
(−1.43)KAOPEN −0.0665
(−0.68)KAOPEN*Equity flows −0.0602**
(−2.14)KAOPEN*Bond flows 0.0385***
(2.94)
Productivity differential(−1) 0.958 0.00169
(1.28) (0.00)
Current account balance(−1) 0.0168 0.0176**
(1.46) (2.29)
Interest rate differential(−1) 0.0420* 0.0312
(1.87) (1.32)
Terms of trade(−1) −0.332 −0.101(−0.93) (−1.17)
Trade openness(−1) −0.227 −0.0112(−0.61) (−0.04)
Constant −0.146 −0.986**
(−0.20) (−2.67)N 3112 5534
Country fixed effects Yes Yes
Time fixed effects No No
R-squared 0.1934 0.1516
Root MSE 2.46 2.2731
This table examines the role of the exchange rate regime (ERA) and financial openness (KAOPEN) in the relationshipbetween fund flows and real exchange rates. Dependent variable: log change of RER. Standard errors are clustered bycountry; t-statistics in parentheses; * , ** and *** indicate significance at the 10%, 5% and 1% level, respectively
Are International Fund Flows Related to Exchange Rate Dynamics? 45

Chinn and Ito (2008). This index takes a higher value if the country has fewer capitalcontrols. The estimated model is as follows:
si;t ¼ ∑mj¼1α jsi;t− j þ β0Bi;t þ θ2Bi;t
*KAOPENi;t þ η2KAOPENi;t þ γZi;t−1 þ ui þ εi;t; ð3Þ
We add an interaction term of fund flows and KAOPEN. θ2 is the parameter for thisinteraction term. If θ2 < 0, large fund inflows are associated with larger RERappreciation in countries with higher financial openness.
Table 7 reports the estimation results for Eqs. (2) and (3). The following conclusionscan be drawn. First, the coefficient on the interaction term of equity flows and ERA issignificantly negative, implying that in countries with a more flexible exchange rateregime, equity flows are more strongly related to a RER appreciation than in countrieswith a less flexible exchange rate regime.
Second, the coefficient on the interaction term of equity flows and KAOPEN is alsosignificantly negative. This indicates that if a country has more open capital account,equity flows are more strongly related to a RER appreciation. However, bond flowshave less effect in more financially integrated countries. But the total effect of bondflows is still negative as the sum of the coefficient on bond flows and bondflows*KAOPEN is negative. One possible explanation is that for more financiallyintegrated countries, stock markets are highly developed and they attract large amountof fund investments. Therefore, their exchange rates are more sensitive to equityinvestments.
6 Conclusions
Due to the increased financial integration and capital market liberalization, the volumeof international fund flows has increased significantly since the 1990s. Their rapidincrease and high volatility make it highly relevant to investigate the relationshipbetween fund flows and exchange rate dynamics.
Using monthly data of 53 countries over a period of twenty years in a dynamic paneldata model, we find that large fund inflows are associated with a real domestic currencyappreciation. Splitting the sample in developed and developing countries, wefind that the coefficient on bond flows is more significant than that on equityflows in developing countries, while in developed countries equity flows play amore important role.
Furthermore, we examine the role of the exchange rate regime and financialopenness in the relationship between fund flows and the RER. Different from Combeset al. (2012), we conclude that under a more flexible exchange rate regime there is astronger association between fund inflows and a RER appreciation, both for equityflows and bond flows. Our results also suggest that the relationship between equityflows and a RER appreciation tends to be larger in countries with a higher level offinancial openness, but the reverse holds for bond flows.
Acknowledgements We are grateful for the constructive comments made by an anonymous reviewer. Thisresearch is supported by the National Natural Science Foundation of China (NSFCGrant Numbers: 71273257,71532013, 71703182). The views expressed do not necessarily reflect those of De Nederlandsche Bank.
46 S. Li et al.

Appendix
References
An L, Wang J (2012) Exchange rate pass-through: evidence based on vector autoregression with signrestrictions. Open Econ Rev 23(2):359–380
Arellano M, Bond S (1991) Some tests of specification for panel data: Monte Carlo evidence and anapplication to employment equations. Rev Econ Stud 58(2):277–297
Athukorala PC, Rajapatirana S (2003) Capital inflows and the real exchange rate: a comparative study of Asiaand Latin America. World Econ 26(4):613–637
Balke NS, Ma J, Wohar ME (2013) The contribution of economic fundamentals to movements in exchangerates. J Int Econ 90(1):1–16
Bekaert G, Harvey CR (1998) Capital flows and the behavior of emerging market equity returns. NBERworking paper 6669. National Bureau of Economic Research, Cambridge (MA)
Brooks R, Edison H, Kumar MS, Sløk T (2004) Exchange rates and capital flows. Europ Financ Manage10(3):511–533
Calvo GA, Leiderman L, Reinhart CM (1993) Capital inflows and real exchange rate appreciation in LatinAmerica: the role of external factors. Staff papers-international monetary fund. 40(1):108-151
Table 8 Countries in the sample
No. Country No. Country No. Country
1 Argentina 19 Greece 37 Philippines
2 Australia 20 Hong Kong 38 Poland
3 Austria 21 Hungary 39 Portugal
4 Belgium 22 India 40 Qatar
5 Brazil 23 Indonesia 41 Romania
6 Bulgaria 24 Ireland 42 Russia
7 Canada 25 Israel 43 Singapore
8 Chile 26 Italy 44 Slovenia
9 China 27 Japan 45 South Africa
10 Colombia 28 Kazakhstan 46 Spain
11 Croatia 29 Korea 47 Sweden
12 Czech Republic 30 Lithuania 48 Switzerland
13 Denmark 31 Malaysia 49 Thailand
14 Egypt 32 Mexico 50 Tunisia
15 Estonia 33 Netherlands 51 Turkey
16 Finland 34 New Zealand 52 Ukraine
17 France 35 Nigeria 53 United Kingdom
18 Germany 36 Norway
Are International Fund Flows Related to Exchange Rate Dynamics? 47
Open Access This article is distributed under the terms of the Creative Commons Attribution 4.0 InternationalLicense (http://creativecommons.org/licenses/by/4.0/), which permits unrestricted use, distribution, and repro-duction in any medium, provided you give appropriate credit to the original author(s) and the source, provide alink to the Creative Commons license, and indicate if changes were made.

Caporale, G. M., Menla Ali, F., Spagnolo, F., & Spagnolo, N. (2015). International portfolio flows andexchange rate volatility for emerging markets. CESifo working paper 5615. CESifo, Munich, Germany
Chinn MD, Ito H (2008) A new measure of financial openness. J Comp Policy Anal 10(3):309–322Combes J-L, Kinda T, Plane P (2012) Capital flows, exchange rate flexibility, and the real exchange rate. J
Macroecon 34(4):1034–1043De Grauwe P, Dewachter H (1993) A chaotic model of the exchange rate: the role of fundamentalists and
chartists. Open Econ Rev 4(4):351–379Fratzscher M (2012) Capital flows, push versus pull factors and the global financial crisis. J Int Econ 88(2):
341–356Gelos G (2013) International mutual funds, capital flow volatility, and contagion – a survey. In: Caprio G,
Beck T, Claessens S, Schmukler S (eds) The evidence and impact of financial globalization. Elsevier,Amsterdam, pp 131–143
Gyntelberg J, Loretan M, Subhanij T, Chan E (2014) Exchange rate fluctuations and international portfoliorebalancing. Emerg Mark Rev 18(0):34–44
Ilzetzki E, Reinhart C, Rogoff K (2008) The country chronologies and background material to exchange ratearrangements in the 21st century: which anchor will hold? Mimeo.
Jinjarak Y, Wongswan J, Zheng H (2011) International fund investment and local market returns. J BankFinanc 35(3):572–587
Jongwanich J, Kohpaiboon A (2013) Capital flows and real exchange rates in emerging Asian countries. JAsian Econ 24:138–146
Kiviet JF (1995) On bias, inconsistency, and efficiency of various estimators in dynamic panel data models. JEcon 68(1):53–78
Kodongo O, Ojah K (2012) The dynamic relation between foreign exchange rates and international portfolioflows: evidence from Africa's capital markets. Int Rev Econ Financ 24:71–87
Kosteletou N, Liargovas P (2000) Foreign direct investment and real exchange rate interlinkages. Open EconRev 11(2):135–148
Li S, de Haan J, Scholtens B, Yang H (2015) Are international fund flows pro-or counter-cyclical? Appl EconLett 22(5):378–384
Milesi-Ferretti GM, Tille C (2011) The great retrenchment: international capital flows during the globalfinancial crisis. Econ Policy 26(66):285–342
Moussavi J (2014) Portfolio capital flows: a simple coincident indicator for emerging markets. Available atSSRN 2468148
Puy D (2016) Mutual funds flows and the geography of contagion. J Int Money Financ 60:73–93Raddatz C, Schmukler SL (2012) On the international transmission of shocks: micro-evidence from mutual
fund portfolios. J Int Econ 88(2):357–374Reinhart CM, Rogoff KS (2004) The modern history of exchange rate arrangements: a reinterpretation. Q J
Econ 119(1):1–48Siourounis G (2004) Capital flows and exchange rates: an empirical analysis. London Business School IFA
working paper 400Tang X, Zhou J (2013) Nonlinear relationship between the real exchange rate and economic fundamentals:
evidence from China and Korea. J Int Money Financ 32:304–323Williamson J (2009) Exchange rate economics. Open Econ Rev 20(1):123–146Yeyati EL, Williams T (2012) Emerging economies in the 2000s: real decoupling and financial recoupling. J
Int Money Financ 31(8):2102–2126
48 S. Li et al.