are international educational tests good accountability tools?
TRANSCRIPT

Are International Educational Tests GoodAccountability Tools?
Gerald Eisenkopf
Research Paper SeriesThurgauer Wirtschaftsinstitut
No. 20 august 2007
Are International Educational TestsGood Accountability Tools?
august 2007ABSTRACT
JEL-Classfication: C90, I20, M52
The author thanks Oliver Fabel, Christian Lukas, Christoph Safferling, and Rolf Sonderegger for helpfuldiscussions. Barbara Laely and the Kantonsschule in Kreuzlingen provided technical and organizationalassistance. The experiment was financed by the Thurgau Institute of Economics. Further financial supportof the Deutsche Forschungsgemeinschaft (DFG) through the research group “Heterogeneous Labor:Positive and Normative Aspects of the Skill Structure of Labor” is gratefully acknowledged. Commentsare very welcome. The usual disclaimer applies.
Gerald [email protected]
University of KonstanzThurgau Institute of Economics
The paper investigates if the provision of financial incentives has an impact on the performance of students in educationaltests. The analysis is based on data from an experiment with high school students which answered multiple choiceitems from the TIMS-Study. Like in that study, the setup did not discourage students from guessing. Students with asalary based on individual performance scored insignificantly better than students with a fixed payout or a payout whichis based on the performance of the entire group. However, incentives have an impact. The group with individualizedpayments showed significantly more guessing activities than the others.
Keywords: incentives, education, School accountability, educational tests, TIMSS

2
Introduction
Educational performance tests like the PISA- or the TIMSS-Studies have gained enormous
attention both in the academic literature and in the general public. Increasingly decision
makers will be hold to account for the performance of ‘their’ schools in such tests, The US
“No Child Left Behind”-Act is a prominent example for such a policy. However, from an
economic point of view it is questionable, if these tests are a suitable controlling instrument.
Unlike in performance tests for universities, students do not directly benefit from a good test
score. Hence, those students that take part in the test have no incentive to perform strongly.
Furthermore, they shift attention from “soft” subjects like history to the hard subjects such as
Math or the Sciences because these subjects are much more suitable for testing.
This paper investigates the first problem, the incentive compatibility of performance tests. It is
not clear why students actively collaborate in, say, the PISA-Study. These tests are
anonymous so they do not become part of the final school mark1. Furthermore, the benefits
derived from an increased reputation of the school induce free-riding. On the cost side, some
tasks are difficult and require real effort to get the solution. For an international comparison of
school systems, this argument is of little relevance. Apparently, the students in all countries
face roughly the same conditions during the tests.
However, two questions arise. Firstly, what is the role of motivation in these tests? For
example, Finnish students score better in performance tests than their American or German
counterparts. Yet, it is not clear if they are more (intrinsically) motivated or better educated.
Furthermore, the seemingly low level of motivation could induce political manipulation.
Politicians could provide incentives to the students which are linked to the performance in the
tests. Hence the second question is, if a change in incentives can lead to different results in
test scores. This could be helpful for decision makers who face an evaluation. Performance
related payments may provide a quick and easy instrument to improve the test performance.
The answer to this second question is not as straight forward as the previous argument has
implied. Participation in school performance tests is compulsory for all students in the
selected classes. Hence, the outside option for students is possible an hour of boredom. In this
case, a math test could be a more interesting alternative even for those students who do not
like the subject. Secondly, some students may even see the test as a challenge. The test offers
1 However, it is fairly possible that teachers administrators or politicians could identify the actual student
behind a test.

3
a benchmark which is not set by the school. Hence, it may provide useful information about
individual ability which is otherwise not available. Deci and Ryan (1985) claim that human
beings’ “need for competence” is a source of intrinsic motivation equivalent to basic needs for
autonomy and social relatedness. Psychologist and Sociologists are likely to provide further
explanations why students are motivated to participate actively in the test. Gneezy and
Rustichini (2000) find that small incentives lead to lower performance than a plain fixed
payment. Last, but not least, a technological argument has to be considered. Given the time
restrictions of the tests there are clear limits for motivation. A student is unlikely to solve a
mathematical problem if he has received poor, if any, training in the respective area. So
whatever the motivation, performance cannot exceed some threshold. Motivation and skills
are substitutes only to a certain degree.
Another accountability problem is related specifically to the design of international
performance tests. Many test items are multiple-choice problems with a bonus for a correct
answer but no “malus” for a wrong one2. This is an invitation to guessing. And even if there
was a bad consequence for guessing, the students would not face it if they receive no benefits
or punishments according to their performance. So a bored student may pretend to work and
just puts some marks on the sheets. For international rankings, guessing is no problem. A
country full of randomly answering students will not outperform a country full of knowing
students though the performance gap between both countries may be understated.
There is a large literature analyzing and interpreting the results of international performance
studies but little attention has been paid to the role of incentives. Recent exceptions are Figlio
and Lenny (2007) as well as Lavy (2005) for teacher incentives or Glewwe et al (2003) and
Lavy (2002) for school or group incentives. De Fraja and Landeras (2006), De Fraja et al
(2004) and Eisenkopf (2007) analyse the effort provision of students, however without
discussing specific incentives designs. A thorough analysis of the motivational aspects for the
students in performance tests is still missing. The objective of this paper is to provide a first
experimental insight into the impact of incentives (or extrinisic motivation) for students on
their test performance.
I took math items from the TIMSS-III study for 12th graders and presented them to Swiss high
school students. In the first experiment I was able to test for 40 minutes an entire grade (70
2 This holds at least for the TIMSS studies. It is basically impossible to get replicates of the tests since the sheets
are not published.

4
persons, with 7 more persons missing at the experiment) from the Kantonschule in
Kreuzlingen in the canton of Thurgau. These students were in the last week of their 11th year
in school. Three arguments show why the exercises are suitable for these students. Firstly, the
school is highly selective and includes only the top 15-20% of the students in its region.
Secondly, the school informed me about all areas which had not yet been taught. The relevant
items were dropped. Thirdly, I took math items from the German test. The Swiss education is
more intensive. It offers an equivalent degree to the German Abitur in 12, not 13 years.
These high school students are randomly divided into three groups. Subjects in the first group
get a fixed payment while subjects in the second group get a (smaller) fixed payment plus a
variable individual payment which increases in the performance of the the subject. The
payment of the third group depends on the performance of the entire group. The reason for the
third treatment is that individual performance-based remunerations are very difficult to
implement, given that these tests are not part of the examination and anonymous. Performance
data for classes or schools are more easily available.
The results show that incentives change behaviour, but they do not improve the performance.
Subjects with a higher incentive do not provide significantly more correct answers but they
are more likely to guess. It is plausible that these results change with the sample-size, but the
gap between the incentivized and the non-incentivized groups reduces if the performance is
controlled for guessing activities. The results may change with the size of the variable
payment, the length of the experiment and if wrong answers are punished.
The paper is structured as follows. The following section introduces the experiment in greater
detail. Section 3 discusses the design and section 4 describes the results, while the concluding
section summarizes and discusses variations for future research.
1 The experiment
The experiment took place on the 29th of June, 2007 in the Kantonschule Kreuzlingen, located
in the north of the Swiss Canton of Thurgau. The experiment started at 9.25 am in three
classrooms of equal size. 70 students from the 11th grade took part. Participation was
compulsory for all students of the grade but seven of them did not show up. The participants
faced mathematical multiple-choice problems from the German version of the TIMSS-III
Tests. These tests were part of the Third International Mathematics and Science Study
(TIMSS), devised and implemented by the International Association for the Evaluation of
5
Educational Achievement (IEA). The number “III” refers to the subpopulation which has been
examined with this particular set of tests. The subjects were students with 11 or 12 years of
schooling3. I used the exemplary questions from the Max-Planck Institute for Human
Development which ran the study in Germany4. Unlike other, more recent, exemplary
questions these test sheets provided several advantages. They were documented as multiple
choice questions with all available alternative solutions. Therefore, they were easy to replicate
and quick to evaluate. More importantly, each question included information about its
difficulty (e.g. the international solution probability or the probability that an average German
student solved the problem).
The students were randomly divided into three groups (and the respective rooms) according to
their treatment. The author of this paper introduced the experiment and the respective
treatment to each group. One person was in charge of the experiment in each room. These
“overseers” did not have any a-priori information about the mathematical tasks. The subjects
were instructed that no questions were admitted once the experiment had begun.
The mathematical problems and the possible choices were presented in one question sheet.
The students then marked the chosen solutions had to be marked one a separate response
sheet. To minimize cheating, the students received in two different sequences. Hence
neighbouring students did not have the same response sheets. The test lasted for 40 minutes.
After the test, the students answered an additional questionnaire with background information
and received their payments. All sheets are presented in the appendix.
2 Treatments and Discussion of the Experiment
The subjects were divided into three different treatment groups. Subjects in treatment group 1
received a fixed payment of 12 Swiss Francs (CHF, 1 Franc was equivalent to !0.60, US-
$0.81 or £0.41 at this day) and a variable payment of 2 Francs for each correct answer. In
treatment group 2 all participants received a fixed payment of 20 CHF. The payout in group 3
depended on the performance of the entire group. If the group was, on average, better than
both other groups, each group member would have received CHF25. With a “second place”,
the payout would have been CHF20 and otherwise CHF15. Members of the group were not
3 Sekundarstufe II in the German system.
4 The institutes webpage says that they are not available but I found the items at
www.timss.mpg.de/Die_Testaufgaben/TIMSS_3-Aufgaben.pdf (last access: July, 30th, 2007)

6
informed about the treatment of the other groups. Table 1 shows the distribution of the
subjects into the three groups:
Table 1: The distribution of subjects across treatment groups
Treatment 1 Treatment 2 Treatment 3 Summary
Men 12 13 12 37
Women 9 12 12 33
Summary 21 25 24 70
Missing 5 1 1
Since this is the first incentive experiment with schools performance tests and the sample size
is rather limited, the focus is on two core questions:
1. Do incentives matter in performance tests? Here treatment groups 1 and 3 can be
compared with group 2.
2. Does the size of incentives matter? For this question, I compare the results of groups 1
and 3.
The explanation focuses on two behavioural variables. The first one is the actual performance,
i.e. the number of correctly solved puzzles. The second focus looks at guessing behaviour.
There are various ways to identify guessing. A simple way is to look at the share of
unanswered questions among all those questions which are not correctly answered. I will
discuss the details more deeply in the results section. The two questions can be answered with
both behavioural variables.
If the first part of the argument in the introduction is correct then marginal monetary benefits
matter. Hence group 1 with the variable payments should have the highest average output,
followed by group 3 and group 2 (with the fixed payment). The same sequence should hold
with respect to guessing activities, though corner solutions are possible since the marginal
costs of guessing are very low.

7
The idea behind the experimental approach is to replicate a performance test in a nutshell and
to introduce some controlled variations. In this experiment the focus is on changes in
incentives, while keeping the evaluation system constant. Hence guessing is not punished.
Prospective research projects will take account of this problem. However, it requires a sample
size which is larger than the one available for this experiment. Table 2 shows the four
necessary treatment groups. Otherwise it is not possible to distinguish the impact of guessing
and problem solving clearly.
Table 2: Treatment groups for an alternative experiment which controls for guessing
Incentives; Guessing is not punished No Incentives; Guessing is not punished
Incentives; Guessing is punished No Incentives; Guessing is punished
The possibility for guessing has a methodological advantage. The students have two activities
at hand, problem solving and guessing. The marginal costs of problem solving are higher than
the costs of guessing. Hence, if treatment groups do not differ with respect to performance it
is not clear if this is driven by technological limitations (i.e. more effort is just not enough to
solve a more difficult problem) or if they do not respond to the incentives, for whatever
reason. Differences with respect to guessing activities can control for the latter explanation.
Incentive group 3 is debatable, both its existence and its implementation. Here the key
motivation is to increase the external validity of the experiment. Decision makers are unlikely
to write binding contracts with individual students with respect to their test performance. The
most likely approach here would be to integrate these tests into the regular examination
process. Since tests are hitherto anonymous, class or school performances are the only
contractible measures. Hence students provide inputs to a club good. I chose a relative
performance measure, not an absolute one but it is not unlikely that this particular setting has
a great impact on the performance of group members. The same holds for the problem if
group members should be informed about the treatment of the other groups. Here I chose the
more parsimonious approach with respect to instruction time.
3 Results
The presentation of the results is structured as followed. I will compare the three groups at
first with respect to the performance, then with respect to the guessing activities of the
subjects.

8
4.1. Fixed payment (group 2) vs variable payment (group 1)
The first comparison is between treatment groups 1 and 2, the variable payment versus the
fixed payments. This is the clearest case to identify if incentives have an impact. The results
in table 1 show that, on average, students with a variable payment solve one task more than
their counterparts do (Model 1). This effect is not significant with the given sample size. It
does not change, if performance in school (schoolmark), performance in math (mathmark)
and gender are taken into account (Model 2). Note that some students returned incomplete
questionnaires without math or school marks.
Table 3: Differences in test performance between treatment groups 1 and 2
(OLS)
Model 1 Model 2
Treatment (0: variable, 1: fixed) -1.011 (.952) -1.084 (.878)
Mathmark (from 1.0 (very bad) to 6.0
(very good))
1.642** (.700)
Schoolmark (from 1.0 (very bad) to 6.0
(very good))
-.457 (1.31)
Gender (0: male; 1: female) -1.820* (.937)
Constant 9.571*** ( .702) -1.820 (.937)
R" .025 .317
N 46 42
Standard Errors in Brackets; Significance levels: ***=.01,**=.05,*=.1
A simple score can be used to identify guessing, the share of unanswered questions among all
those questions which have not been answered correctly. A high share indicates little
guessing. Just two persons with variable payments left questions unanswered, compared with
12 in the fixed pay treatment and 9 in the group pay treatment (treatment group 3). This is an
indication that guessing occurs in all groups but with some important quantitative differences.
Table 2 confirms significant guessing differences between the treatment groups. It also shows
that guessing activity is independent of math ability, which drives test performance. This is an
indication that guessing and problem solving are neither substitutes nor complements.

9
Table 4: Differences in guessing activity between treatment groups 1 and 2
(OLS)
Treatment (0: variable, 1: fixed) -.145*** (.047) -.157*** (.051)
Mathmark (from 1.0 (very bad) to 6.0
(very good))
-.004 (.041)
Schoolmark (from 1.0 (very bad) to 6.0
(very good))
-.111 (.077)
Gender (0: male; 1: female) .028 (.058)
Constant .981*** (.034) 1.497*** (.290)
R" .180 .246
N 46 42
Standard Errors in Brackets; Significance levels: ***=.01,**=.05,*=.1
High guessing activities indicate that just counting the number of correct answers overstates
the performance. The data show similar results. For example, an estimation of model 1 from
table 3 with the guess share as control variable reduces the average performance gap between
both treatment groups to 0.889 tasks (standard error 1.06).
4.2. Group payment (group 3) vs fixed payment (group 2)
I repeat the same analysis but replace treatment group 1 with treatment group 3. The
difference between the two analyzed groups is not significant. In this case, a much larger
increase in the sample size would be necessary to get a significant treatment. If anything, the
treatment effect is likely to be smaller.

10
Table 5: Differences in test performance between treatment groups 2 and 3
(OLS)
Model 1 Model 2
Treatment (0: fixed; 1: Group) -.227 (.812) .148 (.690)
Mathmark (from 1.0 (very bad) to 6.0
(very good))
2.082*** (.605)
Schoolmark (from 1.0 (very bad) to 6.0
(very good))
-.924 (1.268)
Gender (0: male; 1: female) -1.631** (.742)
Constant 8.787*** ( 1.276) 4.241 (4.536)
R" .002 .406
N 49 47
Standard Errors in Brackets; Significance levels: ***=.01,**=.05,*=.1
The difference in guessing behaviour is also insignificant. The subjects with the group
payment treatment do not guess more tasks than their counterparts do.
Table 6: Differences in guessing activity between treatment groups 2 and 3
(OLS)
Treatment (0: fixed, 1: Group) -.007 (.067) -.000*** (.076)
Mathmark (from 1.0 (very bad) to 6.0
(very good))
.001 (.058)
Schoolmark (from 1.0 (very bad) to 6.0
(very good))
-.088 (.117)
Gender (0: male; 1: female) -.0.37 (.075)
Constant .844*** (.098) 1.249*** (.393)
R" .180 .246
N 49 47
Standard Errors in Brackets; Significance levels: ***=.01,**=.05,*=.1

11
4.3. Group payment (group 3) and fixed payment (group 2) vs variable payment
(group 1)
Since the treatment groups 2 and 3 hardly differ in both performance and guessing activities it
is clear that a comparison between groups 2 and 3 yields similar than those documented in
subsection 4.1. Hence, if the treatments do not differ, it is possible to control the performance
of the variable payment group against the performance of the other groups. The treatment
effect is still insignificant but the standard error is smaller.
Table 7: Differences in test performance between variable payment (group 1)
and fixed and group payments (groups 1 and 3) (OLS)
Model 1 Model 2
Treatment (0: variable, 1: other) -1.122 (.774) -1.109 (.702)
Mathmark (from 1.0 (very bad) to 6.0
(very good))
1.724*** (.528)
Schoolmark (from 1.0 (very bad) to 6.0
(very good))
-.558 (1.080)
Gender (0: male; 1: female) -1.534** (.679)
Constant 9.571*** (.648) 5.426 (4.015)
R" .030 .321
N 70 65
Standard Errors in Brackets; Significance levels: ***=.01,**=.05,*=.1
The results show substantial gender differences. The treatment effect is significant for female
participants but not for male ones. However, the treatment effect is insignificant once
guessing has been taken into account. It is clear that guessing enhances the test performance.
12
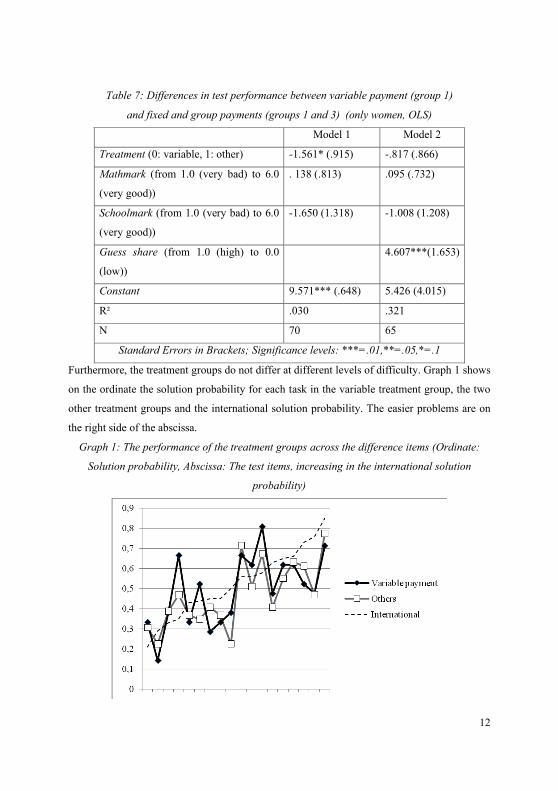
Table 7: Differences in test performance between variable payment (group 1)
and fixed and group payments (groups 1 and 3) (only women, OLS)
Model 1 Model 2
Treatment (0: variable, 1: other) -1.561* (.915) -.817 (.866)
Mathmark (from 1.0 (very bad) to 6.0
(very good))
. 138 (.813) .095 (.732)
Schoolmark (from 1.0 (very bad) to 6.0
(very good))
-1.650 (1.318) -1.008 (1.208)
Guess share (from 1.0 (high) to 0.0
(low))
4.607***(1.653)
Constant 9.571*** (.648) 5.426 (4.015)
R" .030 .321
N 70 65
Standard Errors in Brackets; Significance levels: ***=.01,**=.05,*=.1
Furthermore, the treatment groups do not differ at different levels of difficulty. Graph 1 shows
on the ordinate the solution probability for each task in the variable treatment group, the two
other treatment groups and the international solution probability. The easier problems are on
the right side of the abscissa.
Graph 1: The performance of the treatment groups across the difference items (Ordinate:
Solution probability, Abscissa: The test items, increasing in the international solution
probability)
13
The guessing activities differ significantly between the treatment groups, the treatment effect,
controlled for all variables from tables 4 and 6, is -.149, (standard error: .0581)
4 Summary and Conclusion
The paper analysed the results from an experiment with high school students on the role of
incentives in educational performance tests. The experimental setup was based on multiple
choice items from international educational tests. Like in those tests, the experimental setup
did not discourage the students from guessing. Students with a salary based on individual
performance scored insignificantly better than students with a fixed payout or a payout which
is based on the performance of the entire group. However, the former group showed
significantly more guessing activities than the others, which is a clear observation that
students respond to incentives. These guessing activities also explain a good part of the
differences between the treatment groups.
The results show that it needs, at the very least, large individual incentives and a large student
body to generate a better test score. Higher effort can substitute skills only to a certain extent.
The guessing activities show that multiple choice questions have a clear drawback once
decision makers induce students to perform strongly in the tests. The recent TIMSS- and
PISA tests include items which tell the students to show the way they have solved the
problem. Once these tasks have an adequate weight and independent evaluation is ensured,
performance tests are better, i.e. more incentive compatible, accountability instruments.
The focus of this experiment was to generate evidence which provides sufficient external
validity given the time and sample size constraints. Future research should investigate more
on the relationship between guessing and problem solving. An adequate design has been
introduced in this paper. Such research could provide evidence if both activities are
substitutes or complements. In the first case, a lack of punishment for wrong answer could
induce students to guess rather than to investigate the problem. In the second case, guessing
would encourage calculations because the risks from a small error in the calculus are smaller.
I plan to implement such an experiment with a similar pool of subjects this autumn, such that
a future version of this paper will include the results.
14
5 References
De Fraja, Gianni and Pedro Landeras. 2006. "Could do better: the effectiveness of incentives
and competition in schools." Journal of Public Economics, 90, pp. 189–213.
De Fraja, Gianni, Tania Oliveira, and Luisa Zanchi. 2005. "Must try harder. Evaluating the
role of effort on examination results." CEPR.
Deci, E. L. and R. M. Ryan. 1985. Intrinisc motivation and self-determination in human
behavior. New York: Plenum Press.
Eisenkopf, Gerald. 2007. "Student Selection and Incentives." University of Konstanz.
Figlio, David N. and Lawrence W. Kenny. 2007. "Individual teacher incentives and student
performance." Journal of Public Economics, 91, pp. 901-14.
Glewwe, P., N. Ilias, and M. Kremer. 2003. "Teacher Incentives." NBER.
Gneezy, U. and A. Rustichini. 2000. "Pay Enough or Don't Pay at All." Quarterly Journal of
Economics, 115:3, pp. 791-810.
Lavy, V. 2002. "Evaluating the effect of teachers' group performance incentives on pupil
achievement." Journal of Political Economy, 110, pp. 1286–317.
Lavy, Victor. 2005. "Performance pay and teachers' effort, productivity and grading ethics."
Hebrew University, CEPR and NBER.
Max-Planck Institut für Bildungsforschung: (1999) "Die Testaufgaben."
http://www.timss.mpg.de/Die_Testaufgaben/TIMSS_3-Aufgaben.pdf.

1
Already published
No. Title Authors
IMF and Economic Growth: The Effects ofPrograms, Loans, and Compliance withConditionality
Axel Dreher
2 Do gasoline prices converge in a unifiedEurope with non-harmonized tax rates?
Axel Dreher, Tim Krieger
3 Is There A Causal Link between Currencyand Debt Crisis?
Axel Dreher, Bernhard Herz,Volker Karb
4 What Determines Differences in ForeignBank Efficiency? Australien Evidence
Jan-Egbert Sturm, Barry Williams
5 Market oriented institutions and policiesand economic growth: A critical survey
Jakob de Haan, Susanna Lundström,Jan-Egbert Sturm
6 Does Globalization Affect Growth? Evidencefrom a new Index of Globalization
Axel Dreher
7 Transformation nicht-gehandelter in handel-bare Kreditrisiken
Günter Franke
8 Student Flows and Migration: An EmpiricalAnalysis
Axel Dreher, Panu Poutvaara
9 Foreign Exchange Intervention and the Poli-tical Business Cycel: A Panel Data Analysis
Axel Dreher, Roland Vaubel
10 M&A-Transaktionen - Fluch oder Segen derRealoptionstheorie?
Günter Franke, Christian Hopp
11 Wie hat sich die universitäre volkswirtschaft-liche Forschung in der Schweiz seit Beginn der90er Jahre entwickelt?
Miriam Hein
12 Determinants of Long-term Growth: NewResults Applying Robust Estimation andExtreme Bounds
Jan-Egbert Sturm, Jakob de Haan
13 Which Variables Explain Decisions on IMFCredit? An Extreme Bounds Analysis
Helge Berger, Jakob de Haan,Jan-Egbert Sturm
14 How Synchronized are Central and EastEuropean Ecoomies with the Euro Area?Evidence forma Structural Factor Model
Sandra Eickmeier, Jörg Breitung
15 Experimental evidence on the appropri-atnes of non-monotone incentive cont-tracts
Jeannette Brosig, Christian Lukas
16 Learning and Peer Effects Gerald Eisenkopf17 On ‘Golden Parachutes’ as Manager Dis-
cipline Devices in Takeover ContestsOliver Fabel, Martin Kolmar
18 Recruitment of Overeducated Personnel:Insider-Outsider Effects on Fair EmployeeSelection Practices
Oliver Fabel, Razvan Pascalau

No. Title Authors
19 Entrepreneurial Elites: Industry StructureInvestment, and Welfare Effects of IncubatingNew Businesses
Oliver Fabel, Thomas Weber

Experimental evidence on the appropriatenessof non-monotone incentive contracts
Jeannette BrosigChristian Lukas
Research Paper SeriesThurgauer Wirtschaftsinstitut
No. 15 december 2005