are customs records consistent across countries? evidence
TRANSCRIPT

Are Customs Records Consistent Across Countries?
Evidence from the U.S. and Colombia
by
C.J. Krizan** U.S. Department of Labor
James Tybout
Penn State U. and NBER
Zi Wang Shanghai University of Finance and Economics
Yingyan Zhao
George Washington U.
CES 20-11 March, 2020
The research program of the Center for Economic Studies (CES) produces a wide range of economic analyses to improve the statistical programs of the U.S. Census Bureau. Many of these analyses take the form of CES research papers. The papers have not undergone the review accorded Census Bureau publications and no endorsement should be inferred. Any opinions and conclusions expressed herein are those of the author(s) and do not necessarily represent the views of the U.S. Census Bureau. All results have been reviewed to ensure that no confidential information is disclosed. Republication in whole or part must be cleared with the authors. To obtain information about the series, see www.census.gov/ces or contact Christopher Goetz, Editor, Discussion Papers, U.S. Census Bureau, Center for Economic Studies 5K038E, 4600 Silver Hill Road, Washington, DC 20233, [email protected]. To subscribe to the series, please click here.

Abstract
In many countries, official customs records include identifying information on the exporting and importing firms involved in each shipment. This information allows researchers to study international business networks, offshoring patterns, and the micro-foundations of aggregate trade flows. It also provides the government with a basis for tariff assessments at the border. However, there are no mechanisms in place to ensure that the shipment-level information recorded by the exporting country is consistent with the shipment-level information recorded by the importing country. And to the extent that there are discrepancies, it is not clear how prevalent they are or what form they take. In this paper we explore these issues, both to enhance our understanding of the limitations of customs records, and to inform future discussions of possible revisions in the way they are collected.
Specifically, we match U.S.-bound export shipments that appear in Colombian Customs records (DIAN) with their counterparts in the US Customs records (LFTTD): U.S. import shipments from Colombia. Several patterns emerge. First, differences in the coverage of the two countries customs records lead to significant discrepancies in the official bilateral trade flow statistics of these two countries: the DIAN database records 8 percent fewer transactions than the LFTTD database over the sample period, and the average export shipment size in the DIAN is roughly 4 percent smaller than the corresponding import shipment size in the LFTTD. These discrepancies are not due to difference in minimum shipment sizes and they are not particular to a few sectors, though they are more common among small shipments and they evolve over time.
Second, if we rely exclusively on firms’ names and addresses, ignoring other shipment characteristics (value, product code, etc.), we are able to match 85 percent of the value of U.S. imports from Colombia in our LFTTD sample with particular Colombian suppliers in the DIAN. Further, fully 97 percent of the value of Colombian exports to the U.S. can be mapped onto particular importers in the U.S. LFTTD.
Third, however, match rates at the shipment level within buyer-seller pairs are low. That is, while buyers and sellers can be paired up fairly accurately, only 25-30 percent of the individual transactions in the customs records of the two countries can be matched using fuzzy algorithms at reasonable tolerance levels.
Fourth, the manufacturer ID (MANUF_ID) that appears in the LFTTD implies there are roughly twice as many Colombian exporters as actually appear in the DIAN. And similar comments apply to an analogous MANUF_ID variable constructed from importer name and address information in the DIAN. Hence studies that treat each MANUF_ID value as a distinct firm are almost surely overstating the number of foreign firms that engage in trade with the U.S. by a substantial amount.
Finally, we conclude that if countries were to require that exporters report standardized shipment identifiers—either invoice numbers or bill of lading/air waybill numbers—it would be far easier to track individual transactions and to identify international discrepancies in reporting.
*
* This research was supported by the National Science Foundation (Grant No. SES-1426645). Any opinions, findings, recommendations, or conclusions expressed in this paper are those of the authors and do not necessarily reflect the views of the NSF, the Department of Labor, or the U.S. Census Bureau. All results have been reviewed by the U.S. Census Bureau to ensure that no confidential information is disclosed. ** This author’s contribution largely occurred while employed by the U.S. Census Bureau’s Center for Economic Studies (CES).

3
Introduction
In many countries, official customs records include identifying information on the
exporting and importing firms involved in each shipment. In combination with
information on shipment values, dates, and product categories, this information allows
researchers to study international business networks, offshoring patterns, and the micro-
foundations of aggregate trade flows.1 It also provides the government with a basis for
tariff assessments at the border.
However, there are no mechanisms in place to ensure that the shipment-level
information recorded by the exporting country is consistent with the shipment-level
information recorded by the importing country. And to the extent that there are
discrepancies, it is not clear how prevalent they are or what form they take. Herein we
explore these issues, both to enhance our understanding of the limitations of customs
records, and to inform future discussions of possible revisions in the way they are
collected.
Because customs records can be readily obtained from Colombia, we focus our
analysis on exports from Colombia to the United States. First, we compare the U.S.
customs records of aggregate imports from Colombia with the Colombian customs
records of aggregate exports to the United States. We find that these aggregates do not
always match closely, and this leads us to perform a series of exercises that explore the
sources of the discrepancies. Next, we attempt to match the individual U.S. import
shipment records with their counterparts in the population of Colombian export
shipment records. To do so, we first match the contact information for the U.S.
importers in these two sources using a fuzzy matching algorithm. Then we match the
transaction records across the two data sources using transaction-level characteristics
such as date of export, “free on board” (F.O.B.) value, and Harmonized System (HS)
1 To cite a few studies, Eaton et al. (2008) and Bernard et al. (2018b) document and discuss the patterns of buyer-seller connections in Colombian import records. Eaton et al. (2014) use U.S. customs records to document and model the search and matching processes underlying buyer-seller connections. Blum et al. (2010, 2018) study the matching patterns of home country exporters with foreign wholesale/retail importers using customs records from Chile and Argentina. Kamal and Sundaram (2014) investigate the role of geographic proximity in determining how business networks expand. Bernard and Dhingra (2015) examine the effects of trade agreements on contracts between exporters and importers using Colombian customs records. Bernard et al. (2018a) document and model matching patterns in Norwegian customs records. Sugita et al. (2019) use Mexican customs records to study the effects of China’s expansion into the U.S. textile/apparel market on Mexican exporter matches with U.S. importers. Finally, Dragusanu (2014), Eaton et al (2017), Monarch and Schmidt-Eisenlohr (2017), and Monarch (2019) use U.S. customs records to study various aspects of importer-exporter matching patterns, including the longevity and value of international business relationships and the extent of assortative matching.

4
product code. Finally, we provide summary statistics for our matching work, followed by
a discussion of the implications of our findings for the sources and magnitudes of
aggregate discrepancies.
I. Differences in Published Totals
The Colombian and U.S. customs records provide the bases for official time series on
bilateral trade flows between these two countries. So to begin, we compare Colombia’s
official annual series on total exports to U.S. with the U.S.’s official annual series on
imports from Colombia. As Figure 1 shows, the average difference (Colombia-U.S.) is
close to zero, but after 2009 there is a systematic tendency for the Colombian series to
fall relative to the U.S. series.2 The range of the differences is -15 to +14 percent.
Figure 1: Colombian Exports to the U.S. 3
Official figures from each country
2 Official U.S. import series are “valued on a customs value basis at the foreign port of export. . . The value is generally defined as the price actually paid or payable for goods at the foreign port of export, excluding U.S. import duties, freight, insurance and other charges incurred in bringing the goods to the United States” (Bureau of Economic Analysis, 2014). Similarly, Colombia values its exports in accordance with United Nations guidelines, which require that “actual prices paid for the and cost of delivery to the [exporting country] border be declared, so that the FOB-type customs value can be established.” (United Nations, 2013). Accordingly, unlike in Kellenberg and Levinson (2019), we do not expect a systematic difference between these two data series due to the inclusion of freight and insurance in import figures only.
3 Sources:https://www.dane.gov.co/files/investigaciones/comercio_exterior/exportaciones/2019/serie-historica-1970-2019-junio.xls and https://www.census.gov/foreign-trade/balance/c3010.html
0.0
5000.0
10000.0
15000.0
20000.0
25000.0
30000.0
2007 2008 2009 2010 2011 2012 2013
Mill
ions
$
Colombia* U.S.**

5
Percent Difference in Published Totals
While certainly not negligible, the U.S.-Colombia discrepancies in official trade data
fall well within the range of those that have been found with other trading partners. For
example, earlier U.S. “trade reconciliation” studies have found differences between U.S.
bilateral import figures and trading partner export figures of 4-7 percent for Australia,
11-17 percent for Brazil, and 22-48 percent for China (U.S. Census, 1996; Orsini and dos
Santos, 2015; and U.S. Census, 2012). More broadly, studying a panel of 126 countries
over an 11 year period, Kellenberg and Levinson (2019) document a wide range of
discrepancies in official bilateral trade figures, with many country pairs reporting figures
that should differ only by trade costs (C.I.F. versus F.O.B.) but in fact differ by more than
50 percentage points (see their Figure 2).
These discrepancies are also typical of other types of aggregate series based on large
populations of agents. For example, data on employment and payroll are collected by two
of the most reliable administrative data programs in the U.S.: the Bureau of Labor
Statistics’ (BLS) ES-202 program and the Census’s County Business Patterns. Yet, even
after adjusting for coverage differences in the two data sets, the Census reports higher
employment but lower payroll and number of establishments (Becker et al., 2005). The
year-specific cross-data source differences in these statistics range from -4 to +15
percent over the 2007-2013 time period, and the mean differences for the number of
establishments, employment, and payroll are 8 percent, -3 percent and 4 respectively.
(Further details appear in the Appendix.)
What are their underlying causes of the Colombia-U.S. divergence? Studies of other
country pairs have identified several likely explanations for discrepancies in their official
statistics. Those done at the industry level have generally focused on industry-specific
tariff rates, and have found strong evidence that high tariff rates induce importers to
understate the value of their purchases (Fisman and Wei, 2004; Mishra et al., 2008;
-20%
-10%
0%
10%
20%
2007 2008 2009 2010 2011 2012 2013
% Difference Published Totals
6
Stoyanov, 2012; Ferrantino et al., 2012). Studies that exploit cross-country variation
have also found that discrepancies correlate with domestic profit tax rates (which create
incentives to overstate the value of intermediate inputs), preferential trade agreements
(which reduce incentives for tariff avoidance when importing from partner countries),
inflation rates (which proxy for incentives to avoid capital controls), corruption indices,
and auditing standards (which both affect the ease with which mis-reporting can be
accomplished). (Javorcik and Narciso, 2017; Kellenberg and Levinson, 2019).
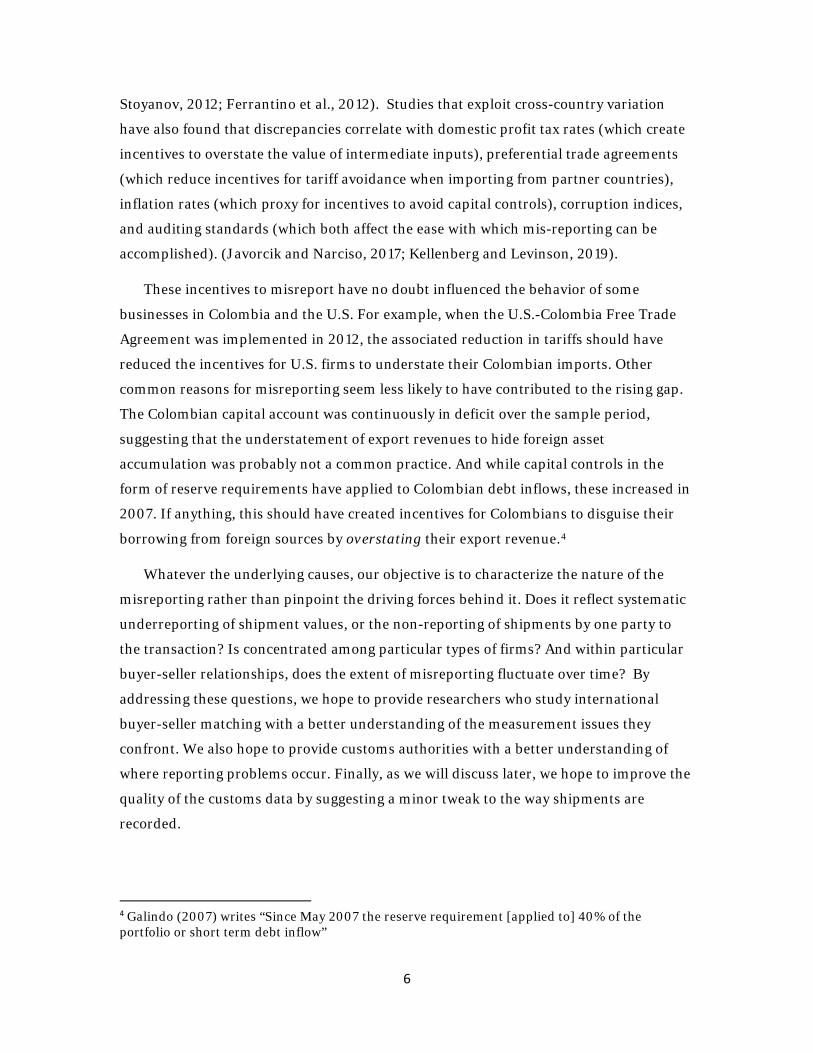
These incentives to misreport have no doubt influenced the behavior of some
businesses in Colombia and the U.S. For example, when the U.S.-Colombia Free Trade
Agreement was implemented in 2012, the associated reduction in tariffs should have
reduced the incentives for U.S. firms to understate their Colombian imports. Other
common reasons for misreporting seem less likely to have contributed to the rising gap.
The Colombian capital account was continuously in deficit over the sample period,
suggesting that the understatement of export revenues to hide foreign asset
accumulation was probably not a common practice. And while capital controls in the
form of reserve requirements have applied to Colombian debt inflows, these increased in
2007. If anything, this should have created incentives for Colombians to disguise their
borrowing from foreign sources by overstating their export revenue.4
Whatever the underlying causes, our objective is to characterize the nature of the
misreporting rather than pinpoint the driving forces behind it. Does it reflect systematic
underreporting of shipment values, or the non-reporting of shipments by one party to
the transaction? Is concentrated among particular types of firms? And within particular
buyer-seller relationships, does the extent of misreporting fluctuate over time? By
addressing these questions, we hope to provide researchers who study international
buyer-seller matching with a better understanding of the measurement issues they
confront. We also hope to provide customs authorities with a better understanding of
where reporting problems occur. Finally, as we will discuss later, we hope to improve the
quality of the customs data by suggesting a minor tweak to the way shipments are
recorded.
4 Galindo (2007) writes “Since May 2007 the reserve requirement [applied to] 40% of the portfolio or short term debt inflow”

7
II. Aggregate discrepancies from micro data
A. The Data
As mentioned above, our analysis is based on individual customs records from the
U.S. and Colombia. On the U.S. side, this exercise exploits the Census Bureau’s
Longitudinal Firm Trade Transactions Database (LFTTD), which links the universe of
U.S. trade transactions (both imports and exports) to the Bureau’s Business Register
(BR) of U.S. establishments and firms. In general, each trade transaction is linked to its
U.S. importer or exporter by the Employer Identification Number (EIN) common to the
two data sets. The exception is exports to Canada which, because of a data-sharing
agreement between the two countries, are linked using firm names and addresses
(Barresse, et al., 2017). In addition to the EIN, the LFTTD reports the dates of
transactions, countries of origin/destination, F.O.B. values in dollars, quantity, HS
product code, and an alphanumeric string that identifies the foreign exporter of the
shipment.5 The LFTTD database currently spans the period 1992-2015.
On the Colombian side, we rely on data collected by the National Directorate of
Customs and Taxes (Spanish acronym DIAN), which maintains a shipment-level dataset
similar to the United States’ LFTTD. It contains a numeric firm identifier (Spanish
acronym NIT) that is used for Colombian tax purposes, and it provides information on
the transaction date, country of origin or destination, F.O.B. value in dollars, quantity,
and HS product code. Importantly, since 2007 the DIAN export records have also
reported the business name and street address of the importing party abroad. These
records are now available through 2018, though when this project began they were only
available through 2013. Accordingly, we uploaded Colombian customs records for 2007-
2013 into the Census Bureau system and we have used this period for our analysis.6
5 This field, called the “manufacturing ID” or MID, is an amalgam of the exporters’ country, firm name, and street address. Details of the construction of the field as well as an analysis of its dependability for research purposes can be found in Kamal and Monarch (2018).
6 The previous draft of this paper was written when the LFTTD ended in 2011, so it covered the period 2007-2011.

8
There are two source country identifiers in the LFTTD import records. The first,
which is used for official U.S. trade statistics, is "Country of Origin." This variable
indicates the last country in which the good underwent substantial transformation, and
will hereafter be denoted LFTTD-CO. Since “Country of Origin” is the basis for U.S.
official trade statistics, and arguably the most useful definition for research on
international business relationships, we will mostly use this variable to identify the
source country for U.S. imports. The second identifier is the country where the goods
were loaded onto the vessel that brought the goods to the U.S. This "Shipping Country”
definition of exports/imports will hereafter be denoted LFTTD-CS. It roughly
corresponds to the definition of exports used by Colombian customs authorities when
they construct bilateral trade statistics from DIAN records.7 Accordingly, we will use this
definition when trying to reconcile Colombian export aggregates with micro data.
Discrepancies between the two identifiers for the exporting country can arise
whenever the last firm to substantially transform the product uses an intermediary in a
third country to distribute its goods. For example, if a Colombian exporter were to ship
its goods to a wholesaler in Panama, which then passed them on to a buyer in the United
States, LFTTD-CS might show Panama as the shipping country, while LFTTD-CO would
show Colombia as the country of origin. Similarly, if a good were manufactured in
Ecuador and sold to a wholesaler in Colombia for shipment to the U.S., it would be
recorded as an import from Colombia under the CS definition but not under the CO
definition.
B. Sample Criteria
For the analysis that follows below, we impose several criteria for inclusion in our
data sets. First, we focus on imports of manufactured products by excluding HS codes 1-
15 (animal and vegetable products), 25-27 (mineral products) and any HS code greater
than 97 (miscellaneous).8 Second, because the U.S. data do not provide comprehensive
coverage of merchandise shipments worth less than $2000, we exclude shipments in
7 Colombia’s bilateral export series are prepared in accordance with UN guidelines, which stipulate that a country’s exports be reported according to the “last known destination.” (United Nations, 2013). 8Colombian official export aggregates are based on all the DIAN customs records except for petroleum and petroleum derivatives, which are reported directly to DANE by the exporting firms (Departmento Administrativo Nacional Estadística, 2017). Since we have excluded exports with HS2 codes equal to 27, this should not affect our analysis.

9
both data sets worth less than $2000. Third, as mentioned above, we select data from
the years 2007-2013, the most current data available to us at the time of the analysis.
Fourth, except when calculating select aggregate statistics, we focus on the records in the
LFTTD data that could be matched to the BR using a reliable firm identifier. Finally,
recognizing that there are varying definitions of “imports”, we focus on “general
imports”, defined as merchandise shipped from foreign countries to either consumption
channels directly, bonded warehouses, trade zones, or Customs Border Protection
custody.9 The Census Bureau publishes tables of trade by country using this definition
so we thereby ensure that our original data set, prior to our restrictions, matches these
totals.
To check how these sample selection criteria have affected our aggregate series,
Figure 2 re-does Figure 1, this time using our restricted samples to construct the
aggregates from each country rather than relying on official statistics. Here we use
“country of origin” (LFTTD-CO) series, since these series are used for the U.S. official
statistics. (We will discuss the discrepancy between LFTTD-CO and LFTTD-CS series
shortly.) Also, to gauge the importance of missing firm identifiers, we report U.S.
aggregates both with and without those imports that can be matched to firms in the BR.
Finally, we switch from annual to monthly observations to provide better detail on
possible discrepancies in the time stamps applied to shipments in Colombia versus the
U.S. (Monthly data were not readily available for the official Colombian aggregates in
Figure 1.)
Figure 2: F.O.B. value 2007-2013
9 See: https://www.census.gov/foreign-trade/reference/definitions/index.html#G

10
Several patterns emerge. First, comparing the “LFTTD All Value” series to the
“LFTTD ID Value” series, we see that the imports that cannot be matched to firms in the
BR are not very important, at least not in value terms. More precisely, about 98 percent
of the value and 96 percent of the number of transactions have a valid firm identifier
(EIN) from the BR.10 Second, just as in Figure 1, we observe a growing shortfall in the
Colombian series relative to the U.S. series although, unlike in Figure 1, the former series
do not exceed the latter in the early years. Accordingly, while our restricted sample is not
perfectly representative of the official aggregates it appears to capture the broad trends
we wish to study.
C. Number of transactions
Do the discrepancies in figure 2 come from differences in average shipment values
or differences in the number shipments? Pooling all sample years and applying the
sample inclusion restrictions discussed above, our LFTTD-CO dataset includes 368,300
shipments of manufactured goods from Colombia with a total value of US$ 22,117
million.11 However, our restricted Colombian sample includes only 341,949 shipments of
manufactured goods to the U.S. with total value of US$ 19,807 million. Thus, although
10 Barresse et al. (2017) report that only about 85-90 percent of the trade transactions in the LFTTD can be linked to a firm id, so U.S. trade with Colombia is less subject to this problem than trade with other countries. 11 All aggregates based on the LFTTD have been rounded to comply with the U.S. Census Bureau’s disclosure requirements. The DIAN records are in the public domain, and therefore can be reported without rounding.
100
150
200
250
300
350
400
450
500
Jan-
07
May
-07
Sep-
07
Jan-
08
May
-08
Sep-
08
Jan-
09
May
-09
Sep-
09
Jan-
10
May
-10
Sep-
10
Jan-
11
May
-11
Sep-
11
Jan-
12
May
-12
Sep-
12
Jan-
13
May
-13
Sep-
13
Mill
ions
$
DIAN LFTTD All Value LFTTD ID Value
11
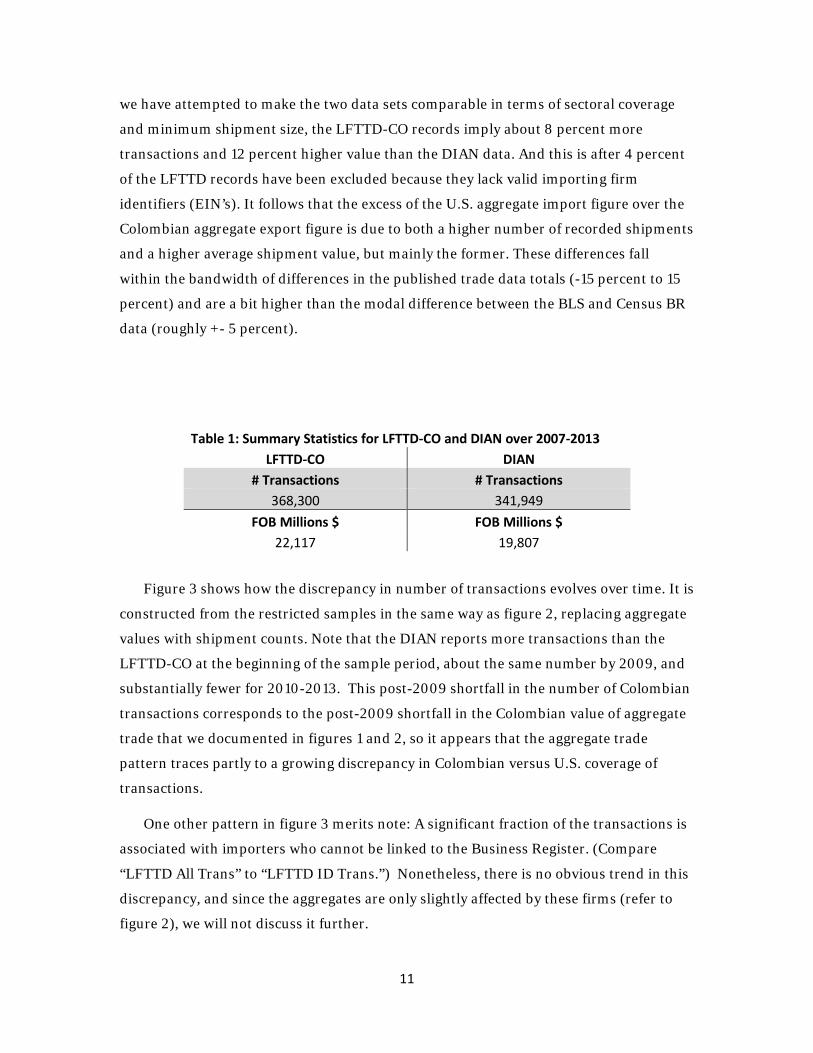
we have attempted to make the two data sets comparable in terms of sectoral coverage
and minimum shipment size, the LFTTD-CO records imply about 8 percent more
transactions and 12 percent higher value than the DIAN data. And this is after 4 percent
of the LFTTD records have been excluded because they lack valid importing firm
identifiers (EIN’s). It follows that the excess of the U.S. aggregate import figure over the
Colombian aggregate export figure is due to both a higher number of recorded shipments
and a higher average shipment value, but mainly the former. These differences fall
within the bandwidth of differences in the published trade data totals (-15 percent to 15
percent) and are a bit higher than the modal difference between the BLS and Census BR
data (roughly +- 5 percent).
Table 1: Summary Statistics for LFTTD-CO and DIAN over 2007-2013 LFTTD-CO DIAN
# Transactions # Transactions 368,300 341,949
FOB Millions $ FOB Millions $ 22,117 19,807
Figure 3 shows how the discrepancy in number of transactions evolves over time. It is
constructed from the restricted samples in the same way as figure 2, replacing aggregate
values with shipment counts. Note that the DIAN reports more transactions than the
LFTTD-CO at the beginning of the sample period, about the same number by 2009, and
substantially fewer for 2010-2013. This post-2009 shortfall in the number of Colombian
transactions corresponds to the post-2009 shortfall in the Colombian value of aggregate
trade that we documented in figures 1 and 2, so it appears that the aggregate trade
pattern traces partly to a growing discrepancy in Colombian versus U.S. coverage of
transactions.
One other pattern in figure 3 merits note: A significant fraction of the transactions is
associated with importers who cannot be linked to the Business Register. (Compare
“LFTTD All Trans” to “LFTTD ID Trans.”) Nonetheless, there is no obvious trend in this
discrepancy, and since the aggregates are only slightly affected by these firms (refer to
figure 2), we will not discuss it further.

12
Figure 3: #Transactions over 2007-2013
We asked U.S. Census Bureau experts on data collection and quality what they
thought might account for the discrepancies between the number of transactions
reported by the two sources. One of these experts observed that it is not uncommon for
U.S. importers to split apart transactions for administrative purposes. This would cause
there to be a greater number of transactions in the U.S. than Colombian side. The
Census experts also reminded us that while export declarations are not monitored for
their accuracy in reporting value, import transactions are sometimes audited and value is
one of the main variables that officials inspect. To the extent that this has an effect on
the declarations of value on the two sides of the trade, it would be expected to increase
the value on the import side relative to the exporting country’s account. These
explanations may well explain part of the observed gap between the aggregates, but
neither helps us understand the tendency of the gap to grow over time.
D. Shipping Country versus Country of Origin
One possible explanation for the increasing divergence between Colombian and U.S.
(LFTTD-CO) aggregates is growth in entrepôt trade, that is, growth in trade that passes
through third-party country. Colombian export statistics record all legal shipments
believed to headed for the U.S., regardless of country of manufacture, while the LFTTD-
CO Census definition treats the country where the good underwent its last substantial
transformation as the source of the merchandise, regardless of where it was shipped
from. Therefore, the U.S. aggregate import series in Figure 2 includes some shipments of
goods that were manufactured in Colombia but departed for the U.S. from third-party
2000250030003500400045005000550060006500
Jan-
07
May
-07
Sep-
07
Jan-
08
May
-08
Sep-
08
Jan-
09
May
-09
Sep-
09
Jan-
10
May
-10
Sep-
10
Jan-
11
May
-11
Sep-
11
Jan-
12
May
-12
Sep-
12
Jan-
13
May
-13
Sep-
13
# Tr
ansa
ctio
ns
DIAN LFTTD All Trans LFTTD ID Trans

13
countries. And it fails to include shipments of goods from Colombia that were
manufactured elsewhere but passed through Colombian customs. The former increases
the value of the U.S. statistics relative to the Colombian statistics; the later diminishes it.
The overall net effect on the number of transactions is ambiguous, but it may be that
growth in shipments of Colombia-manufactured goods from third party countries
explains the difference in total value, particularly since the discrepancy between the
DIAN and LFTTD-CO series in more recent years appears to be largely due to a small
number of large shipments.12
To pursue the question of whether entrepôt trade helps explain the discrepancies in
Figure 2, we next juxtapose import series based on the "Country of Origin" identifier
(LFTTD-CO) with series based on the shipping country identifier (LFTTD-CS.) These
series appear in Figure 4 below, which implies that Colombia ships fewer goods
manufactured by third-party countries directly to the U.S. than it sends to other
countries for trans-shipment to the U.S., particularly in later years. The former show up
in the Colombian figures for aggregate exports to the U.S., while the latter may not,
depending upon whether the exporting firm reported the U.S. as the “last known
destination.” So the growing excess of the LFTTD-CO series over the DIAN series in
figure 2 may partly be due the growing importance of Colombian exports to the U.S.
through third party countries. However, the discrepancy between the “country of origin”
(LFTTD-CO) and “shipping country” (LFTTD-CS) series is negligible in terms of the total
value of shipments except in September 2012 (Figure 5).13 So if trans-shipments do
account for the discrepancy in figure 1, it must be because Colombian exporters tend to
mis-report the ultimate destination of their merchandise, not anticipating that it will end
up in the United States (refer to footnote 8). This might happen if their goods pass
through intermediaries in Panama’s free trade zone, but the U.S. importers who receive
them consider Colombia to be the country of origin and the shipping country.14
12 Details appear in the 2016 draft of this paper. 13 The importance of trans-shipments varies across U.S. trading partners. For example, they are only modestly important for imports from Brazil, but they are a major reason that U.S. and Chinese trade aggregates differ (Orsini, 2015; U.S. Census Bureau, 2012).
14 Panama borders Colombia and is home to the second largest free trade zone in the world, surpassed only by Hong Kong.

14
Figure 4: Monthly Shipments over 2007-2013: LFTTD-CS vs. LFTTD-CO
Figure 5: Monthly F.O.B. value over 2007-2013: LFTTD-CS vs. LFTTD-CO
E. Shipment dates
For short time intervals, another possible source of differences between U.S. and
Colombian trade series is the date assigned to shipments in each country. The
Colombian data report exports at the time of shipment while the U.S. data include
information on both the date of shipment and arrival. We use the date of shipment in
our monthly data comparisons, so in principle, our series from the two countries should
be compatible in this regard. Nonetheless, we check the role of dating by expressing
exports in month-to-month changes. Figure 6 reports first-differences of the series in
figure 5 and suggests there have been some discrepancies in the timing of the changes in
value over time. For example, during 2012-2013, the LFTTD data seem to lead the DIAN
series. However, these differences in timing do not appear to be large or systematic.
Figure 6: Month-to-Month Changes in Export Aggregates
2000250030003500400045005000550060006500
Jan-
07
Jun-
07
Nov
-07
Apr-
08
Sep-
08
Feb-
09
Jul-0
9
Dec-
09
May
-10
Oct
-10
Mar
-11
Aug-
11
Jan-
12
Jun-
12
Nov
-12
Apr-
13
Sep-
13
# Tr
ansa
ctio
ns
DIAN LFTTD Shpping Country LFTTD Country Origin
100
200
300
400
500
Jan-
07M
ay-0
7Se
p-07
Jan-
08M
ay-0
8Se
p-08
Jan-
09M
ay-0
9Se
p-09
Jan-
10M
ay-1
0Se
p-10
Jan-
11M
ay-1
1Se
p-11
Jan-
12M
ay-1
2Se
p-12
Jan-
13M
ay-1
3Se
p-13
Mill
ions
$
DIAN LFTTD Shpping Country LFTTD Country Origin

15
F. Sectoral patterns
Finally, to check whether certain sectors tend to show larger discrepancies than
others, we disaggregate the statistics by year and HS code. Figure 7 shows our results for
the three largest (by value) product categories that Colombia exports to the U.S.: knitted
apparel (HS 61), apparel not knitted (HS 62), and ceramic products (HS 69). Our main
finding is that the LFTTD-CO figures in each HS2 category and year are reasonably close
to the DIAN figures, but larger. Hence, these product-specific patterns roughly recreate
the patterns we saw in the aggregated data series (figure 2) from 2009 onwards, but
unlike the aggregated series, they do not show DIAN figures exceeding LFTTD figures
during the early sample years. And the gap appears to close somewhat for both types of
apparel in the more recent years. So the trajectory for the aggregate discrepancy we
documented earlier appears to be partly due to the changing importance of different
sectors, and partly due to changes in intra-sectoral gaps.
Figure 7: LFTTD-CO value: Industry Decomposition
-150.0
-100.0
-50.0
0.0
50.0
100.0
150.0
Feb-
07M
ay-0
7Au
g-07
Nov
-07
Feb-
08M
ay-0
8Au
g-08
Nov
-08
Feb-
09M
ay-0
9Au
g-09
Nov
-09
Feb-
10M
ay-1
0Au
g-10
Nov
-10
Feb-
11M
ay-1
1Au
g-11
Nov
-11
Feb-
12M
ay-1
2Au
g-12
Nov
-12
Feb-
13M
ay-1
3Au
g-13
Nov
-13
LFTTD Val Diff DIAN Val Diff

16
II. Matching algorithm
Thus far we have demonstrated a long-term tendency for U.S. series on imports
from Colombia to grow relative to Colombian series on exports to the U.S., both in terms
of value and in terms of transactions. By comparing U.S. import series based on
shipping country with series based on country of manufacture, we have further
demonstrated that trans-shipments (entrepôt trade) are unlikely to have been the main
reason for this discrepancy. And finally, we have shown that similar discrepancies appear
within broad sectoral categories, though the identity of the sectors responsible for the
biggest gaps seems to shift over time.
To better understand these results, we now attempt to associate individual buyers
and sellers with the observed transactions, and to determine whether particular types of
agents record transactions differently from their trading partners. After cleaning and
standardizing the data, we follow a two-step matching process. In the first step we
attempt to match known importers and exporters using the business names and
addresses that appear in the customs records. In the second step we attempt to match
the individual transactions carried out by the trading partners identified in the first step.
This two-stage approach allows us to reduce the dimensionality of the matching problem
to a manageable size: With roughly 350,000 transactions in each data base, testing each

17
transaction in the DIAN for a match with each transaction in the LFTTD would have
been prohibitively slow.
A. Firm identifiers
Our first-stage matching is based exclusively on the names and addresses of the
parties to each shipment. Here the key challenge is to deal with noise in the way these
identifiers are recorded. Both the LFTTD and the DIAN data sets provide high quality
information on the domestic parties. That is, the DIAN records include the exporting
firm’s official identifier (NIT), and the LFTTD records provide the importing firms’
“alpha” codes which reference the firm’s name and address in the business register (BR).
But the foreign parties to each shipment are not as easily tracked.
Specifically, for the LFTTD, the only exporter identifier we observe is a
manufacturer ID (MID), which is constructed from the name and address of the foreign
party to the transaction recorded in the shipment invoice. As summarized by Kamal and
Monarch (2018), “the first two characters of the MID must contain the two-digit ISO
country code of the supplier, the next three characters the start of the first word of the
exporter’s name, the next three characters the start of the second word, the next four
characters the beginning of the largest number of the street address of the foreign
exporter, and the last three characters the start of the foreign exporter’s city.”
Kamal and Monarch (2018) note that the MIDs are created through electronic filings
by licensed customs brokers and they have been checked for data entry errors.15
Nonetheless, as we shall demonstrate below, there is strong evidence that they assign
multiple IDs to the same exporting firm. Accordingly, we will not use them for our main
matching exercise.
Instead, we will exploit the importer information in the DIAN dataset, mapping the
importer names and addresses that appear therein to the importer names and addresses
that appear in the U.S. business registry (BR). We prefer this strategy because the DIAN
dataset includes as separate fields: business name, street name and number, city, state,
and zip code.16 And since these variables have not been truncated and collapsed to a
15Monarch (2019) further notes that Redding and Weinstein (2017) “show that many of the salient features associated with exporting activity (such as the prevalence of multi-product firms and high rates of product and firm turnover) are replicated for MID-identified exporters” 16 Importers’ phone numbers also appear, but these proved unhelpful.

18
single alphanumeric string, they are more informative than the MIDs. They also give us
more flexibility to use matching algorithms that involve blocking the data.
Of course, the importer names and addresses in the DIAN are not always recorded
in exactly the same way for the same importer. They vary from shipment to shipment,
both because different exporters use different abbreviations or names for the same entity
and because recording errors occur. So before attempting any matching, we need to
clean and standardize the name and address fields. For this we employ a set of name
and address cleaning algorithms borrowed from the code that creates the LFTTD
(Barresse et al. 2017). The code has been developed by multiple authors over several
years and it standardizes in a variety of dimensions, including setting name strings to
upper case, replacing common abbreviations for street names and organization types
with their full spellings, eliminating punctuation, and dealing with Spanish-to-English
issues.17
B. The Firm-to-Firm Matching Algorithm
Our cleaned and standardized matching variables provide the basis for an algorithm
that associates firms with their trading partners. The steps are fairly standard.
Specifically, we: (1) require exact matches on key variables (blocking) 18, (2) perform a
series of exact or fuzzy name matches on the cases that share the same value of the
blocking variable, and (3) using a threshold rule, select the best name match pairs based
on the edit distance between the business names with additional weight given to larger
firms. 19
17 For example, we replace “ST” and “STR” with “STREET” and both “CO” and “CORP” with “CORPORATION”.17 Additionally, we delete extraneous characters such as “$.,-_+=;~/!@#$%^&*()”. Finally, we find and replace common instances where Spanish language terms had been used in U.S. addresses such as “Calle” in place of “Street,” “NUEVA YORK” in place of “NEW YORK,” “ESTADOS UNIDOS” for “UNITED STATES”, and so on.
18 Blocking improves the speed of matching algorithms. It amounts to searching for cross-sample matches only within subgroups of records that share a common value of the blocking variable. 19 The main alternative to threshold rules is probabilistic matching. See Christen (2009) for a general discussion of these alternative procedures and their pros and cons, or the Office of Management and Budget-sponsored “Employer Data Matching Workgroup White Paper” for SAS code and other concrete recommendations. https://www.cep.gov/comments/Employer-Data-Matching-Workgroup_White-Paper.pdf

19
More precisely, we run a series of “greedy” matching rounds. After each round we
add the matched records to our matched sample and advance the remaining records
from each dataset to the next round. Since matched records do not advance, we run the
records through the most demanding match criteria first and then gradually loosen the
criteria for the remaining non-matched records only. This limits the risk of mismatches.
Following Barresse et al. (2017), our algorithm begins with a set of up to three literal
(exact) matching rounds based on firms’ standardized names. The first of these uses the
first five words in each string.20 If no exact match is found for a record, or if less than five
words are available, it is passed to a second round based on the first four words.21
Analogously, records that could not be exactly matched in the second round advance to a
third round, which matches on only the first three words. Even though these rounds use
only standardized names, they generate 56 percent of all matched records.
Records that could not be matched in the first three rounds advance to a series of
additional rounds that involve fuzzy matching tests. Each subsequent round is less
exacting in its match criteria than the one before, and once again, matched records are
moved to the matched sample while non-matched records advance to the next round.
The sequence of fuzzy matching rounds is as follows:22
• Block on zip code, match on name and street address
• Block on state, match on name and street address
• Block on zip code, match on name
20 For example, in the first round, one complete importer name string in the DIAN is “CEDAR BRIDGE NURSERIES DBA WORLD CLASS FLOWERS.” In first round, we would try to match the string “CEDAR BRIDGE NURSERIES DBA WORLD” to a corresponding name string in the BD. 21 The BR contains two name fields and two street, state, and zip code fields. We run all of the matching rounds through both sets of fields.
22 We use DQMATCH to creates fuzzy match codes. These can be adjusted to vary the level of generality (“fuzziness”). That is, the probability of the matches being correct is adjusted by changing the sensitivity level of the match codes allowing the user to balance the mixture of Type I and Type II errors, which are usually detected through visual inspection of matched and unmatched records. Following convention, we set the precision scale to 85 (out of 100). Details appear in: http://support.sas.com/documentation/cdl/en/dqclref/70016/PDF/default/dqclref.pdf
20
• Block on 2-digit zip code23, match on name
• Block on state, match on name
When evaluating potential matches within each round, we assign an index to each
possible pairing using the “Generalized Edit Distance” (GED) between the Soundex
indices.24 SAS defines the GED as “. . . a generalization of Levenshtein edit distance,
which is a measure of dissimilarity between two strings. The Levenshtein edit distance is
the number of deletions, insertions, or replacements of single characters that are
required to transform string-1 into string-2.”25 That is, more similar names return
smaller values of this function with exact matches equal to zero. Exact matches are
always accepted; for other cases we construct a distance score using the inverse of the
GED. Finally, following the algorithm that Bernard, et al. (2009) used to create the
original version of the LFTTD, we adjust the distance (inverse GED) score by adding up
to 0.5 additional points, depending on the firms’ size.26 This introduces an element of
probabilistic matching into our algorithm, in that it crudely adjusts for the fact large
firms tend to do business with more suppliers and/or buyers. The match with the highest
total score is chosen as the final firm pair for each Colombian shipment, and the
procedure is repeated for each U.S. shipment.
D. The transaction matching algorithm
In the second and final stage of our matching algorithm we block by importer-
exporter pairs, and within each pair we try to match individual transactions. At this point
we consider the characteristics of the goods shipped as recorded by each party.
Specifically, we compute the distance between the target transaction in DIAN and each
of the potential counterpart transactions in LFTTD.
23 A 2-digit zip code is approximately spans a state or small set of adjacent states. See: https://en.wikipedia.org/wiki/ZIP_Code 24 Soundex is a system for indexing names according to how they are pronounced in English. It was developed and patented in the early 1900s to simplify Census taking and is still widely used today in many software packages. 25 http://support.sas.com/documentation/cdl/en/lrdict/64316/HTML/default/viewer.htm#a002206133.htm 26 Specifically: employment <=50 gets 0.0 additional points, 51-100 => +0.15, 101-500 => +0.25, 501-1000 => +0.35, 0ver 1000 => +0.5.

21
Our distance measure is constructed as the sum of scores based on 3 shipment
characteristics: 2-digit HS codes, export dates, and F.O.B. values. The first score is based
on the difference in HS2 codes reported in DIAN versus LFTTD. It is normalized to a
maximum of 1 when HS2 codes match exactly, and it declines quickly as the gap
increases. Specifically,
𝑆𝑆𝑆𝑆𝑆𝑆𝑆𝑆𝑒𝑒𝐻𝐻𝐻𝐻2 =
⎩⎪⎨
⎪⎧
1.0 if 𝐷𝐷𝐷𝐷𝐷𝐷𝑡𝑡𝐻𝐻𝐻𝐻2 = 00.7 if 𝐷𝐷𝐷𝐷𝐷𝐷𝑡𝑡𝐻𝐻𝐻𝐻2 = 10.5 if 𝐷𝐷𝐷𝐷𝐷𝐷𝑡𝑡𝐻𝐻𝐻𝐻2 = 20.3 if 𝐷𝐷𝐷𝐷𝐷𝐷𝑡𝑡𝐻𝐻𝐻𝐻2 = 30.0 if 𝐷𝐷𝐷𝐷𝐷𝐷𝑡𝑡𝐻𝐻𝐻𝐻2 > 3
where 𝐷𝐷𝐷𝐷𝐷𝐷𝑡𝑡𝐻𝐻𝐻𝐻2 = |HS2 of LFTTD – HS2 of DIAN|.
The second score is based on the export date (in months) recorded in the two data
sets. Specifically,
𝑆𝑆𝑆𝑆𝑆𝑆𝑆𝑆𝑒𝑒𝑡𝑡𝑡𝑡𝑡𝑡𝑡𝑡 = 1 −𝐷𝐷𝐷𝐷𝐷𝐷𝑡𝑡𝑡𝑡𝑡𝑡𝑡𝑡𝑡𝑡
12
where 𝐷𝐷𝐷𝐷𝐷𝐷𝑡𝑡𝑡𝑡𝑡𝑡𝑡𝑡𝑡𝑡 = |Monthly index of LFTTD – Monthly index of DIAN|. Transaction
pairs where the export dates differ by more than six months are dropped from
consideration. Hence the time score declines linearly with discrepancies in the export
month until the gap amounts to six months, and thereafter the score is zero.
The final score is based on the cross-data-set discrepancy in the FOB shipment
value:
𝑆𝑆𝑆𝑆𝑆𝑆𝑆𝑆𝑒𝑒𝑣𝑣𝑣𝑣𝑣𝑣𝑣𝑣𝑡𝑡 = 1 −|𝑉𝑉𝑉𝑉𝑉𝑉𝑉𝑉𝑒𝑒 𝑆𝑆𝑜𝑜 𝐿𝐿𝐿𝐿𝐿𝐿𝐿𝐿𝐷𝐷 − 𝑉𝑉𝑉𝑉𝑉𝑉𝑉𝑉𝑒𝑒 𝑆𝑆𝑜𝑜 𝐷𝐷𝐷𝐷𝐷𝐷𝐷𝐷|𝑉𝑉𝑉𝑉𝑉𝑉𝑉𝑉𝑒𝑒 𝑆𝑆𝑜𝑜 𝐿𝐿𝐿𝐿𝐿𝐿𝐿𝐿𝐷𝐷 + 𝑉𝑉𝑉𝑉𝑉𝑉𝑉𝑉𝑒𝑒 𝑆𝑆𝑜𝑜 𝐷𝐷𝐷𝐷𝐷𝐷𝐷𝐷
Our overall distance measure is simply:
𝑆𝑆𝑆𝑆𝑆𝑆𝑆𝑆𝑒𝑒𝑡𝑡𝑡𝑡𝑡𝑡𝑣𝑣𝑣𝑣 = 𝑆𝑆𝑆𝑆𝑆𝑆𝑆𝑆𝑒𝑒𝐻𝐻𝐻𝐻2 + 𝑆𝑆𝑆𝑆𝑆𝑆𝑆𝑆𝑒𝑒𝑡𝑡𝑡𝑡𝑡𝑡𝑡𝑡 + 𝑆𝑆𝑆𝑆𝑆𝑆𝑆𝑆𝑒𝑒𝑣𝑣𝑣𝑣𝑣𝑣𝑣𝑣𝑡𝑡
Hence all identifiers are given equal weight, and the maximum score is 3. Of course, the
rate at which each score declines with deviations from perfect matches is somewhat
arbitrary. Nonetheless, robustness checks performed in the first (2016) draft of this work
show that alternative rates of decline have little effect on our matching results. For
example, giving a 0 score to HS2 discrepancies of more than 2 units had very little effect
on the results, nor did dropping time or HS2 codes from the aggregate score, or changing
22
the number of months in the time differences denominator. Most of the matching power
comes from the value difference score, which has by far the largest support in the data.
For each transaction in the LFTTD, we select the counterpart in DIAN that has the
highest 𝑆𝑆𝑆𝑆𝑆𝑆𝑆𝑆𝑒𝑒𝑡𝑡𝑡𝑡𝑡𝑡𝑣𝑣𝑣𝑣 value. Likewise, for each transaction in DIAN, we select the
counterpart in LFTTD with the maximum 𝑆𝑆𝑆𝑆𝑆𝑆𝑆𝑆𝑒𝑒𝑡𝑡𝑡𝑡𝑡𝑡𝑣𝑣𝑣𝑣 value. Then we define or set of
matches to be those transaction pairs that have mutually maximizing scores.
III. Matching Results
Our matching work shows that LFTTD and DIAN records are inconsistent in many
aspects. We turn now to specifics.
A. Firm-to-firm matching
Summary statistics describing the firm-to-firm matching stage are shown in Table 2.
For each data set, the number of exporting firms is reported in the first row, and the
number of importing firms is reported in the second row. The DIAN-based estimate of
the number of exporters should be fairly accurate, since each firm in Colombia has a
unique tax ID (NIT), and this must be recorded on each shipment record. Similarly, the
LFTTD-based importer count should be fairly accurate, since 96 percent of the
transactions in the LFTTD having a valid firm identifier (EIN). But the DIAN figure for
the number of distinct importers and the LFTTD figure for the number of distinct
exporters are based on the identifiers that were constructed from firms’ names and
addresses, and they are considerably less trustworthy. Specifically, the DIAN records
appear to overstate the number of U.S. importers of Colombian merchandise by 94
percent, and the MID identifier in the LFTTD appears to overstate the number of
Colombian exporters serving the U.S. market by 85 percent.27 Hence, even after
27 As a consistency check, we used the names and addresses of the exporting firms that appear in the DIAN to construct a new exporting firm identifier, following the conventions used to construct the MID in the LFTTD. This exercise yielded roughly twice as many distinct values as there are exporting firms (as identified by their official NIT codes). Thus this synthetic MID overstates the number of exporters by a percentage similar to the overstatement by the MID in the LFTTD, and confirms the inaccuracy of this type of identifier. Further details can be found in the 2016 version of this paper.

23
considerable cleaning, Table 2 strongly suggests that in both countries, identifiers based
on names and addresses often lead to multiple identifiers for the same firm.28
Among the 9,400 U.S. firms importing from Colombia according to the LFTTD,
2,500 can be matched to importers recorded by DIAN via names and addresses, the
majority of these (56 percent) using literal name strings. And the matched importers
tend to be the larger ones. While they only account for 27 percent of the U.S. firms that
import from Colombia during the sample period, they account for 73 percent of
transactions and 85 percent of F.O.B. values recorded by LFTTD. Similarly, the 2,500
pairs of importers' names and addresses that can be matched across datasets account for
95 percent of all transactions in the DIAN dataset, and 97 percent of the total F.O.B.
value of these transactions.
The fact that match rates are higher for Colombian exporters in the DIAN than for
U.S. importers in the LFFTD is consistent with the fact that there are more transactions
in the LFTTD and their total value is higher (Table 1). And since 97 percent (by value) of
the U.S.-bound shipments in the DIAN were successfully paired with a U.S. importer, it
suggests that the surfeit of unmatched import records in the LFTTD came from firms
with no registered U.S.-bound manufactured exports in the DIAN. These mystery
records in the LFTTD might have been generated in several ways. They could have been
mis-labeled by U.S. importers as coming from Colombia, they could have been mis-
labeled by Colombian exporters as destined for some country other than the U.S, or they
could have been assigned the wrong HS2 code by at least one party or to the transaction.
In particular, if some manufactured good shipments were labelled as non-manufactured
(or vice versa) by one party to the transaction, they would appear in one of our samples
but not the other.
Table 2: Summary Statistics for Firm-to-Firm Matching
LFTTD DIAN # Colombian exporters LFTTD 13,500 # Colombian exporters DIAN 7,281 # U.S. Importers LFTTD 9,400 # U.S. Importers in DIAN 18,194 Matched # Importing Firms 2,500 Matched Importers in DIAN 2,500 Matched # Transactions 259,000 Matched # Transactions 324,707 Matched FOB ($ Mil) 18,430 Matched FOB ($ Mil) 19,268
28 The percentages we calculate are much larger than Kamal and Monarch’s (2018) average overstatement of foreign suppliers in the LFTTD of about 36 percent, though they note a great deal of cross-country variation and report the results of a modestly cleaned version of the manuf_id variable.
24
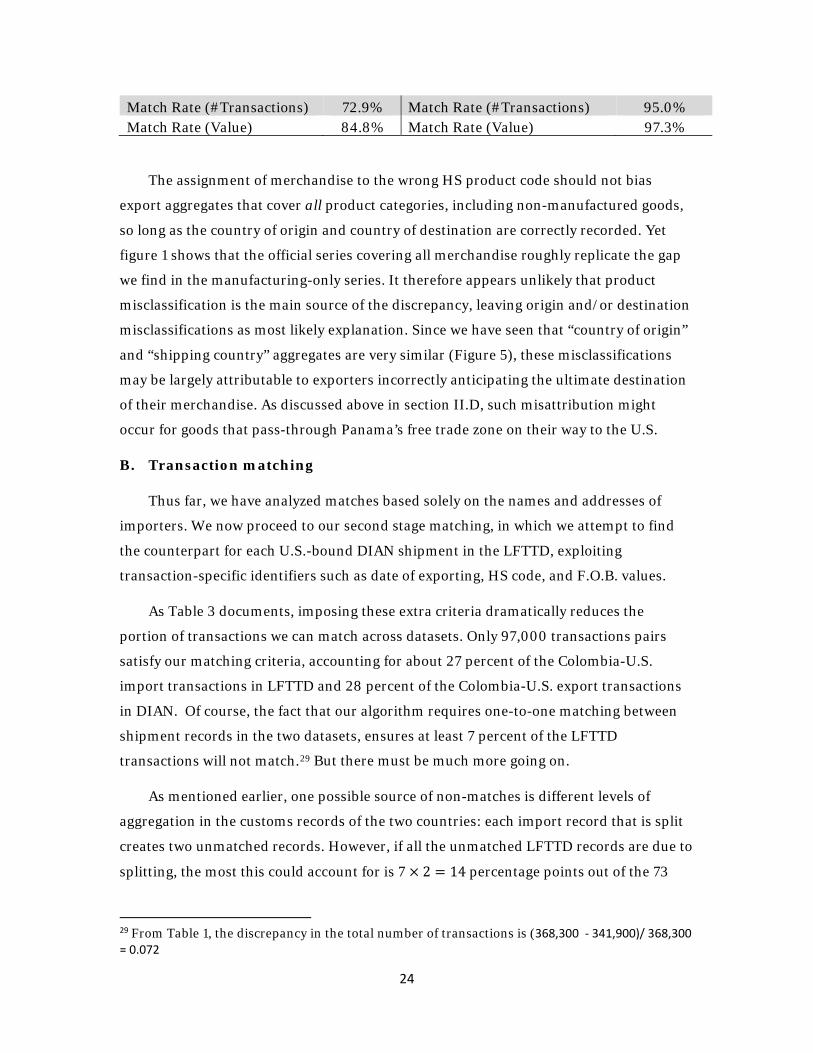
Match Rate (#Transactions) 72.9% Match Rate (#Transactions) 95.0% Match Rate (Value) 84.8% Match Rate (Value) 97.3%
The assignment of merchandise to the wrong HS product code should not bias
export aggregates that cover all product categories, including non-manufactured goods,
so long as the country of origin and country of destination are correctly recorded. Yet
figure 1 shows that the official series covering all merchandise roughly replicate the gap
we find in the manufacturing-only series. It therefore appears unlikely that product
misclassification is the main source of the discrepancy, leaving origin and/or destination
misclassifications as most likely explanation. Since we have seen that “country of origin”
and “shipping country” aggregates are very similar (Figure 5), these misclassifications
may be largely attributable to exporters incorrectly anticipating the ultimate destination
of their merchandise. As discussed above in section II.D, such misattribution might
occur for goods that pass-through Panama’s free trade zone on their way to the U.S.
B. Transaction matching
Thus far, we have analyzed matches based solely on the names and addresses of
importers. We now proceed to our second stage matching, in which we attempt to find
the counterpart for each U.S.-bound DIAN shipment in the LFTTD, exploiting
transaction-specific identifiers such as date of exporting, HS code, and F.O.B. values.
As Table 3 documents, imposing these extra criteria dramatically reduces the
portion of transactions we can match across datasets. Only 97,000 transactions pairs
satisfy our matching criteria, accounting for about 27 percent of the Colombia-U.S.
import transactions in LFTTD and 28 percent of the Colombia-U.S. export transactions
in DIAN. Of course, the fact that our algorithm requires one-to-one matching between
shipment records in the two datasets, ensures at least 7 percent of the LFTTD
transactions will not match.29 But there must be much more going on.
As mentioned earlier, one possible source of non-matches is different levels of
aggregation in the customs records of the two countries: each import record that is split
creates two unmatched records. However, if all the unmatched LFTTD records are due to
splitting, the most this could account for is 7 × 2 = 14 percentage points out of the 73
29 From Table 1, the discrepancy in the total number of transactions is (368,300 - 341,900)/ 368,300 = 0.072

25
percent of transactions that are unmatched. The bulk of the unmatched records are
therefore due to other factors including, especially, mis-recorded information.
Table 3: Transaction-specific Match Rates
LFTTD DIAN
Level %
LFTTD Level % DIAN
# Trans from F2F 259,000 72.9% # Trans from F2F 324,707 95.0%
# Trans matched 97,000 27.3% # Trans matched 97,000 28.4%
FOB from F2F 18,430 84.8% FOB from F2F 19,268 97.3%
FOB matched 10,430 48.0% FOB matched 10,383 52.4% Variable definitions: Trans from F2F: transactions corresponding to firms that can be matched across datasets Trans matched: transactions that can be matched across datasets FOB from F2F: total value of shipments from firms that can be matched across datasets FOB matched: total value of transactions that can be matched across datasets
As with the firm-to-firm matches, we do somewhat better in terms of values. The
matched transactions account for about 48 percent of total F.O.B. imports in the LFTTD
and 52 percent of exports in the DIAN data. Still, the fact that about half of the
transactions remain unmatched, even in value terms, is remarkable and discouraging.
IV. Discussion
A. Match rates in transaction matching
To what extent do transaction matching rates vary across industries, over time, with
trade mode, and with transaction sizes? Figure 8 and 9 below report results specific to
the three 2-digit manufactured products most commonly imported from Colombia, both
in terms of transactions and in terms of values. These statistics vary greatly across
industries, but as in the pooled results, they generally show higher match rates for the
DIAN than for the LFTTD. Thus the pattern documented in Table 3 does not appear to
be due to a few industries.
Figure 8: Match Rate for Transaction Match in terms of #Transactions

26
HS 61: Articles of apparel and clothing accessories, knitted or crocheted. HS 62: Articles of apparel and clothing accessories, not knitted or crocheted. HS 69: Ceramic products.
Figure 9: Match Rate for Transaction Match in terms of F.O.B. value
0.0%
10.0%
20.0%
30.0%
40.0%
50.0%
60.0%
HS 61 HS 62 HS 69 Other
Colombia LFTTD
0.0%
10.0%
20.0%
30.0%
40.0%
50.0%
60.0%
HS 61 HS 62 HS 69 Other
Colombia LFTTD

27
HS 61: Articles of apparel and clothing accessories, knitted or crocheted. HS 62: Articles of apparel and clothing accessories, not knitted or crocheted. HS 69: Ceramic products.
Figure 10: Match rate over time, by # transactions and F.O.B. values
Figure 10 shows match rates over time, confirming again the higher match rates for
the DIAN data (Table 3), but also revealing a large improvement in the value coverage of
the matched transactions from 2007 through 2012, followed by a rapid decline in 2013.
Though we do not have a definitive explanation for this pattern, we note that the trend in
match rates roughly corresponds to the growth and sudden drop in aggregate trade flows
documented in figures 1 and 2. Since the transactions-level match rates are fairly stable
over time, this suggests that aggregate fluctuations in trade flows over the sample years
were driven by adjustments in the average size of matched transactions relative to the
size of unmatched transactions.
B. Related Party Trade
Do multinationals do a better job of recording their transactions, and thus provide a
better basis for matching? Table 4 presents match rates for related party trade and arm's
length trade. Note that the match rate at both the firm level and the transaction level is
higher for related party trade than for arms-length trade (80 percent and 30 percent
versus 67 percent and 25 percent). This pattern is unsurprising, since affiliated firms are
relatively likely to be familiar with each other’s names and addresses and to record them
consistently. However, the match rates in terms of value are somewhat lower for related
party trade (81 percent and 35 percent) than for related party trade (84 percent and 50
0.00
0.10
0.20
0.30
0.40
0.50
0.60
0.70
2007 2008 2009 2010 2011 2012 2013
% M
atch
ed
% DIAN Trans % DIAN value
% LFTTD Trans % LFTTD Value

28
percent). This suggests that multinationals tend to record the values of their shipments
from affiliates in different ways when they leave Colombia versus when they enter the
United States. One obvious interpretation is transfer pricing, but given the problems we
have encountered matching arms-length transactions, other factors are also likely to be
in play.
Table 4: Match Rate of LFTTD: Related-Party vs Arm’s Length
Related-Party Trade Arms-Length Trans
Level % Level % All # Trans 101,000 266,000 FOB $ 3,620 18,500 Firm Match # Trans 81,000 80.2% 178,000 66.9%
FOB $ 2,930 80.9% 15,500 83.8% Trans Match # Trans 30,500 30.2% 67,000 25.2%
FOB $ 1,257 34.7% 9,165 49.5%
C. Small versus Large Shipments
It is also worth asking whether match rates are higher for large shipments. Table 5
shows that the match rates are increasing with respect to transaction size. For example,
in the top shipment size quintile, transactions recorded by DIAN, 56 percent in terms of
value can be matched with LFTTD records, while in bottom quintile, only 25 percent of
them in terms of value can be matched with LFTTD records. A similar pattern obtains in
terms of transaction matching rates, though it is not as dramatic. This overall tendency
for large shipments to be recorded more accurately is consistent with our finding that
transaction match rates by value exceed unweighted transaction match rates (Table 3).
Table 5: Match rate and transaction size
LFTTD DIAN Size
Quintile #Trans Value #Trans Value 1 0.24 0.25 0.25 0.25 2 0.28 0.28 0.29 0.29 3 0.26 0.26 0.27 0.27 4 0.26 0.26 0.30 0.30 5 0.29 0.51 0.32 0.56

29
D. Wholesale/retail industries
Finally, we investigate whether recording standards are more consistent across
countries for wholesale/retail trade. To do so we define wholesale/retail importers as
firms with at least one establishment that has a 2-digit SIC codes between 50 and 59. By
this definition, wholesale/retail firms account for about 37 percent of the import
transactions from Colombia, and about 48 percent of the F.O.B. values. They also have,
on average, more import transactions and larger F.O.B. values than non-wholesale/retail
firms.
Table 6 summarizes our success rates in matching wholesale/retail importers in the
U.S. with their Colombian suppliers. The middle panel reports our results when
matching is done using the firm-to-firm algorithm which, recall, is based on names and
addresses alone. Here 82 percent of wholesale/retail firms can be matched, while only 55
percent of other firms can be matched. Moreover, the wholesale/retail firms that are
matched firm-to-firm account for 82 percent of all transactions involving
wholesale/retail importers, and 83 percent of these firms’ imports in terms of F.O.B.
values. At least in part, these results reflect the fact that wholesale/retail firms are
relatively large.
Interestingly, however, we do not find that the individual import transactions of
wholesale/retail firms can be matched to Colombian export records at a relatively high
rate. To the contrary, when we use our transaction matching algorithm, only 40 percent
of the F.O.B. values that are matched in firm-to-firm matching can be matched. The
corresponding matching rate for non-wholesale/retail firms is 53 percent.
Table 6: Match Rate of LFTTD: Wholesale/Retail
Non-Whole/Retail Whole/Retail
Level Share Level Share All # Trans 156,000 211,000
FOB $ 16,520 5,600 Importers 5,800 3,600 Firm Match # Trans 86,000 55.1% 173,000 82.0% FOB $ 13,770 83.4% 4,660 83.2%
Importers 950 16.4% 1,500 41.7%

30
Trans Match # Trans 32,500 20.8% 65,000 30.8%
FOB $ 8,773 53.1% 1,649 29.4% Importers 900 15.5% 1,500 41.7%
V. Summary and conclusions
In this paper we attempt to match the Colombian manufacturing export transactions
recorded in Colombian Customs records (DIAN) with the US manufacturing import
transactions recorded in the US Customs records (LFTTD) over the period 2007-2013.
We first document that Colombia’s official statistics on F.O.B. exports to the United
States have systematically fallen relative to the U.S. statistics describing the same
aggregate, reaching a discrepancy of about 15 percent by 2013. Focusing on
manufactured exports and shipments over US$ 2000, we find the same pattern, so we
the balance of the paper to searching for explanations in the customs records describing
bilateral trade in manufactured goods of these two countries.
Several patterns quickly emerge. First, the discrepancy in the aggregates traces in
significant part to differences in the coverage of the two data sets, with DIAN recording 8
percent fewer transactions than LFTTD over the sample period. And second, the average
import shipment size in the Colombian customs records is roughly 4 percent smaller
than the corresponding export shipment size in the U.S..
More intriguingly, we are fairly successful at matching firms with their foreign
buyers or sellers if we rely exclusively on firms’ names and addresses, ignoring
characteristics of their shipments. Using a distance-based fuzzy matching algorithm,
roughly 85 percent of the value of U.S. imports from Colombia in our restricted LFTTD
sample can be mapped onto particular Colombian suppliers, and fully 97 percent of the
F.O.B. value of Colombian exports to the U.S. can be mapped onto particular importers.
Nonetheless, there are some “orphan” firms that cannot be matched to their trading
partners. This problem is particularly apparent in the LFTTD, where 27 percent of the
Colombian shipments to the U.S. (15 percent by value) cannot be mapped to Colombian
exporters that appear in the DIAN. (In the DIAN, the figures are 5 percent and 3 percent,
respectively.) Trans-shipments (entrepôt trade)—as measured by the difference between
“country of origin” and “shipping country” figures—do not appear to be the main
explanation, since “country of origin” import figures track “manufacturing country”
figures closely. Hence some U.S. imports are apparently mislabeled as Colombian at the

31
U.S. border and/or some Colombian exports destined for the U.S. are mislabeled as
destined elsewhere at the Colombian border. We suspect that this mislabeling traces
partly to Colombian goods that through Panama’s free trade zone, causing U.S.
importers and Colombian exporters to record these goods’ origins and destinations
differently.
Despite high match rates at the firm level (especially for Colombian exporters),
match rates at the shipment level within buyer-seller pairs are low. Again using a
distance-based fuzzy matching algorithm, we attempt to match these transactions on the
basis of their HS2 industry codes, exporting dates, and F.O.B. values. Only 27 percent of
the transactions in the LFTTD and only 28 percent of the transactions in the DIAN can
be matched when these shipment characteristics are recognized. In F.O.B. value terms,
these matched transactions account for 48 percent and 52 percent of total trade,
respectively.
These unmatched records are a widespread phenomenon and not limited to a few
problem sectors. However, their incidence is lower than average for large shipments,
affiliated trade, and wholesale/retail importers. Finally, because the unmatched records
are concentrated among the smaller shipments, the fraction of transactions-level trade
for which buyer-seller pairs can be identified is larger in value terms (approximately 50
percent) than in terms of shipment counts (approximately 30 percent). Recognizing that
we have allowed for fuzzy matches, and that the results are fairly insensitive to the
strictness of our matching criteria, these figures are dismally low. And they imply
potentially large returns to further investigation, both in terms of tariff revenue
collection and for the growing body of researchers who are studying international buyer-
seller connections.
Finally, a key finding of our transaction-level matching exercise is that the
manufacturing ID codes in the LFTTD overstate the number of Colombian firms that
trade with the U.S. by nearly a factor of 2. While 7,300 Colombian firms report having
exported to the U.S. in the DIAN during the sample period, the MID identifies 13,500
Colombian exporters shipping to the U.S. over the same period. Some of this discrepancy
is probably due to the mislabeling of source or destination countries, as discussed above.
But the overstatement is too large to be explained by this phenomenon alone. And it
implies, inter alia, that studies of international buyer-seller networks are likely to be

32
based on figures that overstate both the number of trading partners that firms engage
with and the rate at which these relationships turn over.
All of the above leads us to a simple recommendation concerning the handling of
customs records: countries should include commonly-used numeric identifiers in their
import and export data. The two most promising candidates for this type of
standardized identifier are invoice numbers and manifest numbers. Both are almost
always unique to a shipment (sometimes a container) and both serve as key legal
documents, so they are very likely to be recorded accurately.
The shipment invoice is issued by the seller to the buyer and lays out the terms of
the transaction, including what is being sold and the agreed-upon price.30 It is the main
documentation of the sale between the two parties and the U.S. import declaration form
requires the importer to attest to its accuracy and use it to fill-out several vital fields.31 If
the invoice number were also recorded on export customs records by the U.S.’s trading
partners, it would provide the basis for a high-quality linkage. However, ensuring that
these numbers are always elicited by foreign export declaration forms is likely to require
international cooperation between customs authorities. For example, in the U.S., the
guidelines for export declarations currently give shippers lattitude as to whether they
reference their shipments using invoice numbers, bill of lading numbers, airway bill
numbers, or internal file numbers. 32 And on the Colombian export declaration form,
none of these identifiers is solicited at all.
The Bill of Lading or Air Waybill number from the shipment manifest is also a
required field on the U.S. import declaration form (Block 12). Bills of Lading and Air
Waybills are transport documents issued by the shipment carrier. They establish receipt
of the goods, lay out the terms of the carriage contract, and provide evidence of title to
the goods’ ownership.33 Accordingly, they too could help link U.S. import shipments
with the exports of countries that elicit these numbers in their shippers’ export
declarations. However, these numbers are probably less useful than invoice numbers
30 See for example: https://www.icontainers.com/help/what-is-a-commercial-invoice/ 31 https://www.cbp.gov/sites/default/files/assets/documents/2019-Dec/CBP%20Form%207501_0.pdf 32 See item 15 in the instructions for filing a U.S. Shipper’s Eport Declaration Form: : https://www.census.gov/foreign-trade/schedules/b/2011/correctwayforb.pdf 33 https://shippingandfreightresource.com/questions-about-original-bill-of-lading/#

33
because they can refer to multiple invoices and they may identify a container rather than
a shipment.34 (To help resolve the ambiguity in these cases, shipping container numbers
could also be incorporated in the customs records.) Finally, they may be more difficult to
capture on export records than on import records because they are issued by the carrier
after taking possession of the merchandise. An ironic testament to the easy availability of
these manifest numbers is that they are widely available in trade data sold by private
providers such as ImportGenius.com or ImportRadar.com.35
Although small adjustments to trading partners’ export declaration forms would be
required, mandatory reporting of either the invoice number or the manifest number
would dramatically reduce the ambiguities that plague the matching efforts reported
herein. This would in turn facilitate shipment tracking and the accurate calculation of
customs duties and domestic content. It would also enable a new wave of research, with
the potential to markedly improve our understanding of international business
relationships. Given the importance of international supply chains and offshoring in the
global economy, and the ready availability of the information in private sources, it seems
well worth the effort.
References
Barresse, Glenn, Fariha Kamal, Javier Miranda, and Wei Ouyang (2017) “Business Dynamics of U.S. Exporters: Integrating Trade Transactions Data with Business Administrative Data”, mimeo.
Becker, Randy, Joel Elvery, Lucia Foster, C.J. Krizan, Sang Nguyen, and David Talan (2005) “A Comparison of the Business Registers Used by the Bureau of Labor Statistics and the Bureau of the Census”, Proceedings of the American Statistical Associations, Business and Economics Statistics Section [CD-ROM], Alexandria, VA: American Statistical Association.
Bernard, A. B., Jensen, J. B., & Schott, P. K. 2009. A portrait of firms in the U.S. that trade goods. In T. Dunne, J. B. Jensen, and M. J. Roberts (Eds.), Producer dynamics: New evidence from micro data: 383-410. Chicago, IL: University of Chicago Press.
Bernard, Andrew and Swati Dhingra (2015) “Contracting and the Division of the Gains from Trade.” NBER working paper No. 21691
34 https://howtoexportimport.com/Difference-between-MBL-and-HBL-How-does-MBL-work-a-278.aspx 35 For example: https://www.importgenius.com/how-it-works/our-datasets/us-imports or http://importradar.com/how-it-works/

34
Bernard, Andrew, Andreas Moxnes, and Karen Helene Ulltveit-Moe (2018a) “Two-sided Heterogeneity and Trade”, The Review of Economics and Statistics, 100(3): 424–439.
Blum, Bernardo, Sebastian Claro and Ignatius Horstmann (2010) “Facts and Figures in Intermediated Trade,” American Economic Review: Papers and Proceedings 100(2): 419-423.
Blum, Bernardo, Sebastian Claro and Ignatius Horstmann (2018) “Trade Costs and the Role of International Trade Intermediaries” in: Bruce Blonigen and Wesley Wilson, eds., Handbook of International Trade and Transportation (Edwin Elgar Press).
Bernard, Andrew, Esther Boler, and Swati Dhingra (2018b) “Firm-to-Firm Connections in Colombian Imports,” NBER Working Paper 24557.
Bureau of Economic Analysis (2014) U.S. International Economic Accounts: Concepts and Methods. Washington, D.C.: U.S. Department of Commerce.
Christen, Peter (2009) Data Matching: Concepts and Techniques for Record Linkage, Entity Resolution, and Duplicate Detection. Heidelberg: Springer.
Departmento Administrativo Nacional Estadística (2017) Metodología General de Estadistícas de Exportaciones. Bógota: DANE.
DIAN (2013) Guía Procedimiento Certificado de Origin V 2.0. Bogota: Modelo Unico de Ingresos, Servicio y Control/Automatizado.
Dragusanu, Raluca, (2014) “Firm-to-Firm Matching Along the Global Supply Chain”, working paper.
Eaton, Jonathan, Eslava, Marcela, Kugler, Maurice, Tybout, James (2008) “The margins of entry into export markets: evidence from Colombia.” In: Helpman, Elhanan, Marin, Dalia, Verdier, Thieery (Eds.), The Organization of Firms in a Global Economy. Harvard University Press, Cambridge, MA.
Eaton, Jonathan, Marcela Eslava, David Jinkins, C.J. Krizan, and James Tybout (2014) “A Search and learning model of export dynamics”, Pennsylvania State University, working paper.
Eaton, Jonathan, David Jinkins, James Tybout, and Daniel Xu (2017), “Two-sided Search in International Markets,” Penn State University, working paper.
Ferrantino, Michael J., Xuepeng Liu, and Zhi Wang (2012) “Evasion behaviors of exporters and importers: Evidence from the U.S.–China trade data discrepancy.” Journal of International Economics 86: 141–57.
Fisman, Raymond, and Shang-Jin Wei (2004). “Tax rates and tax evasion: Evidence from ‘missing imports’ in China.” Journal of Political Economy 112(2): 471–96.
Galindo, Arturo (2007) “Capital Controls in Colombia,” Roubini’s EconoMonitor http://archive.economonitor.com/blog/2007/12/capital-controls-in-colombia/
Javorcik, Beata, and Gaia Narciso, (2017), “Accession to the World Trade Organization and Tariff Evasion”, Journal of Development Economics 129: 59-69.
Kamal, Fariha, and Ryan Monarch (2018), “Identifying Foreign Suppliers in U.S. Import Data,” Review of International Economics Vol 26, Issue 1, pp. 117-139.

35
Kamal, Fariha, and Asha Sundaram (2014) “Buyer-Seller Relationships in International Trade: Do Your Neighbors Matter?” US Census Bureau Center for Economic Studies Paper No. CES-WP- 14-44.
Kellenberg, Derek and Arik Levinson (2019) “Misreporting Trade: Tariff Evasion, Corruption, and Auditing Standards.” Review of International Economics. 27(1): 106-129.
Mishra, Prachi, Arvind Subramanian, and Petia Topalova (2008) Tariffs, enforcement, and customs evasion: Evidence from India. Journal of Public Economics 92: 1907–25.
Monarch, Ryan (2019) “’It’s Not You, It’s Me:’ Prices, Quality and Switching in U.S.-
China Trade Relationships,” Working Paper, Federal Reserve Board. Monarch and Schmidt-Eisenlohr (2017) “Learning and the Value of Relationships in
International Trade,” International Finance Discussion Papers 1218. Board of Governors of the Federal Reserve System (U.S.).
Orsini, Nick, and Carlos Antonio S. dos Santos (2015), “United States-Brazil Report on
Merchandise Trade Statistics Report 2012-2014” https://www.census.gov/foreign-trade/aip/recon_brazil_121314.pdf
Redding, Steve and David Weinstein (2017) “Aggregating From Micro to Macro Patterns of Trade,” NBER Working Paper 24051. Stoyanov, Andrey (2012) Tariff evasion and rules of origin violations under the Canada-
U.S. Free Trade Agreement. Canadian Journal of Economics 45(3): 879–902. Sugita, Yoichi, Kensuke Teshima, and Enrique Seira, (2019) “Assortative Matching of
Exporters and Importers”, working paper.
United Nations (2013) International Merchandise Trade Statistics: Compiler’s Manual, Revision 1 (ITMS 2010-CM). New York: United Nations
U.S. Census Bureau (1996), “Reconciliation of the 1993 and 1994 Merchandise Trade Statistics of the United States and Australia”. https://www.census.gov/foreign-trade/aip/recon_6021_9394.pdf
U.S. Census Bureau (2012), “The Second Phase Report on the Reconciliation of the Merchandise Trade Statistics of the United States and China”. https://www.census.gov/foreign-trade/aip/recon_china_080910.pdf

36
Appendix: Comparing Census and BLS Aggregate Statistics
Percent Difference BLS-Census Published Totals
As outlined by Becker et al. (2008), both the BLS and Census maintain lists of all
private-sector employer establishments in the U.S. with some minor differences in
coverage. For example, the BLS list includes some sectors that the Census list does not,
such as agriculture, households, and private households. On the other hand, the Census
universe of businesses includes liquor stores and hospitals, while the BLS list does not.
The two business registers come from different underlying administrative data. The BLS
data are based on unemployment insurance filings while the Census Bureau gets its
business frame information from payroll tax records collected by the IRS.
Once each side’s data are adjusted for these coverage differences, the measured
statistics on employment, payroll, and number of establishments are theoretically the
same. In fact, the Bureau of Economic Analysis regularly combines data from the two
sources and has found that its published GDP statistics, particularly at the regional and
sectoral levels, are sensitive to measurement differences in the two lists (Fixler and
Landesfeld (2006)).
However, as found in Becker et al. (2005), even after adjust for coverage differences
in the two sets of statistics Census reports higher employment but lower payroll and
number of establishments. The differences across the three statistics range from -4% to
+15% over the 2007-2013 time period. The mean differences for the number of
establishments, employment, and payroll are 8%, -3% and 4% respectively.
-5%
0%
5%
10%
15%
20%
2007 2008 2009 2010 2011 2012 2013
Mill
ions
$
estabs emp payroll