arctic and antarctic diurnal and seasonal variations of...
TRANSCRIPT

Arctic and Antarctic Diurnal and Seasonal Variations of Snow Albedo from Multi-year BSRN Measurements
Xianwei Wang and Charles S. Zender
Department of Earth System Science, University of California, Irvine, USA
Corresponding Author: Xianwei Wang
Email: [email protected] ; [email protected]
Tel: 949-824-1571
Fax: 949-824-3874
123456789
10111213141516171819202122232425262728293031323334353637383940
41
42
43

Abstract
This study analyzes diurnal and seasonal variations of snow albedo at four BSRN stations in the Arctic
and Antarctica from 2003 to 2008 to elucidate similarities and differences in snow albedo diurnal cycles
across geographic zones and to assess how diurnal changes in snow albedo affect the surface energy
budget. At the seasonal scale, the daily albedo for the perennial snow in Antarctica (stations SPO and
GVN) has a similar symmetric variation with solar zenith angle (SZA) around the austral summer; the
daily albedo for the seasonal snow in Arctic (stations BAR and NYA) tends to decrease with SZA
decrease from winter to spring before snow starts melting. At the hourly scale, each station shows
unique diurnal cycles due to different processes that affect snow albedo such as cloud cover, snow
metamorphism, SZA, solar azimuth angle (SAA) and surface features. Cloud escalates the snow albedo
at all four stations by shifting solar radiation to visible wavelengths, and diminishes the diurnal variation
by diffusing incident solar radiation. The 24-hour mean snow albedo is higher on cloudy than clear days
by 0.02 at SPO (December) and BAR (May), 0.05 at GVN (December) and 0.07 at NYA (April). The
diurnal variation (max-min) (0.06) of snow albedo at SPO shows strong effects of snow surface
structures, e.g., wind-channeled sastrugi, which also contribute to the large (0.1-0.2) diurnal variation at
GVN and NYA. The asymmetric diurnal variation of snow albedo at GVN and BAR is consistent with
snow metamorphism. Near the melting point temperature, melt-freeze cycles exceed cloud impacts and
dominate the diurnal variation of snow albedo. All these diurnal variations indicate that the satellite-
measured clear sky snow albedo usually underestimates the average all-sky snow albedo. Further, sun-
synchronous satellite's daily instantaneous observations undersample the diurnal variation of snow
albedo, which causes biases in daily and monthly mean albedo products constructed from them.
Key Words: Snow Albedo; Diurnal Variation; BSRN; Arctic; Antarctica
44
45
46
47
48
49
50
51
52
53
54
55
56
57
58
59
60
61
62
63
64
65
66

1. Introduction
The shortwave (SW) broadband snow albedo (referred to as snow albedo hereafter) is of
great interest to climate studies in that it describes the net solar radiation flux at the snow surface
and small errors or changes in its value represent large fractional changes in absorbed solar
radiation (ASR) and in the overall heat budget at the snow surface (Carroll and Fitch, 1981;
Pirazzini, 2004). Although snow albedo dominates the surface energy budget of the Arctic and
Antarctic (Hall, 2004), the remote location, harsh conditions, extensive cloud cover, and large
solar zenith angles in these regions combine to hinder the development of climatological data
records of snow albedo. As a result, little is known about the climatological diurnal cycle of
polar snow albedo, and its geographic and seasonal variations. Recently, the Baseline Surface
Radiation Network (BSRN) has accumulated sufficiently long time series of high quality, high
frequency radiometric data to allow climatological characterization of the diurnal cycle of snow
albedo. This study analyzes diurnal and seasonal variations of snow albedo at four BSRN
stations in the Arctic and Antarctica from 2003 to 2008 to elucidate similarities and differences
in snow albedo cycles across geographic zones and to assess how changes in snow albedo affect
the surface energy budget.
Snow has high reflectance in visible (VIS) and low reflectance in infrared (IR)
wavelengths. Snow bi-directional reflectance varies strongly with solar zenith angle (SZA) and
viewing geometry (Wiscombe and Warren, 1980; Salomon et al., 2006). However, climate
models typically represent only the zenith, not the azimuthal dependence of snow albedo
(Roesch, 2006). Snow directional-hemispherical reflectance has a larger magnitude of increase
with SZA in IR (1.03 µm) than in VIS (0.55 µm) wavelengths (Schaepman-Strub et al., 2006).
Snow albedo integrates the angular and spectral variations of snow reflectance over the entire
67
68
69
70
71
72
73
74
75
76
77
78
79
80
81
82
83
84
85
86
87
88
89

solar spectrum (SW) wavelengths, and has strong diurnal and seasonal cycles depending on both
atmospheric and surface conditions (Pirazzini, 2004).
Dry snow albedo depends on internal snow characteristics such as snow grain size and
shape, snowpack depth, surface roughness, light-absorbing impurities, and on external factors,
including the SZA and solar azimuth angle (SAA), the spectral distribution of solar radiation,
atmospheric conditions (clouds, water vapor and aerosol, etc.), and shadowing (Warren, 1982;
Pirazzini, 2004). Observations confirm the predictions of models that, all else being equal, snow
albedo increases with decreasing snow grain size and with increasing SZA (Warren and
Wiscombe, 1980; Jin et al., 2003). For example, increasing SZA from 0° to 60° increases clear
sky snow albedo of a model snowpack from 0.75 to 0.78 (Wang and Zender, 2010a). Falling
snow often consists of fine and/or multi-faceted snow grains and has higher albedo immediately
after snowfall (Grenfell et al., 1994). For example, doubling the effective radius of ice crystals
from 100 to 200 μm, as can occur during a few days of isothermal aging in warm conditions,
may reduce albedo from 0.85 to 0.80 (Flanner and Zender, 2006; Taillandier et al., 2007).
Cloud cover affects both the spectral distribution of solar irradiance and the effective
SZA, resulting in an increase of snow albedo of 5-10% from its value in clear sky in Antarctica
(Wiscombe and Warren, 1980; Pirazzini, 2004). Small amounts of strongly absorbing impurities,
especially soot, although dust and volcanic ash can also be effective in larger quantities, lower
snow albedo mainly in the VIS spectral regions (λ < 0.9 μm) where absorption by pure snow is
weakest. Light-absorbing impurities within snow cause the greatest reductions in albedo for
coarse-grained snow (Warren and Wiscombe, 1980; Warren, 1982). When the sun azimuth is
perpendicular to the long axis of the wind channeled surface features known as sastrugi at the
South Pole, snow albedo is reduced as much as 4% from its value when the sun azimuth is
90
91
92
93
94
95
96
97
98
99
100
101
102
103
104
105
106
107
108
109
110
111
112

parallel to the sastrugi (Carrol and Fitch, 1981).
Snow albedo dynamically changes because of its changing internal properties and
external environments. Under overcast skies, surface insolation is diffuse and nearly isotropic,
so the effects of SZA and SAA on albedo are negligible, and when snow metamorphism is slow
then the snow albedo remains rather constant throughout the day (Pirazzini, 2004). During clear
days, snow albedo undergoes large variations due to shadowing, snow metamorphism and
changes in SZA and SAA. The diurnal variation (maximum - minimum) of snow albedo was
measured as about 0.04 at the South Pole (Carrol and Fitch, 1981), and reaches up to 0.15 on the
Antarctic coast (Pirazzini, 2004; Wuttke et al., 2006) and over sea ice in the Baltic Sea (Pirazzini
et al., 2006). For a snowpack with mean albedo of 0.8, a diurnal albedo change of 0.10
represents a diurnal ASR change of 50%. This ASR change is significant for climate or surface
process models, especially in seasonally snow covered regions where changes in ASR can
accelerate the onset of snow melt and its attendant strong snow albedo feedbacks (Flanner et al.,
2007). For comparison, the diurnal variation of surface albedo in a natural grassland (mean
albedo of about 0.2) is 0.05 (Song, 1998), and could be up to 0.1 (or a ASR change of 12%) at a
given SZA due to the formation of dew and reclined canopies by prevailing wind direction
(Minnis et al., 1997).
Despite the numerous mechanisms besides SZA which can contribute to the diurnal cycle
of snow albedo, methods for remote sensing of surface properties, estimation of clear-sky
surface albedo (Brooks et al., 1986), and parameterization of surface albedo in atmospheric
process and climate models (Briegleb and Ramanathan, 1982; Oleson et al, 2003) generally
assume that the diurnal cycle of snow albedo depends only on SZA. In most radiation transfer
models, the diurnal variation of surface albedo is assumed to be symmetric about solar noon and
113
114
115
116
117
118
119
120
121
122
123
124
125
126
127
128
129
130
131
132
133
134
135

forced by the diurnal variation of SZA (Song, 1998). Both regular and irregular changes in the
surface state and environment can negate this assumption (Minnis et al., 1997; Pirazzini, 2004;
Pirazzini, 2006). Consequently, sun-synchronous satellites should consider the diurnal variation
of surface albedo or else risk biasing the monthly or daily mean values composed from
measurements taken instantaneously once daily (Minnis et al., 1997).
Several studies analyze the diurnal variation of snow albedo, yet these studies are all
short-term or experimental campaign measurements that focus on a single station/region (Carrol
and Fitch, 1981; Pirazzini, 2004; Pirazzini, 2006; Wuttke et al., 2006; Meinander et al., 2008).
To our knowledge, no studies have yet been conducted to examine and compare the
climatological amplitude of snow albedo's diurnal and seasonal variation in both polar regions.
Satellites provide near global coverage of snow albedo, though with temporal resolution too
coarse and accuracy too low to capture diurnal variations. Fortunately, the long-term World
Climate Research Programme (WCRP) Baseline Surface Radiation Network (BSRN) in the
World Radiation Monitoring Center (WRMC) provides quality-controlled and consistent
downwelling and upwelling solar irradiance measurements throughout the world, and thus offers
us an chance to analyze the snow albedo's diurnal and seasonal variations in both polar regions
with multi-year datasets. This study will, for the first time, systematically quantify and
intercompare the climatological amplitude of snow albedo's diurnal and seasonal variations in
the Arctic and Antarctic to elucidate similarities and differences in snow albedo cycles across
geographic zones, and to assess how diurnal changes in snow albedo affect the surface energy
budget.
2. Study Sites and Data
136
137
138
139
140
141
142
143
144
145
146
147
148
149
150
151
152
153
154
155
156
157
158

Four BSRN stations (Table 1) reside in the Arctic or Antarctic. Two stations (BAR and
NYA) are in coastal areas of Barrow, Alaska, and Ny-Alesund Island, Spitsbergen. There are
seasonally snow-covered for more than eight months from late September to early June. The
other two stations are located on the coast (GVN) and at the South Pole (SPO) of Antarctica.
Both are on the ice sheet and experience perennial snow. SPO is 2800 m above sea level while
the other three coastal stations have elevation less than 50 m. NYA is located in a tundra
mountain valley, while the other three stations are situated in flat and near uniform areas. These
stations lie in areas with high surface reflectance, little grass (BAR) or no vegetation, and high
SZA, and snow at the coastal stations, being also much warmer than SPO, are vulnerable to the
warming atmosphere and adjacent oceans. Hence the long-term in situ BSRN measurements at
these stations will help to increase our understanding of snow surface properties and their
changes, and hence aid the improvement of surface albedo parameterizations and satellite albedo
retrieval algorithms (McArthur, 2005).
The chief measurements used in this study are air temperature, SW broadband total
downwelling (SWD) and upwelling (SWU) radiation fluxes, and the direct (DIR) and diffuse
(DIF) components of the solar insolation. The air temperature at 2 m height is measured
continuously by a thermometer with uncertainty of ±0.3 °C. The SW broadband solar radiation
(SWD, SWU and DIF) are measured by two types of pyranometers. BAR and SPO use Eppley
Precision Spectral Pyranometers (PSP). GVN and NYA use Kipp & Zonen CM11 and CM21
pyranometers. DIR at the four stations is measured by Eppley Normal Incidence Pyrheliometers
(NIP). The four solar radiation variables are measured separately. DIR and DIF are relative
quantities, and the sum of DIR and DIF does not equal to SWD. DIR and DIF are used to
determine the clearness (or cloud index) of sky.
159
160
161
162
163
164
165
166
167
168
169
170
171
172
173
174
175
176
177
178
179
180
181

Both Kipp & Zonen CM1/21 and Eppley PSP applied at the BSRN stations are high
performance research grade pyranometers. Their spectral response ranges are 0.3-2.8 µm for
CM1/21 and 0.285-2.8 µm for PSP, which cover approximately 98% of the entire solar radiation
at the earth surface. The measurement uncertainties are less than 2% or ±5 W/m2 (whichever is
greater) for SWD, 3% for SWU, 0.5% or ±1.5 W/m2 for DIR, and 2% or ±5 W/m2 for DIF when
SZA is less than 75°; measurements with SZA larger than 80° are not used due to potential large
errors related to the pyranometer's cosine-response quality and impacts of surface topography
(McArthur, 2005; Kipp & Zonen, 2006). Thus, this study restricts its focus to measurements
with SZA less than 75°.
The solar irradiances are sampled once per second and stored as one-minute averages.
These one-minute mean irradiance and temperature data from 2003 to 2008 are retrieved from
the WRMC-BSRN website at http://www.bsrn.awi.de/en/data/data_retrieval_via_pangaea/.
3. Data Processing
One-minute average irradiance data are processed into hourly means by a simple
arithmetic average for values larger than 5 W/m2, the SWD measurement uncertainty. These
hourly data are further used to analyze the mean diurnal cycle within a month, which is the mean
value during each hour from 0:00 to 23:00 within the 30/31 days of a month. Finally, the
surface albedo is calculated using the mean SWU divided by the mean SWD at each hour. The
clearness (or cloud) index in Equation (1) is a simplified normalized diffuse ratio variability test
of clear sky (Long and Ackerman, 2000).
clr=
DIRDIR+DIF (1)
where clr is the clearness index of the sky and range from 0 (overcast) to 1 (clear). Clr is
182
183
184
185
186
187
188
189
190
191
192
193
194
195
196
197
198
199
200
201
202
203
204

normally less than 0.95 because of atmospheric aerosols. Hours with clr <0.3 are defined as
cloudy sky. The mean clr value on cloudy days is less than 0.05, which implies that clouds,
when present, are optically thick.
Our analyses are based on four time scales: 1) ten continuous diurnal cycles (hourly
interval) including cloudy and clear sky days; 2) monthly mean diurnal cycles in December for
SPO and GVN, in May for BAR, and in April for NYA when there is long/intense sunshine
while snow still exists; 3) hourly minimum, mean and maximum based on the monthly mean
diurnal variations from 2003 to 2008; and 4) the seasonal variation, which is the daily mean on
each day from 2003 to 2008. The months (December, May, and April) selected for monthly
mean diurnal cycles were chosen to sample the maximum forcing of snow albedo and its diurnal
variation. The daily mean is the 24-hour mean with SWD and SWU larger than 5 W/m2. All
average calculations are using SWD and SWU, and the mean albedo is finally derived from the
mean SWD and SWU. The diurnal variation here refers to the difference between the daily
maximal value minus the minimal values.
4. Results
4.1 SPO
It is instructive to first examine data from SPO since the SZA there is nearly constant
within a 24-hour period and, indeed, throughout December (Figure 1A). Hence the impact of
SZA on the snow albedo diurnal cycle in December is negligible, though significant (~0.04 as
SZA increases from 66° to 80°) at the seasonal scale (Figure 1D). Air temperatures at SPO are
usually below -20°C, though occasionally reaches -14°C in the six years from 2003-2008
(Figure 1D). Hence the snow is perennially dry, and the snow metamorphism proceeds slowly
205
206
207
208
209
210
211
212
213
214
215
216
217
218
219
220
221
222
223
224
225
226
227

because of the extremely low air temperature (Figure 1A & B). However, the snow albedo at
SPO on clear sky days still has a diurnal variation (of about 0.05) as shown in the first ten days
in December 2003 (Figure 2), which reduces to about 0.035 in the monthly mean diurnal cycle
in December 2003 (Figure 1A), and to about 0.03 in the multi-year mean diurnal cycle in
December from 2003 to 2008 (Figure 1C). During clear sky days, the minimum snow albedo
(Clr_min) in the diurnal cycle is around 0.85, and the maximum snow albedo (Clr_max) has a
similar diurnal pattern with but larger variation than the mean (Clr_mean) snow albedo (Figure
1C). The mean snow albedo varies between 0.85 and 0.88. The strong diurnal cycles disappear
during cloudy skies. With constant SZA and solar radiation and extreme low air temperature,
such strong clear sky diurnal cycles (up to 0.06 in Figure 2) must be associated with SAA and
snow surface features, such as snow dunes, ripples and sastrugi (Weller, 1969; Kuhn and Siogas,
1978; Carroll and Bruce, 1981). The supplementary figure (S.Fig.1) shows a photo of snow
sastrugi at SPO. When SAA is parallel to the long axis and the sun faces the sastrugi slope,
more solar radiation reflects back to the pyranometer, and increases the snow albedo by as much
as 0.06 relative to when SAA is parallel to the long axis and the sun is opposite the slope (higher
side) of the sastrugi (Pirazzini, 2004). The 12-hour intervals between the maximum and
minimum snow albedo also match the relationship of SAA and sastrugi's orientation (Figure 2).
The impact of sastrugi on the snow albedo is between the two extreme situations when SAA is
between 0° and 180° and between 180° and 360° to the long axis of the sastrugi.
The diffusion of incident solar radiation by clouds reduces snow albedo at large SZA
(>66°), such as at SPO, since diffuse radiation has an effective SZA of ~55° (Wiscombe and
Warren, 1980; Warren, 1982). Clouds also shift the spectral distribution of the incident solar
radiation towards the visible due to the high absorption of water vapor and liquid water in near
228
229
230
231
232
233
234
235
236
237
238
239
240
241
242
243
244
245
246
247
248
249
250

infrared wavelengths. Grenfell and Maykut (1977) show that the spectral shift effect exceeds the
diffusion effect in most cases, and leads to a net increase in the integrated snow albedo
(Grenfell and Maykut, 1977). Figure 1A confirms that snow albedo on cloudy days has higher
values than on clear sky days. Clouds also diminish the impact of SAA and sastrugi on snow
albedo's diurnal cycle by diffusing the incident solar radiation (Figure 1A and Figure 2). This
supports the interpretation that the strong diurnal cycle of snow albedo at SPO is likely caused
by snow sastrugi or other inhomogeneous surface features. Since the atmosphere at SPO is
nearly transparent and only five days have thin cloud in December (Table 2), the diurnal cycle of
snow albedo is dominated by the clear-sky patterns. At the daily scale, the mean snow albedo in
December on cloudy days (0.88) is only 0.02 higher than on clear sky days (0.86), with a mean
value of 0.87 in December for both clear and cloudy days.
4.2 GVN
GVN is on the coast of Queen Maud Land and the Weddell Sea, where cloudy days, snow
fall and drifting snow are frequent (Pirazzini, 2004). The snow albedo has a diurnal asymmetry
with larger values in the morning and smaller values in the afternoon (Figure 3A&C). This
diurnal asymmetry also exists in other months from October to February (S.Fig.2.A4), and is
consistent with other observations near this station (Pirazzini, 2004; Wuttke et al., 2006). The
much lower albedo value before 04:00 (solar time) and after 19:00 are likely related to the
instrument measurement errors because the pyranometer has poor cosine-response quality at
SZAs larger than 75° for CM1/21 (McArthur, 2005; Kipp & Zonen, 2006). For instance, on
clear sky days on 27, 28, 29, and 30 November, 2005 (Figure 4), a much lower snow albedo
exists when SZAs exceed 75°. The air temperature is lower than -8°C, thus snow melting and
251
252
253
254
255
256
257
258
259
260
261
262
263
264
265
266
267
268
269
270
271
272
273

liquid water content in snow are negligible and cannot explain the low snow albedo values at
such large SZAs and low air temperature. In contrast, when clouds are present on days 23, 24,
25 and 26 in the same month, the strong diurnal cycles disappear, and the snow albedo increases
to a near constant value of ~0.85 for SZAs larger than 75°. Moreover, the asymmetry of snow
albedo still exists under the lower air temperatures (< -15 °C) of October and February. This
suggests that the diurnal cycles of snow albedo are related to snow surface features and SAA.
On December 15, SZA varies from 48° at noon to 86° at 23:00, while the snow albedo
peaks at 0.83 from 04:00-06:00, then falls to 0.75 from 18:00-19:00 in a reliable SZA range of
the pyranometer (Figure 4A). This is approximately a 12-hour difference between the maximum
and minimum reliable albedo value. This 12-hour difference is co-incidental with the sun
azimuth cycle, indicating that the diurnal asymmetry is associated with surface features and
SAA. The larger SZA in the morning also contributes to a higher albedo. Meanwhile, snow
metamorphism due to strong solar radiation and relatively high coastal air temperatures also
contribute to the lower snow albedo in the afternoon. In summary, the diurnal asymmetry of the
snow albedo implies that the impact of SZA on albedo (particularly in the afternoon) in diurnal
cycles gives ways to other factors, such as snow surface features (sastrugi) and snow
metamorphism. Nevertheless, in Figure 3D, the near symmetric distribution of the seasonal
snow albedo is likely due to the symmetric distribution of SZAs on the seasonal timescale. A
similar symmetric distribution of seasonal snow albedo also occurs in Greenland (Wang and
Zender, 2010a&b).
Snow albedo at GVN is larger ( 0.06 at ~5:00 to 0.12 at ~18:00) on cloudy than clear sky
days (Figure 3A&C, Figure 4). As mentioned earlier, clouds alter snow albedo by shifting the
spectral distribution of surface insolation to visible wavelengths, where snow is more reflective.
274
275
276
277
278
279
280
281
282
283
284
285
286
287
288
289
290
291
292
293
294
295
296

The magnitude of spectral shifting is related to the amount and type of cloud and column water
vapor. At SPO, the daily SWD difference (clear-cloud) between clear and cloudy days in
December is 76 W/m2 or 17% of SWD in clear sky, leading to 0.02 higher albedo on cloudy
days than on clear days (Figure 1C and Table 2). At GVN, the daily SWD difference in
December is 109 W/m2 or 26% of SWD in clear sky, leading to 0.05 higher albedo on cloudy
days (Figure 3C and Table 2). Clouds also diffuse insolation and diminish the effects of surface
features (sastrugi) and SZA on the diurnal cycle of snow albedo. The nearly constant snow
albedo on cloudy days (Figure 3A&C, Figure 4) further suggests that the diurnal asymmetry on
clear sky days at GVN stems from snow surface features and snow metamorphism.
4.3 BAR
Snow at BAR usually begins to melt and disappear in June, and then accumulates again
beginning in late September or October (Figure 6D). To examine the diurnal cycle of snow
albedo, we calculate the hourly mean SWD and SWU for each hour within each month for clear
and cloudy sky. We find similar results from 2003 to 2008 as illustrated for 2005 in Figure 5.
The maximum forcing of snow albedo diurnal variations at BAR occurs in May, when snow still
exists and receives strong insolation. During May, the 23 cloudy days have smaller (-23%)
SWD, higher air temperature, and also higher snow albedo than the clear sky days (Figure
5ABC and Table 2). In contrast, the snow albedo has strong diurnal cycles on clear sky days,
and only weak diurnal cycles on cloudy days, when clouds diffuse insolation and thus diminish
the impact of SZA and snow surface features on snow albedo. The asymmetry of the diurnal
cycle of snow albedo, which peaks near 06:00 and reaches nadir near 15:00, coincident with
maximum air temperature, is consistent with darkening due to snow metamorphism and grain
297
298
299
300
301
302
303
304
305
306
307
308
309
310
311
312
313
314
315
316
317
318
319

growth on clear sky days with relatively higher temperature.
Figure 6 shows the first ten diurnal cycles of snow/surface albedo during the onset of
snow melt in June, 2004, when the air temperature varies from -4 °C to 1 °C and the sun
continuously hangs above the horizon. Snow albedo shows an asymmetric diurnal cycle,
maximal in the morning and minimal in the late afternoon (15:00-18:00). Snow albedo recovers
after 18:00, presumably due to refreezing when the air temperature drops below the freezing
point. When the snow completely disappears on days 8, 9 and 10, the surface albedo has a
symmetric diurnal cycle with a minimum value around noon, consistent with soil albedo
dependence on SZA (Wang et al., 2005). In summary, snow albedo diurnal cycles at BAR seem
mainly determined by snow metamorphism and melt-freeze cycles.
4.4 NYA
Snow at NYA disappears as early as May (Figure 7D) in some years, earlier than at BAR,
hence April is the month of maximum snow forcing. The mean diurnal cycle of snow albedo in
April (Figure 7A, B, C) has a near symmetric diurnal cycle on clear sky days, minimal at noon
and maximal in both morning and afternoon. In April 2005 (Figure 7A), the clear sky snow
albedo increases from 0.69 at noon to 0.81 in the morning and afternoon when SZA is ~80°.
Snow metamorphism, when active, would be expected to reduce snow albedo preferentially
during warm hours, and thus enhance diurnal asymmetry as suggested at BAR and GVN. The
nearly symmetric diurnal cycle, low air temperature (< -5 °C) and small solar radiation variation
(<350 W/m2) all indicate that the impact of snow metamorphism on the diurnal cycle at NYA is
small, and perhaps negligible. Other factors in addition to SZA, such as snow surface features
(snow dunes, sastrugi, etc.) and/or shadowing, are required to explain the large clear sky diurnal
320
321
322
323
324
325
326
327
328
329
330
331
332
333
334
335
336
337
338
339
340
341
342

variations. Snow albedo is nearly constant and up to 0.12 higher on cloudy than clear days,
which are ~4 °C colder (Figure 7A).
The first ten diurnal cycles in May 2005 at NYA (Figure 8) include both clear and cloudy
days. On clear sky days 4, 5, 6 and 10, snow albedo shows symmetric diurnal cycles minimal at
solar noon. This is the only site of the four we examined where the diurnal cycle of snow albedo
matches most radiation transfer model assumptions: the diurnal variation of surface albedo is
symmetric and forced by the diurnal variation of SZA. However, the diurnal cycle is much
larger than models typically predict (Song, 1998; Wang and Zender, 2010). The large diurnal
variation (up to 0.2) of snow albedo suggests that snow surface features somehow amplify SZA
effects to create the large and symmetric diurnal cycles. On cloudy days 8 and 9, the snow
albedo is larger and nearly constant. Clouds exist over half of April, reduce SWD by 46%, and
increase snow albedo by 0.07 at the daily scale (Table 2).
4.5 ASR Difference
The diurnal variations observed at the four BSRN stations show that instantaneous
observations of snow albedo at certain times of a day (e.g., sun-synchronous satellite
measurements) will, if naively extrapolated to daily or longer timescale averages, lead to
systematic biases in the surface energy budget. To quantify the potential biases incurred by
extrapolating instantaneous albedos to time-mean albedos, we compare the difference between
the absorbed solar radiation (ASR0) from the 24-hour mean SWD and SWU, and the ASR
derived from the 24-hour mean SWD and the instantaneous albedo within each hour (Figure 9).
The ASR difference (ASR-ASR0) patterns are opposite to the diurnal cycles of snow albedo
(Figures 1A, 3A, 5A, and 7A). ASR differences vary from -20 to 12 W/m2 at NYA, from -16 to 9
343
344
345
346
347
348
349
350
351
352
353
354
355
356
357
358
359
360
361
362
363
364
365

W/m2 at BAR, from -7 to 20 W/m2 at GVN, and from -6 to 6 W/m2 at SPO. Taking the equatorial
overpass times of satellites Terra (10:30) and Aqua (13:30) as examples, the ASR difference at
10:30 is close to zero for BAR, and -3, -1, and 10 W/m2 for SPO, GVN, and NYA, respectively;
the ASR difference at 13:30 is near zero for GVN, and 4, 5, and 6 W/m2 for SPO, NYA and
BAR, respectively. The 24-hour mean ASR at NYA in April, BAR in May, at GVN and SPO in
December is 39, 65, 83 and 61 W/m2 for clear sky, and 26, 51, 60 and 59 W/m2 for the entire
month including clear and cloudy sky, respectively (Table 2).
Even under ideal conditions that satellite sensors could correctly measure snow albedo,
the satellite-measured albedo on clear-sky days is systematically lower than on cloudy days
(Figures 1AB, 3AB, 5AB, and 7AB). Thus, albedo parameterizations based on satellite
measurements may generate systematic errors in the surface energy budget for cloudy sky days,
particularly in the climate model. The magnitude of errors is dependent on the amount of cloud
and SWD. For instance, the integrated 24-hour mean ASR difference between clear sky and all
sky (ASR1 – ASR2) is 13 (50%), 14 (28%), 23 (38%) and 2 (2%) W/m2 (Table 2) at NYA in
April, BAR in May, GVN and SPO in December, respectively. ASR1 is derived from the clear-
sky SWD and SWU. ASR2 is derived from the monthly mean SWD and SWU for both clear and
cloudy-sky. Recall that these are the months of maximum forcing by snow albedo at each
station. The monthly and annual mean diurnal cycles and ASR difference in each month for each
station are shown in supplementary figures (S.Fig. 2-5). The ASR differences generally increase
from winter to summer and decline from summer to winter. The magnitude of the annual ASR
difference is about one third maximum monthly ASR differences.
5. Summary and Discussion
366
367
368
369
370
371
372
373
374
375
376
377
378
379
380
381
382
383
384
385
386
387
388

The BSRN has made available to the community precise, consistent and interannual
measurements of solar radiation around the world. We use these to investigate the diurnal and
seasonal variations of snow albedo, and to elucidate the difference and similarities at four BSRN
stations in the Arctic and Antarctic from 2003 to 2008. The two Arctic stations (NYA and BAR)
experience seasonal snow cover, while the two Antarctic stations (GVN and SPO) are on the ice
sheet and experience perennial snow cover. We examine the monthly mean diurnal cycle of,
during periods of maximum snow albedo forcing, the early summer months of April at NYA and
May at BAR, and the austral summer month of December at both GVN and SPO. Each station
shows unique diurnal cycles due to regionally different factors that affect snow albedo,
including cloudiness, SZA, SAA, surface features, snow metamorphism, and melt freeze cycles.
Clouds are a major factor in controlling the diurnal cycle of snow albedo at the four
stations. Within a month, cloud cover varies from 5 days in December at SPO, to 23 days in
May at BAR. Clouds reduce the daily SWD from 17% at SPO to 46% at NYA (Table 2). Clouds
also have a diurnal cycle with more clear-sky days from hours 8:00 to 14:00 than in other
periods at these stations. The diurnal cycle of cloud cover is most pronounced at NYA, where
there are 16 clear-sky days from hours 9:00 to 15:00, with up to 8 clear-sky days more than at
other hours (Table 2). Cloud alters the snow albedo through several ways. Clouds shift the solar
radiation spectral distribution of surface insolation by backscattering to space more VIS than
NIR radiation, which tends to reduce snow albedo, while simultaneously absorbing more NIR
than VIS radiation which acts to increase snow albedo. In addition, multiple scattering of
radiation between cloud and snow surface, aka the “snow/ice blink”effect, shifts solar insolation
towards VIS wavelengths, thus increasing the snow albedo (Grenfell and Perovich, 2008).
Gardner and Sharp (2010) show the net effect of cloud absorption, backscatter and multiple
389
390
391
392
393
394
395
396
397
398
399
400
401
402
403
404
405
406
407
408
409
410
411

scattering with the surface is to shift the surface insolation towards VIS wavelengths. This net
effect appears at all stations we examined, increasing snow albedo by 0.07, 0.02, 0.05 and 0.02
at NYA, BAR, GVN and SPO respectively on cloudy days relative to clear (Table 2).
Meanwhile, clouds diffuse direct solar insolation, reducing or eliminating the impact of snow
surface features, SZA and SAA on snow albedo, thus changing the diurnal cycle of snow albedo
(Pirazzini, 2004). Indeed, the snow albedo remains nearly constant on cloudy days (Figures 1A,
4A, 7A, 8A) at the four BSRN stations, also consistent with spectral measurements in January
2004 at GVN by Wuttke et al. (2006).
Snow metamorphism may be classified into equilibrium (or dry) metamorphism-rounds,
kinetic metamorphism-facets, and melt-freeze (or wet) metamorphism. Driving forces behind
snow metamorphism are macroscopic snow temperature gradients, and microscopic vapor
pressure gradients (e.g., Flanner and Zender, 2006). Dry metamorphism results in a net transfer
of water from small to large crystals, which reduces the specific surface area and thus albedo of
snow (e.g., Domine et al., 2006; Picard et al., 2009). Metamorphism proceeds exponentially
faster in warm (e.g., > -5 °C) than cold snow (e.g., < -10 °C), and comes to a virtual standstill at
-40 °C (Colbeck, 1983; Taillandier et al., 2007). Consistent with this behavior, the diurnal cycle
and the snow albedo at SPO remain nearly constant on cloudy days (Figure 1A) which are all at
extremely low air temperature (e.g., < -20 °C) and experience constant solar radiation (and thus
negligible temperature gradients) throughout the diurnal cycle. In contrast, at GVN and BAR
(Figures 3, 5), where afternoon air temperature exceeds -5 °C, the asymmetry of snow albedo
diurnal cycle is consistent with snow metamorphism. During the onset of snow melt in the first
six days of June 2004 at BAR (Figure 6), snow melt-freeze metamorphism clearly exceeds the
impact of cloud on snow albedo and dominates the snow albedo diurnal cycle.
412
413
414
415
416
417
418
419
420
421
422
423
424
425
426
427
428
429
430
431
432
433
434

SZA increases snow albedo because the increased path over which obliquely-incident
photons interact with snow grains allows more multiple scattering and less penetration of and
absorption by the snow surface (Wiscombe and Warren, 1980; Lucht, 1998; Flanner and Zender,
2006). The dependence of snow albedo on SZA is most distinct in April and May at NYA
(Figures 7, 8), where snow albedo has the same diurnal symmetry as SZA. At the seasonal scale,
the snow albedo at GVN and SPO has a symmetric dependence on SZA, minimal in summer
and higher in spring and fall (Figures 1D, 3D). Such near-symmetric seasonal snow albedo
around summer also occurs in Greenland (Wang and Zender, 2010a&b). At BAR and NYA, the
seasonal snow albedo shows an increase trend with SZA, too (Figures 5D, 7D). However, at
very large SZA (e.g., > 80°) the shadowing effect of an uneven snow surface can decrease the
snow albedo. For example, on days 27-30, November, 2005 at GVN (Figure 4), the much lower
snow albedo (< 0.7) when SZA>80° is consistent with a shadowing effect by an uneven snow
surface in addition to the pyranometer's cosine-response error, and to the reduction of the
effective SZA by long-path atmospheric (Rayleigh and aerosol) scattering.
Surface features effects on snow albedo are related to SZA, SAA and the orientation,
surface slope and size of the features (e.g., sastrugi). SAA and sastrugi's orientation and slope
determine the sign of the effects, while SZA and sastrugi's depth determine the magnitude. Snow
albedo is greatest when the sun faces the reclined side and is parallel to the long axis of the
surface feature. At SPO with constant SZA ( 67°) and negligible snow metamorphism (Figure 1-
2), the diurnal cycle of snow albedo is very likely due to the snow sastrugi, consistent with the
0.06 diurnal variation of snow albedo attributable to sastrugi found earlier (Wiscombe and
Warren, 1980; Carrol and Fitch, 1981). The about 12-hour difference between the maximum and
minimum reliable albedo at GVN coincides with the diurnal cycle of SAA, indicating that
435
436
437
438
439
440
441
442
443
444
445
446
447
448
449
450
451
452
453
454
455
456
457

surface features and SAA also contribute to the diurnal asymmetry, in addition to snow
metamorphism (Figures 3AC). At NYA (Figures 7AC, 8), surface features may also contribute to
the large diurnal variation of snow albedo. However, at all locations the impact of sastrugi, SAA
and SZA can be overwhelmed by the diffusing effects of overcast cloud.
At very large SZA (e.g., > 80°), the clear sky diffuse insolation increases due to
atmospheric (Rayleigh and aerosol) scattering, thus the effective SZA becomes less than the real
SZA, resulting in lower snow albedo (Wiscombe and Warren, 1980). At GVN (Figures 3, 4), the
much lower snow albedo in clear sky at SZA > 80° is consistent with reduction in effective SZA
by long-path scattering, in addition to the instruments' cosine-response error and the shadowing
effects of uneven snow surfaces (Strahler et al., 1999; McArthur, 2005; Kipp & Zonen, 2006).
6. Conclusions
The snow albedo at the four BSRN stations in both the Arctic and Antarctica displays
different magnitudes and patterns of diurnal variation. These diurnal variations are dominated
by different factors at each station, and depend on dynamically changing snow properties and
environmental conditions. Satellite measured clear sky snow albedos will be lower (and thus, if
treated naively, underestimate) the all-sky snow albedo. One-time instantaneous observations
also lead to systematic biases if snow albedo diurnal variations are neglected. Snow albedo is, at
these BSRN stations, usually not symmetric around solar noon, though the solar noon albedo is
most important because of the peak solar radiation. Sometimes, e.g., for the asymmetric snow
albedo diurnal variation at SPO and GVN, snow albedo near solar noon does best represent the
24-hour mean snow albedo. In other locations like NYA, solar noon coincides with minimal
snow albedo, consistent with most current climate model parameterizations. The local times
458
459
460
461
462
463
464
465
466
467
468
469
470
471
472
473
474
475
476
477
478
479
480

most representative of 24-hour mean snow albedo are 10:30, 11:30, 13:30 and 14:30 for BAR,
SPO, GVN and NYA, respectively. The instantaneous forcing due to the difference between
instantaneous albedo and the 24-hour mean albedo is up to 50% of ASR. Snow-atmosphere
radiative transfer models and other snow models coupled to general circulation models should
also consider the diurnal variation of snow albedo in order to better represent the consequent
fast-timescale feedbacks, e.g., snow melt-albedo feedback.
Acknowledgments. We thank all the researchers who deploy, operate, and maintain the World
Climate Research Programme (WCRP) Baseline Surface Radiation Network (BSRN) stations
that provide the in situ measurements on air temperature, shortwave upwelling, downwelling,
direct and diffuse solar radiation used here. Funding for this work is provided by NASA
International Polar Year (IPY) Program, NASA NNX07AR23G, and by NSF OPP ARC-
0714088.
481
482
483
484
485
486
487
488
489
490
491
492
493

References:
Briegleb, B.P. and V. Ramanathan. 1982. Spectral and diurnal variations in clear sky planetary albedo. J. Climate Appl. Meteorol., 21, 1168–1171.
Brooks, D.R., E.F. Harrison, P. Minnis, J.T. Suttles and R.S. Kandel. 1986. Development of algorithms for understanding the temporal variability of the Earth’s radiation balance. Rev. Geophys., 24, 422–438.
Carroll, J.J. and B.W. Fitch. 1981. Effects of solar elevation and cloudness on snow albedo at the South Pole. J. Geophys. Res., 86, 5271-5276.
Colbeck, S.C. 1983. Theory of metamorphism of dry snow. J. Geophys. Res., 88, C9, 5475-5482.
Domine, F., R. Salvatori, L. Legagneux, R. Salzano, M. Fily and R. Casacchia. 2006. Correlation between the specific surface area and the short wave infrared (SWIR) reflectance of snow. Cold Regions Science and Technology, 46, 60-68.
Flanner, M. G. and C. S. Zender. 2006. Linking snowpack microphysics and albedo evolution, J. Geophys. Res., 111(D12), D12208, doi:10.1029/2005JD006834.
Flanner, M.G., C.S. Zender, J.T. Randerson and P.J. Rasch. 2007. Present-day climate forcing and response from black carbon in snow. J. Geophys. Res.,112, D11202, doi:10.1029/2006JD008003.
Gardner, A.S. and M.J. Sharp. 2010. A review of snow and ice albedo and the development of a new physically based broadband albedo parameterization. J. Geophys. Res., doi:10.1029/2009JF001444.
Grenfell, T.C. and D.K. Perovich. 2008. Incident spectral irradiance in the Arctic Basin during the summer and fall, J. Geophys. Res., 113, D12117, doi:10.1029/2007JD009418.
Grenfell, T. C. and G. A. Maykut. 1977. The optical properties of ice and snow in the Arctic Basin. J. Glaciol., 18, 445 – 463.
Hall, A. 2004. The role of surface albedo feedback in climate. Journal of Climate, 17, 1550-1568.
Jin, Y., C. B. Schaaf, C. E. Woodcock, F. Gao, X. Li, A. H. Strahler,W. Lucht and S. Liang . 2003. Consistency of MODIS surface bidirectional reflectance distribution function and albedo retrievals: 2. Validation. J. Geophys. Res., 108(D5), 4159, doi:10.1029/2002JD002804.
Kipp & Zonen. 2006. CMP series pyranometer instruction manual. Manual version: 0806. January 4, 2010, online retrieved at: http://www.kippzonen.com/.
Kuhn, M. and L. Siogas. 1978. Spectroscopic studies at McMurdo, South Pole and Siple stations during the austral summer 1977-78. Antarctic. J.U.S., 13, 178-179.
Long, C.N. and T.P. Ackerman. 2000. Identification of clear skies from broadband pyranometer measurements and calculation of downwelling shortwave clouds effects. J. Geophys. Res., 105, 15609-15626.
Lucht, W., C. B. Schaaf and A. H. Strahler. 2000. An algorithm for the retrieval of albedo from space using semiempirical BRDF models, IEEE Trans. Geosci. Remote Sens., 38, 977 – 998.
494495496497
498499500
501502
503504
505506507
508509
510511512
513514515
516517
518519
520521
522523524
525526
527528
529530531
532533

McArthur, L.J.B. 2005. World Climate Research Programme, Baseline Surface Radiation Network (BSRN). WCRP-121, WMO/TD-NO.1274. Online retrieved on Nov 17, 2009 at: http://www.bsrn.awi.de/en/other/publications/.
Meinander, O., A. Konku, K. Lakkala, A. Heikkilä, L. Ylianttila and M. Toikka. Diurnal variations in the UV albedo of arctic snow. 2008. Atmospheric Chemistry and Physics, 8, 6551-6563.
Minnis, P., S. Mayor, W.L. Smith, Jr., and D.F. Young. 1997. Asysmetry in the diurnal variation of surface albedo. IEEE Transcations on Geoscience and Remote Sensing, 35,No.4, 879-891.
Oleson, K.W., G.B. Bonan, C.B. Schaaf, F. Gao,Y. Jin and A.H. Strahler. 2003. Assessment of global climate model land surface albedo using MODIS data. Geophys. Res. Lett., 30(8), 1443, doi:10.1029/2002GL016749.
Picard, D., L. Arnaud, F. Domine and M. Fily. 2009. Determining snow specific surface area from near-infrared reflectance measurements: Numerical study of the influence of grain shape. Cold Regions Science and Technology, 56, 10-17.
Pirazzini R. 2004. Surface albedo measurements over Antarctic sites in summer. J. Geophys. Res., 109, D20118, doi:10.1029/2004JD004617.
Pirazzini,R., T. Vihma, M.A. Granskog and B. Cheng. 2006. Surface albedo measurements over sea ice in the Baltic Sea during the spring snowmelt period. Annals of Glaciology, 44, 7-14.
Roesch, A. 2006. Evaluation of surface albedo and snow cover in AR4 coupled climate models. J. Geophys. Res., 111, D15111, doi:10.1029/2005JD006473.
Salomon, J.G., C.B. Schaaf, A.H. Strahler, F. Gao, Y. Jin. 2006. Validation of the MODIS bidirectional reflectance distribution function and albedo retrievals using combined observations from the Aqua and Terra platforms. IEEE Transactions on Geoscience and Remote Sensing, 44, 1555-1565, DOI:10.1109/TGRS.2006.871564.
Schaepman-Strub, G., M.E. Schaepman, T.H. Painter, S. Dangel and J.V. Martonchik. 2006. Reflectance quantities in optical remote sensing-definitions and case studies. Remote Sensing of Environment, 103, 27-42.
Song, J. 1998. Diurnal asymmetry in surface albedo. Agriculture and Forest Meteorology, 92, 181-189.
Taillandier, A.-S., F. Domine, W.R. Simpson, M. Sturm and T.A. Douglas. 2007. Rate of decrease of the specific surface area of dry snow: Isothermal and temperature gradient conditions. J. Geophys. Res., 112, F03003, doi:10.1029/2006JF000514.
Strahler, A.H., J.P. Muller, W. Lucht, C.B. Schaaf, et al. 1999. MODIS BRDF/Albedo product: algorithm theoretical basis document. MODIS Product ID: MOD43, Version 5.0, April, 1999.
Wang, Z., M. Barlage, X. Zeng, R.E. Dickinson and C.B. Schaaf. 2005. The solar zenith angle dependence of desert albedo. Geophys. Res. Lett.,, 32, L0543, doi:10.1029/2004GL021835.
Wang, X. and C. Zender. 2010a. MODIS albedo bias at high zenith angle relative to theory and to in situ observations in Greenland. Remote Sensing of Environment, 114, 563-575, doi:10.1016/j.rse.2009.10.014.
534535536
537538539
540541
542543544
545546547
548549
550551
552553
554555556557
558559560
561562
563564565
566567
568569
570571572

Wang, X. and C. Zender. 2010b.Constraining MODIS snow albedo at large solar zenith angles: Implications for the surface energy budget in Greenland. J. Geophys. Res., doi:10.1029/2009JF001436, in press.
Warren, S.G. 1982. Optical properties of snow. Review of Geophysics and space Physics, 20, 67-89.
Warren, S.G. and W.J. Wiscombe. 1980. A model for the spectral albedo of snow. II: snow containing atmospheric aerosols. Journal of the Atmospheric Sciences, 37, 2734-2745.
Weller, G.E. 1969. Radiation diffusion in Antarctic ice media. Nature, 221, 335-356.
Wiscombe, W.J. and S.G. Warren. 1980. A model for the spectral albedo of snow. I: pure snow. Journal of the Atmospheric Sciences, 37, 2712-2733.
Wuttke, S., G. Seckmeyer, and G. Kőnig-Lango. 2006. Measurements of spectral snow albedo at Neumayer, Antarctica. Annales Geophysicae, 24, 7-21.
573574575
576577
578579
580
581582
583584
585

Figure titles:
Figure 1. The monthly mean diurnal cycle of snow albedo and air temperature (A) and the shortwave broadband total downwelling and upwelling solar irradiance (B) for clear sky (26 days) and cloudy sky (5 days) at SPO in December, 2003; the multi-year mean diurnal cycle in December from 2003, 2006 and 2007 (C ); the seasonal (daily mean from 2003, 2006 and 2007) variation of snow albedo at SPO (D). The SWD and SWU data in 2004, 2005 and 2008 are not used here because of instrumental problems.
Figure 2. Diurnal cycles in the first ten days of December, 2003, at SPO. “Clear” is the sky clearness or cloud index (0 is overcast sky) derived from Equation (1). The SZA in December at SPO is nearly constant at 67° with azimuth angles of 0° to 360°. The maximum air temperature during these ten days was below -20 °C.
Figure 3. The mean diurnal cycle of snow albedo and air temperature (A) and the shortwave broadband total downwelling and upwelling solar irradiance (B) for clear sky (12 days) and cloudy sky (19 days) at GVN in December, 2003; the hourly mean diurnal cycle in December from 2003-2008 (C ); the seasonal (daily mean from 2003-2008) variation of snow albedo (D). The snow albedo values in clear sky days when SZA is larger than 75° (A) beyond two vertical lines are not reliable because of the pyranometer's cosine-response error at large SZAs.
Figure 4. Diurnal cycles of in situ snow albedo, air temperature, and cloud index in the last ten days of November, 2005, at GVN. “Clear” is the sky clearness or cloud index (0 is overcast sky, 1 is cloudless sky) derived from Equation (1). The SZA on November 25 at GVN varies from 49° at solar noon to 88° at 0:00.
Figure 5. The mean diurnal cycle of snow albedo and air temperature (A) and the shortwave broadband total downwelling and upwelling solar irradiance (B) for clear sky (8 days) and cloudy sky (23 days) at BAR in May, 2005; the hourly mean diurnal cycle in May from 2003-2008 (C ); the seasonal (daily mean from 2003-2008) variation (D).
Figure 6. Diurnal cycles of in situ snow albedo, air temperature, and cloud index in the first ten days of June, 2004, at BAR. “Clear” is the sky clearness or cloud index (0 is overcast sky) derived from Equation (1). The SZA on June 5 varies from 49° at local noon to 85° at local 23:00. The sun is always above the horizon during this period.
Figure 7. The mean diurnal cycle of snow albedo and air temperature (A) and the shortwave broadband total downwelling and upwelling solar irradiance (B) for clear sky (13 days) and cloudy sky (17 days) at NYA in April, 2005; the hourly mean diurnal cycle in April from 2003-2008 (C ); the seasonal (daily mean from 2003-2008) variation (D), and the daily values are derived from the 24-hour period when both SWD and SWU are larger than 5 W/m2.
Figure 8. Diurnal cycles of in situ snow albedo, air temperature, and cloud index in the first ten days of May, 2005, at NYA. “Clear” is the sky clearness or cloud index (0 is overcast sky) derived from Equation (1). The SZA on May 5 varies from 62° at local noon to 85° at local 23:00. The sun is always above the horizon during this period.
586587588589590591592593594595596597598599600601602603604605606607608609610611612613614615616617618619620621622623624625626627628629630631

Figure 9. The difference of absorbed solar radiation (ASR) in clear-sky days on the snow surface derived from the daily mean SWD and SWU (ASR0) and from the daily mean SWD and one instantaneous albedo within each hour, which is assumed to represent the instantaneous albedo measurement from a sun-synchronous satellite. This instantaneous albedo also represents the daily albedo to assess the ASR difference for satellite's instantaneous measurements (ASR) versus the 24-hour mean value (ASR0). The daily mean ASR at NYA in April, BAR in May, GVN and SPO in December is 39, 65, 83 and 61 W/m2 for clear sky, and 26, 51, 60 and 59 W/m2 for the entire month for clear and cloudy sky, respectively (Table 2). The two vertical green lines indicate the equatorial pass time of Terra and Aqua satellites that onboard MODIS instruments.
632633634635636637638639640641642643644

Table 1. Study sites in Arctic and Antarctica
Station ID Area Name Latitude Longitude
22 (BAR) 8 71.323 -156.607
11 (NYA) 11 78.925 11.950
13 (GVN) 42 -70.650 -8.250
26 (SPO) 2800 -89.983 -24.799
Surface /topography Type
Elevation (m)
Barrow, Alaska, USA
tundra; flat, rural.
Ny-Ålesund, Spitsbergen
tundra; mountain valley
Georg von Neumaye, Antarctica
iceshelf; flat, rural
South Pole, Antarctica
glacier, accumulation area; flat, rural
645646647
649650651

Table 2. Mean (2003-2008) number of days at each hour for clear and cloudy skies, and the daily (24-hour) average in each month at four BSRN stations. The daily albedo1 and ASR1 are for clear and cloudy sky days separately, and the daily albedo2 and ASR2 are for both clear and cloudy sky days.
Stations NYA BAR GVN SPOMonth April May December DecemberHour\sky Clear Cloud Clear Cloud Clear Cloud Clear Cloud
0 8 23 5 26 12 19 25 61 11 21 6 25 12 19 24 72 11 20 8 24 11 20 26 53 13 18 7 24 12 19 27 44 14 17 7 24 12 19 27 45 13 18 7 24 12 19 26 56 15 16 8 23 13 18 27 47 15 17 8 23 12 19 26 58 15 16 10 22 14 18 27 49 17 14 9 22 13 18 27 4
10 16 15 10 21 13 18 27 411 16 15 9 22 13 18 27 412 16 15 10 21 14 17 28 313 15 16 12 20 13 18 27 414 16 16 10 21 12 19 26 515 16 15 9 22 12 19 27 416 14 18 8 23 13 19 26 517 13 18 8 23 13 18 26 518 12 20 9 22 13 18 26 519 11 20 8 23 13 18 27 420 11 20 9 22 13 18 28 321 10 21 9 22 12 19 27 422 9 22 8 23 12 19 26 523 9 23 6 25 11 20 26 5
mean days 13 18 8 23 12 19 26 5Daily SWD 159 86 300 231 417 308 446 370
46% 69 23% 109 26% 76 17%Daily Albedo1 0.75 0.82 0.78 0.80 0.80 0.85 0.86 0.88Daily Albedo2 0.78 (For all sky) 0.80 0.83 0.87Daily ASR1 39 16 65 45 83 45 61 43Daily ASR2 26 51 60 59
SWD reduction (Clr-Cld)/Clr 73 (W/m2)
652653654
656

Figure 1. The monthly mean diurnal cycle of snow albedo and air temperature (A) and the shortwave broadband total downwelling and upwelling solar irradiance (B) for clear sky (26 days) and cloudy sky (5 days) at SPO in December, 2003; the multi-year mean diurnal cycle in December from 2003, 2006 and 2007 (C ); the seasonal (daily mean from 2003, 2006 and 2007) variation of snow albedo at SPO (D). The SWD and SWU data in 2004, 2005 and 2008 are not used here because of instrumental problems.
67 67 67 67 67 67 67 67 67 67 67 67 67 67 67 67 67 67 67 67 67 67 67200
300
400
500
600
SZA
Hour 0 1 2 3 4 5 6 7 8 9 10 11 12 13 14 15 16 17 18 19 20 21 22 23
swd_clrswu_clrswd_cldswu_cld
B. Dec 2003, SPO
Sola
r Irra
dian
ce (W
/m2)
.50
.60
.70
.80
.90
1.00
-60
-50
-40
-30
-20
-10
Oct Nov Dec Jan Feb
Albd_SPOSZA/100T_2m
D. Daily mean, SPO
Albe
do &
SZA
/100
T_2
(oC
)
67 67 67 67 67 67 67 67 67 67 67 67 67 67 67 67 67 67 67 67 67 67 67.75
.80
.85
.90
.95
-28
-26
-24
-22
-20
SZA
Hour 0 1 2 3 4 5 6 7 8 9 10 11 12 13 14 15 16 17 18 19 20 21 22 23
Albd_clrAlbd_cldT_2m_clrT_2m_cld
A. Dec 2003, SPO
Alb
edo
T_2
(oC
)
67 67 67 67 67 67 67 67 67 67 67 67 67 67 67 67 67 67 67 67 67 67 67.80
.85
.90
.95
SZA Hour 0 1 2 3 4 5 6 7 8 9 10 11 12 13 14 15 16 17 18 19 20 21 22 23
Clr_minClr_meanClr_maxCld_minCld_meanCld_max
C. Dec 2003, 2006, 2007, SPO
Albe
do
657
658659660661662663664

Figure 2. Diurnal cycles in the first ten days of December, 2003, at SPO. “Clear” is the sky clearness or cloud index (0 is overcast sky) derived from Equation (1). The SZA in December at SPO is nearly constant at 67° with azimuth angles of 0° to 360°. The maximum air temperature during these ten days was below -20 °C.
10
13
16
19
112
115
118
121
20
23
26
29
212
215
218
221
30
33
36
39
312
315
318
321
40
43
46
49
412
415
418
421
50
53
56
59
512
515
518
521
60
63
66
69
612
615
618
621
70
73
76
79
712
715
718
721
80
83
86
89
812
815
818
821
90
93
96
99
912
915
918
921
100
103
106
109
1012
1015
1018
1021
0.75
0.8
0.85
0.9
0.95
1
0
100
200
300
400
500
swuswdClearAlbd_SPO
A. Day and Hour, December 2003, SPO
Albe
do &
cle
arne
ss
SW
D/S
WU
(W/m
2)
666667668669670671

Figure 3. The mean diurnal cycle of snow albedo and air temperature (A) and the shortwave broadband total downwelling and upwelling solar irradiance (B) for clear sky (12 days) and cloudy sky (19 days) at GVN in December, 2003; the hourly mean diurnal cycle in December from 2003-2008 (C ); the seasonal (daily mean from 2003-2008) variation of snow albedo (D). The snow albedo values in clear sky days when SZA is larger than 75° (A) beyond two vertical lines are not reliable because of the pyranometer's cosine-response error at large SZAs.
86 85 82 79 75 70 66 61 56 52 49 48 48 49 52 56 61 66 71 75 79 83 85 86
200
400
600
800
1000
SZA
Hour 0 1 2 3 4 5 6 7 8 9 10 11 12 13 14 15 16 17 18 19 20 21 22 23
swd_clrswu_clrswd_cldswu_cld
B. Dec 2005, GVN
Sola
r Irra
dian
ce (W
/m2)
.40
.50
.60
.70
.80
.90
1.00
-30
-25
-20
-15
-10
-5
0
Oct Nov Dec Jan Feb
Albd_GVNSZA/100T_2m
D. Daily mean, GVN
Albe
do &
SZA
/100
T_2
(oC
)
86 85 82 79 75 70 66 61 56 52 49 48 48 49 52 56 61 66 71 75 79 83 85 86.70
.75
.80
.85
.90
.95
-10
-8
-6
-4
-2
0
SZA
Hour 0 1 2 3 4 5 6 7 8 9 10 11 12 13 14 15 16 17 18 19 20 21 22 23
Albd_clrAlbd_cldT_2m_clrT_2m_cld
A. Dec 2005, GVN
Alb
edo
T_2
(oC
)
85 82 79 75 70 66 61 56 52 49 48 48 49 52 56 61 66 71 75 79 83 85 86.60
.65
.70
.75
.80
.85
.90
SZA Hour 0 1 2 3 4 5 6 7 8 9 10 11 12 13 14 15 16 17 18 19 20 21 22 23
Clr_minClr_meanClr_maxCld_minCld_meanCld_max
C. Dec 2003-2008, GVN
Albe
do
673
674675676677678679680

Figure 4. Diurnal cycles of in situ snow albedo, air temperature, and cloud index in the last ten days of November, 2005, at GVN. “Clear” is the sky clearness or cloud index (0 is overcast sky, 1 is cloudless sky) derived from Equation (1). The SZA on November 25 at GVN varies from 49° at solar noon to 88° at 0:00.
210
213
216
219
2112
2115
2118
2121
220
223
226
229
2212
2215
2218
2221
230
233
236
239
2312
2315
2318
2321
240
243
246
249
2412
2415
2418
2421
250
253
256
259
2512
2515
2518
2521
260
263
266
269
2612
2615
2618
2621
270
273
276
279
2712
2715
2718
2721
280
283
286
289
2812
2815
2818
2821
290
293
296
299
2912
2915
2918
2921
300
303
306
309
3012
3015
3018
3021
0
0.1
0.2
0.3
0.4
0.5
0.6
0.7
0.8
0.9
1
-20
-16
-12
-8
-4
0
T_2ClearAlbd_GVNSZA_GVN
B. Day and Hour, November 2005, GVN
Alb
edo
, cl
ea
rne
ss &
SZ
A/1
00
T_2
(oC
)
682683684685

Figure 5. The mean diurnal cycle of snow albedo and air temperature (A) and the shortwave broadband total downwelling and upwelling solar irradiance (B) for clear sky (8 days) and cloudy sky (23 days) at BAR in May, 2005; the hourly mean diurnal cycle in May from 2003-2008 (C ); the seasonal (daily mean from 2003-2008) variation (D).
88 86 82 78 74 69 64 60 56 54 52 53 54 57 61 66 70 75 79 83 86
200
400
600
800
SZA
Hour 0 1 2 3 4 5 6 7 8 9 10 11 12 13 14 15 16 17 18 19 20 21 22 23
swd_clrswu_clrswd_cldswu_cld
B. May 2005, BAR
Sola
r Irra
dian
ce (W
/m2)
88 86 82 78 74 69 64 60 56 54 52 53 54 57 61 66 70 75 79 83 86.70
.75
.80
.85
.90
-12
-9
-6
-3
0
SZA
Hour 0 1 2 3 4 5 6 7 8 9 10 11 12 13 14 15 16 17 18 19 20 21 22 23
Albd_clrAlbd_cldT_2m_clrT_2m_cld
A. May 2005, BAR
Albe
do
T_2
(oC
)
.00
.20
.40
.60
.80
1.00
-30
-20
-10
0
10
20
Feb Mar Apr May Jun Jul Aug Sep Oct
Albd_BARSZA/100T_2m
D. Daily mean, BAR
Albe
do &
SZA
/100
T_2
(oC
)
88 86 82 78 74 69 64 60 56 54 52 53 54 57 61 66 70 75 79 83 86.70
.75
.80
.85
.90
SZA Hour 0 1 2 3 4 5 6 7 8 9 10 11 12 13 14 15 16 17 18 19 20 21 22 23
Clr_minClr_meanClr_maxCld_minCld_meanCld_max
C. May 2003-2008, BAR
Albe
do
686687
688689690691692693694695

Figure 6. Diurnal cycles of in situ snow albedo, air temperature, and cloud index in the first ten days of June, 2004, at BAR. “Clear” is the sky clearness or cloud index (0 is overcast sky) derived from Equation (1). The SZA on June 5 varies from 49° at local noon to 85° at local 23:00. The sun is always above the horizon during this period.
10
13
16
19
112
115
118
121
20
23
26
29
212
215
218
221
30
33
36
39
312
315
318
321
40
43
46
49
412
415
418
421
50
53
56
59
512
515
518
521
60
63
66
69
612
615
618
621
70
73
76
79
712
715
718
721
80
83
86
89
812
815
818
821
90
93
96
99
912
915
918
921
100
103
106
109
1012
1015
1018
1021
0
0.1
0.2
0.3
0.4
0.5
0.6
0.7
0.8
0.9
1
-10
-8
-6
-4
-2
0
2
4
6
8
10ClearT_2Albd_BAR
B. Day and Hour, June 2004, BAR
Alb
edo
T_2
(oC
)
697698699700701702703

Figure 7. The mean diurnal cycle of snow albedo and air temperature (A) and the shortwave broadband total downwelling and upwelling solar irradiance (B) for clear sky (13 days) and cloudy sky (17 days) at NYA in April, 2005; the hourly mean diurnal cycle in April from 2003-2008 (C ); the seasonal (daily mean from 2003-2008) variation (D), and the daily values are derived from the 24-hour period when both SWD and SWU are larger than 5 W/m2.
88 86 84 81 78 75 73 71 70 69 69 70 72 74 77 80 82 85 87.60
.65
.70
.75
.80
.85
.90
-16
-14
-12
-10
-8
-6
-4
SZA Hour 0 1 2 3 4 5 6 7 8 9 10 11 12 13 14 15 16 17 18 19 20 21 22 23
Albd_clrAlbd_cldT_2m_clrT_2m_cld
A. April 2005, NYA
Alb
edo
T_2
(oC
)
88 86 84 81 78 75 73 71 70 69 69 70 72 74 77 80 82 85 87
100
200
300
400
500
600
SZA
Hour 0 1 2 3 4 5 6 7 8 9 10 11 12 13 14 15 16 17 18 19 20 21 22 23
swd_clrswu_clrswd_cldswu_cld
B. April 2005, NYA
Sola
r Irra
dian
ce (W
/m2)
.00
.20
.40
.60
.80
1.00
-30
-20
-10
0
10
20
March Apr May Jun Jul Aug Sep Oct
Albd_BARSZA/100T_2
D. Daily mean, NYA
Albe
do &
SZA
/100
T_2
(oC
)
88 86 84 81 78 75 73 71 70 69 69 70 72 74 77 80 82 85 87.60
.65
.70
.75
.80
.85
.90
SZA Hour 0 1 2 3 4 5 6 7 8 9 10 11 12 13 14 15 16 17 18 19 20 21 22 23
Clr_minClr_meanClr_maxCld_minCld_meanCld_max
C. April 2003-2008, NYA
Albe
do
705706707708709710711

Figure 8. Diurnal cycles of in situ snow albedo, air temperature, and cloud index in the first ten days of May, 2005, at NYA. “Clear” is the sky clearness or cloud index (0 is overcast sky) derived from Equation (1). The SZA on May 5 varies from 62° at local noon to 85° at local 23:00. The sun is always above the horizon during this period.
10
13
16
19
112
115
118
121
20
23
26
29
212
215
218
221
30
33
36
39
312
315
318
321
40
43
46
49
412
415
418
421
50
53
56
59
512
515
518
521
60
63
66
69
612
615
618
621
70
73
76
79
712
715
718
721
80
83
86
89
812
815
818
821
90
93
96
99
912
915
918
921
100
103
106
109
1012
1015
1018
1021
0
0.1
0.2
0.3
0.4
0.5
0.6
0.7
0.8
0.9
1
-8
-7
-6
-5
-4
-3
-2
-1
0
1
2
T_2ClearAlbd_NYASZA_NYA
Day and Hour, May 2005, NYA
Alb
edo
, C
lea
r &
SZ
A/1
00
T_
2 (
oC
)
713714715716717
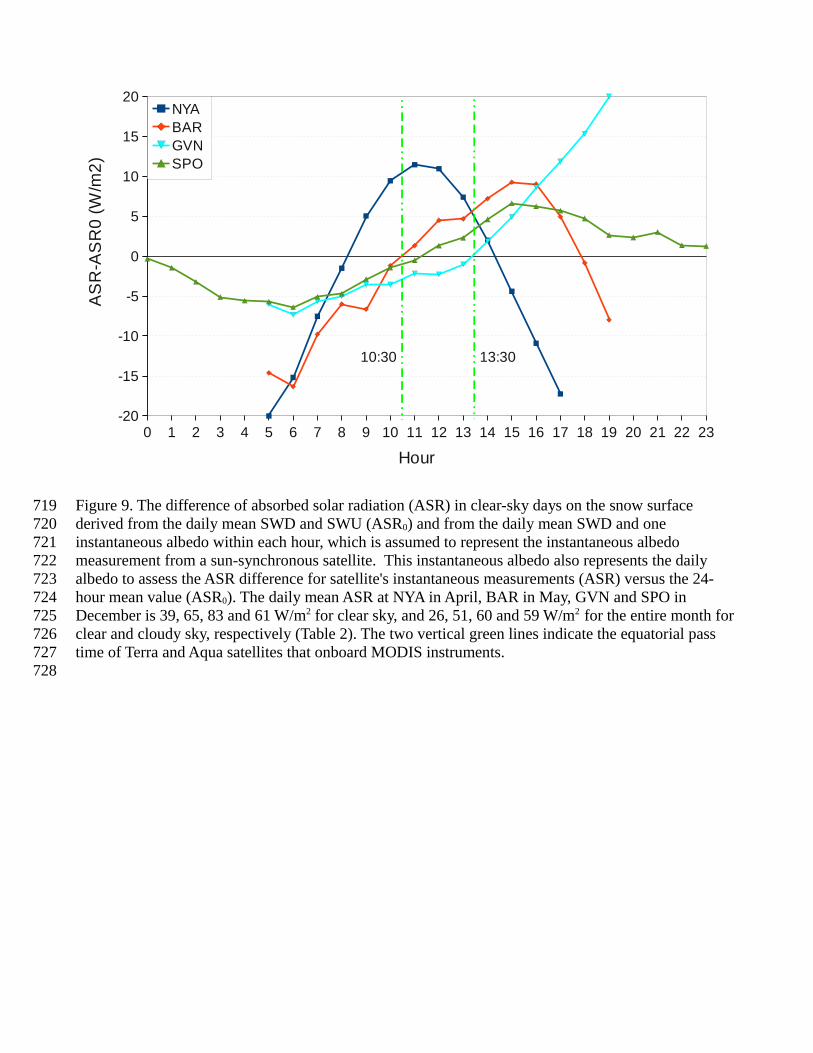
Figure 9. The difference of absorbed solar radiation (ASR) in clear-sky days on the snow surface derived from the daily mean SWD and SWU (ASR0) and from the daily mean SWD and one instantaneous albedo within each hour, which is assumed to represent the instantaneous albedo measurement from a sun-synchronous satellite. This instantaneous albedo also represents the daily albedo to assess the ASR difference for satellite's instantaneous measurements (ASR) versus the 24-hour mean value (ASR0). The daily mean ASR at NYA in April, BAR in May, GVN and SPO in December is 39, 65, 83 and 61 W/m2 for clear sky, and 26, 51, 60 and 59 W/m2 for the entire month for clear and cloudy sky, respectively (Table 2). The two vertical green lines indicate the equatorial pass time of Terra and Aqua satellites that onboard MODIS instruments.
0 1 2 3 4 5 6 7 8 9 10 11 12 13 14 15 16 17 18 19 20 21 22 23-20
-15
-10
-5
0
5
10
15
20
10:30 13:30
NYABARGVNSPO
Hour
AS
R-A
SR
0 (
W/m
2)
719720721722723724725726727728