archival study of the ulx population in nearby galaxies · 1 source of acquisition nasa goddard...
TRANSCRIPT
1 Source of Acquisition NASA Goddard Space Flight Center
0
X M M - N e w t o n Archival Study of the ULX Population in Nearby Galaxies
Lisa M. Winter
Astronomy Department, University of Maryland, College Park, M D 20742
Richard F. Mushotzky
Goddard Space Flight Center, Greenbelt, MD 20771
Christopher S. Reynolds
Astronomy Department, University of Maryland, College Park, MD %V42
ABSTRACT
We present the results of an archival XMM-Newton study of the bright X-ray point sources (Lx > 103’ergs-’) in 32 nearby galaxies. From our list of approximately 100 point sources, we attempt t o determine if there is a low-state counterpart to the Ultra- luminous X-ray (ULX) population, searching for a soft-hard state dichotomy similar to that known for Galactic X-ray binaries and testing the specific predictions of the IMBH hypothesis. To this end, we searched for “low-state” objects, which we defined as objects within our sample which had a spectrum well fit by a simple absorbed power law, and ”high-state” objects, which we defined as objects better fit by a combined blackbody and a power law. Assuming tha t “low-state)) objects accrete at approximately 10% of the Eddington luminosity (Done & Gierlinski 2003) and tha t “high-state” objects ac- Crete near the Eddington luminosity we further divided our sample of sources into low and high state ULX sources. We classify 16 sources as low-state ULXs and 26 objects as high-state ULXs. As in Galactic black hole systems, the spectral indices, I?, of the low- state objects, as well as the luminosities, tend t o be lower than those of the high-state objects. The observed range of blackbody temperatures for the high state is 0.1-1 keV, with the most luminous systems tending toward the lowest temperatures. We therefore divide our high-state ULXs into candidate IMBHs (with blackbody temperatures of ap- proximately 0.1 keV) and candidate stellar mass BHs (with blackbody temperatures of approximately 1.0 keV). A subset of the candidate stellar mass BHs have spectra that are well-fit by a Comptonization model, a property similar of Galactic BHs radiating in the “very-high” state near the Eddington limit.
https://ntrs.nasa.gov/search.jsp?R=20070016694 2018-09-13T01:24:51+00:00Z
- 2 -
Subject headings: galaxies: general - surveys - X-rays:binaries - accretion, accretion discs
1. Introduction
Through X-ray observations of nearby galaxies, a class of Ultraluminous X-ray (ULX) sources has emerged. These are pointlike, non-nuclear sources with observed X-ray luminosities greater than lo3’ ergs-’ (Miller & Colbert 2004). Of most interest are those sources with bolometric luminosities in excess of the Eddington limit for a 20 Mo black hole, or Lbol > 2.8 x lo3’ ergs-’. The true nature of these sources is unclear, and this class most likely includes several different types of objects. Though some of these sources are located within a few parsecs of their host galaxy’s dynamical center, they do not exhibit many of the characteristics of active galactic nuclei (AGN). Because the ratio of X-ray to optical flux is a factor of 10 greater than that of AGN (Anderson et al. 2003; Stocke et al. 1983), these objects are fairly easy t o recognize in X-ray imaging data.
Assuming that the Eddington limit is obeyed by black hole accretion, the existence of such luminous non-AGN sources presents a puzzle. Several models have been proposed to account for the high luminosities of the ULXs. Among these are relativistic and non-relativistic beaming from stellar-mass black hole systems (Reynolds e t al. 1997; King et al. 2001; Kording et al. 2002) and accretion of matter into intermediate mass black holes (IMBHs). In several ULX systems (NGC 1313 X-2, M8l X-9, etc.), detection of emission nebulae surrounding the ULX supports isotropic emission from the central source (Pakull & Mirioni 2003), which cannot be described through beaming. Further, a number of ULX (NGC1313 X-1, etc.) X-ray spectra are best fit with combined multi-component blackbody (MCD) and power law fits, similar t o Galactic black holes in their high- state. Recently, Miller, Fabian, & Miller (2004) find that many spectral fits of ULXs require cool accretion disk temperatures of approximately 100 eV. The theoretical relationship between black hole mass and disk temperature (T o( M-1/4) has been observed t o hold true for stellar mass (typically around 1 keV) and supermassive (around 10-100 eV) black holes (Makishima et al. 2000; Porquet et al. 2004; Gierlihski & Done 2004). Using these scaling relations, the cool accretion disk ULXs would correspond t o a population of high-state IMBHs with masses of = 16 - 104Mo.
If ULXs do not obey the Eddington limit, they could be the result of an outburst (such as can occur in low mass X-ray binaries within our own Galaxy). Jonker & Nelemans (2004) find evidence for approximately 5 Galactic black hole X-ray binaries which exhibit luminosities in the ULX range during outbursts. These sources would appear as transient ULXs. The typical time scale for outburst of Galactic X-ray transients is a few days to rise from quiescent level with a decline from peak brightness to quiescent value of 30 - 40 days (Chen, Schrader, & Livio 1997). Another possible explanation is super-Eddington emission from accretion disks surrounding stellar mass black holes (Begelman 2002; Ebisawa et al. 2003). Sources of this type would be expected
- 3 -
to have soft X-ray components well modeled by hot accretion disks .(E 1.3 - 2.0 keV) similar to superluminal X-ray sources in the Galaxy (e.g. Belloni et al. 1997).
Likely, ULXs include a variety of different objects with both isotropic and non-isotropic emit- ters. However, if some ULXs do indeed represent a class of high-state IMBHs, similar t o the high/soft (thermal dominated) state stellar mass black holes in our galaxy, we might also expect t o see the low-state objects from this same population. In Galactic black hole systems, the low-state is generally characterized by lower luminosity, with L< 0.1 L ~ d d (Done & Gierlinski 2003), and a power law photon spectrum, typically with index r M 1.7 (McClintock & Remillard 2004). Indeed, the existence of some ULX sources (IC 342 X-1, NGC 5204 X-1) as possible low-hard (pure power law) state IMBHs, well-fit by simple absorbed power laws, have been noted from Chandra obser- vations by Roberts et al. (2004). In this study we seek t o test a direct prediction of the IMBH hypothesis; namely, whether there is a class of sources with properties consistent with what we ex- pect of low-state IMBHs. This requires two major assumptions: (1) tha t the emission from ULXs is isotropic and (2) that IMBHs exhibit the same states (whose classification was based on luminosity and spectral form) as stellar mass black holes. Our goal is to find these “low-state” sources, if they exist, classify the properties of both high-state and low-state ULXs, and test whether these da ta are consistent or inconsistent with the predictions of the IMBH hypothesis.
We present the results of a detailed analysis of ULXs in nearby galaxies observed with the European Space Agency’s XMM-Newton observatory. Only XMM-Newton provides the count rates and bandpass necessary to distinguish different spectral models for most ULXs, accurately deter- mine both the temperature of the thermal component expected for high-state objects, and de- termine whether this component is required in the spectral modeling of these objects. Since the XMM-Newton X-ray spectra of ULXs are similar in quality t o spectra for Galactic X-ray binaries obtained in the 198Os, our spectral classification in this paper will remain purely schematic. Thus, our classifications as low and high state objects are a first approximation, based on the quality of the spectra available.
In Section 2, we detail the observations examined from the XMM-Newton archives and explain the da ta analysis for the individual point sources. In Section 3, we discuss the spectral fitting tech- nique as well as simulations we conducted to determine their validity. We discuss the implications of our results in Section 4.
2. Observations and Data Reduction
The data used in this investigation were drawn from the XMM-Newton public da ta archive. Assuming that low-state ULXs exist in the luminosity range of 1038-39 ergs-’, we conducted sim- ulations to determine the optimum criteria for observations capable of resolving point sources of this luminosity. Our simulations provided a guide for choosing which of the vast number of archival XMM datasets we should examine. This luminosity range was chosen on the assumption that an
- 4 -
approximately 100Ma black hole would radiate at M 10% of the L ~ d d in the low-state (Done & Gierlinski 2003).
Within the luminosity range of interest (Lx > ergsv1), there are a number of known objects tha t could be confused with ULX sources. One type of source is supernova remnants (SNRs). These sources are often easy t o distinguish based on their characteristic spectrum: with poor signal to noise we expect a steep power law and as the signal t o noise increases, emission lines become clearly visible. Super-Eddington accreting neutron stars have been observed t o have luminosities within this range for a short period of time. Neutron star X-ray binaries often have spectra well fit by a hot multi-color disk blackbody model, or with low signal t o noise, by a bremsstrahlung model. Both models have similar curvature and a 0.7-2.0 keV blackbody model is indistinguishable from the bremsstrahlung model. We chose t o use the bremsstrahlung model because it is the simpler model and gives an adequate qualitative description to the data. We expect that for low temperature bremsstrahlung sources, the spectrum should be easily distinguishable from a power law with I' M 1.7 (as is expected for a low-state object). If, however, the neutron star spectrum has kT > 5 keV, as observed for some NS X-ray binaries, our simulations show that we can not distinguish between the power law and bremsstrahlung models.
The most common sources we expected t o find in this luminosity range were the analogs to Galactic black hole X-ray binaries in their high-soft (thermal dominated) state. These sources typically have spectra well fit by a blackbody with temperature of M 1.0keV combined with a power law with index r M 2.5. Our simulations sought t o determine the number of photons required t o distinguish between spectral fits corresponding t o a power law model with I' M 1.7 and a combined blackbody and power law model. These models qualitatively correspond to those of a low-state (pure power law spectrum) and high-state (thermal dominated spectrum) X-ray binary. Since we do not know the proper normalization between the blackbody and power law components for high-state objects (it varies from source t o source), we tested whether each of the components separately, e.g. blackbody or a steep power law, could be distinguished from the simulated "low- state" spectrum. We chose to simulate spectra in XSPECusing the command fakeit none. We used generic response and ancillary response matrices. Simulating a power law model with a r = 1.7, we found that for 200, 400, and 1000 counts, these models were distinguishable a t > 99% confidence from a blackbody source (with kT constrained to the range of 0.6 t o 1.3keV, similar to that of Galactic black holes). We found that for a lower number of counts the distribution in r values increases t o include a larger range of values (i.e. I' = 1.3 - 2.0 compared to I' = 1.5 - 1.7). Simulating a power law with I' = 2.5, we find the same trend. We determined tha t at roughly 400 counts the distributions of r from a I' 1.7 and I' = 2.5 power law become entirely separable at > 99% confidence.
In order to distinguish between the different spectral fits for objects with L x N 2 x ergs-', we select all galaxies that were observed for at least 10 ks (with the exception of the bright ULX in NGC 5408, which had enough photons for analysis despite the low exposure time) with XMM- Newton and that are closer than 8 Mpc. We estimated that these criteria would give us a minimum

- 5 -
of 400 counts for objects with Lx > 2 x 1038ergs-1. We emphasize tha t the criteria quoted, based on the simulations, were used as a guide in choosing the sample of galaxies examined in this study. These simulations are not used as the statistical basis for our object-by-object analysis (discussed in Section 3).
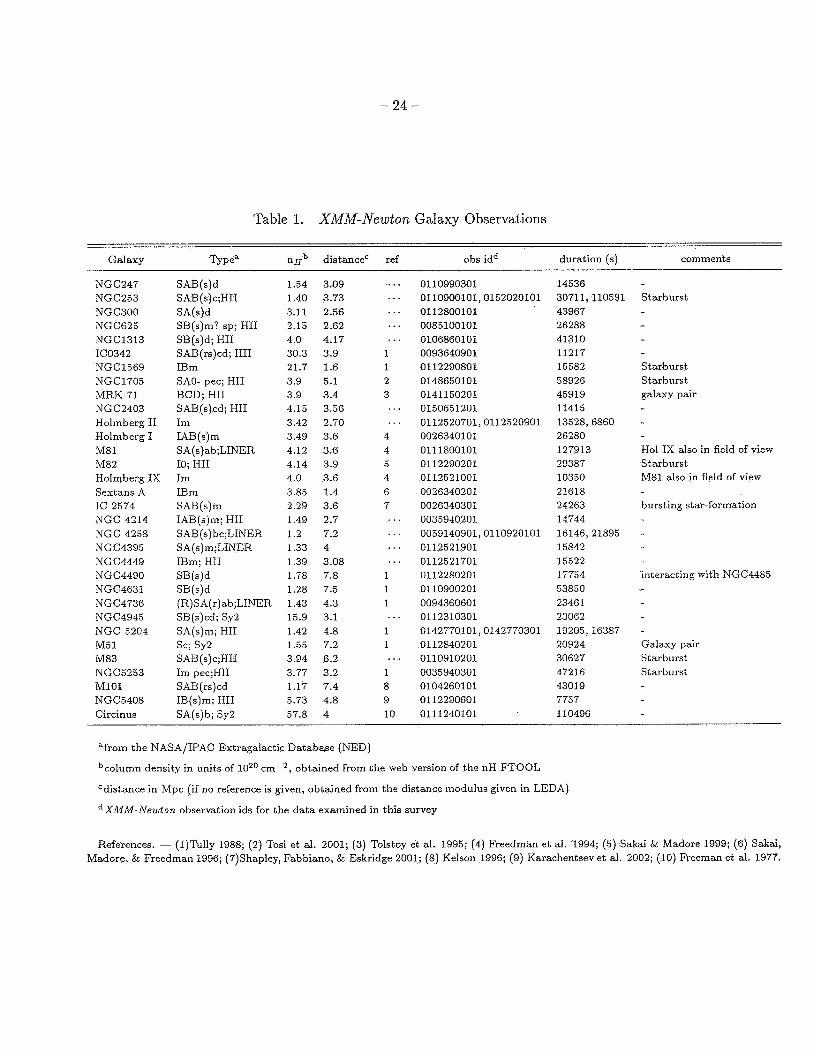
Our sample of galaxies is selective in that i t represents objects of interest in the X-ray band. We include details on these host galaxies in Table 1. XMM-Newton spectral information of individual X-ray sources had previously been published for approximately 60% of the host galaxies. We include references in the alternate ID column and footnotes of Table C6. We do not compare our results with these previous studies on a source by source basis.
We found that abstracts describing the proposals for XMM-Newton observations were available for only 13 of the 32 galaxies examined. Of these 13, only one observation cited the motive as a study of ULXs (NGC 1313). However, 7 of the remaining 19 galaxies contained sources classified as IXOs, intermediate X-ray objects, by Colbert 8~ Ptak (2002). If the remaining galaxies were not studied due to their ULX population, the effects of bias are small with roughly 25% of the sources studied explicitly due to their connection with ULX sources. Our host galaxies include only spirals and irregulars. Figure 1 displays the distribution of galaxy type.
We reduced the data using the XMM-Newton Science Analysis System (SAS) version 6.0.0. Since the processed pipeline products (PPS) were created with earlier versions of SAS, the observa- tion d a t a files (ODF) were used t o produce calibrated photon event files for the EPIC-MOS and PN cameras using the commands emchain and epchain. Following this, the events tables were filtered using the standard criteria outlined in the X M M ABC Guide. For the MOS data (both MOSl and MOS2 cameras), good events constitute those with a pulse height in the range of 0.2 t o 12 keV and event patterns that are characterized as 0-12 (single, double, triple, and quadruple pixel events). For the PN camera, only patterns of 0-4 (single and double pixel events) are kept, with the energy range for the pulse height set between 0.2 and 15 keV. Bad pixels and events too close t o the edges of the CCD chips were rejected using the stringent selection expression “FLAG == 0”.
Time filtering was applied as needed by editing the light curve produced in xmmselect for the entire observation. Flare events (distinguished by their high count rate) detected in all three cameras, were cut using the tabgtigen task as outlined in the ABC Guide. Typical count rate parameters for filtering were ’RATE < 5’ for MOS detectors and ’RATE < 20’ for the PN detector. Such filtering was only done as needed. Pre-filtered exposure times are listed in Table 1. The number of counts from the filtered net exposure times for the individual sources are listed in Table C6. We note that the filtered data are not always sufficiently clean that a high signal-to- noise is maintained up to 10 keV. Sources with a high background flux level, relative t o the source spectrum, show poorer signal-to-noise in the spectrum above 1 keV.
Before extracting spectra of the brightest sources, contour maps of the X-ray observation were overlaid on Digital Sky Survey (DSS) images. This ensured tha t bright foreground stars and background AGN were easily distinguished, and thereby not included in our sample. Also, we
- 6 -
checked the XMM-Newton source positions with NED and SIMBAD to determine if they coincide with any known background galaxies or QSOs. A list of these bright fore-ground or background sources is included in Table C7.
3. Spectral Fitting
Spectra for the bright point sources were extracted based on their apparent brightness in the CCD images. No explicit source detection algorithm was necessary. We used the SAS task especget. With this task we created spectra (for both the source and background), response matrices, and ancillary response files for all three EPIC cameras, when possible. The typical extraction radius was 20 arcseconds, but depending on both the size and proximity of a source to another source, the extraction radius ranged from 9 - 87 arcseconds. Background spectra were extracted either in an annulus centered on the source, or in a cirde of appropriate size away from the source, depending on the proximity of the candidate source to other X-ray sources. Annuli were used for sources that were not located within a few arcseconds of another source, thus annular background extraction radii were not used for sources with small extraction radii. For sources in crowded regions, we used circular extraction radii close to the source. We extracted backgrounds close to the source in order t o correct for emission local to the ULX. Once the spectra were obtained, they were rebinned to require at least 20 counts per bin, using the command grppha in LHEASOFT. The list of sources, with position and count information, is included in Table C6. We only included sources for our spectral studies that had 400 or greater PN counts (or MOS for sources in NGC 253 and M8l and NGC 4945 XMM3 and NGC 2403 XMM1, for which PN spectra were not available)..
The extracted spectra were fit with standard models in XSPEC v11.3.1. For each source, we fit the PN and MOS spectra simultaneously in the 0.3-10 keV range. We allowed a free normalization constant to account for the differences in flux calibration between the three cameras (similar to Jenkins et al. (2004)). Each source was first fit with an absorbed single component model. In all cases we used the standard absorption model wabs, leaving the column density as a free parameter. For those sources where the hydrogen column density was unconstrained, we fixed the value t o the Galactic foreground value listed in Table 1.
3.1. Single-Component Sources
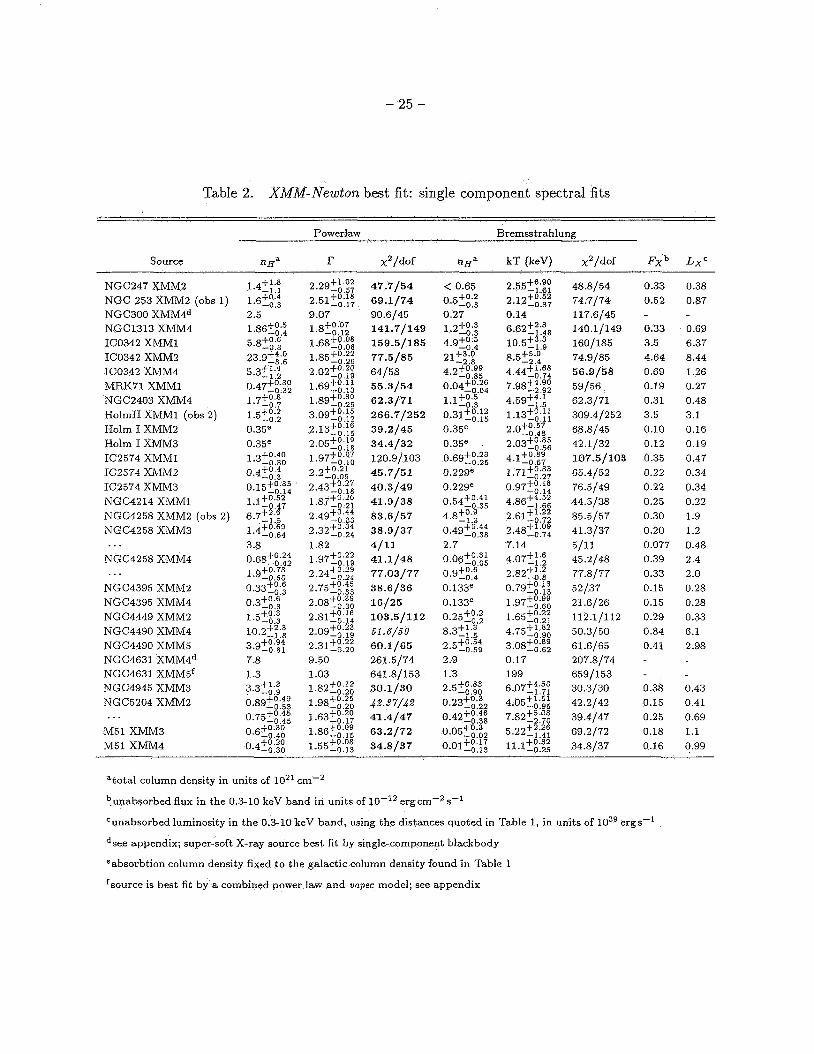
Results of the single-component fits are seen in Table 2. We include in this table only the best-fit parameters for those sources best described by a single-component model. The addition of a blackbody component t o these single-component fits changes the x2 value by a negligible amount and therefore is not statistically significant. More specificalIy, the addition of a blackbody model to the power law fit corresponds t o a Ax2 < 2.3, which is the M 68% confidence level using the F-test for two degrees of freedom.
- 7 -
The flux values quoted represent the unabsorbed flux in the PN spectra, in the 0.3-10 keV band. All errors quoted, here and subsequently, correspond t o the 90% confidence level for one degree of freedom (Ax2 = 2.71). The luminosities were calculated from the unabsorbed flux using the distances quoted in Table 1. Both flux and luminosity correspond t o those of the best fit model (power law or bremsstrahlung). It should be noted tha t since our selection criteria was based on a count rate cutoff, due t o the variety of spectral forms, the inferred luminosity cutoff will not be uniform.
In Table 2 we denote the single component model we choose as the better fit in bold. This notation also indicates the model (power law or bremsstrahlung) used to compute the quoted flux. For E 46% of the power law sources, the x2 difference (< 2) between the power law and bremsstrahlung models is only marginally different. Of these sources, the average kT value for the bremsstrahlung fit is 5.54keV. From our simulations we find that at high temperatures the bremsstrahlung fit becomes indistinguishable from a simple power law. Thus, given the high tem- peratures of the bremsstrahlung fits for these sources, they are equally well described by the power law model. Typical kT bremsstrahlung values for accreting neutron stars are from 3.0 t o 7.0 keV (Jones 1977).
3.1.1. “Low State” ULXs
From these single-component sources, we classify 16 sources as low-state ULX sources. This classification is based on (1) the shape of the spectrum, well-fit by an absorbed power law, (2) the luminosity of the sources (they needed t o be luminous enough to be included in our sample, Lx > 1038ergs-1), and (3) the X-ray location of the object within the optical galaxy (based on Digital Sky Survey (DSS) images). The third criterion was important in limiting the effects of Contamination from fore-ground and background sources within our sample of ULX sources. Thus, we overlaid X-ray contours from the XMM image on the DSS images, determining the location of the X-ray source as within or outside of the optical extent of the galaxy. We note tha t for two of the sources classified as low-state ULXs (Holmberg I XMM2 and NGC 2403 XMM4), there is uncertainty of whether the X-ray source is in fact within the optical galaxy due t o the quality of the optical DSS imag s. The images used to determine the third criterion are available online (http://www.astro.umd.edu/Nlwinter/second3.html). We further discuss these criteria in Section 4.
e We state tha t the first criterion for classification as a low/hard state ULX is a spectrum well-fit
by a power law. Of the 30 sources in Table 2, three sources were clearly not well-fit by either the power law or bremsstrahlung model. Seven of the remaining 27 sources were clearly not within the optical extent of the host galaxy. Of the remaining sources excluded from classification as a low- hard state object IC 2574 XMM1 was better fit with a bremsstrahlung model (with Ax2 = 13.4). In an additional observation of the source NGC 4258 XMM2, a simple power law model is not an adequate fit to the da ta (while the luminosity of the source is not within the “ULX” classification
- 8 -
range mentioned in the introduction). For the remaining sources, NGC 247 XMM2 and NGC 253 XMM2, there was sufficient doubt on the spectral form where the bremsstrahlung and power law model as well as the addition of a thermal component all yielded adequate fits to the spectra. Therefore, we excluded these sources from a classification, noting the ambiguity of the model fits for these sources.
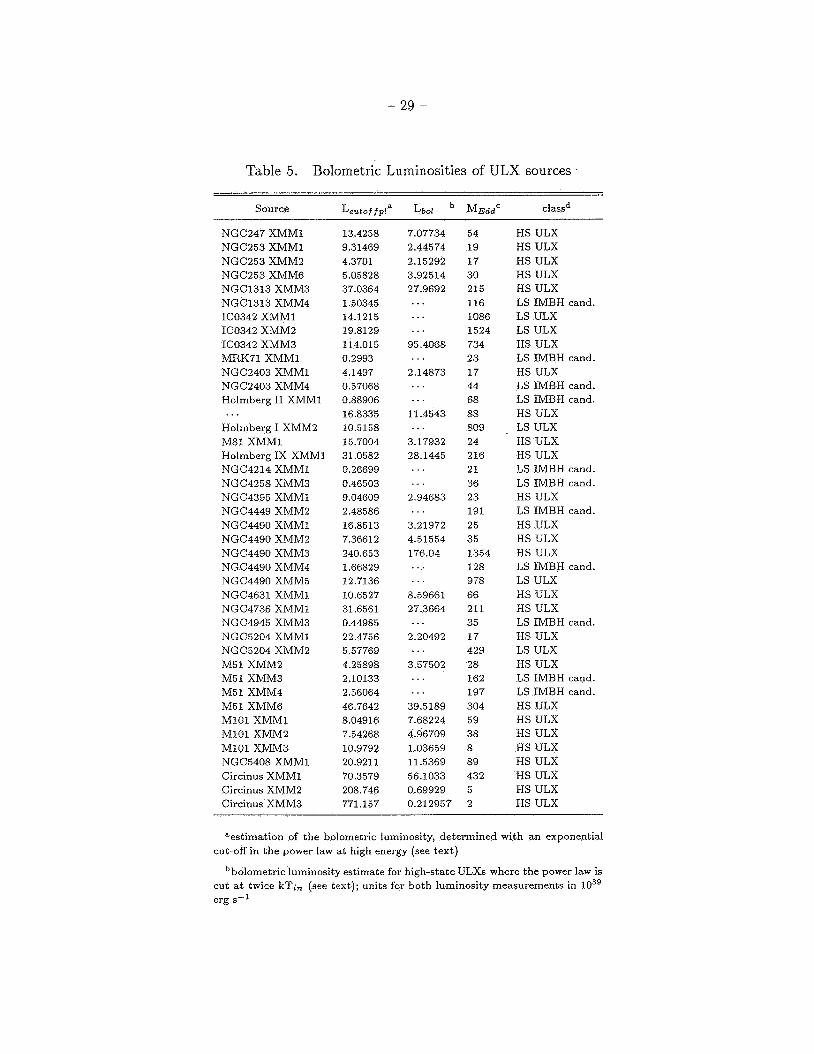
For those sources we classify as ULXs, we include computed bolometric luminosities in Table 5. To compute the bolometric luminosities for these ULX sources, we used the exponentially cutoff power law spectrum of Magdziarz & Zdziarski (1995), model cutoflpl in XSPEC, with a cutoff energy of 10 keV. From observational studies of Galactic X-ray binaries, i t has been observed that low-state objects have spectra that cut-off at high energies (2 10 - 200 keV) (Zdziarski & Gierlinski 2004). Thus we chose the exponential model cutoflp1 over a simple power law. This also minimizes the total luminosity for flat power law sources. We computed an unabsorbed bolometric flux in the 0.1 - 100 keV range through use of the dummyresp command (which extends the model beyond the observation’s energy range). The luminosity was then computed using the distances listed in Table 1. We quote these values as Lcut,jjpl (the luminosity obtained from extrapolating the power law portion of the spectrum as an exponentially cut-off power law) in Table 5. We note that these values represent an upper limit on the bolometric luminosity for steep power law (I’ > 2) objects, since we would expect the power law component to cutoff at some low energy. However, for shallow spectrum (I’ < 2) sources LCutojjpl is a lower limit. This is because, schematically, a steep power law diverges at low energies while a shallow power law diverges at high energies.
3.2. Two-Component Sources
For a number of sources, we found that an improvement in reduced x’ was achieved through fitting their spectra with an absorbed two-component blackbody and power law model. We chose a simple blackbody model over the multi-component disk model, diskbb, for purely schematic reasons. Namely, observations of galactic X-ray binary systems were fit with blackbody models in the 19SOs, when the signal-to-noise of these objects was comparable t o that for our XMMdata for ULX sources. We also note that the diskbb model does not give an entirely accurate physical description of the data as it neglects the effects of general relativity. As a schematic model, the blackbody model is simpler than diskbb, with the same number of degrees of freedom. In addition, for low temperatures both models yield virtually identical temperatures. For this study, we chose the simpler modeI. We defer to a further paper a discussion of the different models for the thermal component.
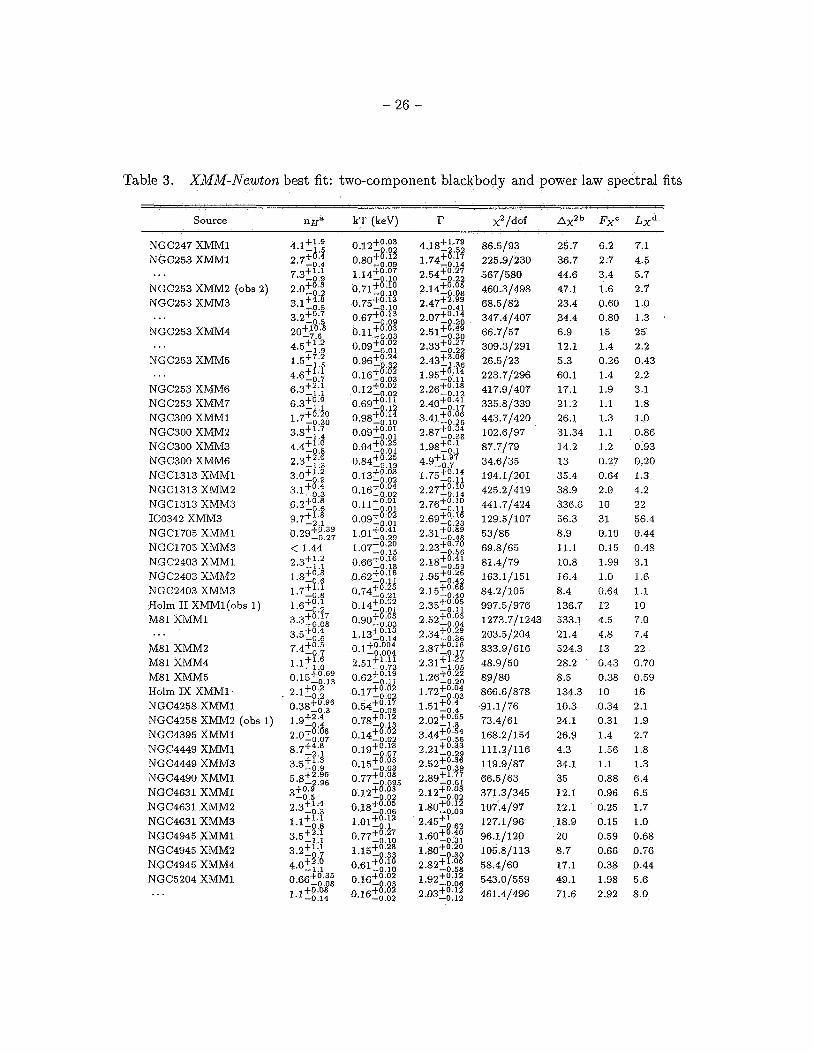
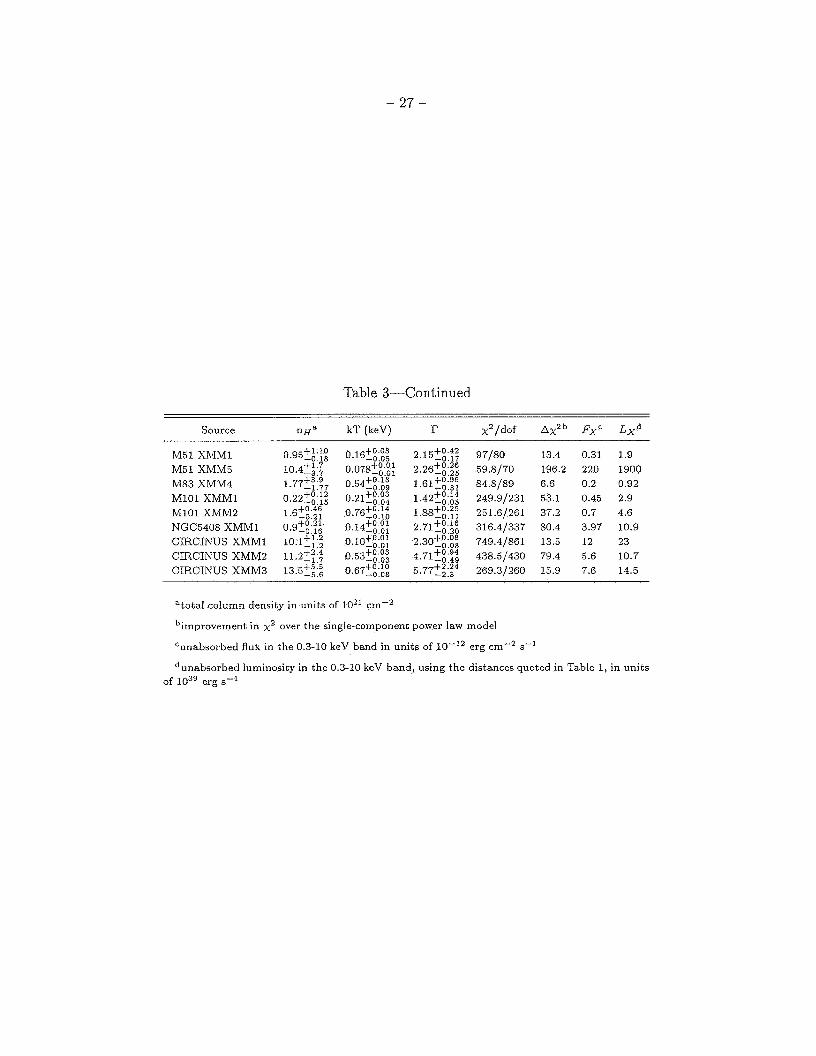
In Table 3 we present the results for the sources which are fit significantly better by the two- component model, these are sources where the improvement in x2 is greater than 8 (determined from our simulations in Appendix A). We include in Table 3 the improvement in. x’ of the two-component fit over the simple power law. We include the power law best fits to these sources in the appendix for comparison with other analyses. In order t o determine whether the blackbody component is statistically significant for the sources fit with a two-component model, we simulated spectra based
- 9 -
on accurate modeling of some of the brightest sources: NGC 247 XMM1, NGC 5408 XMM1, and Holmberg I1 XMMl. These sources span the observed range of the ratios of the blackbody t o power law component and thus represent those from our sample with a weak blackbody relative to the power law component, intermediate case, and a strong blackbody, respectively. Our simulations are described in full in Appendix A. We found that, using a Ax2 > 8 criterion, which corresponds to the 99% significance level as according t o the F-test for the addition of two extra parameters, we can readily detect the strong and intermediate thermal components in all spectra with more than 400 counts. The weak thermal emission cannot be detected in 400 count spectra, but is readily detected in 2000 count spectra. This gives us confidence tha t our results are statistically meaningful.
3.2.1. “High-State ULXs”
Of the sources in Table 3, we classified high-state (or thermal dominated) ULX sources based on three criteria: (1) spectra characterized by an absorbed power law and blackbody model, (2) luminosity, and ( 3 ) X-ray source within the optical extent of the host galaxy. The luminosity criteria required that these sources have unabsorbed luminosities L x 2 3 x 1O3’ergs-’ (we used Lx = 2.7 x lo3’ ergs-’ as our hard cutoff). If the sources are radiating at the Eddington luminosity, this cutoff luminosity corresponds t o objects with masses greater than 20Ma.
From Table 3, 27 observations are recorded with L x > 2.7 x 1O3’ergs-’. The addition of a thermal component t o these sources is statistically significant over a pure power law model. Of the 27 observations, 3 correspond to multiple observations of a single source. From an analysis of the DSS images, all 24 of these sources are within the optical extent of their host galaxies. However, M52 XMM5 appears t o be coincident with the center of its host, a dwarf companion galaxy to M51. The location, coupled with the high luminosity (Lx = 1.9 x 1042ergs-1) leads us to classify this source as an AGN. We also excluded two sources (NGC 1313 XMM2 and M81 XMM2) from our sample of high/soft state ULXs due to their previous identification as supernovae. Of the remaining 21 sources, NGC 253 XMM4 had a luminosity of 2.5 x lO*Oergs-’ in one observation and 2.2 x 1039ergs-1 in a second. This significant change in luminosity, with one observation below our luminosity cutoff and another a factor of M 10 higher than the other, led us to exclude this source as a high/soft state ULX. I t is likely that this source is a stellar mass X-ray binary within its host galaxy, where one of the observations captured the source in an outburst.
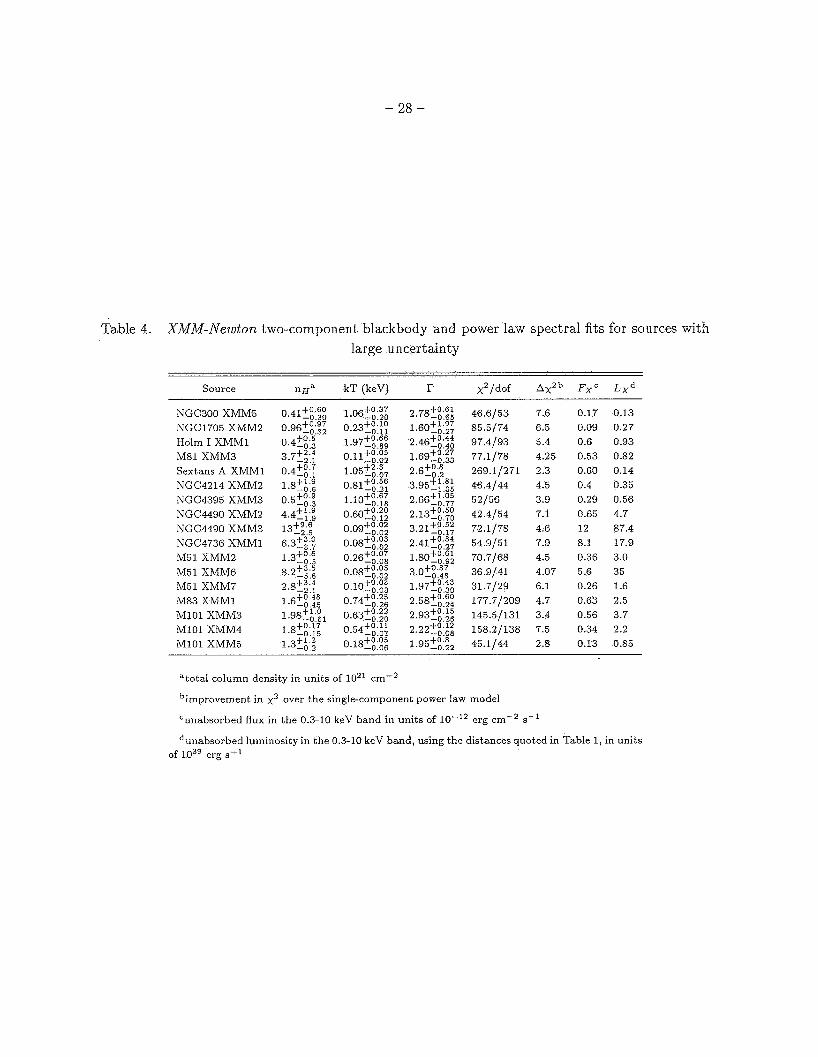
In Table 4, we list sources tha t have Ax2 values less than 8 for a single observation. Most of these sources have weak blackbody normalizations compared t o the power law normalization. We classify these sources as being well-fit by a two-component model while acknowledging the uncertainty in the fit as determined by the simulations. The addition of the thermal component is not significant enough for these sources t o be classified with certainty in either Table 2 or 3. The simple power law fits for these sources are included with those for sources in Table 3 in the appendix. We note that due to their high luminosity we included six of these sources (NGC 4490 XMM2, NGC 4490 XMM3, NGC 4736 XMM1, M51 XMM2, M51 XMM6, and MlOl XMM3) with
- 10 -
uncertain fit parameters as ULX high-state sources. Two of these sources (NGC 4490 XMM3 and M51 XMMG) had unabsorbed luminosities > 10 times the 3 x 10³’ergs-’ cutoff used for high-state ULX classification. The other four sources had luminosities above the threshold, as well as weak blxkbody components compared t o the power law (see the appendix for simulations). We used these points t o justify including these sources with the Table 3 sources in the following discussions with the proviso that their spectral fits do not indicate absolutely the necessity of the additional thermal component. For this reason, we denote these sources with a special symbol (a circle) in subsequent figures while including them as “high-state” ULX objects.
For our ULX sources modeled by a combined blackbody and exponentially cutoff power law, we computed bolometric luminosities using two methods. The first method is recorded as L C u t o j j P ~ in Table 5. We computed the flux from 0.1 - 100 keV using an unabsorbed blackbody and exponentially cutoff power law model using the XSPEC command dummyresp. For the second method, recorded as Lbol in Table 5, we estimate a more accurate bolometric luminosity calculated from the flux in the range of 2 x kT- 100 keV where kT is the blackbody temperature obtained from the model. In Galactic X-ray binary systems, the power law component of the X-ray spectrum is believed t o be from Comptonization in a corona. The photons supplying this energy originate from the blackbody continuum emanating from the accretion disk. Thus, a natural cutoff for this power law component occurs at the peak emission of the blackbody (which is approximately 3 x kT). The estimated values (obtained from cutting off the combined unabsorbed blackbody and cutoff power law model at the value 2x kT) differ with regard t o the full estimate (flux from the fully integrated blackbody added to the separate flux from the cutoff power law from 3x kT to 100 keV) depending on the normalization factors used (for both the blackbody temperature and the spectral index r). Choosing three sources displaying a range of blackbody to power law strength (Holmberg I1 XMM1, NGC 2.53 XMM1, and IC 0342 XMM3) we found that the estimated values were within 88.3, 95.1, and 96.8% of the more complete estimation. Given their close proximity (within approximately 90%) we quote these estimated values as a good approxmiation t o the bolometric luminosity.
We note that our bolometric luminosities for all of the classified ULX sources, on average, are a factor of 1.08 greater than the X-ray luminosities in the 0.3 - 10 keV band for the objects best fit by a combined blackbody and power law. Thus, to good approximation, the X-ray luminosity is the bolometric luminosity. However, for the objects best fit by a simple power law (low-state ULX sources), the average bolometric luminosity is roughly a factor of 7 greater than the X-ray luminosity in our band. This average is dominated by the steep power law objects, in particular Holmberg I1 XMMl (I? = 3.09). Excluding this object, we get an average bolometric luminosity tha t is 2.8 times the X-ray flux and more indicative of the general properties of these power law-fit objects.
- 11 -
3.3. Additional Sources
In addition, in this large sample of point sources, we came across a number of objects whose spectra were not well fit by the models we employed. These sources have luminosities exceeding Lx M 1038ergs-1, if they are associated with the host galaxy, and are placed in Tables 2 and 3 as well as Appendix B. These sources include two supersoft sources, one possible AGN, and three sources well fit with additional absorption models (including a partial covering model and a model of hot gas). We briefly describe these sources in the appendix.
4. Discussion
W-e have determined best-fit spectral parameters of the bright X-ray sources in 32 nearby galaxies. In choosing three “standard” models for our study, we hoped t o accurately separate high and low state ULXs from other types of luminous X-ray sources. We specifically chose t o fit the da ta with the bremsstrahlung model in order t o identify neutron s tar X-ray binaries within our sample. The models we used are purely schematic, and they do not physically explain the phenomena occurring, but are standard and qualitatively simple models often used to fit the spectra of Galactic X-ray binaries.
We cross-referenced the X-ray positions of our sources with both NED and SIMBAD in order to identify known supernovae, galaxies, and stars. In addition, we examined the DSS optical images to place the position of our sources within their respective galaxies. Such analysis aimed t o minimize contamination of our sample of ULXs with bright background and foreground sources.
Further, we examined XMM-Newton’s Optical Monitor da ta in the visual bands (U, B, V). The X M M PPS contain point source detection files for the OM data. We overlaid these point source detections with X-ray contour maps in order to determine the brightest possible optical count rates for the X-ray sources, which were then converted into fluxes using the OM calibration documentation. In Figure 2, we plot the distribution of the logarithm of the X-ray t o optical flux for the brightest possible optical counterpart inside the XMM-Newton error circle. Only 13 of the 32 host galaxies had visible band OM data during the observations. Of these 13 galaxies, 40 of the X-ray sources were in the range of the OM data and only 14 were coincident with an optical point source. Therefore, the majority of our sources have X-ray/optical flux ratios that are larger than those displayed. Figure 2 illustrates the lowest possible X-ray/optical flux ratios and also, by the sparsity of sources included in the diagram, i t illustrates the fact that a majority of the sources have no obvious optical counterpart and thus have very large X-ray/optical flux ratios. We estimate the point source detection limit of the OM U filter as approximately 1.24 x 10⁻¹⁴ergcm-2 s-’. For an unabsorbed X-ray flux of 1.0 x 10⁻¹²ergcm-2s-1, typical of objects with L x M 2 x 1038ergs-1 located at a distance of 8 Mpc, this corresponds t o log(f,/fopt) = 1.9. Therefore, the average value for our sources should fall around 2 or greater. The average distribution for QSOs and AGN centers around 0 and 0.8 for BL Lacs (Anderson et al. 2003). Our objects have ratios of L,/LOpt a t least
- 12 -
10 times higher than those of AGN and 100 times greater than stars.
Recently, Gutierrez & Lopez-Corredoira (2005) identify six ULXs from the catalog of Colbert & Ptak (2002) as QSOs. They hypothesize that a large number of ULXs may in fact be quasars at higher redshift than their supposed host galaxy. However, unlike the objects studied in Gutierrez & Lopez-Corredoira (2005) , our ULX sources are all spatially coincident with the optical host galaxy. In addition, a majority of our ULXs are not in the proximity of a noticeable optical point source. The X-ray/optical flux ratios of our sources are much larger, on average, than might be expected for a &SO. It is also worth noting that while some cataloged ULXs may be QSOs, optical identifications have been made associating other ULXs with a type B supergiant companion (Kuntz et al. 2005; Liu et al. 2004).
4.1. Classification Criteria
The spectral fits indicate that t o high statistical probability (see appendix A) we can distinguish a class of low-state ULXs from the high-state objects. This is assuming, as indicated in the introduction, that ULXs are isotropic emitters with luminosity and spectral form similar t o Galactic stellar-mass X-ray binaries. In section 3 , we stated that our ULX classification depends upon three criteria: (1) spectral form, (2) luminosity, and (3) location of the X-ray source within the optical host galaxy (as determined from the DSS images). We have chosen simple, parametric ‘non- physical’ models for the spectra because the signal to noise of most of the observations does not allow anything else t o be constrained.
Of the sources in Table 2, 16 are classified as “low-state’’ objects or low/hard state ULXs, having unabsorbed luminosities > 1038ergs-1 and spectra that are well fit by power law models. Throughout this paper, we use the term low-state ULXs t o include ‘(low-state IMBH candidates” (sources with L x 5 3 x lo3’ erg s-l and spectra well-fit by a simple absorbed power law) and low- state sources with luminosities that clearly classify them as ULX sources (Lx 2 3 x 10³’ergs-’). These low-state ULX sources are listed in Table 5 .
In the Spectral Fitting section, we noted that a power law and high temperature bremsstrahlung model are indistinguishable. Therefore, it is important t o consider the luminosity of these sources in the claim that they are not neutron star X-ray binaries accreting at the Eddington luminosity. Of the low-state ULX sources, only two of the 16 sources have bolometric luminosities below the Eddington luminosity of a 3Mo object (x 4 x 1038ergs-1), corresponding to the maximum mass of a neutron star. All of the sources have values exceeding the Eddington limit for a 2 M a neutron star.
Further, 26 sources have unabsorbed Lx 2 3 x 10³’ergs-’, corresponding t o L M L ~ , j , j at M > 20 Ma as expected for “high-state” IMBHs, and spectra that are well fit by combined blackbody and power law models. These are “high-state” objects. The spectral fits for these sources are listed in Tables 3 and 4. In a statistical sense, we find tha t the greater the number of counts in the
- 13 -
observation the greater our confidence in the thermal component contributing t o a better fitting model. We explain our confidence levels obtained from spectral simulations in the appendix.
In addition to these high and low state ULXs, we find a large number of sources best fit by a combined blackbody and power law model but below our threshold of L x M 3 x lo3' erg s-l for a high-state ULX (listed in Table 3). Many of these sources may be accreting stellar mass black holes with M < 20 Mo. Some of these non-"ULX" sources were found away from the optical extent of the targeted galaxy (from our analysis of the DSS images), and therefore may be background AGN.
4.2. Low-State ULXs
For Galactic black hole X-ray binaries, spectral indices of low-state (or power law dominated) objects are typically lower than those of high-state objects, with < I' >low% 1.7 and < I' >high% 2.5 (McClintock & Remillard 2004). In Figure 3, we plot the distribution of the spectral index for both high-state and low-state objects. The spectral index for the high-state objects is the value of I? from the two-component fit. As in the Galactic sources, it is clear that the spectra1 indices of the high-state objects are indeed larger. Of further interest, the distribution of spectral index for low- state objects looks remarkably similar to the distribution of spectral index for moderate luminosity quasars, many of which are thought t o be the analogs of low-state black holes (Porquet et al. 2004). This supports the classification of these objects as accreting black holes.
For the high-state objects, we find mean values of 1' = 2.46, with a root mean square (rms) deviation of S= 0.12, and Lx = 1.4 x 1040ergs-1, log(S) = 1.6. This calculation excludes the 3 objects with spectral indices greater than 3.5. For the low-state objects, we find mean values of I' = 2.09, with a rms deviation of S= 0.10, and L x = 2.2 x 10³'ergs-', log(S) = 2.1. This value of I' = 2.1 is softer than the typical hard-state value of M 1.7, but within the 1.5 < I' < 2.1 range used to classify this state for Galactic X-ray binaries (McClintock & Remillard 2004). Computing a Kolmogorov-Smirnov two-sample test, separating the sources into the category of low-state or high-state, we find a likelihood of approximately 0.03 that the spectral indices belong t o the same distribution.
The low hard X-ray state of X-ray binaries is associated with a low accretion rate from the companion object with L s 0 . 1 L E d d (Done & Gierlinski 2003). Therefore, on average, we expect the luminosities of the low-state objects to be lower than the high-state objects. Figure 4 displays the luminosity of the objects as a function of the spectral index. On average, the highest luminosity low-state objects have luminosities lower than those of the high-state objects.
The lower Lx values of the low-state objects imply that they may indeed be accreting at a lower rate than the high-state objects. This can further be seen in the bolometric luminosities listed in Table 5. If these objects are accreting at a rate similar to Galactic low/hard s ta te black
- 14 -
holes (0.1 x LE&) (Done & Gierlinski 2003), we can estimate their masses as
M Lbol -1
0.1 x LEdd
with LEdd as the Eddington luminosity for a 1 Ma object (1.3 x erg s-I). Our mass estimations, based upon our limits t o the bolometric luminosities, yield masses of 20 - 1500M0 (see Table 5 ) ) precisely what we might expect for a population of IMBHs.
4.3. High-State ULXs
If the high-state (thermal dominated) ULXs represent a class of intermediate mass black hole systems, their X-ray spectra should be well described by a combined blackbody and power law model. Scaling for the mass of the black hole, we would expect a relationship of TG( M-1/4 between black hole mass and blackbody temperature (Makishima et al. 2000). This would indicate a thermal component of - lOOeV for masses of - 103Mo- A few objects have been reported t o display this property (Miller et al. 2003; Roberts e t al. 2005). In Figure 5, we graph the distribution of the thermal component for our classified high-state objects.
We find tha t there are two peaks in the distribution among the thermal component, one at approximately 100 eV and another centered close to 1 keV. This could indicate two different classes among the high-state objects. It is possible that those objects with blackbody components near 100eV are indeed high-state intermediate mass black holes. We note that the soft excess in PG Quasars has also been modeled as a blackbody with kT,,ft E 100eV, but i t has been suggested that this could be the result of a process not directly related t o black hole accretion (such as the presence of a warm absorber: Gierliliski &z Done (2004)). Another possible explanation is that the soft component is the result of ionized reflection from the disk (Ross tk Fabian 2005). While the possibility exists that the “thermal” component of these lOOeV sources is not directly related to black hole accretion or is related in a %on-thermal” (i.e. ionized reflection) sense, as may be the case with the soft excess in PG Quasars, we assume that the soft component for the objects we classify as high-state ULXs originates from a thermal disk. We use this assumption to test the IMBH hypothesis, thus speculation on the nature of the soft component is beyond the scope of this paper.
The second peak, centered around 1 keV, has a temperature reminiscent of the Galactic black hole systems in our own galaxy. These systems may thus be stellar-mass black holes accreting matter near the Eddington limit. If this were t.he case, we would expect the luminosities of the sources exhibiting a higher blackbody temperature to be lower than those with cooler blackbody components. In the second graph of Figure 5, we plot the relationship between blackbody tem- perature and Lx in the 0.3 - 10 keV band. Once again, two groups are seen in the distribution of high-state ULXs. The most luminous objects are those with low blackbody temperatures. On average, the less luminous sources exhibit higher blackbody temperatures. For the sources with
- 15 -
L x > 104*ergs-l, the mean blackbody temperature is 0.31 while the sources below this luminosity threshold have a mean blackbody temperature of 0.61.
The second, low-luminosity, group in the distribution of high-state ULXs is clearly distinguish- able in both plots of Figure 5. We found that, with the exceptions of NGC 253 XMM1, M81 XMMZ, and NGC 5204 XMM1, the spectra of these objects could also be well-described by an absorbed Comptonization (compST) model (Sunyaev & Titarchuk 1980) used to fit galactic black holes in the “very high” state when they are radiating at the Eddington limit. This model simulates Compton scattering of cool photons on the hot electrons of a completely ionized plasma. We present the best-fit parameters for the Comptonization model in Table C9.
This “very high” state has been observed (Miyamoto et al. 1991) in a few Galactic black holes. Yet another rubric for the very high state emerged in Kubota et al. (2001) and Kubota & Makishima (2004), where they identify this as the “anomalous)) state, a state whose spectrum can be well fit by a Comptonized scattering model. Regardless of the name, our best-fit Comptonization sources likely fit into this category. The luminosities of these sources suggest that they are stellar mass black hole systems in this anomalous/very high state.
As with the low-state, we include mass estimates for our high-state objects in Table 5. We assume that the high-state objects are radiating at LEdd resulting in a minimum mass if there is no beaming. We find masses of 1.6 - 38 M a , consistent with “normal” stellar mass BHs, for the sources well fit by the Comptonization model. The other high-state ULXs masses range from 17 - 1350Ma based on Eddington rates, analogous to the low-state ULX masses computed.
It is important t o note tha t the initial simulations (appendix) and discussions in the Spectral Simulations section need t o be considered in relation to the impact they pose t o our classification scheme and the results presented in these sections. While it is indeed possible tha t some of the objects with a weak blackbody component and a relatively small number of counts would be mis- categorized as a pure power law spectrum) one can ask what such a possible situation would do to the correlations that we have seen. These putative objects, by assumption would have lower luminosities, however their temperatures are unknown and i t is entirely unclear if they would destroy the kT/L(x) correlation. As we have shown in our simulations it is unlikely that the fitted power law index would change and thus the presence of a low state as indicated by the spectral index would not change. This would create a new type of object) one with a flat power law and a black body component, which is not seen in the Milky Way, nor among the high signal t o noise objects.
4.4. Temperature Gap
In addition to the existence of ULXs with low blackbody temperatures, the temperature dis- tribution of the high-state (thermal dominated) ULXs (Figure 5, left panel) displays a “gap” which is of particular interest - there is a complete absence of objects with temperatures in the range
- 16 -
0.26 keV to 0.50 keV. It is tempting to take this as evidence for a gap in the mass distribution of these accreting black holes. Since, for a given luminosity, we expect the temperature t o vary as T c( L1/4M-1/2, this factor of two gap in the temperature distribution translates into a factor of four gap in the black hole mass distribution.
If this result is borne out by further study, i t provides an important clue to the origin and evolution of intermediate mass black holes. One popular idea is that intermediate mass black holes formed from the collapse of massive Population I11 stars (Madau & Rees 2001). Models suggest tha t Pop I11 stars with zero age main sequence (ZAMS) masses in the range 25-140Ma and above 260Ma collapse to produce black holes (Heger & Woosley 2002) whereas in the range of ZAMS masses 140-260fMa, pair-instability supernovae lead t o the complete disruption of the stars (i.e., no remnant black hole remains). Hence, this model for IMBH formation predicts a gap in the IMBH initial mass function in the range of approximately 60-2OOMa (although this is uncertain on the low end due t o the effect of the pulsational pair-instability on the pre-collapse core). One possibility is that the gap in our observed temperature distribution (and hence the inferred gap in the mass function) is due t o this effect of the pair instability supernovae in Pop I11 stars. This would require that the current IMBH mass function is approximately the same as the initial IMBH mass function. In other words, i t requires that most IMBHs (especially those just below the gap) have not grown significantly due t o accretion since their formation and, hence, that the ULX phase represents a short fraction of the life-time of an IMBH (f << t s a l / t H , where tsal M 45Eo.1 Myr is the e-folding tirnescale for Eddington limited black hole growth with radiative efficiency E = 0.1~0.~).
An alternative interpretation of the inferred mass gap is to suppose that two funda.mentally different modes of formation lead t o a strong bi-modality in the final black hole mass function. Black hole masses below the gap can be readily understood through normal stellar processes. A separate and distinct population of significantly more massive black holes may result from dynamical processes in the core of dense globular clusters (Miller & Hamilton 2002; Gultekin, Miller, & Hamilton 2004).
4.5. Comparison with Galactic HMXBs
Supposing that the Galaxy’s bright X-ray population is representative of low-redshift galaxies, we expected to find a number of sources similar to Galactic X-ray binaries in our sample. In our sample, we find approximately 24 sources with luminosities below our high-state ULX cutoff ( ~ 3 x lo3’ ergs-’) , X-ray positions within the optical extent of their host galaxy, and no obvious optical counterpart. The unabsorbed luminosities for these sources range from 0.4-2.5 x lo3’ erg sel
(0.3 - 10 keV band). Two of these sources were transients in the X M M data. Of the four host galaxies with multiple observations examined, two of these galaxies contained solely ULX sources in our luminosity regime (Holmberg I1 and NGC 5204). Each of the remaining two (NGC 253 and NGC 4255) had a transient source best fit by a combined blackbody and a power law.
- 17 -
This suggests an interesting diagnostic in terms of distinguishing our ULX sources from a normal HMXB population. In our own galaxy, most HMXBs vary on timescales of days or less and most of the black holes in the Milky Way are transients, though some HMXBs are indeed persis- tent. The figures in Kalogera et al. (2004), determined through detailed mass-transfer calculations, indicate that transient behavior should not be expected from a population of IMBHs. Thus, on average, our ULX sources should remain X-ray bright in multiple observations. Through a liter- ature search, we found tha t 37/42 of our ULX sources are well detected in ROSAT observations and thus are luminous for greater than 10 years and therefore are not transients. Examination of the long term light curves show tha t most of these sources vary by less than a factor of 3 over the timescale from ROSAT t o XMM. The sources that have been above the Eddington limit in the Milky Way and the Magellenic clouds do so transiently, for a small fraction of the time. As best as we can tell, from the light curves from Einstein, ROSAT, ASCA, Chandra and XMM the ULXs are, rarely, transients, and are almost always ‘on’, unlike Galactic “ultra-luminous” objects.
As a possible further diagnostic, we constructed a color-color diagram for our ULX sources. We adopted the colors of Done 8~ Gierlinski (2003) in order to compare our sample with their sample of Galactic X-ray sources. Thus, our colors were constructed from unabsorbed model fluxes in four energy bands: 3-4, 4-6.4, 6.4-9.7, and 9.7-16 keV. The XSPECcommand dummyresp was used t o calculate a flux based on the model for the 10-16 keV range. We plot coIors for a pure unabsorbed power law (from I? = 1.5 - 3.0) and an unabsorbed MCD model (diskbb in XSPECwith kT;, = 5.0 - 0.2eV) for comparison. Comparing our Figure 6 with Figure 8 of Done & Gierlinski (2003), we find that our ULX sources largely lie along the same regions as their black hole sources. A few ULX sources, however, lie in the region occupied by atoll and Z-sources in the plot of Done & Gierlinski (2003). These sources were those best fit by a Comptonization model.
4.6. Galaxy Sample
In this section, we examine the environment in which ULX sources reside. We investigate the claim that the ULX population is proportional t o the host galaxy’s star formation rate (SFR) (Ranalli et al. 2002; Grimm et al. 2003). Towards this end, we use the far-infrared luminosity of the host galaxy as an indicator of the SFR. In order to compare the ULX population of a galaxy with the SFR we followed a similar approach t o Swartz e t al. (2004). We calculate the FIR flux from observations taken by the Infrared Astronomical Satellite. As in Swartz e t al. (2004), the ’flux between 42.4 and 122.5 p m is approximated as 1 .26~10-~~(2 .58S~0+S1~0) ergcm-2 s-’. The values of the flux at 6Opm ( S ~ O ) and 100pm ( S ~ O O ) were obtained from either Ho et al. (1997) or NED. Luminosities were calculated using the distances quoted in Table 1. We list these values in addition to the number of ULXs observed in individual galaxies in Table C10. The number of ULXs includes both the objects we classify as high and low state ULX as well as those sources resolved by Chandra.
In Figure 7, we show two plots relating the number of ULXs t o LFIR. It has been suggested
- 18-
by Grimm et al. (2003) tha t the luminosity function in the X-ray regime from HMXBs is related to SFR. In our first plot, we find that the galaxies with the highest LFIR seem to have fewer ULXs than may be expected from the luminosity functions of Grimm et al. (2003), who present a relationship showing a scaling of the number of HMXBs with luminosities over a set threshold with the host galaxy's SFR (see equation 7; Grimm et al. 2002). Using this relationship, we would expect that a galaxy with a SFR approximately equal t o that of M51 (R 4 M a yr-I from their table 1) to have M 4.47 objects with luminosities greater than 1039ergs-'. We find 5 objects with this luminosity in M51, consistent with their result. However, for NGC 4945, a galaxy with approximately the same LFIR and therefore SFR, we find only one source with a luminosity in this range. However, we note that NGC 4945 is a Seyfert, implying that the LFIR may primarily be caused by the AGN and not a direct indication of SFR. In addition t o high LFIR sources with few ULX we find a number of sources with very small SFR but which contain a ULX. For sources with SFR < 0.2Moyr-', which corresponds roughly to sources with LFIR less than that of NGC 4736, we would expect < 0.22 sources with luminosities above lo3' ergs-'. However, there are a number of bright ULXs in galaxies with very low SFRs (for instance Holmberg 11, Holmberg IX, NGC 5204, and NGC 5408). Thus, in a direct comparison, our results do not agree with the predictions of Grimm et al. (2003).
The second plot displays the average number of ULXs/galaxy, binned according t o luminosity. This plot is extremely similar to Fig. 15 of Swartz e t al. (2004) for spiral galaxies. Thus, once again, i t seems that the connection between SFR and the ULX population in spirals is supported. For irregular galaxies, however, there seems t o be more of a spread in the distribution. This could be the result of poor sampling - most of the bins contain only one galaxy. Another possibility is that there is no direct correlation in irregular galaxies or that the overall star formation in these galaxies is less ordered or clumpier. If the latter is the case, the overall SFR of the galaxy is only an average over a wide range of values. We shall address this issue again in the next paper in this series (L.M. Winter e t al., submitted) where we discuss the local environments of the ULXs in our sample.
In Figure 8 we plot the distribution of column densities among the ULXs. We subtracted the Galactic column density towards the galaxy (obtained from the nH FTOOL and listed in Table 1) from the values obtained through spectral fits. We note that, on average, the ULXs have large column densities. The typical Galactic column density along a line of sight is M 4 x 1020cm-2. If the ULX is located on the opposite side of its host galaxy, we might expect maximum column densities of M 1.2 x 1021cm-2. However, most of our sources have column densities well above this value. This is in agreement with the analysis of 5 ULXs by Roberts et al. (2004) and may imply, as they suggest, that the local environment of the ULXs contains an extra source of absorption. We are investigating this further, comparing the X-ray absorption column densities with HI data (L.M. Winter et al., submitted).
In order t o better understand the relationship between SFR and the ULX population, it is necessary to extend ULX studies to other wavelengths. In particular, it becomes important to
- 19 -
analyze UV and IR images close t o the ULX.
5 . Conclusion
We present the results of an XMMsurvey of the ULX population in nearby galaxies. In this study, we assumed that ULXs are isotropic emitters. For our selected ULX sources (which excluded transient sources and supernovae), this assumption was supported by the finding that 37/42 of our ULXs were found t o be ’on’ in ROSAT observations. This implies that theses sources exhibited high luminosities for time scales of at least 10 years, a property that is not seen in Galactic Eddington- limit exceeding sources (such as black hole X-ray binaries undergoing an outburst). We also assumed that if some ULX sources represent a class of IMBH X-ray binaries, they would exhibit spectral states analogous t o Galactic stellar mass black hole X-ray binaries. This is the hypothesis we set out t o test, classifying a source as a ULX based on (1) spectral form, (2) luminosity, and (3) coincidence of the X-ray source within the optical host galaxy. Due to the quality of spectra available for these distant X-ray sources, our classification of spectral form is really a first approximation describing the basic curvature of the spectrum.
Through this study, we have found that there exists a population of objects whose X-ray spectral properties closely match the low/hard state spectra of Galactic black holes, but whose luminosities lie in the range of Lbol M 2 x - 1 x lo4’ ergs-’. In the Milky Way, black holes with these spectral properties radiate at only M 0.05 of the Eddington limit. If this is also true for this population, it indirectly implies tha t these objects have a mass greater than M 301vI0 ranging up t o 1500M0 and thus should be IMBHs. The existence of such objects was “predicted” on the basis tha t the ULXs previously studied shared the X-ray spectral characteristics of high-state Galactic black holes; namely, an X-ray spectrum best fit by a combined blackbody and a power law (Miller et al. 2003), but with much higher luminosities. If these objects are high-state IMBHs, the corresponding low-state objects should also exist.
Our survey has also uncovered a large population of objects whose X-ray spectra are well modeled by the canonical description of Galactic black holes in the higli-state (thermal dominated), a black hole with a steep power law, but whose bolometric luminosities exceed 2 x 10³’ergs-l, ranging up t o 1041s5 ergs-’ and whose blackbody temperatures are less than 0.3 keV. If these objects are radiating at M 1/2 the Eddington limit like their Milky Way counterparts their implied masses are from 30 - 3000M0, a range very similar to that implied by the low-state objects. Using the M-li4 scaling of mass t o temperature, the observed spectral temperatures give masses of 500 - 104M, a considerably larger value. In general agreement with the expectations of the IMBH hypothesis, the objects with high-state spectra are more luminous than those with low-state spectra. We note that these results have required the high signal to noise of XMMin order to discern the spectrum of these objects. Many of these objects have also been observed by Chandra and their spectra have been well-fitted by simple power laws.

- 20 -
In addition to classification of the sources, we investigated some of the properties of the ULX sources. We found a gap in the temperature distribution of high/soft state U indicate a gap in mass distribution, which may provide clues to the nature found’ that our ULXs are persistent sources (not transients) which occupy regions on the color- color diagram of Done & Gierlinski (2003) also occupied by Galactic black hole sources. Ldstly, the existence of a substantial population of ULXs in nearby dwarf and other low star formation rate galaxies argues that (in agreement with Ptak & Colbert (2004); Swartz et al. (2004)) there is more than one source term for the origin of ULXs, with at least some of them not being associated with recent star formation, at least statistically.
We conclude, from an X-ray spectral and luminosity point of view, that our data are consistent with many of these objects having the properties expected of an IMBH population. However, we also find two other populations of objects, those whose blackbody temperature and luminosity correspond t o that of stellar mass black holes with kT M 1 keV and log L X less than 2 x 10³’ergs-’ and a small population of objects whose X-ray spectra and luminosities are consistent with that of stellar mass black holes in the very high state. Thus, ULX selected purely on the basis of 0.3 - 10 keV X-ray luminosities are a composite class with M 1/4 being “normal” stellar mass black holes and the rest being consistent with a population of IMBHs.
In a follow-up paper we will discuss the environments of these objects as revealed by XMM OM UV imaging and the implications this has for the origin of ULXs.
L.W. gratefully acknowledges Kip Kuntz and M. Coleman Miller for helpful discussions. We would also like to acknowledge R. Narayan for asking the question ‘‘are there any low-state ULXs?” at the Kyoto Black Hole meeting.
REFERENCES
Anderson, S. et al. 2003, AJ, 126, 2209
Bauer, F.E., Brandt, W.N., & Lehmer, B. 2003, AJ, 126, 2797
Begelman, M. C. 2002, ApJ, 568, L97
Belloni, T., et al. 1997, ApJ, 488, L109
Brandt, W.N., Iwasawa, K., & Reynolds, C.S. 1996, MNRAS, 281, L41
Chen W., Schrader C. R., Livio M., 1997, ApJ, 491, 312
Colbert, E.J.M. & Ptak, A.F. 2002, ApJS, 143, 25
Done, C. & Gierlinski, M. 2003, MNRAS, 342, 1041
- 21 -
Ebisawa, K., e t al. 2003, ApJ, 597, 780
Eracleous, M., Shields, J.C., Chartas, G., 8~ Moran, E.C. 2002, ApJ, 565, 108
Freedman, W. L., et al. 1994, ApJ, 427, 628
Freeman, K. C., Karlsson, B., Lynga, G., Burrell, J. F., van Woerden, H., & GOSS, W. M. 1977, A&A, 55, 445
Gierlihski, M. & Done, C. 2004, MNRAS, 349, L7
Grimm, H.-J., Gilfanov, M., & Sunyaev, R. 2003, MNRAS, 339, 793
Guainazzi, M., et al. 2000, A&A, 356, 463
Gultekin K., Miller M.C., Hamilton D.P., 2004, ApJ, 616, 221
Gutierrez, C.M. & Lopez-Corredoira, M. 2005, preprint (astroph/0502290)
Hartwell, J., et al. 2004, MNRAS, 348, 406
Heger A., Woosley S.E., 2002, ApJ, 567, 532
Ho, L.C., Filippenko, A.V., & Sargent, W.L.W. 1997, ApJS, 112, 315
Humphrey, P.J., Fabbiano, G., Elvis, M., Church, M.J., & Balucinska-Church, M. 2003, MNRAS, 344, 134
Jenkins, L.P., Roberts, T.P., Warwick, R.S., Kilgard, R.E., Sr. Ward, M.J. 2004, MNRAS, 349, 404
Jones, C. 1977, ApJ, 214, 856
Jonker, P.G. & Nelemans, G. 2004, MNRAS, 354, 355
Kaaret, P., Corebel, S., Prestwich, A.H., & Zezas, A. 2003, Science, 299, 365
Kalogera, V., Henninger, M., Ivanova, N., St King, A.R. 2004, ApJ, 603, L41
Karachentsev, I.D., Sharina, M.E., Dolphin, A.E., e t al. 2002, A&A, 385, 21
Kelson, D. D. 1996, ApJ, 463, 26
King, A.R. e t al. 2001, ApJ, 552, L109
Kong, A.K.H. 2003, MNRAS, 346, 265
Kong, A.K.H. & Di Stefano, R. 2003, ApJ, 590, 13
Kording, E., Falcke, H., Sr. Markoff, S. 2002, A&A, 382, L13
- 22 -
Kubota, A. & Makishima, K. 2004, ApJ, 601, 428
Kubota, A. e t al. 2001, ApJ, 560, L147
Kuntz, K. et al. 2005, ApJ, 620, L31
Lehmann, I. et al. 2005, A&A, 431, 847
Lira, P., Lawrence, A., & Johnson, R.A. 2000, MNRAS, 319, 17
Liu, J. F., Bregman, J. N., & Seitzer, P. 2004, ApJ, 602, 249
Madau P., Rees M.J., 2001, ApJ, 551, L27
Magdziarz, P. & Zdziarski, A.A. 1995, MNRAS, 273, 837
Makishima, I<., et al. 2000, ApJ, 535, 632
Martin, C.L., Kobulnicky, H.A., Le Heckman, T.M. 2002, ApJ, 574, 663
McClintock, J.E. & Remillard, R.A. 2004, preprint (astroph/0306213)
Miller, J . M., Fabbiano, G., Miller, M. C., & Fabian, A. C. 2003, ApJ, 585, L37
Miller, J.M., Fabian, A.C., & Miller, M.C. 2004, ApJ, 614, L117
Miller, M. C. & Colbert, E. J . M. 2004, IJMPD, 13, 1
Miller M.C. & Hamilton D.P., 2002, MNRAS, 330, 232
Miyamoto, S. et al. 1991, ApJ, 383, 784
Pietsch, W. e t al. 2001, A&A, 365, 174
Pietsch, W., Haberl, F., & Vogler, A. 2003, A&A, 402, 457
Ptak, A. & Colbert, E. 2004, ApJ, 606, 291
Pakull, M.W. & Mirioni, L. 2003, RMXAA, 15, 197
Porquet, D., Reeves, J.N., O'Brien, P., & Brinkmann, W. 2004, A&A, 422, 85
Radecke, H.D. 1997, A&A, 319, 18
Reynolds, C.S., et al. 1997, MNRAS, 286, 349
Roberts, T.P. & Warwick, R.S. 2000, MNRAS, 315, 98
Roberts, T.P., Warwick, R.S., Ward, M.J., & Goad, M.R. 2004, MNRAS, 349, 1193
Roberts, T.P. et al. 200.5, MNRAS, 357, 1363
.
- 23 -
Ross, R.R. & Fabian, A.C. 2005, MNRAS, 358, 211
Sakai, S., Madore, B.F., tk Freedman, W.L. 1996, ApJ, 461, 713
Sakai, S. tk Madore, B.F. 1999, ApJ, 526,599
Schlegel, E.M., Petre, R., Colbert, E.J.M., k Miller, S. 2000, AJ, 120, 2373
Schlegel, E.M. et al. 2004, ApJ, 603, 644
Shapley, A., Fabbiano, G., & Eskridge, P.B. 2001, ApJS, 137,139
Schlegel, E.M., Petre, R., Colbert, E.J.M., k Miller, S. 2000, AJ, 120, 2373
Smith, D.A. & Wilson, A.S. 2001, ApJ, 557, 180
Stocke, J .T. et al. 1983, ApJ, 273, 458
Summers, L.K., Stevens, I.R., Strickland, D.K., & Heckman, T.M. 2003, MNRAS, 342, 690
Summers, L.K., Stevens, I.R., Strickland, D.K., & Heckman, T.M. 2004, MNRAS, 351, 1
Sunyaev, R.A. & Titarchuk, L.G. 1980, A&A, 86, 121
Swartz, D.A., Ghosh, K.K., Tennant, A.F., k Wu, K. 2004, ApJS, 154, 519
Terasliima, Y. & Wilson, A.S. 2004, ApJ, 601, 735
Tolstoy, E., Saha, A., Hoessel, J.G., k McQuade, E(. 1995, AJ, 110, 1640
Tosi, M., Bellazzini, M., Aloisi, A., Greggio, L., Leitherer, C., & Montegriffo, P. 2001, AJ, 122, 1271
Tully, R.B. 1988, Nearby Galaxies Catalog. Cambridge Univ. Press, Cambridge
Voges, W. et al. 1999, A&A, 349, 389
Vogler, A. & Pietsch, W. 1996, A&A, 311, 35
Wang, D. et al. 2004, ApJ, 609, 113
Zdziarski, A. A.& Gierlifiski, M. 2004, Progress of Theoretical Physics Supplement, 155, 99
Zimmermann, H.U. & Aschenbach, B. 2003, A&A, 406, 969
This preprint was prepared with the AAS UTj$ macros v5.2.
- 24 -
Table 1. XMM-Newton Galaxy Observations
Galaxy Type" nnb distance' ref obs idd duration (s) comments
NGC247 NGC253 NGC300 NGC625 NGC1313 IC0342 NGC1569 NGC1705 MRK 71 NGC2403 Holmberg I1 Holmberg I M81 M82 Holmberg IX Sextans A IC 2574 NGC 4214 NGC 4258 NGC4395 NGC4449 NGC4490 NGC4631 NGC4736 NGC4945 NGC 5204 M5 1 M83 NGC5253 MlOl NG C5408 Circinus
SAB(s)d SAB (s) c;HII SA(s)d SB(s)m? sp; HI1 SB(s)d; HI1 SAB(rs)cd; HI1 IBm SAO- pec; HI1 BCD; HI1 SAB(s)cd; HI1 Im IAB (s)m SA(s)ab;LINER IO; HI1 Im IBm SAB(s)m IAB(s)m; HI1 SAB(s) bc;LINER SA (s) m;LINER IBm; HI1 SB(s)d SB(s)d (R) SA( r) ab;LINER SB(s)cd; Sy2 SA(s)m; HI1 sc ; sy2 SAB(s)c;HII Im pec;HII SAB(rs)cd IB(s)m; HI1 SA(s)b; Sy2
1.54 3.09 1.40 3.73 3.11 2.56 2.15 2.62 4.0 4.17 30.3 3.9 21.7 1.6 3.9 5.1 3.9 3.4 4.15 3.56 3.42 2.70 3.49 3.6 4.12 3.6 4.14 3.9 4.0 3.6 3.85 1.4 2.29 3.6 1.49 2.7 1.2 7.2 1.33 4 1.39 3.08 1.78 7.8 1.28 7.5 1.43 4.3 15.9 3.1 1.42 4.8 1.55 7.2 3.94 6.2 3.77 3.2 1.17 7.4 5.73 4.8 57.8 4
...
...
...
...
. . . 1 1 2 3 ... ...
4 4 5 4 6 7 ... ... ... ...
1 1 1 ...
1 1
1 8 9 10
...
0110990301 0110900101,0152020101 0112800101 0085100101 0106860101 0093640901 0112290801 0148650101 0141150201 0150651201 0112520701,0112520901 0026340101 0111800101 0112290201 0112521001 0026340201 0026340301 0035940201 0059140901,0110920101 0112521901 0112521701 0112280201 0110900201 0094360601 0112310301 0142770101,0142770301 0112840201 0110910201 0035940301 0104260101 0112290601 0111240101
14536 30711, 110591 43967 26288 41310 11217 15582 58926 45919 11415 13525,6860 26280 127913 29387 10350 21618 24263 14744 16146,21895 15842 15522 17754 53850 23461 23062 19205, 16387 20924 30627 47216 43019 7757 110496
Starburst
Starburst Starburst galaxy pair
Hol IX also in field of view Starburst M81 also in field of view
bursting star-formation
interacting with NGC4485
Galaxy pair Starburst Starburst
"from the NASA/IPAC Extragalactic Database (NED)
bcolumn density in units of
'distance in Mpc (if no reference is given, obtained from the distance modulus given in LEDA)
dXM&f-Newtora observation ids for the data examined in this survey
cmv2, obtained from the web version of the nH FTOOL
References. - (1)Tully 1988; (2) Tosi et al. 2001; (3) Tolstoy et al. 1995; (4) Freedman e t al. 1994; (5) Sakai & Madore 1999; (6) Sakai, Madore, & Freedman 1996; (7)Shapley, Fabbiano, & Eskridge 2001; (8) Kelson 1996; (9) Karachentsev et al. 2002; (10) Freeman et al. 1977.
- 25 -
Table 2. XMM-Newton best fit: single component spectral fits
Powerlaw Bremsstrahlung
Source nHa r x2 /dof n~~ k T (keV) x2/dof Fxb Lx'
NGC247 XMM2 NGC 253 XMM2 (obs 1) NGC300 XMM4d NGC1313 XMM4 IC0342 XMMl IC0342 XMM2 IC0342 XMM4 MRK71 XMMl NGC2403 XMM4 Holm11 XMMl (obs 2) Holm I XMM2 Holm I XMM3 IC2574 XMMl IC2574 XMM2 IC2574 XMM3 NGC4214 XMMl NGC4258 XMM2 (obs 2) NGC4258 XMM3
NGC4258 XMM4
NGC4395 XMM2 NGC4395 XMM4 NGC4449 XMM2 NGC4490 XMM4 NGC4490 XMM5 NGC4631 XMM4d NGC4631 XMM5f NGC4945 XMM3 NGC5204 XMM2
...
...
M51 XMM3 M51 XMM4
1.42; f 2.292; g: 47-7/54 1.62i.i 2.512; :: 69.1174 2.5 9.07 90.6145 1.862Z.5 1.82; 7; 141.71149 5.82; ! 1.6820, 23.9+_2:: 1.852; 5.32; 2.022; :: 64/58 0.472; i; 1.692: 55.3154 1.72;: 1.892; 8: 62.3171 1.52; z 3.092; :; 266.71252 0.35e 2.132; :: 39.2145 0.35e 2.052; :! 34.4132 1.32; 1.972; :: 120.9/103 0.42; 2.22; 45.7151 0.152; ';; 2.432; :: 40.3149 1.1t; z: 1.87:; :y 41.9138 6.72: 2.492; ii 83.6157 1.4:: z: 2.32:: i: 38.9137 3.8 1.82 4 /11 0.68-, + O 24 42 1.972;:; 41.1148 1.9-, +o 7a 2.245; ;i 77.03177 0.332;: 2.752; !,: 38.6136 0.32; ! 2.082: i: 16/25 1.52; i 2.812; i: 103.51112 10.22; 2.095; :: 51.6/50
3.9t; !: 2.312; ;; 60.1165 7.8 9.50 26 1.5174 1.3 1.03 641.81153 3.32:: 1.825: i; 30.1130 0.892; 2; 1.982; zz 42.37/42 0.752; :z 1.632; :! 41.4147 0.62; :; 1.862; :: 63.2172 0.42; 1.552; 7; 34.8137
< 0.65 +0.2
0.27 0.5-0.3
4.92;::
+0.3 '.'-0.3
21t3.0 -2.8
-0.85 0.04+",:",:
0.31+;::~ 0.35e 0.35e
4.2+0.99
1.12;:;
0.692;:;: 0.22ge 0.22ge 0.542::;;
0.492;:i; 2.7
4.82;:;
2.5527::; 48.8154 2.122",:",; 74.7174 0.14 117.6145 6.622::28 140.11149 10.52;:39 1601185
4.442;:;; 56 -9 1 5 8 7.982",.",: 59/56
8.52::; 74.9185
4.59::': 62.3171 1.132;.:i 309.41252 2.02;.5: 6a.a/45 2.03$_;;$ 42.1132 4.12;.:: 107.51103 1.712;;;; 65.4152 0.97+_",:; 76.5149 4.862;::; 44.5138 2.612;::; 85.5157 2.482;.:: 41.3137 7.14 5/11 4.07$_::6, 45.2148 2.822; 77.8177 0.792; ii 52/37 1.972;,96: 21.6126 1.652;:;; 112.111 12 4.75tA.89; 50.3150 3.082; :; 61.6165 0.17 207.8174 199 6591153 6.07+:'5,': 30.3130 4.052;:;: 42.2142 7.82+:.:: 39.4147 5.222:::: 69.2172 11.1~;:z~ 34.8137
0.33 0.38 0.52 0.87
0.33 0.69 3.5 6.37 4.64 8.44 0.69 1.26 0.19 0.27 0.31 0.48 3.5 3.1 0.10 0.16 0.12 0.19 0.35 0.47 0.22 0.34 0.22 0.34 0.25 0.22 0.30 1.9 0.20 1.2 0.077 0.48 0.39 2.4 0.33 2.0 0.15 0.28 0.15 0.28 0.29 0.33 0.84 6.1 0.41 2.98
0.38 0.43 0.15 0.41 0.25 0.69 0.18 1.1 0.16 0.99
atotal column density in units of 1021 cm-2
bunabsorbed flux in the 0.3-10 keV band in units of
'unabsorbed luminosity in the 0.3-10 keV band, using the distances quoted in Table 1, in units of lo3' ergs-'
dsee appendix; super-soft X-ray source best fit by single-component blackbody
eabsorbtion column density fixed to the galactic column density found in Table 1
fsource is best fit by a combined power law and vapec model; see appendix
ergcm-2 s-l
- 26 -
Table 3. XMM-Newton best fit: two-component blackbody and power law spectral fits
Source
NGC247 XMMl NGC253 XMMl
NGC253 XMM2 (obs 2) NGC253 XMM3
NGC253 XMM4
NGC253 XMM5
NGC253 XMMG NGC253 XMM7 NGC3OO XMMl NGC300 XMM2 NGC300 XMM3 NGC300 XMMG NGC1313 XMMl NGC1313 XMM2 NGC1313 XMM3 IC0342 XMM3 NGC1705 XMMl NGC1705 XMM3 NGC2403 XMMl NGC2403 XMM2 NGC2403 XMM3 Holm I1 XMMl(obs 1) M81 XMMl
M81 XMM2 M81 XMM4 M81 XMM5 Holm IX XMMl NGC4258 XMMl NGC4258 XMM2 (obs 1) NGC4395 XMMl NGC4449 XMMl NGC4449 XMM3 NGC4490 XMMl NGC4631 XMMl NGC4631 XMM2 NGC4631 XMM3 NGC4945 XMMl NGC4945 XMM2 NGC4945 XMM4 NGC5204 XMMl
...
...
...
...
nHa
2.3:; ; 1.72; ; 3.32; ;; 3.52;: 7.42; ; 1.1:; ; 2.12;;
1.92; ; 2.0:; ;; 3.52; ;
t o 8 1'8-0 6
1.62; ;
0.15:; ;: 0.38:; :6
8.7:;
5.82; iz 3 t o 9
-0 5 2.32; 1.15;; 3.52; ; 3.22; 4.02: y 0.66:; iz 1.12; y;
kT (keV) r x2 f dof
4.182:::; 86.5 193 1.742;::: 225.91230
2.072:::~ 347.41407 2.512",:",: 66.7157 2.33:;:;; 309.3 1291
2.402:';$ 335.8/339 3.412;':; 443,71420 2.872;,:; 102.6/97 1.98tE.t 87.7 f 79 4.92::977 34.6 135 1.752;':: 194.1/201 2.27:;::: 425.2 1419 2.762;.;7 441.7/424 2.692:,;: 129.5/107 2.312; 89: 53 185 2.232;::; 69.8165 2.182;,.:: 81.4179 1.952; ':: 163.1 / 151 2.152;::; 84.2 f 105 2.352;.7: 997.5/976 2.52200.;34 1273.7/1243 2.342;:2396 203.5 f 204 2.87:E.i~ 833.9/616 2.31f:,iz 48.9150 1.262;::; 89 f 80 1.72+",:",'3 866.6/878 1.512;:; 91.1 176 2.022?:685 73.4 161 3.442;:5546 168.2/154 2.212;:3239 111.2 f 116 2.522;:;; 119.9187 2.892;,:: 66.5 163 2.122;:;; 371.3 1345 1.802;;;; 107.4 197
127.1 196 96.1 f 120 105.81113 58.4 f 60 543.0 f 559 461.4/496
Ax2
25.7 36.7 44.6 47.1 23.4 34.4 6.9 12.1 5.3 60.1 17.1 21.2 26.1 31.34 14.2 13 35.4 38.9 336.6 56.3 8.9 11.1 10.8 16.4 8.4 136.7 533.1 31.4 524.3 28.2 8.5 134.3 10.3 24.1 26.9 4.3 34.1 35 12.1 12.1 18.9 20 8.7 17.1 49.1 71.6
FXC L X d
6.2 2.7 3.4 1.6 0.60 0.80 15 1.4 0.26 1.4 1.9 1.1 1.3 1.1 1.2 0.27 0.64 2.0 10 31 0.10 0.15 1.99 1 .o 0.64 12 4.5 4.8 13 0.43 0.38 10 0.34 0.31 1.4 1.56 1.1 0.88 0.96 0.25 0.15 0.59 0.66 0.38 1.98 2.92
7.1 4.5 5.7 2.7 1 .o 1.3 ,
25 2.2 0.43 2.2 3.1 1.8 1 .o 0.86 0.93 0.20 I .3 4.2 22 56.4 0.44 0.48 3.1 1.6 1.1 10 7.0 7.4 22 0.70 0.59 16 2.1 1.9 2.7 1.8 1.3 6.4 6.5 1.7 1 .o 0.68 0.76 0.44 5.6 8.0
- 27 -
Table 3-Continued
Source nHa kT (keV) r x2/dof Axzb Fxc Lxd
M51 XMMl 0.952; ii 0.16t0,,0,! 2.152; :; 97/80 13.4 0.31 1.9 M51 XMM5 10.42; 0.078t: 0,; 2.26+",.",~ 59.8170 196.2 220 1900 M83 XMM4 1.772; :7 0.5420, 1.61200'93; 84.8189 6.6 0.2 0.92 MI01 XMMl 0.2220, iz 0.2120, 0,; 1.422; 249.91231 53.1 0.45 2.9 MI01 XMM2 1.62; i: 0.76t; :: l.SSt",;? 251.61261 37.2 0.7 4.6 NGC5408 XMMl 0.9t: ;A 0.1420, 0,; 2.7150, i: 316.41337 80.4 3.97 10.9 CIRCINUS XMMl 10.12: .", 0.1020, 0,; 2.305; 0,; 749.4/861 13.5 12 23 CIRCINUS XMM2 11.25; 0.532; 0,; 4.712; :: 438.5/430 79.4 5.6 10.7 CIRCINUS XMM3 13.522 0.672; 5.775.",? 269.3/260 15.9 7.6 14.5
"total column density in units of IO" cm-'
bimprovement in x2 over the single-component power law model
'unabsorbed flux in the 0.3-10 keV band in units of
dunabsorbed luminosity in the 0.3-10 keV band, using the distances quoted in Table 1, in units
erg cm-2 s-l
of erg s-l
- 28 -
Table 4. XMM-Newton two-component blackbody and power law spectral fits for sources with large uncertainty
Source nHa kT (keV) r X2/dof AxZb Fx' Lxd
NGC3OO XMM5 0.412; 1.06?;2; 2.782; EL 46.6153 7.6 NGC1705 XMM2 0.962; :i 0.232; t: 1.602; :; 85.5174 6.5 Holm I XMMl 0.42; 1.972: :g 2.462; j: 97.4193 5.4
Sextans A XMMl 0.42: 1.052; 307 2.62:; 269.11271 2.3 NGC4214 XMM2 1.8:; 0.812; :; 3.951: 46.4144 4.5
NGC4490 XMM2 4.42: 0.602: :: 2.132; ;; 42.4154 7.1 NGC4490 XMM3 132; 0.092; 3.212",:; 72.1178 4.6 NGC4736 XMM1 6.32; 0.082; 2.412; ;$ 54.9151 7.9 M51 XMMZ 1.32;: 0.262; 1.805; zi 70.7168 4.5 M51 XMh46 8.22; 0.08t; E; 3.02; ii 36.9141 4.07 M51 XMM7 2.82; O.lO&; 1.972; i; 31.7129 6.1 M83 XMMl 1.62: $85 0.742; $: 2.582; z: 177.71209 4.7 MlOl XMM3 1.982; E l 0.632; :g 2.932; :i 145.51131 3.4 MI01 XMM4 1.82; :: 0.542; 2.222; Ai 158.21138 7.5 MI01 XMM5 1.32; ; 0.18-, 1.952: z2 45.1144 2.8
M81 XMM3 3.7t2 -2 4 0.112: 1.692; g: 77.1178 4.25
NGC4395 XMM3 0.52: 1.102; :i 2.662; :; 52/56 3.9
+O 05
atotal column density in units of loz1 bimprovement in x2 over the single-component power law model
'unabsorbed flux in the 0.3-10 keV band in units of erg cm-2 s-'
0.17 0.13 0.09 0.27 0.6 0.93 0.53 0.82 0.60 0.14 0.4 0.35 0.29 0.56 0.65 4.7 12 87.4 8.1 17.9 0.36 3.0 5.6 35 0.26 1.6 0.63 2.5 0.56 3.7 0.34 2.2 0.13 0.85
-
dunabsorbed luminosity in the 0.3-10 keV band, using the distances quoted in Table 1, in units of erg s-l
- 29 -
Table 5. Bolometric Luminosities of ULX sources
Source Lcvtoffpla Lbol MEddC classd
NGC247 XMMl NGC253 XMMl NGC253 XMM2 NGC253 XMM6 NGC1313 XMM3 NGC1313 XMM4 IC0342 XMMl IC0342 XMM2 IC0342 XMM3 MRK71 XMMl NGC2403 XMMl NGC2403 XMM4 Holmberg I1 XMMl
Holmberg I XMM2 M81 XMMl Holmberg IX XMMl NGC4214 XMMl NGC4258 XMM3 NGC4395 XMMl NGC4449 XMM2 NGC4490 XMMl NGC4490 XMM2 NGC4490 XMM3 NGC4490 XMM4 NGC4490 XMM5 NGC4631 XMMl NGC4736 XMMl NGC4945 XMM3 NGC5204 XMMl NGC5204 XMM2 M51 XMM2 M51 XMM3 M51 XMM4 M51 XMM6 MlOl XMMl MI01 XMM2 MlOl XMM3 NGC5408 XMMl Circinus XMM1 Circinus XMM2 Circinus XMM3
...
13.4258 9.31469 4.3701 5.05828 37.0364 1.50345 14.1215 19.8 129 114.015 0.2993 4.1497 0.57068 0.88906 16.8335 10.5158 15.7004 31.0582 0.26699 0.46503 9.04609 2.48586 16.8513 7.36612 240.653 1.66829 12.7136 10.6527 31.6561 0.44985 22.4756 5.57769 4.25898 2.10 133 2.56064 46.7642 8.04916 7.54268 10.9792 20.921 1 70.3579 208.746 771.157
7.07734 54 2.44574 19 2.15292 17 3.92514 30 27.9692 215 ... 116 ... 1086 ... 1524
95.4068 734 ... 23
2.14873 17 ... 44
68 11.4543 88 ...
... 809 3.17932 24 28.1445 216 . . . 21 ... 36
2.94683 23 ... 191
3.21972 25 4.51554 35 176.04 1354 ... 128 . . . 978
8.59661 66 27.3664 211 ... 35
2.20492 17 ... 429
3.57502 28 ... 162 ... 197
39.5189 304 7.68224 59 4.96709 38 1.03659 8 11.5369 89 56.1033 432 0.69929 5 0.212957 2
HS ULX HS ULX HS ULX HS ULX HS ULX LS IMBH cand. LS ULX LS ULX HS ULX LS IMBH cand. HS ULX LS IMBH cand. LS IMBH cand. HS ULX LS ULX HS ULX HS ULX LS IMBH cand. LS IMBH cand. HS ULX LS IMBH cand. HS ULX HS ULX HS ULX LS IMBH cand. LS ULX HS ULX HS ULX LS IMBH cand. HS ULX LS ULX HS ULX LS IMBH cand. LS IMBH cand. HS ULX HS ULX HS ULX HS ULX HS ULX HS ULX HS ULX HS ULX
aestimation of the bolometric luminosity, determined with an exponential cut-off in the power law a t high energy (see text)
bbolometric luminosity estimate for high-state ULXs where the power law is cut at twice kT,, (see text); units for both luminosity measurements in lo3’ erg s-l

- 30 -
'mass computed for objects radiating a t 0.1 X L E d d (low-state objects) or LE& (high-state objects; using Lbol), in units of M a
dclassification based on the criteria set forward in the text: high-state ULX (HS ULX), low-state ULX (LS ULX), and low-state IMBH candidate (low-state object with lo3' ergs-' < Lbol < 3 x lo3' ergs-')
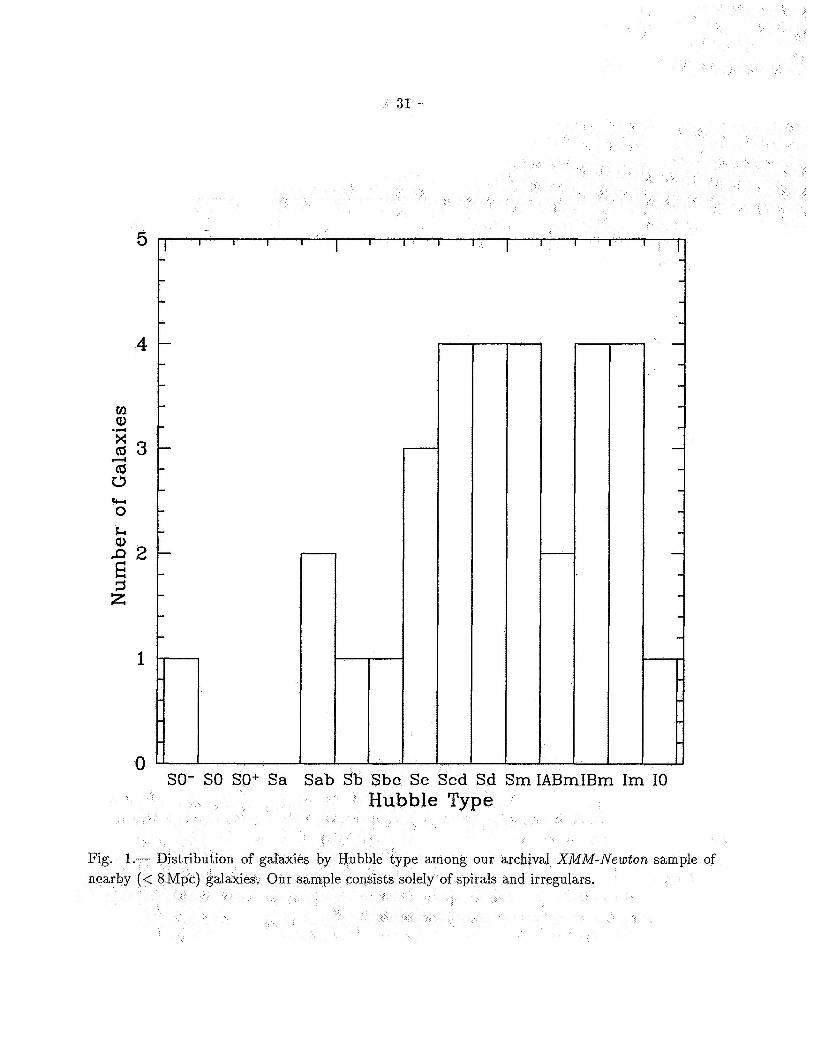
- 31 -
5
SO- SO SO+ Sa Sab Sb Sbc k d Sd SmIABmIBm Im IO
ype among our archival XMM-Newton sample of and irregulars.
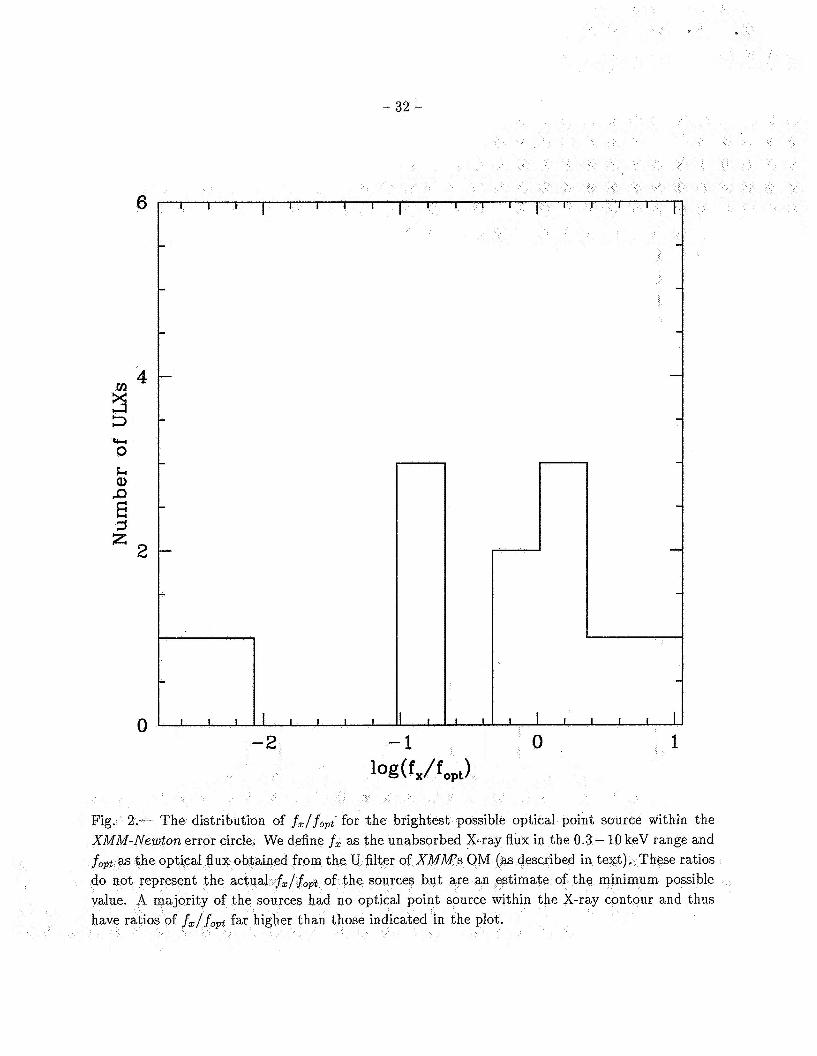
- 32 -
6
0 -2 -1 0 1
point source within the e 0.3 - 10 keV range and
minimum possible
XMM-hlewton error circle. We define
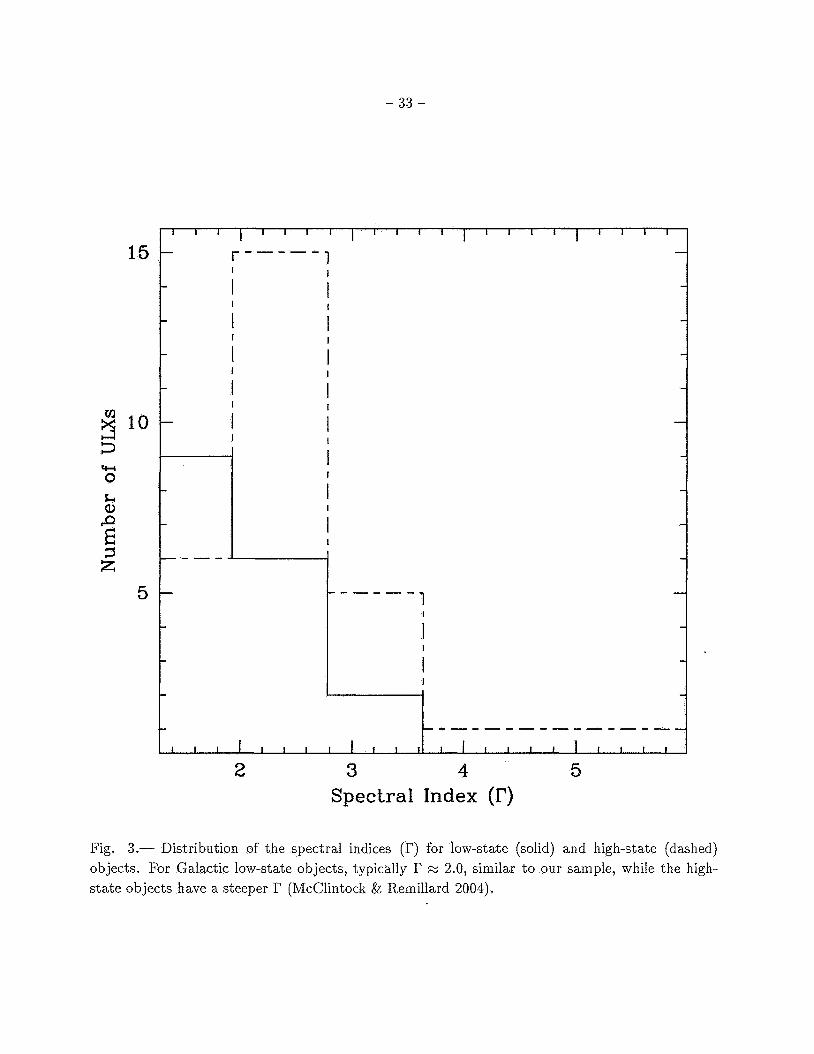
- 33 -
15
2 10
E 3 2
I l l I I I I
- r - - - - - 7
I I
I 1
I I I I
I I
I I I
I I - I I - I I
- I I
- I I
- I I
I -
I -
I
5
2 3 4 5 Spectral Index (I?)
Fig. 3.- Distribution of the spectral indices (r) for low-state (solid) and high-state (dashed) objects. For Galactic low-state objects, typically M 2.0, similar to our sample, while the high- state objects have a steeper I' (McClintock & Remillard 2004).

- 34 -
41
40
- 3 v WJ 0 4
39
38
I l l 1 I I I I I I I 1 1 1 1 I I I I I . I
A
0
H
A
A
A
1 1 1 1 1 1 1 1 1 1 1 1 1 1 1 1 1 1 1 1 1 1 1 1
1 2 3 4 5 6 Spectral Index (r)
Fig. 4.- Relationship of luminosity vs. spectral index for low-state (rectangle) and high-state (triangle) objects. Sources represented by a circle are those where the Ax2 value between the two-component and power law fits was very small. As expected from observations of Galactic stellar-mass black hole systems (McClintock 8z Remillard 2004), the classified low-state ULXs in our sample have, on average, lower X-ray luminosities than the corresponding high-state ULXs. We plot the mean values for both high-state and low-state objects with errorbars indicating the root mean square deviation. The outlying objects with spectral indices greater than 3.5 were not included in the mean or deviation calculations.
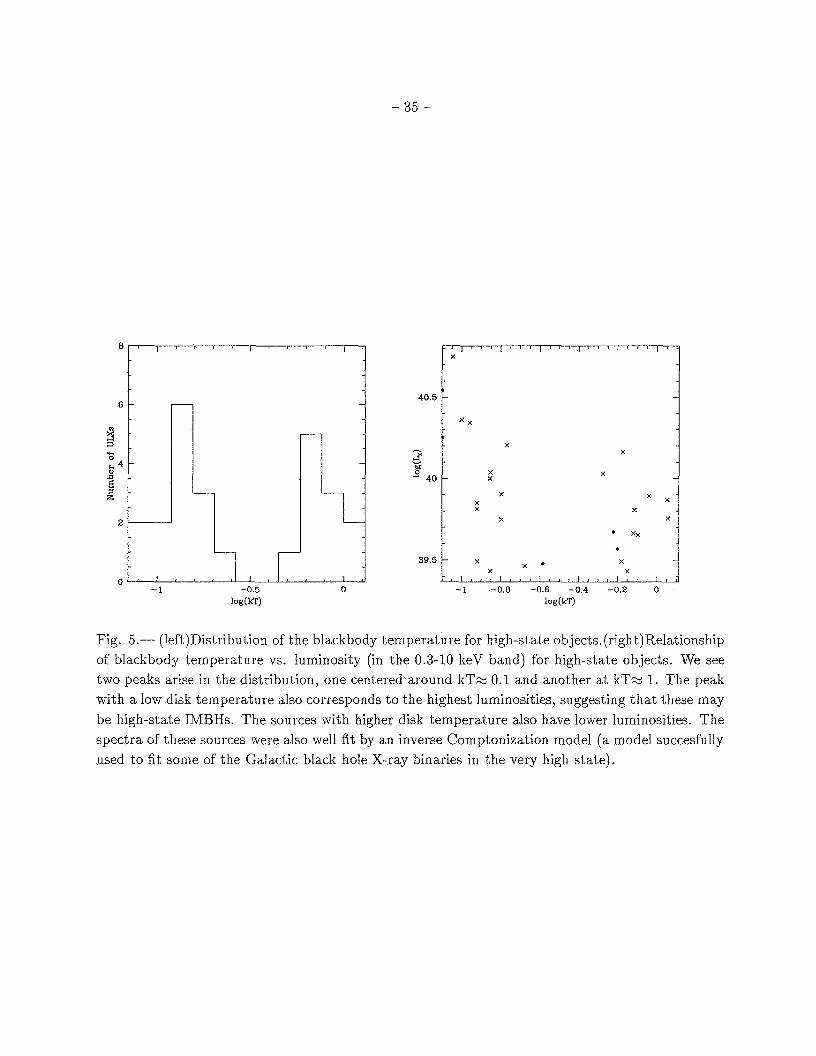
- 35 -
40.5
h
3 - X v M
X X - 40 - X - X
X x - X X
X X
' xx
X - X '
39.5 - X
X X l , , I I , I , l I 8 I I , I I i I I ! I ! :
- 1 -0.8 -0.6 -0.4 -0.2 0
h
- 40
X
X J 39.5
- 1 -0.8 -0.6 -0.4 -0.2 0
Fig. 5.- (1eft)Distribution of the blackbody temperature for high-state objects. (rig1it)Relationship of blackbody temperature vs. luminosity (in the 0.3-10 keV band) for high-state objects. We see two peaks arise in the distribution, one centered around kTw 0.1 and another at kTz 1. The peak with a low disk temperature also corresponds t o the highest luminosities, suggesting that these may be high-state IMBHs. The sources with higher disk temperature also have lower luminosities. The spectra of these sources were also well fit by an inverse Comptonization model (a model succesfully used t o fit some of the Galactic black hole X-ray binaries in the very high state).
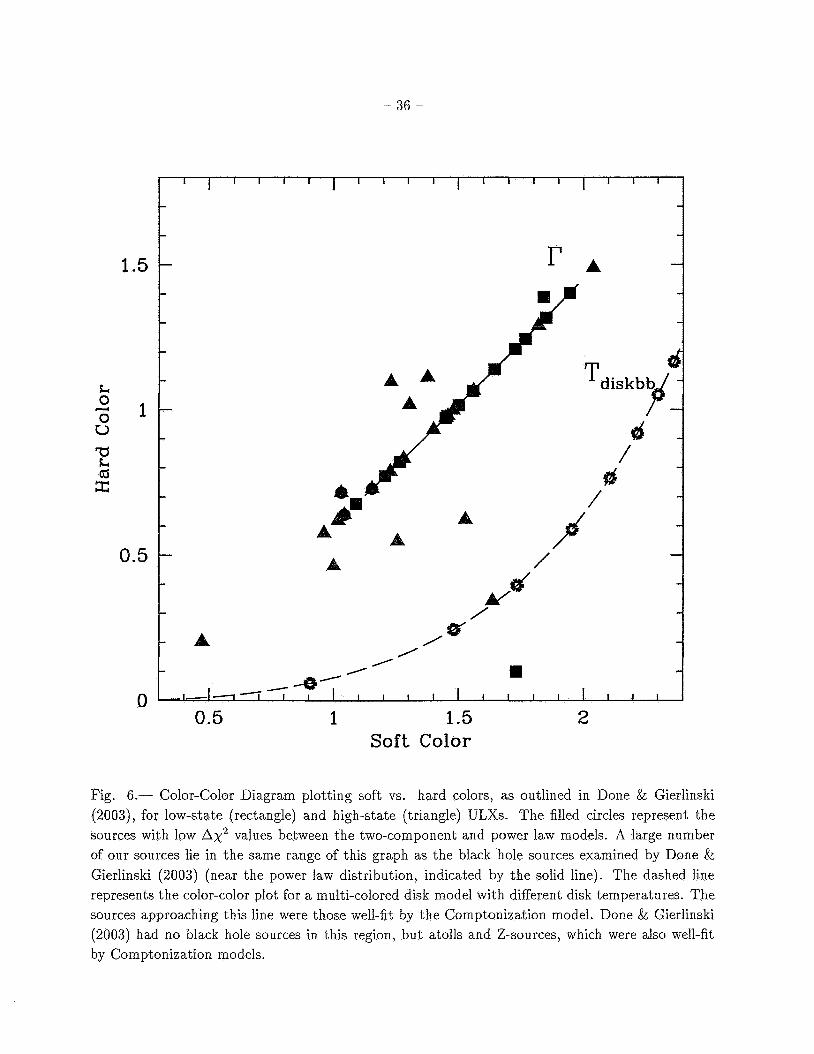
- 36 -
1.5
& 0
u - 1 0
a k (d z
0.5
0
Fig. 6.- Color-Color Diagram plotting soft vs. hard colors, as outlined in Done & Gierlinski (2003), for low-state (rectangle) and high-state (triangle) ULXs. The filled circles represent the sources with low Ax2 values between the two-component and power law models. A large number of our sources lie in the same range of this graph as the black hole sources examined by Done & Gierlinski (2003) (near the power law distribution, indicated by the solid line). The dashed line represents the color-color plot for a multi-colored disk model with different disk temperatures. The sources approaching this line were those well-fit by the Comptonization model. Done & Gierlinski (2003) had no black hole sources in this region, but atolls and Z-sources, which were also well-fit by Comptonization models.
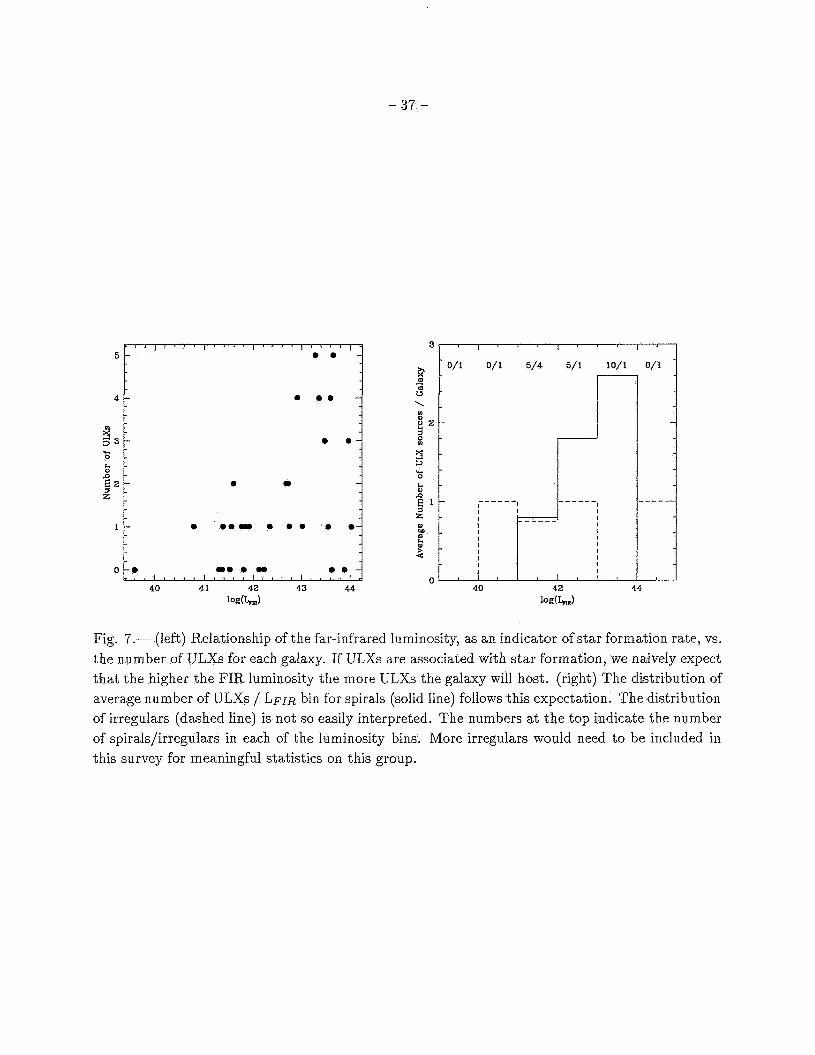
- 37 -
0 0
x m 6 u
D M
e 2
Fig. 7.- (left) Relationship of the far-infrared luminosity, as an indicator of star formation rate, vs. the number of ULXs for each galaxy. If ULXs are associated with star formation, we naively expect that the higher the FIR luminosity the more ULXs the galaxy will host. (right) The distribution of average number of ULXs / LFIR bin for spirals (solid line) follows this expectation. The distribution of irregulars (dashed line) is not so easily interpreted. The numbers at the top indicate the number of spirals/irregulars in each of the luminosity bins. More irregulars would need to be included in this survey for meaningful statistics on this group.
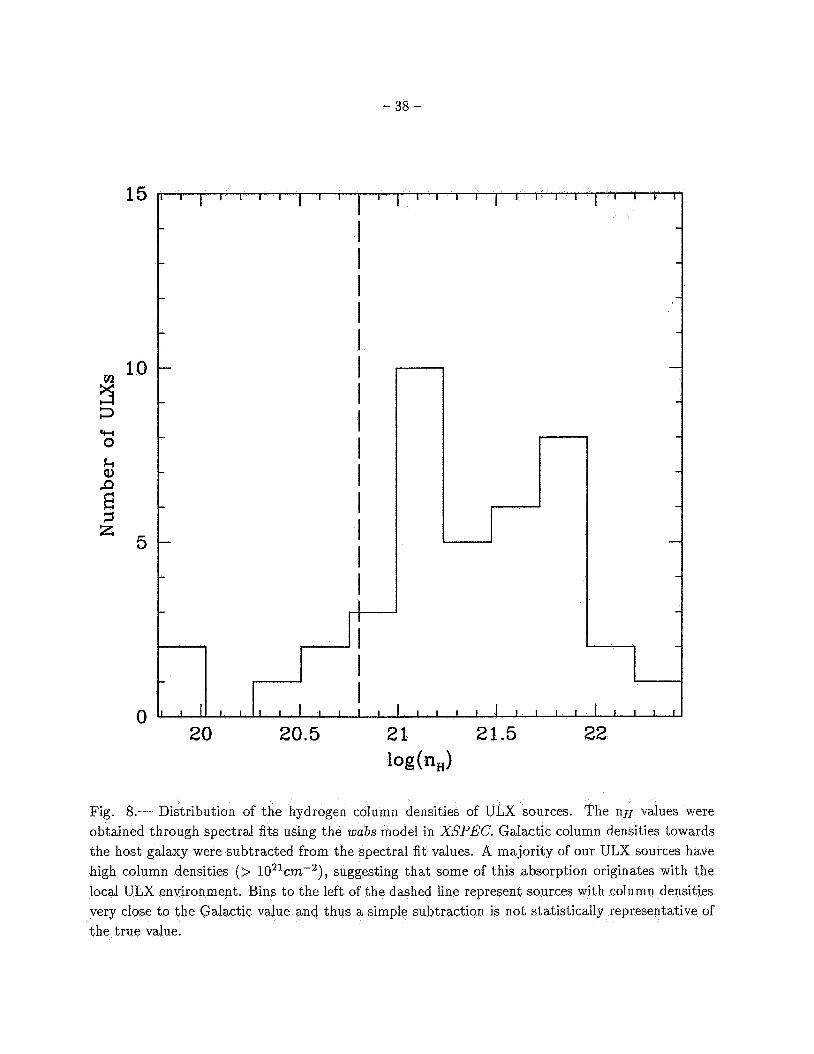
- 38 -
15
. I I I I I I I I I I I I I I
Fig. 8.- Distribution of the hydrogen column densities of ULX sources. The nH values were obtained through spectral fits using the wabs model in XSPEC. Galactic column densities towards the host galaxy were subtracted from the spectral fit values. A majority of our ULX sources have high column densities (> 1021cm-2), suggesting that some of this absorption originates with the local ULX environment. Bins to the left of the dashed line represent sources with column densities very close to the Galactic value and thus a simple subtraction is not statistically representative of the true value.
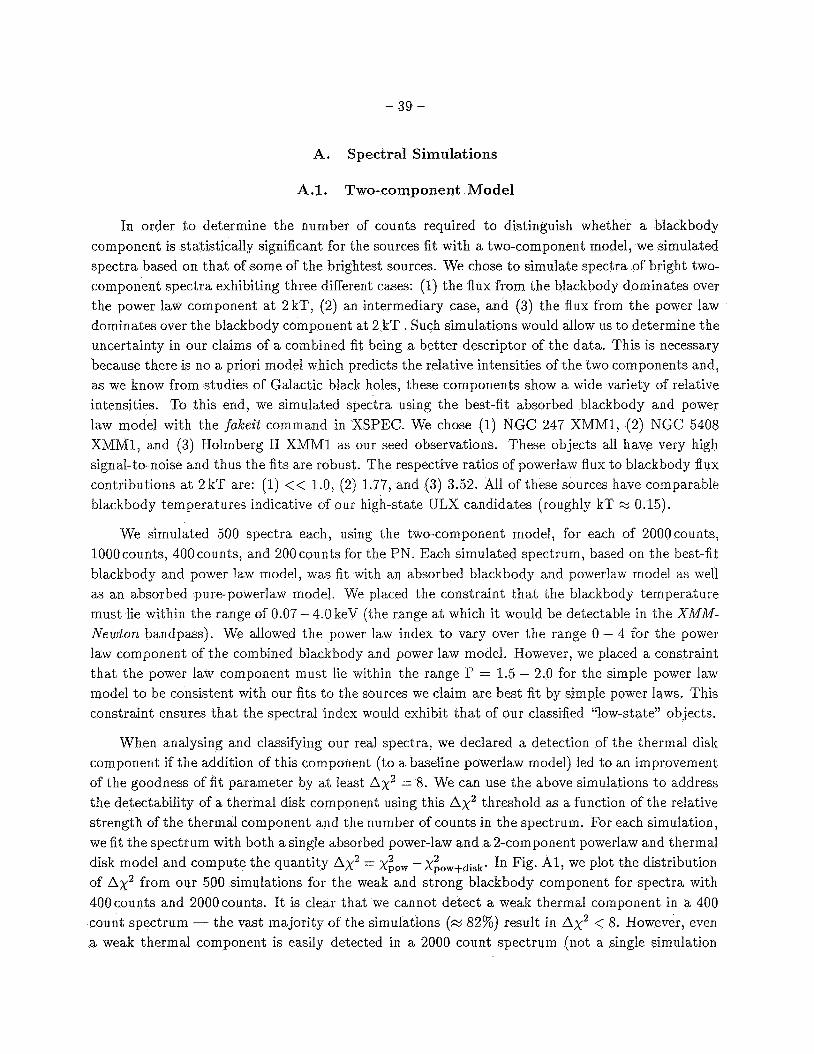
- 39 -
A. Spectral Simulations
A.l . Two-component Model
In order to determine the number of counts required to distinguish whether a blackbody component is statistically significant for the sources fit with a two-component model, we simulated spectra based on that of some of the brightest sources. We chose t o simulate spectra of bright two- component spectra exhibiting three different cases: (1) the flux from the blackbody dominates over the power law component at 2 kT, (2) an intermediary case, and (3) the flux from the power law dominates over the blackbody component at 2 kT . Such simulations would allow us to determine the uncertainty in our claims of a combined fit being a better descriptor of the data. This is necessary because there is no a priori model which predicts the relative intensities of the two components and, as we know from studies of Galactic black holes, these components show a wide variety of relative intensities. To this end, we simulated spectra using the best-fit absorbed blackbody and power law model with the fakeit command in XSPEC. We chose (1) NGC 247 XMM1, (2) NGC 5408 XMM1, and ( 3 ) Holmberg I1 XMMl as our seed observations. These objects all have very high signal-to-noise and thus the fits are robust. The respective ratios of powerlaw flux to blackbody flux contributions at 2 kT are: (1) << 1.0, (2) 1.77, and ( 3 ) 3.52. All of these sources have comparable blackbody temperatures indicative of our high-state ULX candidates (roughly kT M 0.15).
We simulated 500 spectra each, using the two-component model, for each of 2000counts, lOOOcounts, 400counts, and 200 counts for the PN. Each simulated spectrum, based on the best-fit blackbody and power law model, was fit with an absorbed blackbody and powerlaw model as well as an absorbed pure-powerlaw model. We placed the constraint tha t the blackbody temperature must lie within the range of 0.07 - 4.0 keV (the range at which i t would be detectable in the X f M - Newton bandpass). We allowed the power law index t o vary over the range 0 - 4 for the power law component of the combined blackbody and power law model. However, we placed a constraint that the power law component must lie within the range I’ = 1.5 - 2.0 for the simple power law model to be consistent with our fits t o the sources we claim are best fit by simple power laws. This constraint ensures tha t the spectral index would exhibit tha t of our classified “low-state” objects.
When analysing and classifying our real spectra, we declared a detection of t h e thermal disk component if the addition of this component (to a baseline powerlaw model) led to an improvement of the goodness of fit parameter by at least Ax2 = 8. We can use the above simulations t o address the detectability of a thermal disk component using this Ax2 threshold as a function of the relative strength of the thermal component and the number of counts in the spectrum. For each simulation, we fit the spectrum with both a single absorbed power-law and a 2-component powerlaw and thermal
of Ax2 from our 500 simulations for the weak and strong blackbody component for spectra with 400counts and 2000counts. I t is clear that we cannot detect a weak thermal component in a 400 count spectrum - the vast majority of the simulations (m 82%) result in Ax2 < 8. However, even a weak thermal component is easily detected in a 2000 count spectrum (not a single simulation
disk model and compute the quantity Ax2 = xgOw - x ~ ~ ~ + ~ ~ ~ ~ . 2 In Fig. A l , we plot the distribution
- 40 -
gave Ax2 < 8). The strong blackbody case is detectable with high significance even in a 400 count spectrum (< 1% of the simulations resulted in Ax2 > 8).
When we increase the upper limit of the range of the spectral index in XSPECfor the power law model to I’ = 3.0, our confidence levels decrease. For a weak thermal component with 400counts, all of the simulations result in Ax2 < 8. At 2000counts, only M 30% of the simulations for a weak thermal component have Ax2 < 8. For a strong thermal component, 20% of the simulations yield Ax2 < 8 for 400counts while, as was the case for I? = 2.0, none of the simulations gave Ax2 < 8 for 2000 counts.
Thus allowing the I’ t o “float freely” or remain unconstrained further decreases the confidence levels. When the I’ parameter is allowed to float the spectra are fit with higher I‘ values in order t o compensate for the missing bIackbody component. When the upper Limit was instituted at 2.0 or 3.0, we found that all 500 simulated spectra were fit with a I’ = 2.0 or 3.0, respectively, for the simple power law model. This same affect is not seen in the I’ of the two-component model, where t-he value ranges between 1.4 and 4.0 with a peak in the distribution near that of the original model used t o simulate the spectra. Thus, higher power law indices (> 3.0) can indicate the necessity of an added blackbody component. Since there are no Galactic black holes whose broad band
-spectra are well fit by steep power laws it seems that restricting the allowed power law indices is more consistent with the nature of Galactic black holes. In fitting our sources with the three “standard” models, we allowed the I’ t o float, thus the problem of a missing blackbody component being compensated for by a steep power law should not have factored into our classification criteria.
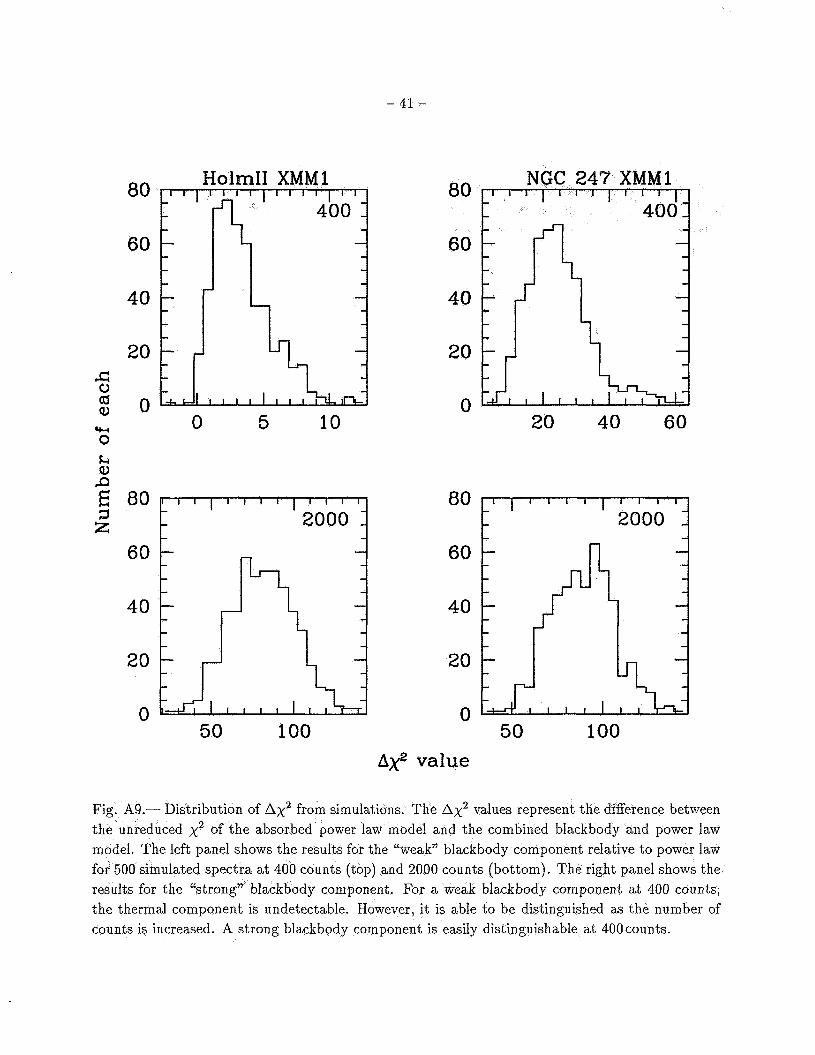
- 41 -
w 0 L Q) d
I z E
80
60
40
20
0
80
60
40
20
0
Holm11 XMM1
0 5 10
50 100
20 40 60
60
40
20
0
Ax2 value
Fig. A9.- Distribution of Ax2 from simulations. The Ax2 values represent the difference between the unreduced x2 of the absorbed power law model and the combined blackbody and power law model. The left panel shows the results for the “weak” blackbody component relative to power law for 500 simulated spectra at 400 counts (top) and 2000 counts (bottom). The right panel shows the results for the “strong lackbody component. For a weak blackbody component at 400 counts, the thermal component is undetectable. However, i t is able t o be distinguished as the number of counts is increased. A strong blackbody component is easily distinguishable at 400 counts.
- 42 -
A.2. Simple Power Law Model
Our next set of simulations sought to determine our confid ce in the simple power law fit being an adequate descriptor of the spectra. Binning provides a problem in distinguishing between a powerlaw and a curvature in the spectrum at the low energy range, since the binning procedure can wash out a low kT blackbody from the spectrum. For this reason, we chose to simulate unbinned PN spectra for a source we categorized as a low-state object, IC 0342 XMM1. IC 0342 XMMl represents characteristics typical of our low-state candidates, namely it is within the proper luminosity range and i t has a power law index of F x 1.7 (the median of the distribution for low-state objects is 2.03) and a hydrogen column density near the median of all the fitted values (where the median value is x 3 x 1021cm-2 and the value of IC 0342 X-1’s column density is 5.8 x 1021cm-2). We chose this source for these reasons and the high number of counts in its PN spectrum. Instead of using the x2 statistic (used for binned data), we chose t o use the maximum-likelihood statistic, C-stat, in X S P E C (which uses unbinned data).
We simulated 500 spectra using the best-fit parameters for the simple power law fit using the fakeit command. We fit the simulated spectra with two models: the simple powerlaw and a combined blackbody and power law model and computed the change in the goodness of fit, Ax2. For the two-component model, once again we placed the constraint that the blackbody temperature remain in the range that it would be detectable by XMM-Newton, 0.07 - 4 keV. We followed this procedure for 1000, 2000, and 4000 counts. At both the 1000 and 2000 count level, the addition of a second component has no effect on the C-statistic (the distributions in C-space for both the power law fit and the two-component fit are indistinguishable).
At the 4000 count level, the C-statistic distributions for the two models separate such that there is an 2G% confidence tha t the two-component model is a better fit to the data. We find, when we examine the model parameters, that the power law index (I?) for the two-component model ranges between 1.19 - 2.12 with the mean value x 1.74. The mean value for all three count levels used clustered around this value, though the range in I? increased as the counts decreased. The mean blackbody temperature for simulations with 4000 counts was 1.17keV (with the range varying between the amount previously noted) with a median of 1.06 keV. For simulations with lower counts, the blackbody temperature becomes higher (1.24keV for 1000 counts) with a higher median (1.83 keV for 1000 counts). This tells us that the fitting procedure tends to approximate a pure power law spectrum as a two-component spectrum with I? equal t o that of the true spectral index but with a blackbody temperature higher than those observed in our study (1.1 keV or higher) which in the X M M band can be approximated as a power law. If we found spectra in our sample tha t were best fit with a low spectral index and a high blackbody temperature, we might suspect tha t the spectrum’s true nature is a power law. We also note tha t if the hydrogen column density is large, much > 3 x 1021cm-2, a low temperature (kT) blackbody component can be much more difficult t o detect.
- 43 -
B. Additional Spectral Fits
The following sources were not best fit by the standard models employed in this study:
B.1. NGC300 XMM4
This source was classified as a super-soft X-ray source by Kong & DiStefano (2003). We find tha t the standard single-component absorbed blackbody model is a much better model for this spectrum. In fact, the power law, bremsstrahlung, and combined models do not fit the data within the 90% confidence range. Fitting an absorbed blackbody, we find the best fit corresponds to the following parameters: n H = 1.38:::;; x 1O2I cm-2, 1%T = 0.059fi:::; keV, and x2/do f = 74.5/45. This fit yields an unabsorbed flux of 3.3 x ergcm-2 s-I.
B.2. NGC4631 XMM4
The spectrum of this source clearly identifies it as a super-soft X-ray source. As with NGCSOO XMM4, the standard models employed in this study did not adequately match the data. The best fitting model corresponds again t o an absorbed blackbody. The corresponding parameters are as follows: n H = 6.2:y:E6 x 1021 kT = 0.07::::: keV, and X2/do f = 142.3/74. This fit yields an unabsorbed flux of 9.5 x ergcm-2s-1. The position of this source shows it to be coincident with a globular cluster associated with that galaxy. This source was identified as a bulge X-ray source, possibly powered by accretion, in a ROSAT study of NGC4631 (Vogler 8~ Pietsch 1996).
B.3. NGC4631 XMM5
The spectrum of this source was best fit with an absorbed power law + an absorbed vupec model. This indicates the prescence of hot gas, indicating a possible thermal X-ray source.
B.4. NGC4945 XMM5
The spectrum of this source was not adequately fit with any of the standard models used in this investigation. The spectrum exhibits a prominent Fe K line in the PN spectrum that is well fit by a gaussian (zgauss) at 6.4 keV. We find that the entire spectrum is best fit with a partial covering fraction absorption model (pcfubs) in combination with the normal absorption, a power law, and a gaussian. The best fit parameters yield: absorption column density, n H = 1.79 x 1021cm-2, partial covering absorption, n H = 18.4 x 1021cm-2, partial covering fraction = 0.82, I' = 1.6, and X2/dof = 61-8/57. The source is clearly located within the optical galaxy, and is thus unlikely to
- 44 -
be a background AGN.
B.5. M51 XMM5
The spectrum and luminosity (Lx M 1.9 x 1042ergs-1) of this source suggests that i t is an AGN. The location of the source, from the Digital Sky Survey, places i t within the dwarf companion of M51 making a value of the optical flux hard t o constrain. The best fit to this source was an absorbed blackbody + power law and the spectral parameters are listed in Table 4.
B.6. M83 XMM2
Like NGC4945 XMM5, this source was best fit by a partial absorption model. However, this source showed no evidence of an Fe K line. We fit this source’s spectra using a partial covering fraction absorption model in combination with the normal absorption model and a power law. The best fit parameters yield: absorption column density, nH = 2.1 x lo2’ cm-2, partial covering absorption, nH = 43.5 x 1021cm-21 partial covering fraction = 0.86, r = 2.95, and X2/dof = 83.5/84. The unabsorbed flux in the range of 0.3-10 keV equals 1.37 x ergcm-2 s-’.
B.7. Inverse Compton Scattering Sources
Table C4 includes the parameters for the “ULX” sources best fit by the compST model. A discussion of these sources and interpretation of the data is included in section 4.3.
C . Additional Tables
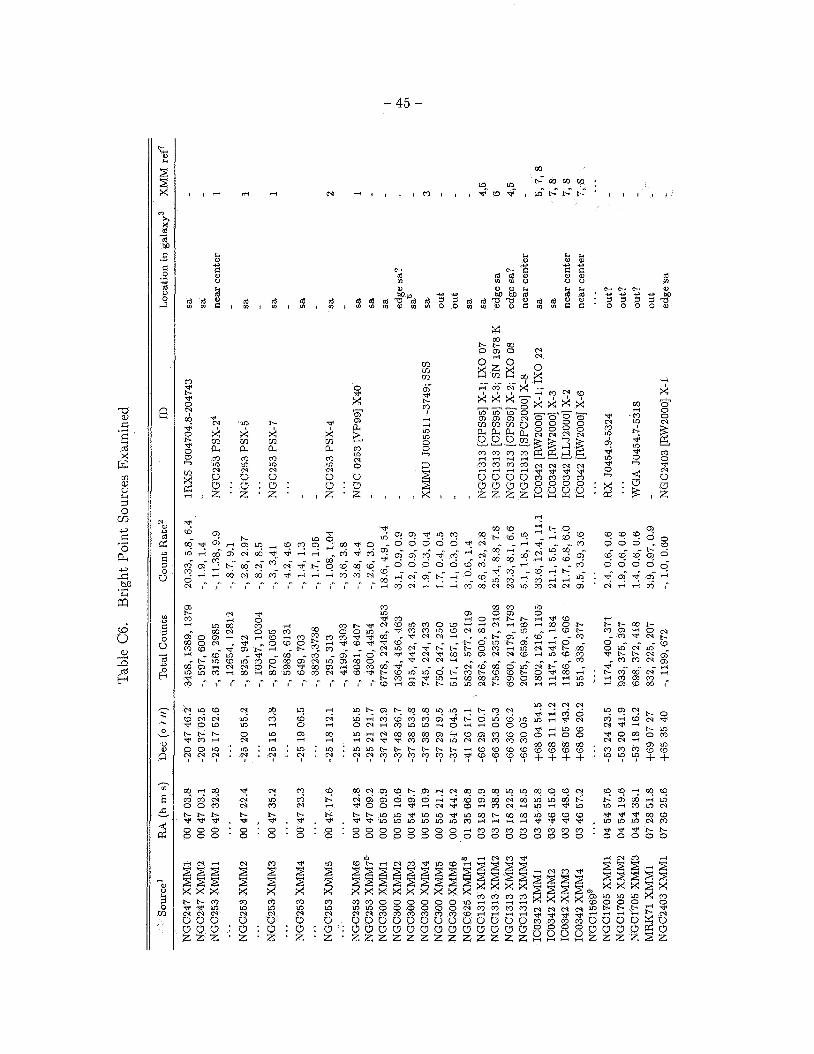
- 45 -
e G .3
ko
w u
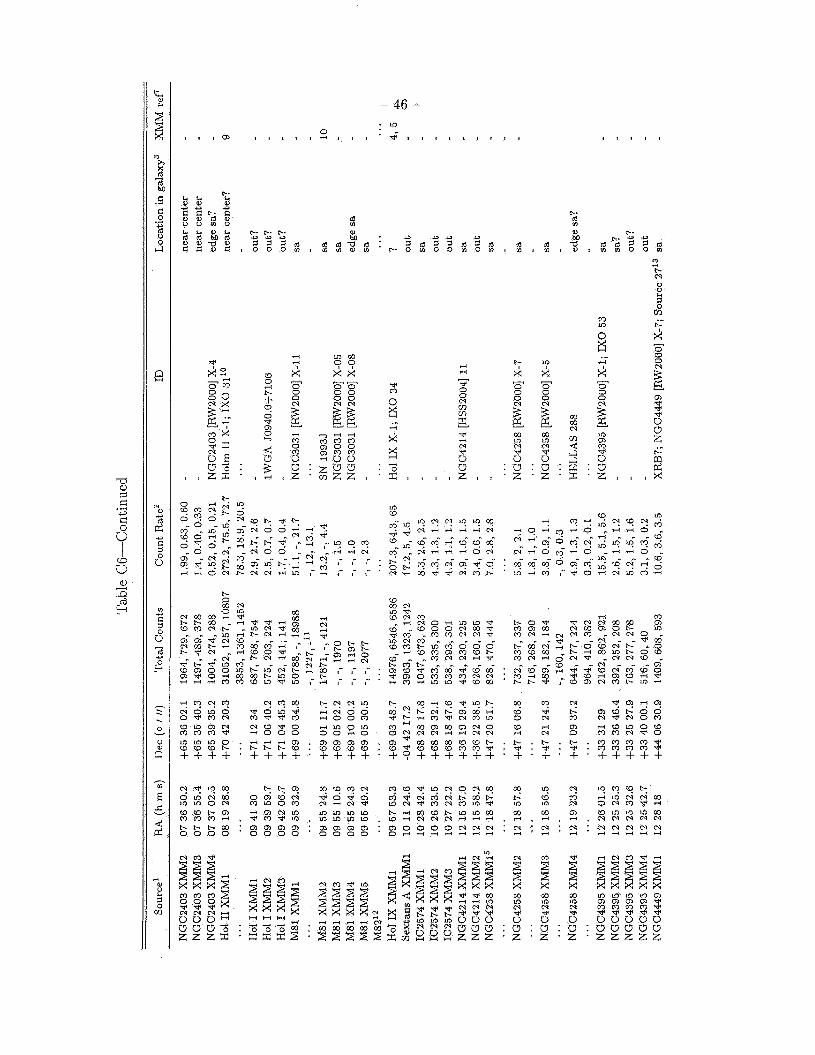
-3 m 0 E .^ 3
X X u
2 ,
0 E x .^ 4 Y
X
I
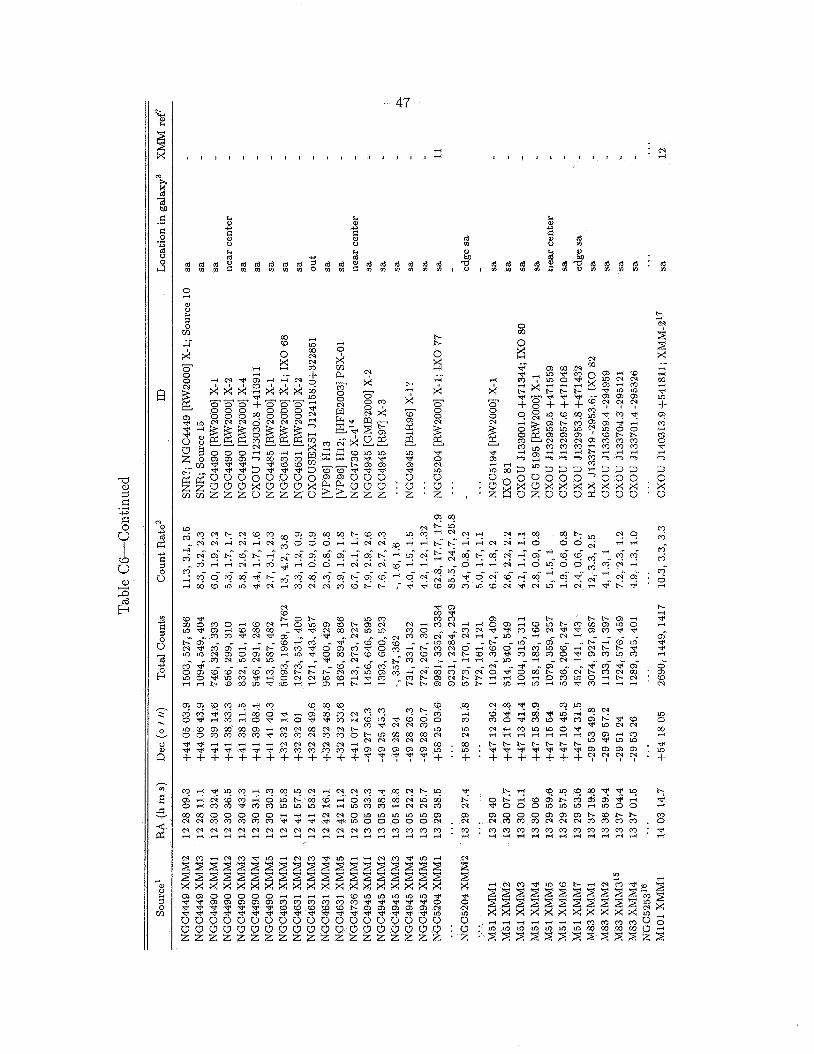
- 47 -
9
0 to 0 X
N H
5 0 X u
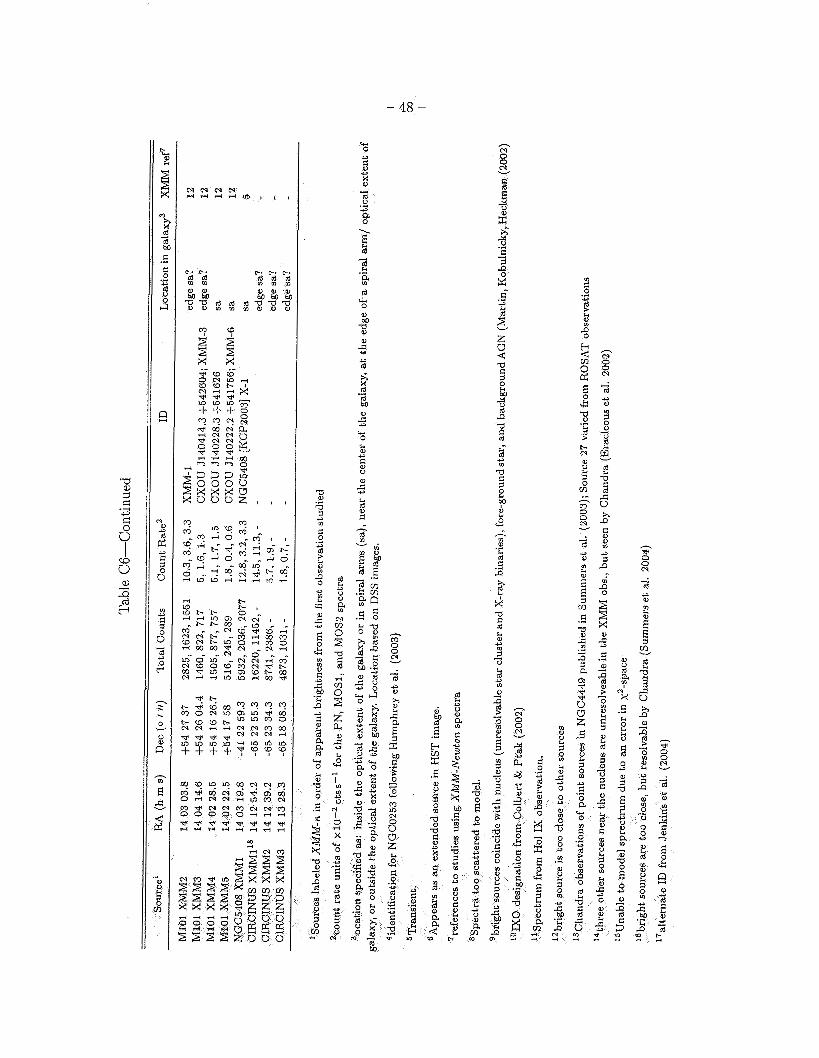
- 48 -
E. E. E. E. E.
$ 2
- 49 -
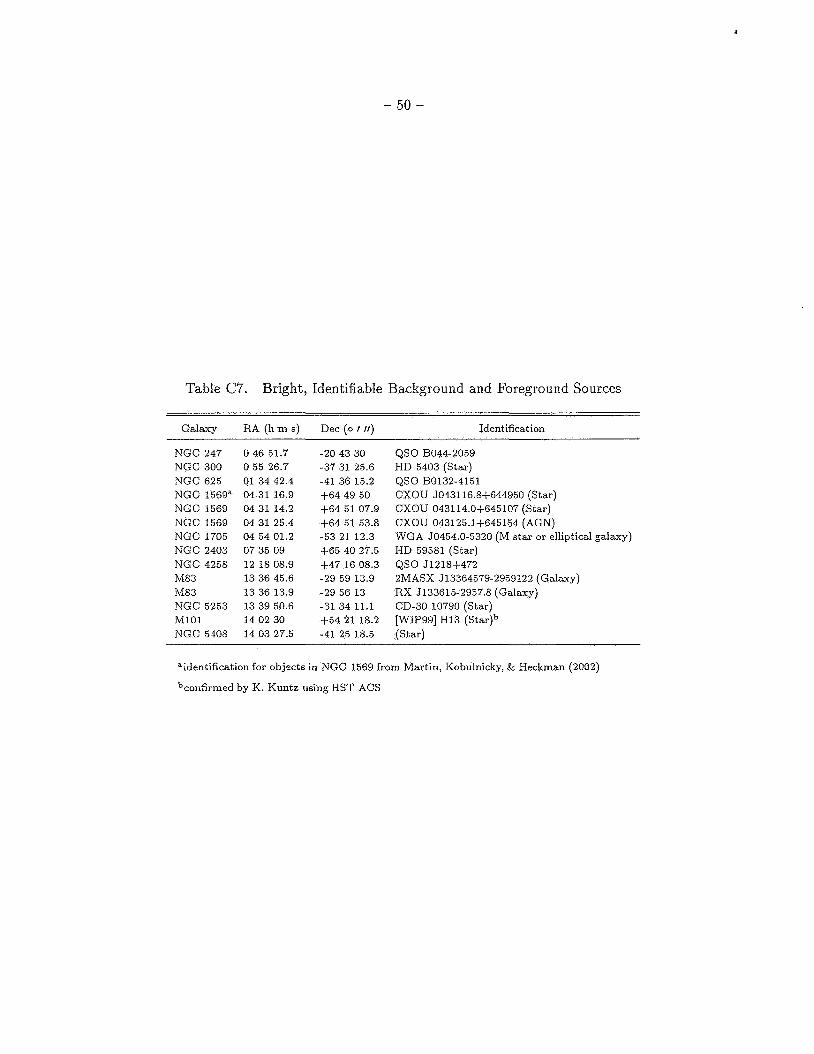
- 50 -
Table C7. Bright, Identifiable Background and Foreground Sources
Galaxy RA (h m s) Dec ( 0 I I / ) Identification
NGC 247 NGC 300 NGC 625 NGC 1569= NGC 1569 NGC 1569 NGC 1705 NGC 2403 NGC 4258 &I83 M83 NGC 5253 MI01 NGC 5408
0 46 51.7 0 55 26.7 01 34 42.4 04 31 16.9 04 31 14.2 04 31 25.4 04 54 01.2 07 35 09 12 18 08.9 13 36 45.6 13 36 13.9 13 39 50.6 14 02 30 14 03 27.5
-20 43 30 -37 31 25.6 -41 36 15.2 $64 49 50 +64 51 07.9 $64 51 53.8
$65 40 27.5 $47 16 08.3 -29 59 13.9 -29 56 13 -31 34 11.1 $54 21 18.2
-53 21 12.3
-41 25 18.5
QSO B044-2059 HD 5403 (Star) QSO B0132-4151 CXOU J043116.8+644950 (Star) CXOU 043114.0+645107 (Star) CXOU 043125.1$645154 (AGN) WGA JO454.0-5320 (M star or elliptical galaxy) HD 59581 (Star) QSO J1218+472 2MASX J 13364579-2959122 (Galaxy) RX J133615-2957.8 (Galaxy) CD-30 10790 (Star) [WIP99] H13 (Star)b (Star)
aidentification for objects in NGC 1569 from Martin, Kobulnicky, & Heckman (2002)
bconfirmed by K. Kuntz using HST ACS

- 51 -
Table C8. XMM-Newton power law fit for best fit two-component spectra
Source n H a r NGC247 XMMl 9.52;:;
$0.3 NGC253 XMMl 3.4-o.3 ... 6.92",:",
NGC253 XMM2 (obs 2) 2.22i.i NGC253 XMMS 3.92;:;
NGC253 XMM4
NGC253 XMM5
NGC253 XMM6 NGC253 XMM7 NGC3OO XMMl NGC300 XMM2 NGC300 XMMS NGC300 XMM5 NGC300 XMM6
...
4.02;:; 8.52;:;
$1.2 1.7-o.~ 1.22;:;
3.4:;:; 3.92;:: 7.1 ?E::',
1.7-o.40
0.311e
0.97+_;::; $0.40
3.42;:;
NGC1313 XMMl 1.5:;;;
NGC1313 XMMS 3.6$_;;:
2.8t0.16 NGC1313 XMM2 -0.16
IC0342 XMM3 3.82",:", NGC1705 XMMl 0.3e NGC1705 XMM2 NGC1705 XMM3
1.4tO.45 -0 41
NGC2403 XMMl NGC2403 XMMS
1.gt0.40 NGC2403 XMM3 -0.36 Holm11 XMMl (obs 1) 1.5t0.07 -n nr Holm I XMMI M81 XMMl ...
M81 XMM2 M81 XMM3 M81 XMM4 M81 XMMS Holm IX XMMl Sextans A XMMl NGC4214 XMM2 NGC4258 XMMl NGC4258 XMM2 (obs 1) NGC4395 XMMl NGC4395 XMM3 NGC4449 XMMl NGC4449 XMM3 NGC4490 XMMl NGC4490 XMM2
7.3
t0.4 l.O-O.3
$0.06 1.7-0.08 0.18+_;::: 0.22;;;
3.5 2;:; 3.72;;;
$0.4 1.6-0.4
?+?
112.2195 262.61232 611.61582 507.41500 91.9183 381.81409 73.6159 321.41293 31.8125 283.81298 ' 4351409 3571342 469.81422 133.98199 101.9181 54.2156 47.6137 219.81203 464.11421 778.31426 185.81109 61.9188 91/76 80.9167 92.2181 179.51 1 5 1 92.61107 1134.21976 102.8195 1849.91 1245 224.91208 1358.21618 81.35180 66.4152 97.5182 1000.9/882 271.41275 50.9146 101.4178 97.5163 195.11156 55,9158 1031118 154189 101.5165 49.5156
1900 2200 3.1 3.6 2.9 3.3 1.2 1.4 0.73 1.2 0.98 1.6 0.52 0.85 0.29 0.48 0.32 0.53 1.1 1.3 0.93 1.5 1.3 2.2 0.81 0.6 0.27 0.21 0.19 0.15 0.14 0.10 0.06 0.15 0.42 0.88 1.9 4.0 3.3 6.9 1.7 3.1 0.12 0.37 0.078 0.24 0.17 0.53 2.2 3.6 1.3 2.0 0.81 1.3 12 10 0.48 1.7 4.5 7.0 4.3 6.7 48.5 75.2 2.5 3.9 0.35 0.54 0.44 0.68 9.4 15 0.56 0.13 0.16 0.14 0.06 0.04 0.43 2.6 7.2 14 0.25 0.48 1.2 1.36 1.3 1.5 1.2 8.7 0.92 6.7
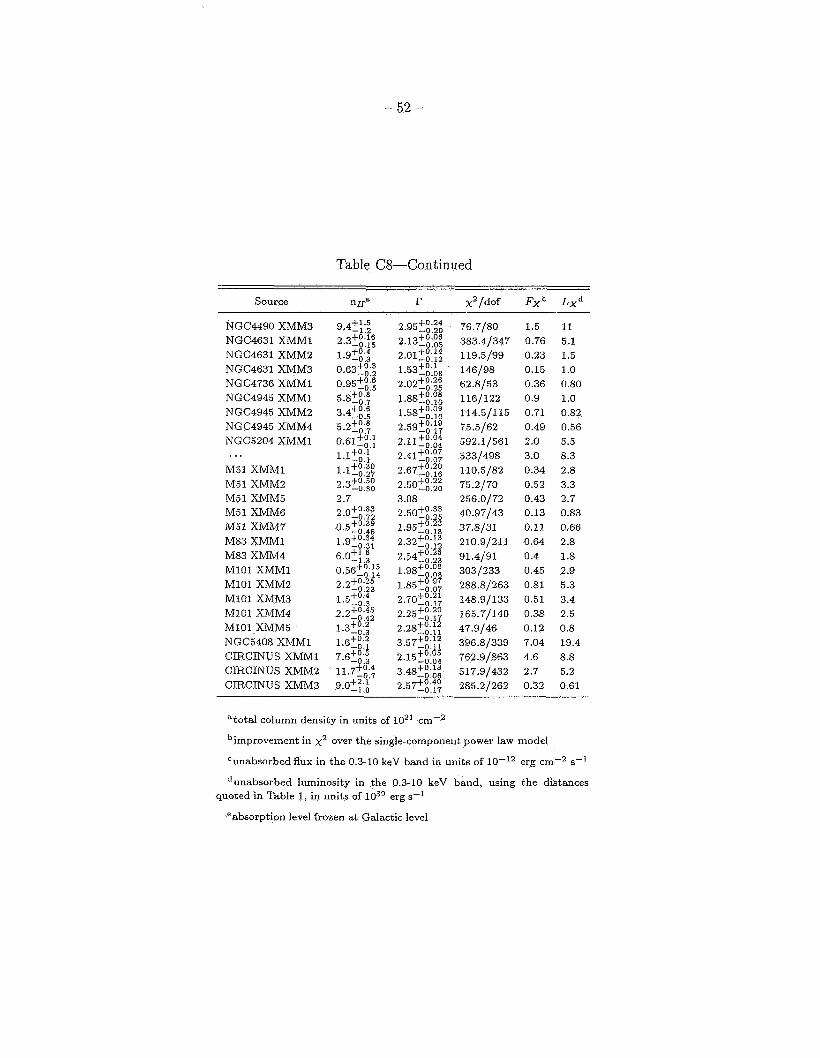
- 52 -
Table C8-Continued
Source nHa r x2/dof Fxc Lxd
NGC4490 XMMB NGC4631 XMMl NGC4631 XMM2 NGC4631 XMM3 NGC4736 XMMl NGC4945 XMMl NGC4945 XMM2 NGC4945 XMM4 NGC5204 XMMl
M51 XMMl M51 XMM2 M51 XMM5 M51 XMM6 M51 XMM7 M83 XMMl M83 XMM4 MlOl XMMl MlOl XMM2 MlOl XMMB MlOl XMM4 MlOl XMM5 NGC5408 XMMl CIRCINUS XMMl CIRCINUS XMM2 CIRCINUS XMM3
...
76.7180 383.41347 119.5/99 146198 62.8153 1161122 114.51115 75.5/62 592.1/561 5331498 110.5182 75,2170 256.0172 40.97143 37.8/31 210.91211 91.4191 3031233 288.8/263 148.91133 165.7/140 47.9146 396.81339 762.91863 51 7.91432 285.21262
1.5 11 0.76 5.1 0.23 1.5 0.15 1.0 0.36 0.80 0.9 1.0 0.71 0.82 0.49 0.56 2.0 5.5 3.0 8.3 0.34 2.8 0.52 3.3 0.43 2.7 0.13 0.83 0.11 0.66 0.64 2.8 0.4 1.8 0.45 2.9 0.81 5.3 0.51 3.4 0.38 2.5 0.12 0.8 7.04 19.4 4.6 8.8 2.7 5.2 0.32 0.61
”total column density in units of loz1 cm-’
bimprovement in x2 over the single-component power law model
Cunabsorbed flux in the 0.3-10 keV band in units of 10-l’ erg cm-2 s-l
dunabsorbed luminosity in the 0.3-10 keV band, using the distances erg s-l
eabsorption level frozen at Galactic level
quoted in Table 1, in units of
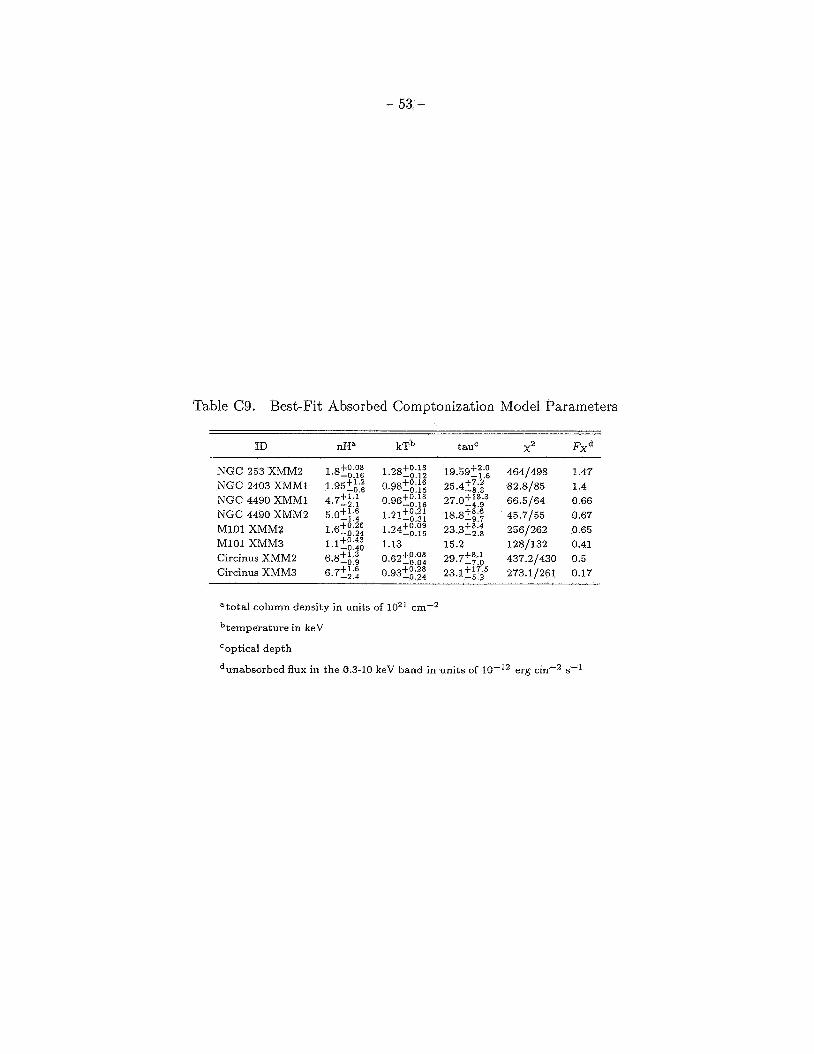
- 53 -
Table C9. Best-Fit Absorbed Comptonization Model Parameters
ID nHa kTb tauC X2 FX
NGC 2403 XMMl 1.95-, $1.2 0.9820,':2 25.42i.i 82.8185 1.4 NGC 253 XMM2 1.8200,:~ 1.2820, 19.59+_::: 4641498 1.47
NGC 4490 XMMl 4 .7 t i 0.96tE.:; 27.O+i8i3 66.5164 0.66 NGC 4490 XMM2 5.02; ; 1.21t0.21 -o.31 l8.82::6, 45.7155 0.67 MlOl XMM2 1.6t::i; 1.242",9: 23.32:'; 2561262 0.65 MlOl XMM3 l.lt",;i 1.13 15.2 1281132 0.41 Circinus XMM2 6.82::; 0.62200'0,: 29.728,,; 437.21430 0.5 Circinus XMM3 6.72;'; 0.932",.",: 23.l?i7i5 273.11261 0.17
=total column density in units of 1021 cm-2
btemperature in keV
Coptical depth
dunabsorbed flux in the 0.3-10 keV band in units of erg cm-2 s-l
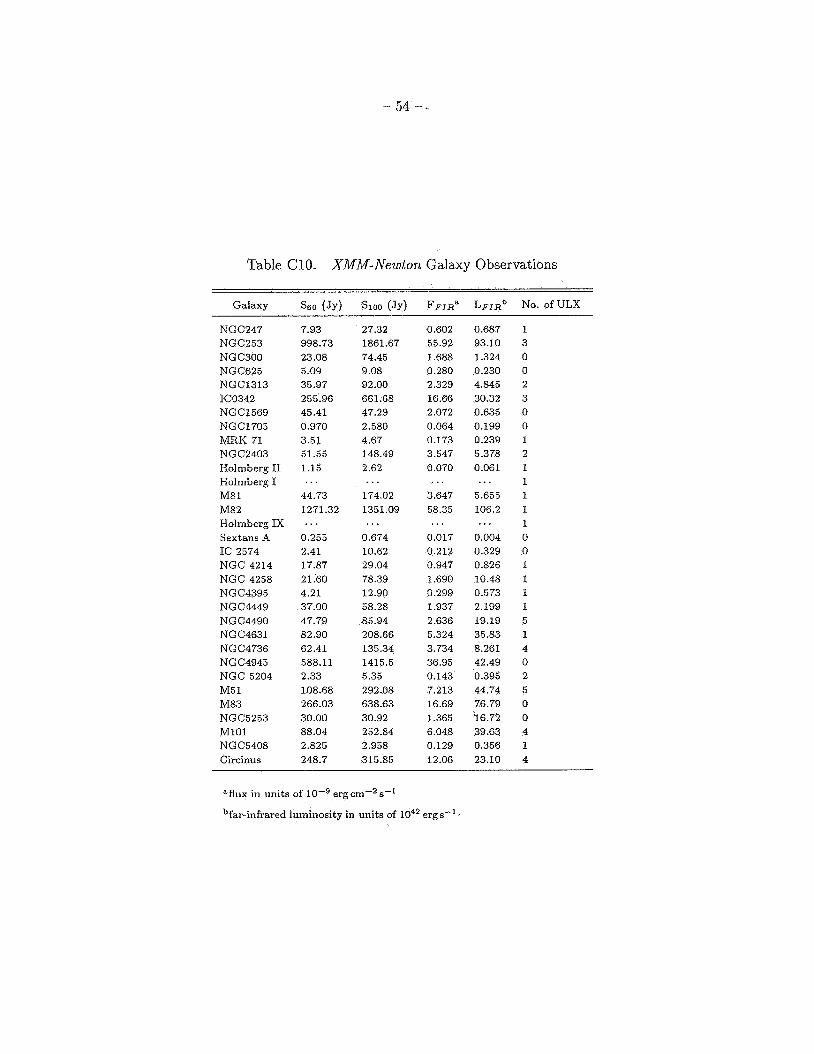
- 54 - -
Table C10. XMM-Newton Galaxy Observations
Galaxy s60 (Jy) Sloe (Jy) F F I R ~ L F I R ~ No. of ULX
NGC247 NGC253 NGC3OO NGC625 NGC1313 IC0342 NGC 1569 NGC1705 MRK 71 NGC2403 Holmberg I1 Holmberg I M8 1 M82 Holmberg IX Sextans A IC 2574 NGC 4214 NGC 4258 NGC4395 NGC4449 NGC4490 NGC4631 NGC4736 NGC4945 NGC 5204 M51 M83 NGC5253 MI01 NGC5408 Circinus
7.93 998.73 23.08 5.09 35.97 255.96 45.41 0.970 3.51 51.55 1.15
44.73 1271.32
...
... 0.255 2.41 17.87 21.60 4.21 37.00 47.79 82.90 62.41 588.11 2.33 108.68 266.03 30.00 88.04 2.825 248.7
27.32 1861.67 74.45 9.08 92.00 661.68 47.29 2.580 4.67 148.49 2.62 ...
174.02 1351.09 ...
0.674 10.62 29.04 78.39 12.90 58.28 85.94 208.66 135.34 1415.5 5.35 292.08 638.63 30.92 252.84 2.958 315.85
0.602 0.687 55.92 93.10 1.688 1.324 0.280 0.230 2.329 4.845 16.66 30.32 2.072 0.635 0.064 0.199 0.173 0.239 3.547 5.378 0.070 0.061 ... ...
3.647 5.655 58.35 106.2 ... ...
0.017 0.004 0.212 0.329 0.947 0.826 1.690 10.48 0.299 0.573 1.937 2.199 2.636 19.19 5.324 35.83 3.734 8.261 36.95 42.49 0.143 0.395 7.213 44.74 16.69 76.79 1.365 16.72 6.048 39.63 0.129 0.356 12.06 23.10
“flux in units of ergcm-2 spl
bfar-infrared luminosity in units of ergs-’ 2
1 3 0 0 2 3 0 0 1 2 1 1 1 1 1 0 0 1 1 1 1 5 1 4 0 2 5 0 0 4 1 4