archeologia e calcolatori 22, 2011, 337-363 · archeologia e calcolatori 22, 2011, 337-363 gis...
TRANSCRIPT
337
Archeologia e Calcolatori22, 2011, 337-363
GIS APPLICATIONS IN ARCHAEOLOGY
1. Introduction
The term GIS has appeared frequently in archaeological studies since the 1980s, even if already in the 1970s scientific studies had been conducted on computer applications, statistic and cartographic applications in the archaeo-logical field, which were somehow referable to GIS technologies. The first applications, were developed mostly in North America and referred mainly to the modeling of surfaces related to materials of archaeological interest, through various types of polynomial functions, and the production of DEMs and digital thematic maps of archaeological sites or excavation areas.
GIS applications in archaeology started to spread in Europe only ten years later, in the early 1990s, and are mostly related to Cultural Resource Management (CRM) which, still today, and above all in the European ambit, is the chief applicative sector. Obviously, thanks to the availability of high performance laptop computers and modern topographic instruments (total stations, GNSS receivers, laser scanners) capable of acquiring and georef-erencing data of the excavation area, GIS applications have also continued to evolve up to now; data inventory and management, once performed in a subsequent phase with respect to the excavation campaigns, are increasingly carried out simultaneously (Conolly, Lake 2006), significantly reducing the length of data processing as well as interpretation errors.
It is evident, on the other hand, how a use limited to data inventory and management, or more simply to visualization as occurred in the early years, is actually restrictive, with respect to GIS potentialities, since it is above all a spatial analysis tool supporting decision making.
This basic function of GIS can be found, instead, in the applications related to predictive location modeling of archaeological sites, which started to spread in the 1980s, above all in North America. This kind of approach is based upon GIS potentialities in terms of predictive models: i.e., the capacity to extract information and build models based on geographic data aiming at the production of predictive maps supporting archaeological surveys.
Archaeological data have a dual nature, as they are distributed both in space and time. A characteristic, common to all GIS software, is the capacity of managing multi-layer and multi-scale georefenced geographic data: this potential makes GIS applications ideal for managing archaeological data. Given the nature of most archaeological data, GIS technology is probably the most flexible and complete system for analyzing the spatial context of historical and pre-historical data.

A. Scianna, B. Villa
338
Archaeology is based on the study of man in the past through mate-rial and traces which have come down to us. Analysis focuses upon objects, but what we want to know and to explain is man’s behavior, and the reason why things happened. Given this premise, it is clear that the first important difference between a conventional GIS and an archaeological one lies in their objectives: a public administration, or even a company, usually create an information system to manage current situations, or to forecast future scenarios, for making decisions; in an archaeological project above all GIS is used for explaining past situations.
In this sense, two approach issues can be identified: the different educa-tional background of researchers with respect to the interdisciplinary level of teams; the profound lack of homogeneity between the actual archaeological methodological premises and the implementation of computer procedures consistent with mathematical logics.
As for spatial analysis, the European approach has been mostly focused on the Landscape Archaeology tradition. Landscape Archaeology is an intellectual tradition, founded by W.H. Hoskins, that stems from 18th century Romanticism. This tradition differs from the spatial statistics tradition in its concentration on extracting a cultural meaning from different landscape elements and their spatial relations (Harris, Lock 1996). In other words this tradition not only produces a spatial structure of archaeological features, but it also relates it with a social, economic or political model in order to build a theory.
A different attitude, directed to the construction of a different relation between archaeological culture and information technology, on the other hand, was responsible for the creation of various GIS versions: from the now well established Temporal GIS (TGIS), aiming at including time as the fourth variable to add to the spatial ones (x, y, z), to the innovative Object-Oriented GIS (OOGIS).
Virtual GIS (VGIS), developed with virtual reality techniques, aims at a cognitive path where the traditional archaeological reality is not presented in static form, but is experienced in full immersion through various navigation types, sensorial or software based.
While the above-mentioned applications represent an innovative and original model for the visualization and formalization of information, other solutions seem to address more specifically the use of GIS as a helping tool in data interpretation, and namely the reconstruction of a man-environment integration. This is the objective of the visibility, inter-visibility and cost-surface analyses, up to new applications including movement, visual perception and a sort of sensorial interaction within the man-environment interaction.
In conclusion, today the use of applications on mobile devices, such as Smartphones or palmtop computers (GPS/GIS or Mobile GIS) is becoming more and more important; this development, as a consequence, has involved

GIS applications in archaeology
339
the archaeological sector also, in which they are essential for on-site data storage and management of surveyed data.
In order to increase communication in this sector, which has up to now been limited to the definition of projects and results and never directly to data, various experimental research projects have been started, aiming at the integration of GIS within the web. With WebGIS, GIS applications, tra-ditionally developed for stand-alone users or within LAN environment, may be implemented on map-servers, enabling interaction through the Internet with cartography and its associated data.
Moreover it should be mentioned that GIS also shows critical aspects, mostly related to the fact that, in spite of all the efforts of the international scientific community1, it has not been possible yet to solve the problem of a unique standard format allowing a full data interoperability.
2. Data acquisition
Data populating an archaeological GIS do not substantially differ from the ones of a generic GIS and may be divided into tabular and spatial data (Fig. 1).
1 On this issue, it is worth mentioning the INSPIRE (Infrastructure for Spatial Information in Europe) project, drawn up by the European Commission in 2007.
Fig. 1 – Archaeological GIS data.

A. Scianna, B. Villa
340
Alpha-numeric tabular data are organized in GIS with the relational model: the most used GIS software packages have a relational DBMS inside or make use of an external software (MySQL, PostgreSQL, Oracle, SQL Server, etc.). A more sophisticated model of database, subsequent to the relational one, is object-oriented. Object-Oriented (OO) databases share some princi-ples of OO languages, such as, for instance, Java. OO databases, grounding on OO-GIS, are based upon data aggregation and functioning in structures named, exactly, objects. OO-GIS represents the experimental application in archaeological research of a model, the object-based one, born as a concep-tual development of databases. This model aims at pointing out physical or logical values defined by a set of features and behavior rules expressing its state, both dynamic and static.
It should be pointed out that relational databases and OO are not (to-day) in competition with each other, both for the by now dominant position of the relational model, and above all, for the object-based approach which is useless in applications managing large quantities of non complex data.
Spatial data are all those data to which it is possible to associate a ref-erence system. There are a lot of systems and methods for the acquisition of spatial data which use the typical geomatics methods and instruments such as:– Remote Sensing techniques (digital images obtained through airborne and satellite sensors);– Topographic techniques (total stations and digital levels);– Photogrammetric techniques (analogical and digital images produced by aerial and terrestrial cameras);– GPS techniques;– Aerial and terrestrial laser-scanning techniques.
An additional classification of GIS data is the traditional one, dividing data according to raster and vector format. In general in GIS applications, and therefore also in the archaeological sector, the two data formats show strengths and weaknesses, briefly illustrated in Table 1:
Features Strengths Weaknesses
Raster format
It is preferable for modeling values which continuously vary within the territory.
Essential for 3D modeling and for Map Algebra.
Large amount of computer memory required.Images blur at zoom increase.
Vector format
It is preferable for modeling discrete values. Classic primitives of this model are: points, polylines and polygons.
Small amount of computer memory required. It is not influenced by zooming. It is at the basis of GIS topological rules.
It is not suited for modeling values such as elevation, water depth, temperature, rainfall, continuously varying upon earth surface.
Tab. 1 – Characteristics of data formats for archaeological GIS.
GIS applications in archaeology
341
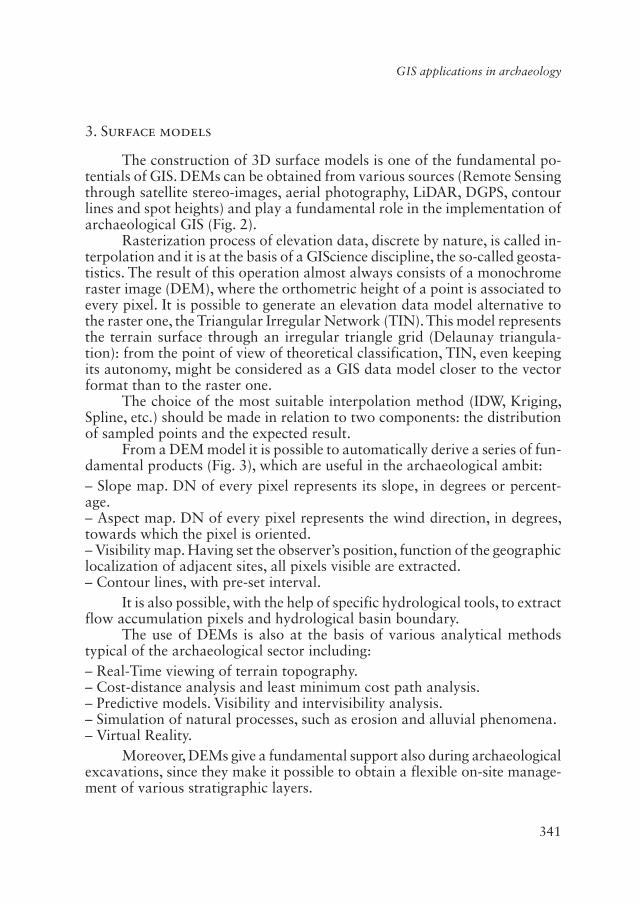
3. Surface models
The construction of 3D surface models is one of the fundamental po-tentials of GIS. DEMs can be obtained from various sources (Remote Sensing through satellite stereo-images, aerial photography, LiDAR, DGPS, contour lines and spot heights) and play a fundamental role in the implementation of archaeological GIS (Fig. 2).
Rasterization process of elevation data, discrete by nature, is called in-terpolation and it is at the basis of a GIScience discipline, the so-called geosta-tistics. The result of this operation almost always consists of a monochrome raster image (DEM), where the orthometric height of a point is associated to every pixel. It is possible to generate an elevation data model alternative to the raster one, the Triangular Irregular Network (TIN). This model represents the terrain surface through an irregular triangle grid (Delaunay triangula-tion): from the point of view of theoretical classification, TIN, even keeping its autonomy, might be considered as a GIS data model closer to the vector format than to the raster one.
The choice of the most suitable interpolation method (IDW, Kriging, Spline, etc.) should be made in relation to two components: the distribution of sampled points and the expected result.
From a DEM model it is possible to automatically derive a series of fun-damental products (Fig. 3), which are useful in the archaeological ambit:– Slope map. DN of every pixel represents its slope, in degrees or percent-age.– Aspect map. DN of every pixel represents the wind direction, in degrees, towards which the pixel is oriented.– Visibility map. Having set the observer’s position, function of the geographic localization of adjacent sites, all pixels visible are extracted.– Contour lines, with pre-set interval.
It is also possible, with the help of specific hydrological tools, to extract flow accumulation pixels and hydrological basin boundary.
The use of DEMs is also at the basis of various analytical methods typical of the archaeological sector including:– Real-Time viewing of terrain topography.– Cost-distance analysis and least minimum cost path analysis.– Predictive models. Visibility and intervisibility analysis. – Simulation of natural processes, such as erosion and alluvial phenomena.– Virtual Reality.
Moreover, DEMs give a fundamental support also during archaeological excavations, since they make it possible to obtain a flexible on-site manage-ment of various stratigraphic layers.

A. Scianna, B. Villa
342
Fig. 2 – Data types for DEMs production.
Fig. 3 – DEMs products.
4. GIS applications in CRM
In the CRM sector, the use of GIS is mostly related to the need for man-aging huge quantities of (graphic and alphanumeric) data. The first step in GIS exploitation has certainly been to convert information from the analog format to the digital one, in order to substitute and improve operations and procedures which were often carried out by hand. At first, GIS were used as tools for re-cording and storing information and the sole implemented tools were limited to the visualization of data and to the production of thematic maps.
In CRM the capability of GIS to record, manipulate and analyze re-markable amounts of geographic and environmental variables, through the algebraic superimposition of thematic maps, appears to be of immediate and extraordinary interest. A first substantial field of application was the integration of archaeological information in urban planning. In this sector, predictive simulations, based on the construction of settlement patterns, can play a significant role (Kvamme 1997); although such an approach is partly conditioned by a determinism of an environmental kind, due to its bias towards geographic variable analysis with respect to cultural ones, we must admit that GIS might be of great usefulness in defining predictive models. Therefore, the use of spatial technologies has opened new scenarios in the conservation and protection of historical-archaeological heritage.

GIS applications in archaeology
343
Yet another, different direction in the use of this technology could be taken if GIS were not considered as neutral techniques, viz. simple physical interpreters. Some authors (i.e. Harris, Lock 1996) claim that GIS are not impartial tools: they represent the social reproduction of knowledge and, in this sense, the development of the methodology cannot be divided by the progress of theory necessarily grounding it. Other researchers (i.e. Wheat-ley 1993) did stress a reconsideration of the profound effects which would be produced by the creation and the use of GIS, from the point of view of methodology, research and eventually of archaeological theory itself. After an initial phase, mostly devoted to the creation of applications, we witness today a phase of reflection and maturation stemming from the need for a profound understanding of the relation between GIS and archaeological theory. GIS are certainly a spatial information science and their broad utilization, even in regional planning, impose on archaeologists a new awareness of the potential of information technology tools. Computational methods offer, today, the opportunity of thinking of preservation activity not only as a simple defense of the asset, but rather as an exploitation and dynamic integration of the archaeological heritage in the urban and landscape fabric.
5. Spatial analysis
Archaeological field surveys may be divided into two fundamental types: sampling and prospection. As for the first type, an archeological sampling is carried out if excavations have been conducted in accordance with a specific sampling design. This strategy is mostly adopted when the study area is so large that it cannot be totally investigated. Therefore, sampling strategies stem from the need to maximize inferable information from excavation campaigns, minimizing at the same time the costs of surveys. This need (efficiency crite-rion) comes together with the wish to dispose of a representative sample of the studied population (totality criterion).
As for the second type of survey, a survey carried out with a pre-de-termined objective such as, for instance, the identification of a specific type of site is called archeological prospection. With respect to the archaeologi-cal prospection, the efficiency criterion is still in force, meaning that costs minimization (time, resources, labor) remains an objective to pursue. On the other hand, totality criterion becomes a negligible one. It is not necessary to dispose of a representative sample but rather to obtain, with the minimum effort, the best possible examples for the research in course.
While there exists a vast literature on archeological sampling proce-dures (for instance, Heizer, Graham 1967; Mueller 1974; Watson et al. 1971), archaeological prospection has been, except for some rare exceptions (Zubrow, Harbaugh 1978), almost totally ignored by specialists. The class

A. Scianna, B. Villa
344
of statistical predictive models for detection of archaeological sites also be-longs to the tradition of archaeological prospection techniques. It is, as we will see later, a very important branch which will surely develop in the field of archaeological research. These models find their natural application in the implementation of GIS.
Predictive models are formulations which may be either deductive or in-ductive, set up with the objective of predicting unknown events. Specifically for archaeological studies, it is essential to predict site location. In fact, only a small part of existing sites has been discovered, while a huge quantity of sites in the world are destroyed every year to make room for the development of modern settlements. One of the means for promoting knowledge and for protecting sites at risk, is the building of formal models capable of predicting the probable loca-tion of sites. For this purpose deductive models may be used, deriving directly from theory, or inductive models. These latter lie basically upon the study of some regularities, detected within a complex of empirical observations. This study is carried out in such a way as to obtain indications about the archaeological characteristics of zones which have not been directly observed.
In practical applications, however, both theory and empirical observa-tions are needed. For instance, predictive models for detection of archaeologi-cal sites may be developed by using a deductive approach mostly taking into account the cultural and biological needs of a society. These needs might direct the choice of independent variables thus leading to the construction of models which do not need information about the geographic position of sites.
However, these models cannot be implemented or tested without em-pirical observations. At the same time, a purely inductive localization schema might be built for archaeological sites, but, without a theoretical support, the selection process of variables becomes ineffective and the estimated model is weak and not easily interpretable.
Predictive models have only recently spread as a fundamental compo-nent of archaeological research (Kohler, Parker 1986; Arbia, Espa 1996, 1997). One of the reasons for the success of this class of models is due to the fact that archaeological sites tend to appear in environments with favorable conditions. Predictive models take advantage of this type of information and, exploiting the differences among the environmental features of those areas where sites exist or do not exist, help researchers in identifying areas with a high probability of discovering an archaeological site (Warren 1990).
One of the most common empirical approaches to predictive modeling is the integrated strategy defined by Kvamme (1983, 1989), later improved and refined by him (Kvamme 1992; Stancic, Kvamme 1999) and used by many other researchers (i.e. Warren et al. 1987; Warren 1990). In a nutshell, this strategy integrates the enormous GIS potential in generating and processing large data amounts with logistic regression, which is a classic and flexible
GIS applications in archaeology
345
statistical tool enabling us to predict the probability that an archaeological site exists within a certain area.
The primary potential of GIScience tools consists in fact in the capabil-ity of extracting information from data, and in performing spatial analyses and predictive models.
5.1 Construction of spatial database. Spatial and attribute queries
A real problem in GIS application for archaeology is the construction of the geospatial database that differs greatly according to the different goals that have been set. Depending on the data that must be used for predictive analysis, excavation documentation or 3D visualization, the structure and the complexity of the geospatial database will differ. These problems are connected both to the heterogeneous nature of data (vector or raster) and the complex-ity of the situation to describe and these two aspects make the construction of the geospatial database structure increasingly complex. In relation to the complexity of the situation to describe, a typical example is the description of a room covered by partially existing mosaics on the walls and floor and some objects with very complex forms (vases, statues, etc.). In this case we have:– not always regular surfaces (walls, ceiling, floor) with ragged edges that should be described through vector elements;– pictorial representation the description of which can be done by raster im-ages (that have a rectangular shape but transparent background color so as to represent areas that are not regular and with fragmented edges);– objects such as vases or statues that should be described by vector complex primitives typical of solid modelers.
This kind of complexity in the description of an archaeological scene requires the combination of different models inside one software instrument with a high level of sophistication to describe objects that are numerous and spread over a wide area.
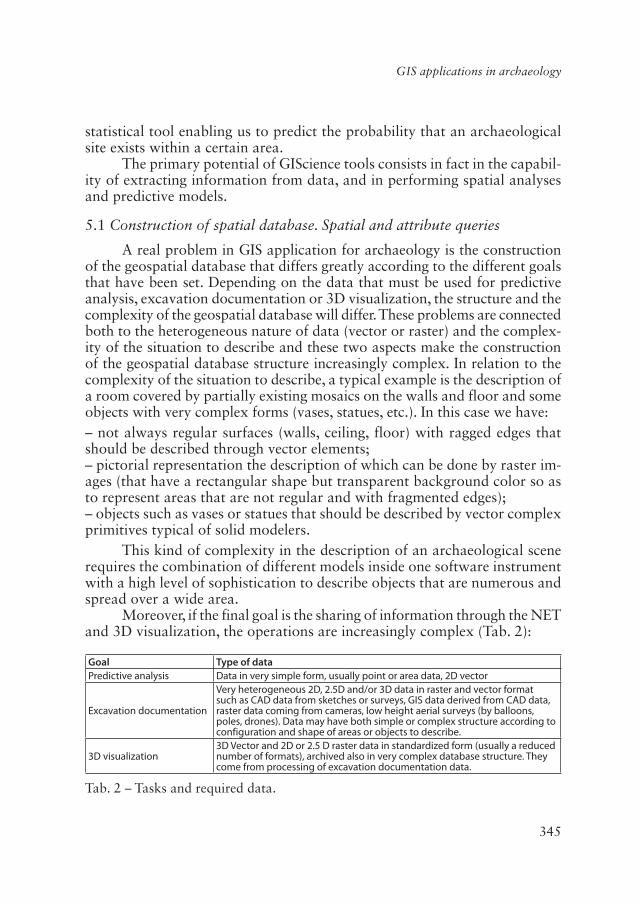
Moreover, if the final goal is the sharing of information through the NET and 3D visualization, the operations are increasingly complex (Tab. 2):
Goal Type of dataPredictive analysis Data in very simple form, usually point or area data, 2D vector
Excavation documentation
Very heterogeneous 2D, 2.5D and/or 3D data in raster and vector format such as CAD data from sketches or surveys, GIS data derived from CAD data, raster data coming from cameras, low height aerial surveys (by balloons, poles, drones). Data may have both simple or complex structure according to configuration and shape of areas or objects to describe.
3D visualization3D Vector and 2D or 2.5 D raster data in standardized form (usually a reduced number of formats), archived also in very complex database structure. They come from processing of excavation documentation data.
Tab. 2 – Tasks and required data.

A. Scianna, B. Villa
346
Most GIS software packages enable us to perform attribute queries and spatial queries (Fig. 4). Attribute queries rely upon SQL, a database computer language designed to read, modify and manage data stored within a system based on the relational model, to create and modify database layouts, to cre-ate and manage tools for data control and access.
The great merit of SQL and of the relational model consists in the pos-sibility of simultaneously extracting information from various tables.
Spatial queries exploit geometrical relations among primitives of the vector model (points, lines, polygons). The names of available functions vary from one software to another. The most common are: distance, equals, inter-sects, touches, crosses, overlaps, contains, length, area, centroid, etc.
The simplest SQL query is structured according to three core constructs: SELECT, FROM and WHERE.
As an example, Table 3 can be considered:
ID FINDS DESCRIPTION MATERIAL AGE ARCHAEOLOGIST… … … … …
255 Painted pottery Clay 3rd century BC Dr. Smith256 Coin Bronze 4th century BC Dr. Johnson… … … … …
Tab. 3 – Example of table for a query by attributes
In the table above, the field ID_FINDS is a counter, assumed as primary key: it univocally identifies the row. The query needed to extract from this table all finds by the archaeologist Smith is the following:SELECT*FROM FINDSWHERE ARCHAEOLOGIST = ‘Dr. Smith’
Fig. 4 – Query types in spatial analysis.

GIS applications in archaeology
347
Standard SQL constructs are much more numerous than the ones briefly presented here, but, in general, the language is very simple and accessible to every professional in the archaeological sector.
In any case, full management of geospatial data is possible thanks to spatial extension of relational database management software, that can be expanded with a set of functions useful to store in a compact form (usually binary) graphics data that describe spatial features, and make spatial query based on spatial index managed by these extensions.
Today spatial database managers with spatial extensions also allow us to describe 3D objects with complex forms together with their spatial and qualitative attributes. To do this it is necessary to use a solid modeler or CAD software that allows us to model a 3D scene and transfer it (with its vector objects) to the spatial GIS database. An experiment of this type was carried out in a research project called Management and use of distributed 3D data by open source Web-GIS software2 in which a part of the research activity was aimed at studying the way to write geospatial 3D objects modeled by Blender in a spatial database structure managed by PostgreSQL. Scianna and Ammoscato (2010) describe how it is possible to transfer 3D geospatial information, built by a 3D solid modeler like Blender, characterized by its own graphic primitives, to a database archive managed by Relational Da-tabase Management System like PostgresSQL with the addition of a spatial extension like PostGIS.
5.2 Statistical methods
Statistics play an important role in archeological research carried out with GIS technology. In literature, there is a great variety of statistical methods, which it is possible to divide into non-parametric and parametric methods. The first ones do not depend on the type of distribution of population and are not based upon distribution parameters, consequently it is possible to apply them also in the case of qualitative data. The parametric methods employed in solving univariate and multivariate problems have, as a limitation, the need to use very restrictive hypotheses, often unjustified if not impossible to justify, unrealistic, not always clear, not easily interpretable, or ad hoc formulated to produce inference.
It must be added to this that the assumptions validating the application of those methods (normality, homoschedasticity, independence and equal distribution of the stochastic erratic component) are hardly ever satisfied and, in those cases where they are satisfied, results are often obtained by fol-
2 This project is part of the Italian PRIN project 2007 Interoperability and cooperative management of geographic, dynamic, multidimentional and distributed data with Free and Open Source GIS, Principal Investigator Paolo Zatelli, University of Studies of Trento, Italy.
A. Scianna, B. Villa
348
lowing approximations. Parametric tests have as a common feature the fact that their object are often parametric hypotheses, viz. hypotheses related, for instance, to the parameter value of one or more populations such as mean and variance. In the first family (non parametric tests) there are: χ2 test, Mann-Whitney or Wilcoxon test and Kolmogorov-Smirnov test. The most widely used parametric test is the so called T-test.
5.3 Spatial Analysis
Spatial analysis may be considered one of the most important tools of GIScience and of GIS applications in archaeology. Many of these methods were designed by geographers in the 16th and 17th centuries, and later adapted by archaeologists, starting in the 18th century.
One of the first methods applied is linear regression. This quantitative method is used for modeling the relation between two continuous variables. The linear relation between two continuous variables may be expressed in terms of correlation: the correlation index may be positive, negative or zero and two variables are positively correlated when, if one increases the other increases too, and vice versa. Correlation analysis is a statistical method which brought about a GIS tool, called Spatial Autocorrelation. This term indicates the degree of correlation between two quantities measured at a certain dis-tance. The degree is high if two close samples show similar values, is zero if there is no spatial dependence in the variability of quantities and is negative if the two quantities are the more correlated the more distant the sampling points are. A profound knowledge of spatial autocorrelation phenomena is an important support in some modeling processes. The most diffused spatial autocorrelation index is the Moran index (1950). Most GIS software pack-ages enable us to calculate Moran index.
5.4 Cluster analysis and density analysis
Distribution of archaeological findings is often represented through punctual geometric primitives. The study of spatial distribution of these points is an important analysis and interpretation tool.
Clustering, or cluster analysis, is a complex of data multivariate analysis techniques, aiming at selecting and grouping homogeneous elements in a da-taset. All clustering techniques are based on the concept of distance between two elements. In fact, the quality of the analysis obtained through clustering algorithms actually depends on how significant the geometry is, and therefore on how the distance has been defined.
Distance is an essential concept, since clustering algorithms group ele-ments depending on their distance, therefore belonging or not belonging to a set depends on how far the analyzed element is from the set.

GIS applications in archaeology
349
Clustering techniques are mostly based upon two approaches:– Bottom-up. This approach implies that every element is considered as a standalone cluster, and then the algorithm takes care of unifying the clusters. The algorithm goes on adding elements to the cluster until it obtains a pre-set number of clusters, or until the minimum distance among clusters exceeds a certain amount.– Top-down. At the beginning, all elements are in a unique cluster and then the algorithm starts to divide the cluster in many smaller clusters. The criterion underlying the division is to try to always obtain homogeneous elements. The algorithm goes on till it achieves a preset cluster number. This approach is also named hierarchical.
Clustering techniques are generally used in case of many heterogeneous data, searching for anomalous elements. Frequently used cluster algorithms are K-Means; Fuzzy C-Means; QT Clustering. Sometimes, in the archaeological ambit, defining an object as belonging to a cluster can be difficult. In these situations, the problem might be solved through an intensity analysis.
The most widely used density models in archaeology are the Naive Estimator (Fotheringam et al. 2000) and the KDE (Kernel Density Estima-tion). Kernel density is placed within the family of the point pattern analysis. These latter are spatial analysis techniques carried out from sources of point vector data, generating images classified according to associated numerical attributes. Starting from Tobler’s first law of geography (1970): «All things are related, but nearby things are more related than distant things», Bayley and Gatrell (1995) developed a series of spatial analysis techniques, mostly applied in epidemiologic surveys.
With respect to classical statistical approaches, data georeferencing is needed, considering events as spatial occurrences of the examined phenom-enon. Unlike the simple density function, KDE considers a mobile 3D surface weighing events depending on their distance from the point where density is estimated (Gatrell et al. 1996).
The most commonly used GIS software packages are equipped with various density estimators.
5.5 Predictive modeling
Predictive models enable us to predict the value of a dependent variable (or its occurrence probability), function of one or more independent variables. Predictive models are divided into inductive models and deductive models. The first ones depend on a database of more or less certain input data; therefore errors in the database may generate errors in the predictive model. Deductive models are based instead on an initial theoretical basis.

A. Scianna, B. Villa
350
From the point of view of the development of models, there is the “nu-merical” and the “weighed” approach. Numerical approach uses statistical techniques to identify possible associations among archaeological sites and specific features of the surrounding physical environment. In the numerical approach all variables used in the generation of the model concur with the same weight to the potential site location. The weighed approach starts from the assumption that all variables contribute with different weights to the detection of the potential site location.
The development of a predictive model entails the preliminary analysis of the representativeness of the variables, of the database quality and of the model representation scale. The production stages of a predictive model are normally three: the first stage concerns the development of base hypotheses as well as the data acquisition and organization. The second consists of the development of the model and of its initial testing. The last stage consists of continuous applications of the model and of the ongoing tuning.
Interesting applications of predictive models may be seen in the websites of the following research projects: Minnesota Archaeological Predictive Model (http://www.dot.state.mn.us/mnmodel/) and North Carolina GIS Archaeologi-cal Predictive Model Project (http://www.informatics.org/ncdot/).
5.6 Map algebra
Another important analysis tool is Map Algebra, which enables us to combine mathematically different raster layers. Map Algebra modules have different capabilities, permitting three different groups of operations:– arithmetic capability of modifying values of data attributes by means of a constant (for instance, an arithmetic scale);– mathematical capability of transforming values of data attributes by means of standard operations (for instance, a trigonometric function);– mathematical capability of combining (i.e. adding, subtracting, multiplying or dividing) various layers to obtain a single raster image.
The most typical example of Map Algebra applications is the calcula-tion of the Normalized Difference Vegetation Index (NDVI), an important vegetation index which may be obtained by Remote Sensing sensors with one near infrared channel. NDVI can be calculated by:
����
��������
�
�� (Eq. 1)
Input layers in Map Algebra equations must be characterized by the same geometrical resolution and by the same reference system.
An application related to NDVI and PCA was carried out in the Isles of Coll and Tiree, the most westerly of the Hebrides Islands (Scotland), using the
GIS applications in archaeology
351
Airborne Thematic Mapper (ATM) sensor. Visible, infrared and thermal infrared images processing made it possible to identify some areas charac-terized by anomalies referable to potential buried archaeological structures (Winterbottom, Dawson 2005).
6. WebGIS
In the archaeological field, the use of multimedia and the Internet has been considered, since their creation and diffusion, more for their didactic potential, and as byproducts of a research project rather than as a real and ef-fective research tool. The first exceptions are to be seen in the web publication of specialized databases, followed by the first archaeological GIS projects. The WebGIS applications in the archaeological field are mostly related to CRM. Projects with this objective are always growing, and they tackle the issue of cultural heritage management under different perspectives, both from the point of view of methodology and content as well as from the technological one. Among the most interesting international projects it is worth mention-ing the Digital Crete (http://digitalcrete.ims.forth.gr/) project about the ar-chaeological heritage of the Island of Crete; The archaeological Web-GIS of Iowa (http://www2.uiowa.edu/i-sites/public.htm); and MAGIS, an archive of archaeological projects within the Mediterranean area carried out by a consortium of American universities (http://cgma.depauw.edu/MAGIS/).
Fig. 8 shows the data flow, starting with the survey of an archaeological site and ending with information sharing through the Internet3. Data collected on site, after a first local pre-processing are transmitted to the headquarters of the archaeologist where data can be processed and/or analyzed and made available on the NET.
At this point all other archaeologists can browse that data comparing them with data they just surveyed, in order to facilitate considerations about similarities of findings, etc. This is an advanced way to operate that today is already possible. But in order to do this, we require some techniques and methodologies emerging from the latest evolution of computer science for information sharing.
In particular, information can be shared through Internet thanks to a SOA (Service-Oriented Architecture), i.e. a set of principles and methodologies for designing and developing software in the form of interoperable services (http://en.wikipedia.org/wiki/ Service-oriented_architecture). One of the SOA elements are web services by which data can be accessed from Internet, and query the database with standard calls. Therefore, the aspect of standardiza-
3 FIRB Project 2005 – Research Unit at Department of Representation, University of Pa-lermo, Italy.

A. Scianna, B. Villa
352
tion of archaeology information is the basis for granting information sharing through Internet by web services.
Today geospatial data are shared through Internet thanks to standardized web services proposed by Open Geospatial Consortium (OGC WFS/WMS), suitable for the sharing of vector 2D information and raster 2D information. In the previously cited PRIN 2007 project it is shown how it is possible also to access to 3D vector data using web service WFS-like something that could be called 3D-WFS.
7. Virtual Reality
The utility of GIS can be observed also in the field of Virtual Reality (VR) applied to archaeology. In this sector the objective of researchers is to create 3D historical-archaeological environments where the spatial component of data is maintained.
In the case of the Geospatial Virtual Reality, each monument is ac-curately reproduced from survey data and each landscape is generated on the basis of the geographical data constituting it. In a VR application the starting data, which often require a large amount of computer memory, are dynamically managed by the computer in a rapid way by means of specific optimization techniques. These techniques obtain their best results when 3D data are used by the web.
Virtual 3D musealization applications are particularly interesting: in some of these cases the user has the possibility of interacting with the 3D model of the monument or of the whole site. The most diffused languages in this sector are VRML, X3D, Java 3D and QuickTime. In these systems, possible user queries are often rather restrictive.
In the future an increasingly broad use of various types of collaborative network based tools may be expected. It is worth mentioning, as an example, the Google Earth system, which has been following this direction for some time.
In recent years two important virtual reconstruction projects applied to archaeology have been developed in Italy: the Virtual Museum of the Ancient Via Flaminia project (http://www.vhlab.itabc.cnr.it/flaminia/) and the Virtual Rome project (http://3d.cineca.it/storage/demo_vrome/htdocs/). The first of these presents two aspects of primary methodological importance: the use of specific models of spatial archaeology making the visual experience im-mersive and the creation of an operating chain based upon an open source architecture, as for the GIS process directed to web fruition (Calori et al. 2006; Camporesi et al. 2007). The Virtual Rome project has the objective of studying and reproducing the ancient Roman landscape and visualizing it by means of Internet dedicated virtual reality tools based upon open source libraries (Pescarin et al. 2008).

GIS applications in archaeology
353
Another VR project is The Virtual Museum of Iraq, promoted by the CNR and the Italian Ministry of Foreign Affairs (http://www.virtualmuseumi-raq.cnr.it/). While awaiting a return to normality, the Virtual Museum gathers and exhibits finds that are still available as well as lost ones. Thanks to VR it is possible to make a tour of the great civilizations of the past, as attested to by these precious objects.
8. GPS/GIS and mobile applications
GPS, above all in its more advanced form, viz. integrated with a Personal Data Assistant (PDA) and endowed with a suitable GIS and DBMS software, is a tool permitting the systematic application of research strategies and meth-odologies, which have been developed in the past and rarely applied due to the excessive amount of time required by topographical operations.
The contribution of mobile GIS systems goes beyond the expected horizon. In the last fifteen years we have seen the progressive transferring of archaeological information in increasingly reliable, complex and integrated GIS and digital databases. Many archaeologists claim that personal computers and Information Technology significantly changed laboratory and field work. It must be said however, that this change is only partial and not yet concluded.
Without any doubt, the advent of GPS is one of the significant innova-tions in field data acquisition. Up until a few years ago, the situation, in terms of access and management of geographic information directly on the field, seemed to have reached a stalemate. A first concrete change corresponds to the diffusion, in GIS, of PDA devices. Mobile GIS connected to the map servers eventually made it possible to solve, or at least to limit, the critical fracture existing between laboratory and field activities, by making available, on the field, the same quantity and quality of information formerly accessible only on desktop PC or map server.
Geographic positioning of data through standardized processes, such as quick georeferencing, topographic and photogrammetric surveys, is a central activity for many steps in the archaeological process. In this process, GPS, in an absolute or (increasingly often) differential positioning (DGPS), is the most commonly used surveying tool, thanks to its extreme flexibility with respect to many old and new methodological needs.
In archeology, there are operations requiring different levels of accuracy. If, on one hand, metric accuracy is acceptable, for instance for mapping surveys at the scale of 1:5,000, the positioning of shovel-test, test-pit, squares-survey or geophysical measurements require, on the other hand, submetric precision, becoming centimetric in case of GCPs survey, large scale mapping, etc.
GPS permanent station networks for Real Time Kinematic (RTK) are a system that can enable every archaeologist, equipped with a suitable GPS

A. Scianna, B. Villa
354
receiver, to work with metrical accuracy without use of other GPS reference stations, located at points having a known position. This framework is based on the acquisition and RT processing of the observations from each permanent station by the data control and processing network centre, which are then able to broadcast the carrier-phase corrections to any connected user4.
The foremost limitation of current GPS networks is found in the base-line length, which is not always short enough to obtain sufficient precision in connection through GSM or GPRS line. Reference stations are usually positioned in provincial capitals and enable centimetric precision within a range below 30 km.
The need to have georeferenced photographic archives, not only in ar-chaeology, can be found in some new products of recent years, namely, digital cameras with integrated GPS, or capable of Wi-fi connection with compat-ible GPS. The introduction of both these technological solutions permits the automatic association of each photograph with the coordinates x, y, z of the exposure station. Many GIS mobile software packages, for example, focus on photos georeferencing through specific functions, both for connecting mobile GIS to the camera and to create and manage hyperlinks.
At present, in archaeology, DGPS is used, both with single frequency and dual frequency receivers, for georeferencing of geophysical measurements and satellite or airborne digital images, for surveying GCPs and in some cases for generating micro-DEMs through RTK techniques.
PDA makes all geographic information (topographic and thematic base map, digital orthophotos, geophysical data) available in the field as well as an alphanumerical database, usually available only in laboratories. Along with the advantages constituted by field consultation and updating of archives, these tools and their relevant GIS software are preset to be connected to various devices, among which GPS receivers, thus permitting the background visualization of geographic information with the real time operator position in overlay.
With regard to this application, the Pocket Archeonav project is par-ticularly interesting (Scianna et al. 2005). It is a standalone application on PDA, exploiting the capability of performing an absolute GPS positioning to
4 A Virtual Reference Station (VRS) is an imaginary, unoccupied reference station which is only a few meters from the RTK user. For this position, observation data are created from the data of surrounding reference stations as though they had been observed on that position by a GPS receiver. A Multi Reference Station (MRS) RTK is a complex, yet natural extension of single reference station RTK. It provides better protection against station outages because a network solution can still be calculated even if individual reference station data is missing. However, due to the current trend of sparse network station spacing, the absence of any individual reference station would likely cause pockets within the network with less than desirable performance. Even under these conditions, the network solution is still more likely to provide a solution better than that from a single reference station.

GIS applications in archaeology
355
correct the coordinates by means of an EGNOS differential correction and, therefore, to locate the areas of interest of an opencast archaeological site and to support visitors with multimedia descriptions (audio, films, etc.). Fig. 5 shows the Pocket Archeonav PDA software during experimentation in the archaeological site of Solunto (Italy).
The evolution in computer science technology has brought many inno-vations in the development of GIS-WebGIS, multimedia, 3D and navigation software applications and this evolution continues.
These innovations are at the basis of some activities carried out at the GISLAB (CNR-UNIPA cooperation) of the University of Palermo. Keywords of this evolution are GML, Geospatial WebServices, together with some instru-ments and techniques such as OOP, Visual Rapid Application Development Systems with some SDK (software development toolkit) for management of spatial information.
One example is the evolution of a multimedia guide for the archaeological site of Solunto in Sicily (Figs. 5-6) to which some innovations have been applied. The application started as a stand-alone software using and processing data inside the pocket PC on which it runs. Functions of the application were based
Figs. 5-6 – 5. Pocket ArcheoNAV, a first version of multimedia guide; 6. The evolution of multi-media guide.
5 6

A. Scianna, B. Villa
356
Fig. 7 – Map tiling to make application per-forms better when downloading raster data from Internet.
on a simple GIS SDK with which it is possible to combine both raster and vector data. No web service call possibility or NET oriented use has been planned. The functions for supporting GPS receiver have also been built from scratch.
The new version, even as it functions today as stand-alone software, is very different as it is based on SDK and on techniques that should permit the access to web remote information deployed through OGC standard web services and the application access to a local web service that makes available the geospatial and multimedia data necessary for navigation in the archaeo-logical site. This is a significant evolution with respect to the first version which was conceived only four years ago and with this application, even an Internet access is not required for many reasons (difficulty of setting up a proper network infrastructure in a wide area not always well maintained with limited plants such as an electrical grid, not fully controlled in terms of access by people).
The need to get information from the Internet in a fluid and progressive way brings us to structure information using some useful techniques such as that adopted for raster data shown in Fig. 7 (map tiling). In the first version of multimedia guide, background raster map was loaded for opening the application while in the second version, a map is divided in many tiles that are progressively loaded (when moving map function is on) just before it
GIS applications in archaeology
357
must be viewed on the screen as soon as the visitor is in an area covered by a specific tile. This feature makes the application ready for Internet as loading a big map from Internet requires too long a time and could compromise the functionality of the application, so that it is preferable to download map tiles on demand for the multimedia application.
9. The last frontier: 3D GIS, TGIS and FGIS
Archaeological data are, by nature, tridimensional. When talking about 3D GIS, we should single out its various components: original datum, visu-alization and consultation.
At the international level several models of advanced 3D numeric car-tography (City GML) have been proposed, which are capable of supporting both the 3D component and various detail levels, a function of the scale used for dealing with the objects. There have been many international attempts and studies aimed at identifying a 3D topological structure of cartographic data.
The CityGML model can also be used in the archaeological field. This standard is an interesting cartographic model, oriented towards the represen-tation of 3D urban objects, developed in Germany by a consortium of public and private companies. CityGML is an open data model, based on the XML language, for exchanging 3D information and carrying out complex analyses needed by different applications (such as disaster simulations, service man-agement, etc.). CityGML represents an applicative profile of GML3, which codifies a multi-layer representation of towns using information layers such as vegetation, height, buildings, and others. Its primary features are:– use of different level of details (LOD);– definition of classes and relations among them with respect to the most significant geographic objects (both urban and regional), with particular at-tention directed to their geometrical, topological, semantic and visualization features;– unification of geometrical and topological models;– definition of generalization hierarchies among thematic classes, of constraints and of spatial properties.
In the CityGML model, rules for the implementation of textured surfaces have been introduced (thus overtaking one of the limits of GML standard), aimed at producing a realistic representation of an urban model, starting from the XML standard.
Another example is that regarding the use of a 3D model based on a GML schema like CityGML, access to which is obtained by a 3D web fea-ture service (vector OGC WFS like) that allows browsing of remote 3D GIS models of a built environment.

A. Scianna, B. Villa
358
These kinds of applications open new scenarios and use cases like that illustrated in Fig. 8 in which archaeological surveyed data are coded (after the survey) according to a GIS standard model, like GIANT (Scianna et al. 2008), then sent to a web server implementing a 3D vector web service – like WFS3D (Scianna 2010) – with which the data of the archaeological site with its finds could be made available to many users in the world, and thus they could make their contributions to specific aspects and hypotheses regarding that site, its findings and similarities with other sites and findings.
Usually, GIS are time-insensitive: when describing a process they do not take into account its evolution in time and, therefore, some space-time cor-relation connections among the various spatial entities are neglected. For this reason the first studies on TGIS were carried out where the fourth dimension, viz. time, plays a crucial role. TGIS are extremely useful in the field of social sciences (evolutionist theories, settlement dynamics, etc.) and therefore in the archaeological field also.
Among the most innovative solutions presented recently, it is worth mentioning the FGIS, a system which, based on the fuzzy set theory, aims at including ambiguity in data structure. This approach starts from the simple statement that, in the process of formalization of information (both alphanu-meric or spatial), decisions made do, very often, affect final results.
Fig. 8 – Potential archeological data flow and sharing through web services.

GIS applications in archaeology
359
This attitude is even more dangerous and harmful (and therefore to be avoided) if data structure is created through a subjective path of recognition of the descriptive content of variables, Fuzzy theory, on the other hand, continu-ously suggests that, during research, decisive choices are made with respect to data formalization, yet no trace remains of these choices in the interpretative process, so that raw data and hypothetical or reproduced information become indissoluble; if the formalism used remains hidden within the computational application, the risk of overlapping between original information and sub-jectivity of interpretation grows. This makes data less reliable, and therefore not reusable for further research work. FGIS, aimed at reducing these risks, incorporates, through a fuzzification5 process, the ambiguity of data within the data structure; this phase assigns to some specific fuzzy variables (chronol-ogy, age, sex, etc.) a value ranging from 0 (absence) to 1 (certain presence); intermediate values may be included to express a statistical probability index related to reading hypotheses.
10. Integration between Remote Sensing and GIS
The diffusion of Remote Sensing and GIS in archaeological applica-tions has considerably increased in recent years. Very often, there have been applications where both techniques have been used in an integrated way; but there can be very different types of integration, with respect to the different objectives of the project being conducted.
The most frequent case is that in which Remote Sensing techniques supply various kinds of data (physical, environmental, cartographic, an-thropic, etc.) related to the archaeological site; then these data are organized by GIS into thematic layers to be visualized, processed and analyzed. Remote Sensing imagery also provides a backdrop for the following GIS operations. Furthermore, Remote Sensing, as an important source of recent information, provides a means of updating GIS.
GIS hardly ever intervene in the initial phases, giving the Remote Sens-ing specialists a series of targeted pieces of information for better addressing an archaeological survey campaign, limiting the study area to a smaller one, or selecting only some parameters to define; in fact, planning for acquisition of remotely sensed data requires an accurate planimetric base representation for the region of interest that GIS can offer. In other cases, Remote Sensing and GIS can work in analysis operations together, obviously supposing that both techniques share data structure and format.
5 The fuzzification comprises the process of transforming crisp values into grades of mem-bership for linguistic terms of fuzzy set (Coppi et al. 2006).

A. Scianna, B. Villa
360
Both integration modes obviously entail a full compatibility among respective data; this is a condition which can hardly be satisfied without the introduction of adequate algorithms permitting us to make data homogene-ous with each other, with respect to the system of reference, to the format, to the resolution. The two technologies have, in fact, many similarities among them: in both cases, the object of the study are georeferenced geographical data; they differ, on the other hand, in many other respects: for instance, the topological attribute characterizing GIS is absolutely absent in RS, and the data format is traditionally different.
The final objective of a full integration between the two methodologies, a thorough fusion enabling us to switch indiscriminately from one to the other without any corrective intervention, has yet to be reached, nor is it likely to be reached soon, and this does not seem to be a priority for archaeologists at this time.
Andrea SciannaCNR – Institute of High Performance Computing and Networking (ICAR)
c/o DICA - Palermo (Italy)Benedetto Villa
DICA – Department of Civil, Environmental and Aerospace EngineeringUniversity of Palermo (Italy)
REFERENCES
Allen K.M.S., Green S.W., Zubrow E.B.W. (eds.) 1990, Interpreting Space: GIS and Archae-ology, New York, Taylor & Francis.
Arbia G., Espa G. 1996, Forecasting statistical models of archaeological site location, «Ar-cheologia e Calcolatori», 7, 365-372.
Arbia G., Espa G. 1997, Statistical modelling of archaeological sites locations as non-stationary Cox processes and its use in forecasting, «Archeologia e Calcolatori», 8, 37-43.
Bailey T.C., Gatrell A.C. 1995, Interactive Spatial Data Analysis, Harlow, Essex, Addison Wesley Longman.
Bodenhamer D.J., Corrigan J., Trevor M.H. (eds.) 2010, The Spatial Humanities: GIS and the Future of Humanities Scholarship, Indiana University Press.
Calori L., Camporesi C., Palombini A., Pescarin S. 2006, Sharing interpretation: The chal-lenge of Open Source web approach, in S. Campana, M. Forte (eds.), Proceedings of the 2nd International Conference on Remote Sensing in Archaeology, BAR International Series 1568, Oxford, 433-438.
Camporesi C., Palombini A., Pescarin S. 2007, “Revolution OS” in archeologia: esempi di interfacce web per l’archeologia del paesaggio, in R. Bagnara, G. Macchi Janica (eds.), Open Source, Free Software e Open Format nei processi di ricerca archeologici, Grosseto, 225-236.
Conolly J., Lake M. 2006, Geographical Information Systems in Archaeology, Cambridge, Cambridge University Press.
Coppi R., Gil M.A., Kiers H.A.L. 2006, The fuzzy approach to statistical analysis, «Compu-tational Statistics and Data Analysis», 51, 1-14.

GIS applications in archaeology
361
Emmolo D., Franco V., Lo Brutto M., Orlando P., Villa B. 2004, Hyperspectral techniques and GIS for archaeological investigation, «International Archives of Photogrammetry, Remote Sensing and Spatial Information Sciences», 35, B7, 492-497.
Fisher P., Unwin D. 2002, Virtual Reality in Geography, New York, Taylor & Francis.Forte M. 2002, I sistemi Informativi Geografici in archeologia, Roma, MondoGIS. Fotheringham A.S., Brunsdon C., Charlton M. 2000, Quantitative Geography: Perspec-
tives on Spatial Data Analysis, London, SAGE Publications.Gatrell A.C., Bailey T.C., Diggle P.J., Rowlingsont B.S. 1996, Spatial point pattern analy-
sis and its application in geographical epidemiology, «Transactions of the Institute of British Geographers», 21, 256-262.
Harris T.M. 1988, Digital terrain modelling and three-dimensional surface graphics for landscape and site analysis in Archaeology and Regional Planning, in C.L.N. Ruggles, S.P.Q. Rahtz (eds.), Computer Applications and Quantitative Methods in Archaeology 1987, BAR International Series 393, Oxford, Tempus Reparatum, 12-16.
Harris T.M., Lock G.R. 1990, The diffusion of a new technology: A perspective on the adoption of Geographic Information Systems within UK technology, in Allen, Green, Zubrow 1990, 33-38.
Harris T.M., Lock G.R. 1992, Toward a regional GIS site information retrieval system: The Oxfordshire Site and Monuments Record (SMR) prototype, in C.V. Larsen (ed.), Sites and Monuments: National Archaeological Records, National Museum of Denmark, 185-192.
Harris T.M., Lock G.R. 1996, Multi-dimensional GIS: exploratory approaches to spatial and temporal relationships within archaeological stratigraphy, in H. Kamermans, K. Fennema (eds.), Interfacing the Past: Computer Applications and Quantitative Methods in Archaeology (CAA95), Analecta Praehistorica Leidensia 28, II, University of Leiden, 307-316.
Heizer R.H., Graham J.A. 1967, A Guide to Field Methods in Archaeology: Approaches to the Anthropology of the Dead, Palo Alto, The National Press.
Kamermans H., van Leusen M., Verhagen P. (eds.) 2010, Archaeological Prediction and Risk Management: Alternatives to Current Practice, Leiden, Leiden University Press.
Kohler T.A., Parker S.C. 1986, Predictive models for archaeological resource location, «Advances in Archaeological Method and Theory», 9, 397-381.
Kvamme K.L. 1983, Computer Processing Techniques for Regional Modeling of Archaeological Site Locations, «Advances in Computer Archaeology», 1, 26-52
Kvamme K.L. 1990, The fundamental principles and practice of predictive archaeological modeling, in A. Voorrips (ed.), Mathematics and Information Science in Archaeology: a Flexible Framework, Studies in Modern Archaeology, vol. 3, Bonn, Holos-Verlag, 257-262.
Kvamme K.L. 1992, Geographic Information Systems and Archaeology, in G. Lock, J. Moffett (eds.), Computer Applications and Quantitative Methods in Archaeology 1991, BAR International Series 577, Oxford, Tempus Reparatum, 77-89.
Kvamme K.L. 1997, Ranter’s corner: Bringing the camps together: GIS and ED, «Archaeologi-cal Computing Newsletter», 47, 11-25.
Kvamme K.L. 2005, Archaeological modeling with GIS at scales large and small, in Read-ing Historical Spatial Information from Around the World: Studies of Culture and Civilization Based on Geographic Information Systems Data. Proceedings of the 24th International Research Symposium, International Research Center for Japanese Stud-ies, 141-157.
Kvamme K.L., Brandt R., Groenewoudt B.J. 1992, An experiment in archaeological site location: Modelling in the Netherlands using GIS techniques, «World Archaeology», 24, 268-275.

A. Scianna, B. Villa
362
Kvamme K.L., Jochim M.A. 1989, The Environmental Basis of Mesolithic Settlement, in C. Bonsall (ed.), The Mesolithic in Europe, Papers Presented at the Third International Symposium, Edinburgh, John Donald Publishers, 1-12.
Kvamme K.L., Petrie L., Johnson I., Cullen B. 1995, GIS in Archaeology: An Annotated Bibliography, Sydney University Archaeological Methods Series 1, Sydney, University of Sydney.
Lock G., Stancic Z. 1995, Archaeology and Geographical Information Systems: A European Perspective, London, Taylor & Francis.
Mueller J.W. 1974, The use of sampling in archaeological survey, «Memoirs of the Society for American Archaeology», 28, Washington, 1-91.
Pescarin S., Calori L., Camporesi C., Di Ioia M., Forte M., Galeazzi F., Imboden S., Moro A., Palombini A., Vassallo V., Vico L. 2008, Back to 2nd AD. A VR on-line experience with Virtual Rome Project, in VAST 2008. The 9th International Symposium on Virtual Reality, Archaeology and Cultural Heritage, Braga, Eurographics Associa-tion, 109-116.
Redman C.L. 1974, Archaeological Sampling Strategies, Module in Anthropology, 55, Read-ing, Mass., Addison Wesley, 1-34.
Scianna A. 2010, Experimental studies for the definition of 3D geospatial web services, in M.A. Brovelli, S. Dragicevic, S. Li, B. Veenendaal (eds.), WebMGS 2010 1st
International Workshop on Pervasive Web Mapping, Geoprocessing and Services, «International Archives of Photogrammetry, Remote Sensing and Spatial Information Sciences», 38, 4/W13.
Scianna A., Ammoscato A. 2010, 3D Gis Data Model Using Open Source Software, “Core Spatial Databases – Updating, Maintenance and Services – from Theory to Practice. (Haifa, Israel 2010), «International Archives of Photogrammetry, Remote Sensing and Spatial Information Sciences», 38, Part 4-8-2-W9.
Scianna A., Ammoscato A., Corsale R. 2008, GIANT3D: Experimentations on a new 3D data model for GIS, «International Archives of Photogrammetry, Remote Sensing and Spatial Information Sciences», 37, B4, 101-107.
Scianna A., Ammoscato A., Corsale R., Villa B. 2005, The last development of ARCHEO-NAV: An OGC compliant navigator for archaeological sites running on PocketPC, in Proceedings of CIPA XX International Symposium, 946-951.
Scianna A., Villa B., Ammoscato A., Corsale R. 2004, Multimedia guide in archaeological sites by GIS-GPS techniques, pocket-PCs and pocket-GPSs, «International Archives of Photogrammetry, Remote Sensing and Spatial Information Sciences», 35, B2, 635-640.
Stancic Z., Kvamme K.L. 1999, Settlement pattern modelling through Boolean overlays of social and environmental variables, in J.A. Barceló, I. Briz, A. Vila (eds.), New Tech-niques for Old Times (CAA98), BAR International Series 757, Oxford, Archaeopress, 231-235.
Verhagen P. 2008, Testing archaeological predictive models: A rough guide, in A. Posluschny, I. Herzog, K. Lambers (eds.), Layers of Perception. Proceedings of the 35th Interna-tional Conference on Computer Applications and Quantitative Methods in Archaeology (Berlin 2007), Bonn, Habelt, 285-291.
Warren R.E. 1990a, Predictive modelling in Archaeology: A primer, in Allen, Green, Zu-brow 1990, 90-98.
Warren R.E. 1990b, Predictive modelling of archaeological site location: A case study in the Midwest, in Allen, Green, Zubrow 1990, 201-209.
Warren R.E., Oliver S.G., Ferguson J.A., Druhot R.E. 1987, A predictive model of ar-chaeological site location in the Western Shawnee National Forest, Technical Report No. 86-262-17, Quaternary Studies Program-Illinois State Museum, Springfield.
Watson P.J., Leblanc S., Redman C. 1971, Explanation in Archaeology, New York, Columbia University Press.

GIS applications in archaeology
363
Wescott K., Brandon R.J. 2000, Practical Applications of GIS for Archaeologists: A Predic-tive Modelling Toolkit, London, Taylor & Francis.
Wheatley D. 1993, Going over old ground: GIS, archaeological theory and the act of per-ception, in T. Madsen, I. Scollar (eds.), Computing the Past: Computer Applications and Quantitative Methods in Archaeology (CAA 92), Aarhus, Aarhus University Press, 133-138.
Wheatley D. 1996, The use of GIS to understand regional variation in earlier Neolithic Wessex, in D.G. Maschner (ed.), New Methods, Old Problems: Geographic Infor-mation Systems in Modern Archaeological Research, Carbondale, Southern Illinois University Press, 75-81.
Wheatley D., Gillings M. 2002, Spatial Technology and Archaeology: The archaeological applications of GIS, London, CRC Press-Taylor & Francis.
Withley T., Burns G. 2008, Conditional GIS surfaces and their potential for archaeological predictive models, in A. Posluschny, K. Lambers, I. Herzog (eds.), Layers of Per-ception, Proceedings of the 35th International Conference on Computer Applications and Quantitative Methods in Archaeology (Berlin 2007), Bonn, Habelt, 292-298.
Winterbottom S.J., Dawson T. 2005, Airborne multi-spectral prospection for buried archaeol-ogy in mobile sand dominated systems, «Archaeological Prospection», 12, 205-219.
Zubrow E.B.W., Harbaugh J.W. 1978, Archaeological Prospecting: Kriging and simulation, in I. Hodder (ed.), Simulation Methods in Archaeology, Cambridge, Cambridge Uni-versity Press, 109-122.
ABSTRACT
The diffusion of the use of Geographical Information Systems in archaeology has con-siderably increased in recent years. This multiplicity of applications is due mainly to the the growing interest of archaeologists in modern methodologies for the management of archaeo-logical data, surveyed by topographic, photogrammetric and remote sensing techniques. GIS have become a fundamental tool for managing, sharing, analyzing and visualizing spatially referenced data and they are completely substituting the traditional techniques used by ar-chaeologists, based upon filling out forms, graphics and other paper documents. Besides in the modern global society, dominated by mass media such as Internet, the issue of utilization has become more and more important, and most of the more recent GIS applications (Multimedia GIS, WebGIS) take this aspect into consideration.
