arcgis® business analyst server -...
TRANSCRIPT

ArcGIS® Business Analyst Server
Business Analyst Workflow Templates Revised December 16, 2008

Introduction to ArcGIS Business Analyst Server workflow templates This section shows how a user can utilize a predefined workflow to analyze their customer base. Each step in the process guides a user through the workflow that provides links to the standard ArcGIS® Business Analyst Server tools to complete the analysis.
What is a workflow? A workflow is a predefined series of steps containing several ArcGIS Business Analyst Server tools compiled and organized to perform specific business analytics.
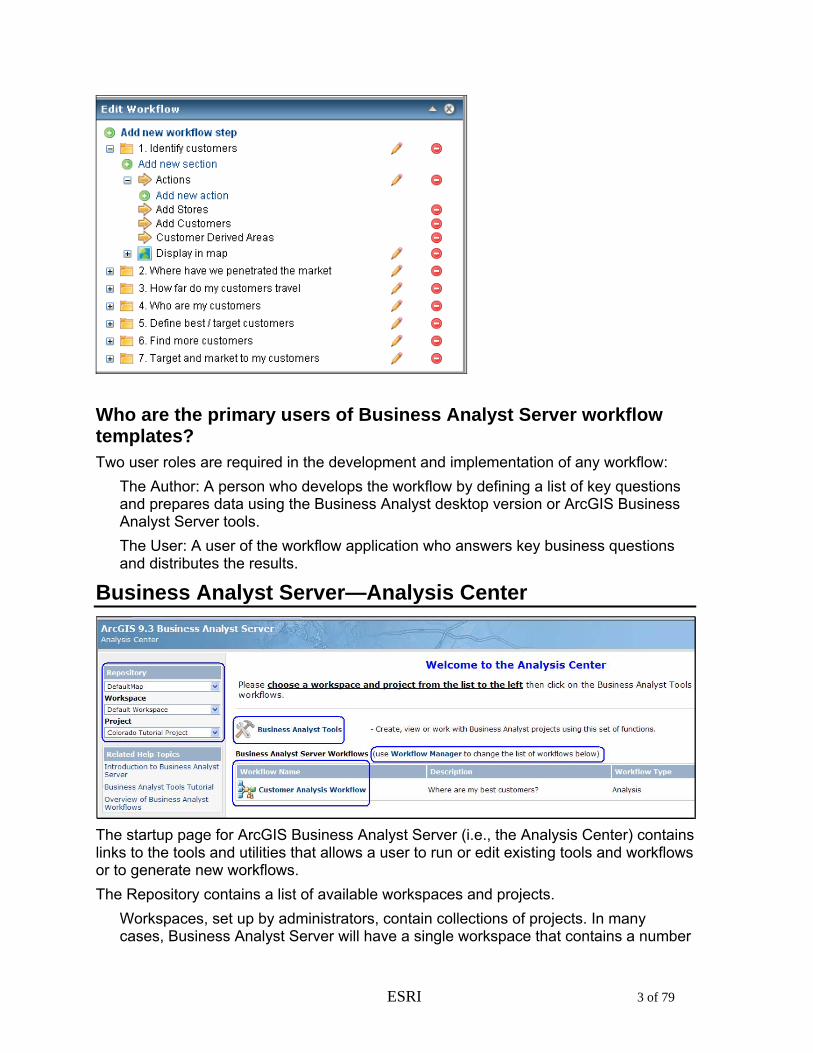
Can you create other workflows? The Workflow Manager provides a Web interface that can be used to generate new workflow templates, edit or delete existing ones.
Each workflow contains embedded editing tools that make customizing existing workflows quick and easy. These tools can be accessed from within the workflow.
ESRI 2 of 79
Who are the primary users of Business Analyst Server workflow templates? Two user roles are required in the development and implementation of any workflow:
The Author: A person who develops the workflow by defining a list of key questions and prepares data using the Business Analyst desktop version or ArcGIS Business Analyst Server tools. The User: A user of the workflow application who answers key business questions and distributes the results.
Business Analyst Server—Analysis Center
The startup page for ArcGIS Business Analyst Server (i.e., the Analysis Center) contains links to the tools and utilities that allows a user to run or edit existing tools and workflows or to generate new workflows. The Repository contains a list of available workspaces and projects.
Workspaces, set up by administrators, contain collections of projects. In many cases, Business Analyst Server will have a single workspace that contains a number
ESRI 3 of 79

of projects. Administrators can also set up workspaces for individual users or departments. Projects contain Business Analyst Server analysis and content. The output generated when executing a workflow is stored as projects. Projects can be set up for each user in an organization or contain a collection of work shared by multiple users. End users can edit existing projects or create new ones.
The Business Analyst Tools link accesses the core Business Analyst Server tools. The Workflow Manager link accesses the tools for an analyst to create or delete workflow templates. The Workflow Name table contains a list of currently available workflows.
ESRI 4 of 79

Business Analyst Server workflow interface: Overview The interface of the Customer Analysis workflow can be customized for each user and/or task.
The map navigation tools allow a user to easily navigate the map view. Zoom In
Zoom Out
Pan
Full Map View
ESRI 5 of 79

Identify Features
Measure Distances
Toggle Navigation Compass
Refresh project Contents
Clear Results
Toggle Map Content
Select Features
Clear Features
ESRI 6 of 79

What is the Customer Analysis workflow? The Customer Analysis workflow is a series of steps that authors view, analyze, and report on their customer base. The final result of this workflow is a series of maps and reports designed to provide information to effectively market to clients.
Customer Analysis Workflow steps Data setup: Uploading data from Business Analyst desktop As part of a setup, it is important to note that steps in a workflow can contain results of tools run from the desktop version of Business Analyst. These results can be segmentation profiles, trade areas, analyses, or even stores and customers already geocoded. The upload utility can be accessed from Business Analyst Project Explorer or from Business Analyst data layers from within ArcCatalog. The capability also exists within the Web applications to upload custom data for processing. Therefore, it is not necessary to have a complete installation of ArcGIS Business Analyst desktop. A separate installation for the Business Analyst desktop version can be run to allow only the upload or download of projects. If you want results run within Business Analyst Server and to view or edit them within Business Analyst desktop, these utilities are accessible from this installation. In this example, the following files types and Business Analyst results are used to run all steps for this Customer Analysis workflow.
Uploaded customer database with address or latitude-longitude coordinates Uploaded Store map layer Geographic boundary layer (encompassing your existing market)
Once your workflow is started, and all the required data is in place, the steps will take an analyst through the workflow and require that the analyst perform some basic analyses of results to proceed to the next step. It is also important to note that several of the steps in this workflow, including creating layers or profiles, are required to run the analyses. These are created in the workflow. You can create them in Business Analyst desktop and upload them to Business Analyst Server, or generate them using the Business Analyst Tools in advance. When starting a workflow process, the first step is to select your workspace, project, and
ESRI 7 of 79

appropriate workflow. Since you are performing a Customer Analysis workflow on customer data in Colorado, you will need to make sure the appropriate selections are made.
□ Click the Workspace drop-down arrow and click Default Workspace.
□ Click the Project drop-down arrow and click Colorado Tutorial Project.
□ Click the Customer Analysis Workflow link. NOTE: The map for your Customer Analysis workflow will be identical to the map generated from the Business Analyst Tools. The Business Analyst Tools are linked to the workflow; therefore, any files uploaded or tools run from the Business Analyst Tools, required for the workflow steps, will be available and should be prepared in advance for the user. In addition, any tools run from within a workflow will appear on the Completed Tasks dialog box in the Business Analyst Tools. Click step 1 on the Analysis Steps control. When a step is selected, a new window opens with the workflow steps in tabular format.
ESRI 8 of 79

Tabbed steps that correspond to the workflow steps
There are four primary tools associated with each tab/step: • Actions: Lists all the tools required for a step • Map screenshot: Allows you to save an image of the current map view in
PNG, GIF, BMP, or JPEG format • Attachments: Stores your map screen shots • Reports: Stores any report run in a step
When an action is completed, the Display in map selection list shows your completed tasks and allows you to turn them on or off if you want to take a map screen shot of your step.
ESRI 9 of 79

ESRI 10 of 79
Step 1: Identify our customers As with most customer data, you have a name and attribute information associated with the customer database. Additionally you can have sales or transaction information for each customer record. This data can be collected at the point of sale, through loyalty card programs, warranty cards, and so on. From a geographic information system (GIS) standpoint, the address fields are the key. With ArcGIS Business Analyst Server, you can enhance the database with additional information. Using address information, you can append geographic coordinates and demographic and neighborhood segmentation data to each record. To do this, you need to identify your customers.
□ In the Analysis Steps dialog box, click Identify customers.
□ Click Actions and click Add new layer.
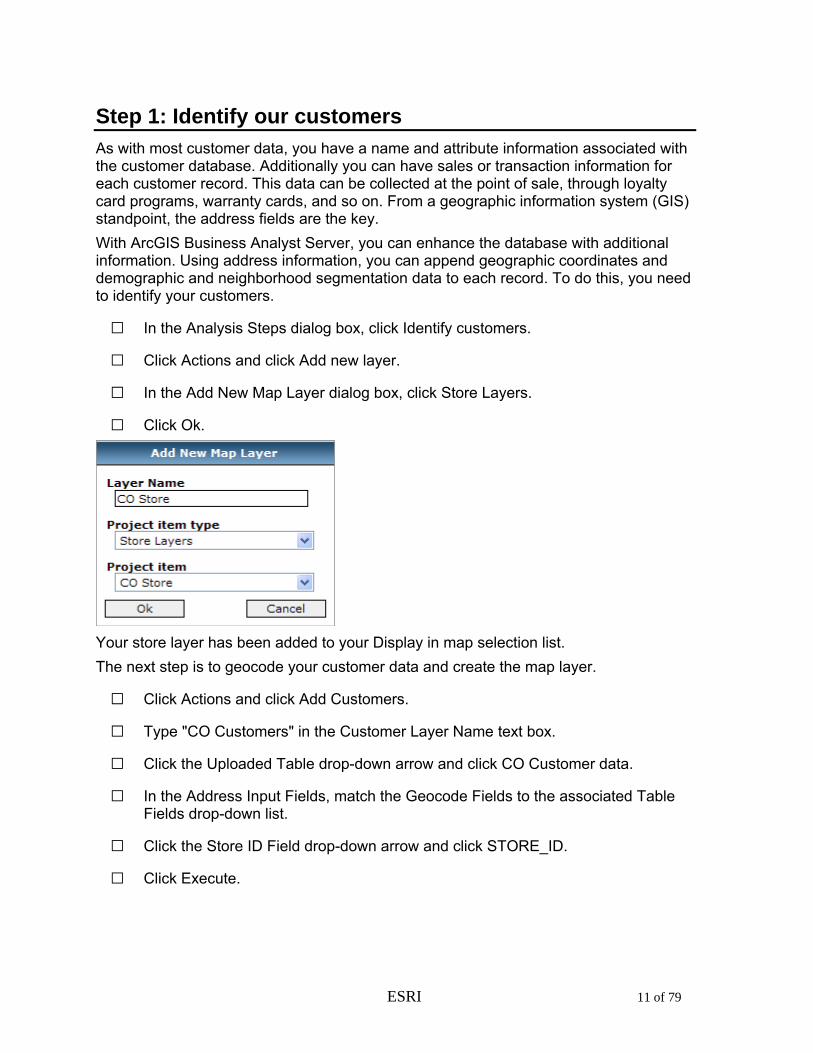
□ In the Add New Map Layer dialog box, click Store Layers.
□ Click Ok.
Your store layer has been added to your Display in map selection list. The next step is to geocode your customer data and create the map layer.
□ Click Actions and click Add Customers.
□ Type "CO Customers" in the Customer Layer Name text box.
□ Click the Uploaded Table drop-down arrow and click CO Customer data.
□ In the Address Input Fields, match the Geocode Fields to the associated Table Fields drop-down list.
□ Click the Store ID Field drop-down arrow and click STORE_ID.
□ Click Execute.
ESRI 11 of 79

□ When the processing is complete, a pop-up that appears prompting you to add the results to the current workflow step. Click OK.
Your customer layer has now been geocoded and added to your Display in map selection list. With your Stores and Customers points geocoded and available in the map display, you can proceed to the final action for this step which is generating customer-derived trade areas.
□ Click CO Customers in the Display in Map section of the workflow step. This will cause the map display to zoom to the point where all customer points are visible.
This map is the customer distribution for the Colorado customers which tells you where your customers are located. You can see that the customers for this store are located outside Denver as well as concentrations of customers in some areas.
ESRI 12 of 79

Now you can create trade areas based on the distribution of your customers. This map will be a trade area (service area) that represents the closest 40/60/80 percent of your customers. There are different methods for creating these trade areas in Business Analyst.
□ Click Actions and click Customer Derived Areas.
□ Type "CO Customer Derived Areas" in the Trade Area Name text box. The Store and Customer layers have already been made available in their respective select lists.
□ Click Advanced Options.
□ In the Choose Hull Type section, click Detailed.
□ Click Execute.
□ When the processing is complete, a pop-up appears that prompts you to add the results to the display. Click Ok.
□ Click CO Customer Derived Areas in the Display in Map section of the workflow step. This will cause the map display to zoom to the point where just the trade area is visible.
□ Expand the CO Customer Derived Areas to view the details.
□ Uncheck Persistent in map to clear the option.
ESRI 13 of 79

Some action results don’t need to be visible while working in other analysis steps. By making this change, the CO Customer Derived Areas will only be visible when the Identify customers tab is active.
□ Click Apply to save the changes to this Analysis Step. You have now completed Step 1: Identify customers. You can see the location of your current store and associated customers in addition to a trade area that depicts the distribution of your core customers in relation to your store. NOTE: At the end of each step, it is recommended to take map screen shots of any trade area generated that would be beneficial when creating a marketing package for distribution. Click the check boxes for the layers in the Display in map selection list of which you want to take a screen shot and click Map screenshot.
Step 2: Where have we penetrated the market? Performing market penetration provides a method to examine how well you are reaching your market areas. We will see where your market share is strong and where it can be improved. The number of customers in each area is divided by the total number of people or households giving a percentage of your market penetration. Your market share is also expressed as a ratio of your sales data to the total sales volume of a market and can be measured with this tool.
□ Click tab 2 to move to the next step in the workflow. You have selected the Where have we penetrated the market step as indicated at the top of the workflow dialog box.
□ Click Actions and click Market Penetration.
ESRI 14 of 79

There is only a single action for this step. If, as an author, you discover that additional steps should be incorporated, contact your Business Analyst.
□ Type "CO Market Penetration" in the Trade Area Name text box.
□ Check Create Report and type "CO Market Penetration" in the Report Name text box.
□ Click Advanced Options.
□ Notice that the calculations will be using BA data. Verify that Standard BA Data and 2008 Total Households are selected.
□ Click Execute
□ When the processing is complete, a pop-up appears that prompts you to add the results to the display. Click Ok.
□ The Market Penetration report is displayed. This report details the count and percentages of customers that are located in the particular standard geography that was used for the analysis. In this case it is Census Block Groups. The customer count is compared to the 2008 Total Households in each area which allows for the penetration percentage to be calculated.
ESRI 15 of 79

□ Close the report window.
□ Click CO Market Penetration in the Display in Map section of the workflow step. This will cause the map display to zoom to the point where just the trade area is visible.
□ Expand the CO Market Penetration to view the details.
□ Uncheck Persistent in map to clear the option. Some action results don’t need to be visible while working in other analysis steps. By making this change, the CO Market Penetration will only be visible when the Identify customers tab is active.
□ Click Apply to save the changes to this Analysis Step.
ESRI 16 of 79

Step 3: How far do my customers travel? In this step, you will generate concentric rings at static intervals to determine how far your customers travel by utilizing the Distance Decay Report tool. The Distance Decay Report tool provides a way to rate how well you're reaching your market areas by calculating your market penetration percentage based on ring or drive-time areas using persons or households. This tool shows where the largest concentrations of your customers are coming from and how far they travel.
□ Click tab 3. You have selected the How far do my customers travel step as is indicated at the top of the workflow dialog box.
□ Click Actions and click Distance Decay Report.
□ Type "CO Distance Decay Report" in the Report Name text box.
□ Click Simple Ring Areas. You might have the impression that your customers travel different distances than the default 1, 2, 3, 4, 5 Radii. Adjust the values for the rings.
□ Click the value 1.
□ Click Delete to remove the value.
□ Repeat the previous two steps to remove the value for 3 and 5.
□ Type "6" in the Radii text box.
□ Click Add.
□ Repeat the previous two steps to add the value for 8 and 10.
□ Verify that Standard BA Data and 2008 Total Households are selected.
□ Click Advanced Options. Several items on the Advanced Options dialog box allow you to adjust the distance units or select a volumetric attribute on which to calculate the market penetration instead of the number of customer points.
□ On the Distance Decay Report – Advanced dialog box, check Create Analysis.
□ Change the Analysis name to CO Decay Area This will create a visual representation of the Radii rings you have defined.
ESRI 17 of 79

□ Click Execute.
□ When the processing is complete, a pop-up appears that prompts you to add the results to the display. Click Ok.
The PDF report automatically launches to show that 41% of your customers are within four miles of your site.
ESRI 18 of 79

The two- to four-mile ring contains 25 percent of your customers as shown in the bar graph.
You can continue to add rings to this report until you notice a significant drop in the graph and you will be able run demographic donut ring reports on those concentrations to further analyze your customers.
□ Close the report window.
□ Expand CO Decay Area to view the details.
□ Uncheck Persistent in map to clear the option.
□ Click Apply to save the changes for this step.
ESRI 19 of 79

Distance decay is useful for determining not only where your highest clusters of customers are but also aids in determining how much influence distance has on your customers and how likely they are to reach your store.
Step 4: Who are my customers? Now that you have located your customers and have seen how they are distributed in your market, as well as where they are likely to come from, you can gain a better understanding of them. The first step in any segmentation analysis is creating a profile. A profile is a summary of geographic, customer, or survey data across all segments that make up the segmentation system you will use. Community TapestryTM is ESRI’s market segmentation system. More information can be found at the following Web site: http://www.esri.com/data/esri_data/tapestry.html In this step, you can generate a segmentation report using the same set of customer points. This report allows you to benchmark your customers against a base area. You will be comparing these customers to the Denver-Aurora CBSA Households. You could use another base, the entire United States for example, or even the 80 percent customer extent primary trade area. What you use depends on how you analyze your market. In this case, you will focus on how to reach more customers in this market. To run this report, create a profile for your customers and the market to compare. A profile is a distribution of the households assigned to each Tapestry segment based on your customer point locations or the Denver-Aurora market. The report will tell you what segments are indicators of your customers allowing you to determine the thresholds of these segments for use later.
□ Click tab 4. You have selected the Who are my customers step as indicated at the top of the workflow dialog box. You will need a Boundary Map layer for this analysis step.
□ Click Actions and click Add new layer.
□ Click Trade Areas in the Project item type list box.
□ Click Denver Aurora CBSA in the Project item list box.
□ Click Ok.
□ Expand Denver Aurora CBSA to view the details.
□ Check Display to clear the option.
□ Uncheck Persistent in map to clear the option.
ESRI 20 of 79

□ Click Actions and click Create Geographic Profile. A geographic profile provides a summary of all the households or adults in a specific geographic area by Community Tapestry segments. In most cases, you will create a geographic profile to use as the base when analyzing your customer profile. The geographic profile is commonly referred to as the base profile because it represents base household segmentation counts against which the target profile is measured. When using a geographic profile as a base, it's important to understand the scope of your analysis. For example, if you are analyzing an existing market for potential growth, you might limit the base to the geographic extent of your market. In this action, you will analyze the Denver market for potential growth, so you will limit your base to the Denver Aurora CBSA boundary.
□ Type "CO CBSA Base profile" in the Profile Name text box.
□ Click the Boundary Layer drop-down arrow and click Step4/Denver Aurora CBSA.
□ Verify the Segmentation Base shows Total Households. NOTE: When generating profiles, it is essential that you use the same segmentation base for both profiles or your results will be inaccurate.
□ Verify the Mapping Layer shows BlockGroups.
□ Check Create Report to select the option.
□ Type "CO CBSA Base profile" in the Report Name text box.
□ Click Execute.
ESRI 21 of 79

□ When the processing is complete, a pop-up appears that prompts you to add the results to the display. Click Ok.
The PDF report displays the tapestry distributions and the household counts for each segment for the base profile.
□ Close the report window.
□ Click Actions and click Create Profile with Address Data. You will generate a customer profile which provides a summarization of all your customers across all segments. Using this option, you will create a customer profile based on a table with customer address information that has been uploaded to the Business Analyst Tools. The customer profile, or target profile, represents the target of the analysis.
□ Type "CO Customer Target profile" in the Profile Name text box.
□ Verify the Uploaded Table select list shows CO Customer data.
□ From the Address Input Fields area, match the Geocode Fields parameters to the associated Table Fields drop-down list.
□ Verify the Segmentation Base select list shows Total Households.
ESRI 22 of 79

□ Verify the Mapping Layer select list shows BlockGroups.
□ Check Create Report to select the option.
□ Type "CO Customer Target profile" in the Report Name text box.
□ Click Execute.
□ When the processing is complete, a pop-up appears that prompts you to add the results to the display. Click Ok.
The PDF report displays the tapestry distributions and the household counts for segment for the target profile. You will see some differences between the two profile reports.
ESRI 23 of 79

□ Close the report window. With the profiles generated, you can start analyzing your market. The first step in this process is to generate a Customer Tapestry Profile report. The Customer Tapestry Profile report shows the Community Tapestry segments and summary groups that most accurately reflect your customer records and compares your target profile to a base profile. This report helps you identify your customers and your target (best) customers. You will use this report to display your customers summarized by Community Tapestry segment and by LifeMode and Urbanization groups. The report is sorted by customer composition percentage from highest to lowest so you can see which segments make up the largest percentage of your current customers. The Customer Tapestry Profile report is one of the most important reports in the Segmentation module because analysis defines how you run subsequent segmentation reports, maps, and charts. After a detailed analysis, you will be able to identify the top segments that define who your customers are and use these targets to further refine your subsequent analyses.
□ Click Actions and click Customer Tapestry Profile Report.
□ Type "CO Customer Tapestry Report" in the Profile Name text box.
□ Verify the Base Profile select list shows CO CBSA Base profile.
□ Click the Target Profile drop-down arrow and click CO Customer Target profile.
□ Verify that View Report is checked.
□ Click Execute.
□ When the processing is complete, a pop-up appears that prompts you to add the results to the display. Click Ok.
Your report will be organized by Tapestry groups and by segments. The first page is a summary of the contents including how some of the calculations are performed in Business Analyst. The second page shows a breakdown of your customers and your base by LifeMode and Urbanization groupings. The third page displays your customers and your base broken down across all 66 Community Tapestry segments. There are annotation callouts that highlight how each value is calculated.
ESRI 24 of 79

Business Analyst calculates the percentage of penetration by dividing the target total for each segment by the base total and then multiplying by 100. In this example, there are 2,288 customers in segment 6. Sophisticated Squires and 60,499 households in the base; therefore, the percentage of penetration is 3.80 percent. The index estimates the propensity of customers to be in a specific segment. A value of 100 is average. If a segment has an index value of 100, your percentage of customers for that segment is the same as the base. Therefore, a value less than 100 indicates that the target profile consumes less than average (compared to the base), and a value greater than 100 indicates that the target profile consumes at a rate higher than the
ESRI 25 of 79

base. For example, in the report above, 6. Sophisticated Squires has an index of 833, which means that households in this segment are 8.33 times as likely to be your customer than the average household in the base profile. An index is calculated by dividing the target composition percentage (column B) by the base composition percentage (column D) and multiplying by 100. When examining your Customer Tapestry report, there are several factors to identify your top segments. The report is sorted by percentage of your customers. When looking at this field, it's easy to determine your target segments. You will need to take into consideration the other columns in this report to accurately identify your target segments. When analyzing the Customer Tapestry Profile report, look for a line in the sand that separates segments that have a lot of customers from those that don't. For example, in your report, you can see the first through fifth segments range from 55.7 percent to 5.7 percent of customers, but the next five highest segments are between 0.5 percent and 2.4 percent. Since there is a reasonable drop between the fifth and sixth segments, the line in the sand threshold is 5 percent. It's generally good practice to round down to the nearest whole number. In the next step of the analysis, identify the threshold of the index for your customer profile. If you analyze the segments by looking at index values, the reasonable drop would be after 120; therefore, this would be your line in the sand.
□ Close the report window.
□ Click Apply to save the changes for this step.
Step 5: Define your best/target customers Now that you have analyzed the segments based on your customers, you will create a target group of only those segments that are indicators of your customers. In the previous step, you determined that the thresholds that defined the key segments for your customers were more than 5 percent of your customers and indexed 120 or higher. You have now set the stage for defining your core and developmental customers.
Core segments typically include all the segments that have an index greater than 100 and a composition percentage greater than 4 percent. You can conclude that you are dominating in these segments because these segments are indexing well and make up a large portion of your customers. You should target your marketing efforts toward these customers. Developmental segments include the segments that have an index lower than 100 and a composition percentage greater than 4 percent. You can conclude that segments in this quadrant require some investment. Although there are a substantial number of consumers in the segments contained in this quadrant, they are actually indexing lower than the base. You are not reaching these segments effectively compared to the base profile, so you should consider creating a marketing campaign that will reach these segments more effectively.
In this step, you will edit these thresholds based on the analysis of your customers. Your core customers will have an index of 120 or more and will represent 5 percent or more
ESRI 26 of 79

of your customer counts, while your developmental customers will have an index below 120 but will represent 5 percent or more of your customer counts.
□ Click tab 5. You have selected the Define best/target customers step as is indicated at the top of the workflow dialog box.
□ Click Actions and click Target Group from Chart.
□ Click Game Plan Chart and click Next.
□ Verify the Base Profile select list shows CO CBSA Base profile.
□ Click the Target Profile drop-down arrow and click CO Customers Target Profile.
□ Type "5" in the Percent Composition Threshold text box.
□ Type "120" in the Index Threshold text box.
□ Click Next.
You will see that your segments are arranged into four quadrants each representing a different classification of your customer segments. The two quadrants you are interested
ESRI 27 of 79

in are Core and Developmental.
□ Type "Denver Aurora Target Groups" in the Target Group Name text box.
□ Type "Core" in the Target Name text box and click Create.
□ Type "Developmental" in the Target Name text box and click Create. The Game Plan Chart is interactive allowing you to select certain segments and drag them into the appropriate target group.
□ Select the Core folder.
□ Click and hold the mouse button then drag a box around the segment dots that are contained in your Core quadrant.
□ Click the right single arrow button to add these selected segments to the Core folder.
This will add these segments to your Core folder and identify them.
□ Repeat these steps to add the Developmental segments to the Developmental folder.
□ Click Execute. You have created a new target group to do precision analysis of your market based on the segments that best define your customers. You will now generate a report of these
ESRI 28 of 79

segments to better understand them.
□ Click Actions and click Core and Developmental Segments Report.
□ Type "CO Core and Developmental Segments Report" in the Report Name text box.
□ Verify the Base Profile select list shows CO CBSA Base Profile.
□ Click the Target drop-down arrow and click CO Customer Target Profile.
□ Click Use Existing Target Group.
□ Verify the Target Group select list shows Denver Aurora Target Groups.
□ Verify the Core Group select list shows Core.
□ Click the Developmental Group drop-down arrow and click Developmental.
□ Click Execute.
□ When the processing is complete, a pop-up appears that prompts you to add the results to the display. Click Ok.
ESRI 29 of 79

You now have a detailed report of your Core and Developmental segments and how they compare to your market.
□ Close the report window.
□ Click Apply to save the changes for this step.
ESRI 30 of 79

Step 6: Find more customers Now that you have determined your top segments and have created a custom target list of these segments, you will use this new target data to create a target penetration map that shows which ZIP Codes would be ideal for marketing campaigns. This map shades the penetration percentage of selected segments and helps you determine the concentration of your target segments at a given level of geography.
□ Click tab 6. You have selected the Find more customers step as is indicated at the top of the workflow dialog box.
□ Click Actions and click Target Penetration Map.
□ Type "CO Target Penetration Map" in the Analysis Name text box.
□ Verify the Target group select list shows Denver Aurora Target Groups.
□ Check Core and Developmental.
□ Verify the Segmentation Base select list shows Total Households.
□ Verify the Mapping Layer select list shows ZIP5.
□ Click Advanced Options
□ Click Create Report
□ Type "CO Target Penetration Map" in the Report Name text box.
□ Click Execute.
ESRI 31 of 79

□ When the processing is complete, a pop-up appears that prompts you to add the results to the display. Click Ok.
The target penetration Report shows blah, blah, blah.
ESRI 32 of 79

This Target Penetration Map layer is thematically shaded to show areas of low-to-high penetration based on ZIP Codes. This allows you to see which areas have a greater likelihood of attracting customers and shows potential for a marketing campaign.
ESRI 33 of 79

□ Click Apply to save the changes for this step.
ESRI 34 of 79

Step 7: Target and market to my customers Now that you have determined which ZIP Codes have the highest potential for customers, the next step is to market to these areas. Before you can do that, you must understand who your customers are, what they like to do, and the best way to advertise. In this next step, you will determine who your customers are by discovering which activities they are likely to participate in.
□ Click tab 7. You have selected the Target and market to my customers step as is indicated at the top of the workflow dialog box.
□ Click Actions and click Understanding your target customers.
□ Type "CO Understanding Your Target Customers Report" in the Report Name text box.
□ Verify the Base Profile select list shows CO Base Profile.
□ Click the Target Profile drop-down arrow and click CO Customers Target Profile.
□ Click Use Existing Target Group.
□ Verify the Target Group select list shows Denver Aurora Target Groups.
□ Verify the Core Group select list shows Core.
□ Click the Developmental Group drop-down arrow and click Developmental.
□ Click the MRI Groups drop-down arrow, then click Leisure Activities/Lifestyle and click Add.
□ Repeat this step adding Travel and Financial.
□ Click Execute.
ESRI 35 of 79

□ When the processing is complete, a pop-up appears that prompts you to add the results to the display. Click Ok.
The first page is a summary of the report and includes the first of the three Mediamark Research Inc. (MRI) groups selected for this report. The second page contains the other two MRI groups. Now that you have identified your target customers, you need to understand them. You have identified two groups of segments and need to understand more about the similarities and differences between each group’s lifestyles. As you know, an insightful tool for analyzing your customers is the Index. Using Community Tapestry profile, you can calculate a weighted index that accounts for the composition percentage for each segment of your customer profile compared to the index for that segment for any specific product, services, or lifestyle characteristic.
ESRI 36 of 79

Using this method, you can compare the Tapestry profile of your customers to the Tapestry profile based on a syndicated customer survey. MRI conducts surveys to show how individuals use various products and services. If the index is above 100, then your customers are more likely to use this product or service or have this lifestyle characteristic than the average U.S. household. Because your focus is on the differences of the target segment groups (i.e., Core, Developmental, All Segments in customer Profile), you have calculated weighted indexes for each group separately. The report provides indexes for the top 20 lifestyle characteristics that your Core and Developmental customers, as well as your overall customer profile, are expected to participate in at the highest rates sorted from high to low based on the index for your Core customers.
□ Click OK to save the changes and close the Analysis Steps dialog box.
ESRI 37 of 79

Document Package When your analysis is complete, the Document Package organizes your outputs and analyses created in the previous seven workflow steps. This provides you with easy access to these outputs which can be further analyzed or distributed to your end user.
□ Click the toolbar icon to open the Document Package dialog box.
The generated reports are accessible from this central location. This allows you to review the results of the analyses. Any reports or map screen shots will be available via links on this dialog box.
ESRI 38 of 79

Site Evaluation Workflow This section describes the steps required to setup and use the default Site Evaluation workflow that comes standard with ArcGIS Business Analyst Server. The first section shows you how to execute one of these workflows and the second section shows you how to create, edit and configure a new workflow. In addition, the second section will illustrate the setup of this San Francisco tutorial. This example is one of many possible ways to perform site evaluation. Every organization will have their own strategies for site analysis and the tools included within ArcGIS Business Analyst Server can create completely new workflows or customize the default workflows to meet your needs.
What is a Site Evaluation workflow? A Site Evaluation workflow is a site screening process that is used to determine the sites that are the best candidates for growth and expansion. Current market conditions in the form of existing stores, competitive locations, and demographic characteristics of the surrounding population are used to determine the best site candidates for growth. An example Site Evaluation workflow is installed as a sample with Business Analyst Server. There are many tools available to an author to customize the configuration and workflow steps. Typically an author modifies these steps to personalize the workflow to accommodate the business model for their organization. For example, an author could add new tools to a workflow step, delete a step that is not applicable to their organization, or even add new steps to the workflow. The two primary workflow sections in this example template are the Evaluation Steps and the Configuration Steps.
The Evaluation Steps are implemented by the user in the Site Evaluation workflow once the Configuration Steps have been successfully run. The Configuration Steps are performed by the author in advance so that the user will have the data and files needed to perform the Site Evaluation.
What is the difference between a workflow template and a workflow type? In ArcGIS Business Analyst Server, the workflow template and the workflow type are two frequently used terms.
Workflow template: This template uses predefined metadata that describes the type of data and actions permitted while solving a defined business question. Each workflow represents the data associated with the business question (based on the template) and what services to provide to the user. It is possible to add any number of the business questions, based on a chosen template, and assign values (such as external files, layers, names, numbers) to parameters of the template. Any edits performed in a template are available to any user. Workflow type: The two types of workflows available in this release are Site Evaluation and Customer Analysis. The Site Evaluation method uses scorecards, while the Customer Analysis method uses no scorecards. Any edits performed in a workflow are only available in the current project.
ESRI 39 of 79

What is scoring in a workflow? The Site Evaluation workflow allows you to score potential sites based on multiple criteria. The scores are combined for an overall score to determine the best new locations. The scoring can be done in two ways:
Manual Scoring: Entails a visual and/or personal analysis of the sites to determine the viability of the potential sites. The analysis includes the outputs of the site evaluation workflow including trade areas, demographic reports, aerial imagery and/or knowledge of the potential sites. At each step in the workflow, you assign subjective scores for each facility being examined. For example, you can use local knowledge to score one site higher than another or you can use a demographic summary report to view the characteristics of the surrounding population. You could use this demographic information to subjectively score potential sites. Automatic Scoring: Uses output from certain Business Analyst Server capabilities to automatically generate scores. For example, output from a Business Analyst Server tool could generate demographics summaries around each site. These demographic summaries are compared to a preconfigured scorecard to determine the score for each site. This approach still requires you to input parameters and evaluate outputs of the tools of the automatic scores to be sure they correspond with your knowledge of the sites. The parameters of the automatic scoring are setup for the user when configuring the workflow.
NOTE: In this Site Evaluation example, steps 1-3 utilize subjective scoring and step 4 will perform automatic scoring. You will notice that there is an auto scoring check box next to items in steps 1-3 but in this workflow they are unavailable.
ESRI 40 of 79

How does a user start an existing workflow? To start a workflow, select your workspace, your project and your appropriate workflow. Because you are performing a Site Evaluation workflow on site data in San Francisco, you will need to make sure the appropriate selections are made.
□ Click the Workspace drop-down arrow and click Default Workspace.
□ Click the Project drop-down arrow and click San Francisco Tutorial Project.
□ Click the Site Evaluation link. NOTE: The map for your Site Evaluation workflow will be identical to the map generated from the Business Analyst Tools. The Business Analyst Tools are linked to the workflow; therefore, any files uploaded or tools run from the Business Analyst Tools, that are requirements to run the steps of the workflow, will be available and should be prepared in advanced for the analyst. In addition, any tools run from within a workflow will appear in the Completed Tasks dialog box in the Business Analyst Tools. When the Site Evaluation workflow is launched for the first time, or if the configuration steps have not been run, this dialog appears. The dialog indicates that the data needed prior to running the Evaluation Steps hasn’t been completed and must be finished in order for the user to finish the workflow.
□ Click the here link, to launch the Configuration Steps.
ESRI 41 of 79

Configuration Steps When the Configuration Steps dialog opens, you will have three tabs to work through. In the Identify potential sites tab, you select your potential sites, generate your drive time polygons around each site, and upload attachments to be used in scoring the potential sites. The potential sites, the existing sites, and the competitor sites have already been preloaded into the San Francisco Tutorial Project and don’t need to be added through the Actions tool.
Step 1: Identify potential sites
□ Click on Tab 1 Identify potential sites.
□ Click the Potential Sites drop-down arrow and click Potential Sites. The ID Field, Name Field and Address Fields will be automatically filled in as these are assigned during the Workflow Setup phase described later in this document. Additionally the Potential Sites will be automatically loaded into the map.
□ Expand the Site list then expand the Potential Site 1 list and click Add new attachment.
ESRI 42 of 79

Here a user can add in the attachments to be used during the Evaluation Step 2 Define and examine characteristics of potential sites. Any type of attachment can be uploaded including Floor Plan images and Marketing plan Excel spreadsheets. Once uploaded the attachments can be viewed and analyzed from within the Site Evaluation steps.
□ Click Actions and view the optional tools that can be run.
For this step the drive time polygons that will be used in Cannibalization Statistics, in Step 4 of the Evaluation Steps, need to be generated.
□ Click the link for Actions and click Drive Time Polygons.
□ Change the Trade Area Name field to Potential Drive Time Polygons.
ESRI 43 of 79
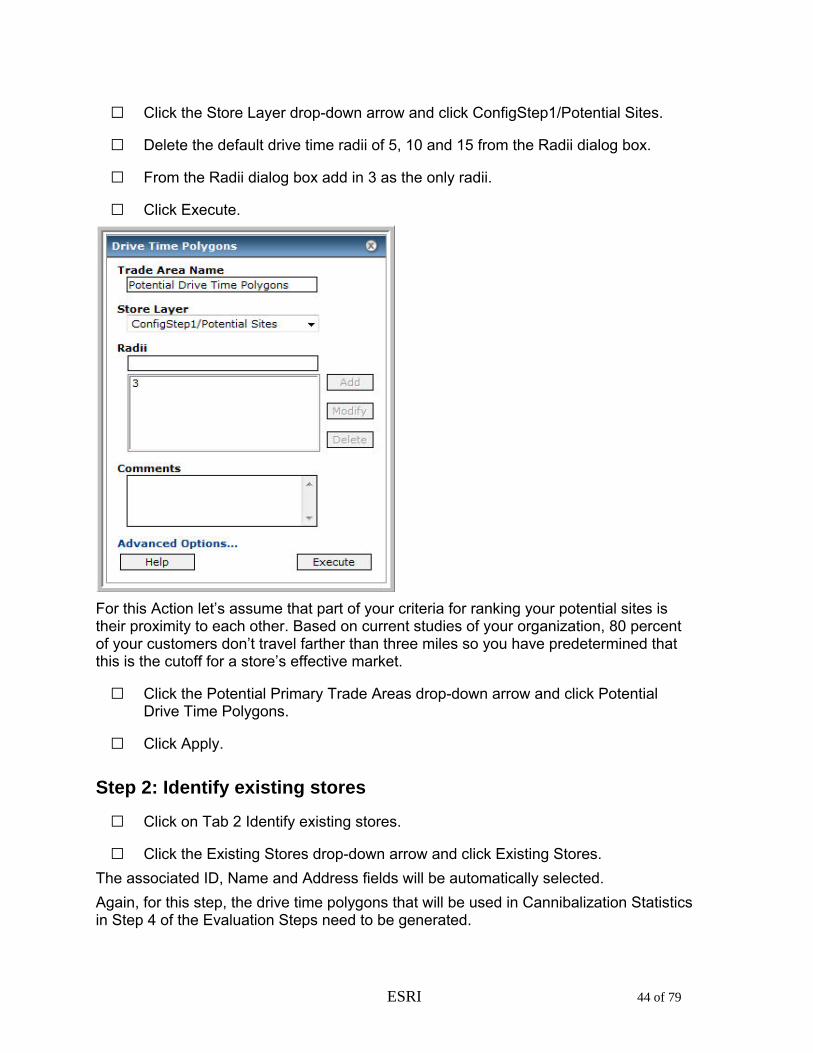
□ Click the Store Layer drop-down arrow and click ConfigStep1/Potential Sites.
□ Delete the default drive time radii of 5, 10 and 15 from the Radii dialog box.
□ From the Radii dialog box add in 3 as the only radii.
□ Click Execute.
For this Action let’s assume that part of your criteria for ranking your potential sites is their proximity to each other. Based on current studies of your organization, 80 percent of your customers don’t travel farther than three miles so you have predetermined that this is the cutoff for a store’s effective market.
□ Click the Potential Primary Trade Areas drop-down arrow and click Potential Drive Time Polygons.
□ Click Apply.
Step 2: Identify existing stores
□ Click on Tab 2 Identify existing stores.
□ Click the Existing Stores drop-down arrow and click Existing Stores. The associated ID, Name and Address fields will be automatically selected. Again, for this step, the drive time polygons that will be used in Cannibalization Statistics in Step 4 of the Evaluation Steps need to be generated.
ESRI 44 of 79

□ Click Actions and click Drive Time Polygons.
□ Change the Trade Area Name field to “Existing Drive Time Polygons”.
□ Click the Store Layer drop-down arrow and click ConfigStep2/Existing Sites.
□ Delete the default drive time radii of 5, 10 and 15 from the Radii dialog box.
□ From the Radii dialog box add in 3 as the only radii.
□ Click Execute.
□ Click the Existing Primary Trade Areas drop-down arrow and click Existing Drive Time Polygons.
□ Click Apply. Once you click Apply, the scores will appear at evaluation step number 4 for each potential site. This number is based on the configured cannibalization statistics processing of the 3 minute trade areas that were created.
ESRI 45 of 79

Step 3: Identify competitors
□ Click Tab 3 Identify competitors.
□ Click the Competitors drop-down arrow and click Competition Sites.
□ Click Apply.
□ Click Ok to close the Configuration Steps dialog. Now that the Configuration Steps have been successfully run, the Evaluation Steps can be performed.
Evaluation Steps
□ Click 1. Examine trade areas in the Evaluation Steps.
When a step is selected, a new dialog appears with the workflow steps in tabular format.
ESRI 46 of 79

NOTE: Any necessary data will be preloaded during the Configuration steps by the author. When an action is completed, the Display in map drop-down will show your completed tasks and allow you turn them on or off if you want to take a Map screen shot of your step.
Step 1: Examine trade areas In any site evaluation, the first step is to identify the sites to be analyzed. Once these sites have been identified and input into the workflow, they can be analyzed by running demographic reports and generating trade areas around the potential sites. In this step you will examine the data input, run a report and then assign scores to each of the sites. You will note that not all of the Actions will be used during this workflow example. Some Actions, such as simple rings, are examples of other types of trade area tools that can be used as subjective scoring during this step. Other Actions may be added in as needed by the author during the Configuration Phase. Tools, such as Spatial Overlay, can be used as inputs to an automatic scoring approach for this step and would have the key variables used in the scoring set up in advanced by the author during the Configuration Phase. From the outputs of the Configuration Steps, you can visually analyze your potential sites. This includes viewing uploaded site plans or visually analyzing existing drive times versus potential drive times. You may want to examine key demographic variables that are indicators of your best customers. These variables result from internal metrics or outputs and analyses of the Customer Analytic workflow. To see how these variables exist around your existing sites and how they compare against your potential sites, you can run demographic reports in Business Analyst Server based on the drive times in the previous step.
□ Click Actions and click Summary Reports.
□ Type “Existing Drive Time Reports” in the Report Name text box.
□ Click the Boundary Layer drop-down arrow and click ConfigStep 2/Existing Drive Time Polygons.
□ In the Selected Reports dialog box, check Demographic and Income Report.
□ Click Execute.
ESRI 47 of 79

Follow the same steps and run another Demographic and Income report on the Potential Drive Time Polygons. After these reports have run successfully, you can analyze the reports to compare your key variables. For example, assume that one of your key variables is the Households by Income $50,000 -$74,999. By looking at this value on your Existing Site report and comparing that to your three Potential Sites, you can gauge which site has the highest percent. Continue this analysis for all of your key demographic variables to come up with a subjective score for each site. In this example, all the income percents are very close so you will need to further investigate the demographics to narrow down your scoring these sites.
ESRI 48 of 79

At the end of each step, assign a score to each potential site. To the right of each site is a drop-down menu of scores from which to choose. Select an appropriate score based on your analysis. In this example the value of the scores selected show how the workflow process works. These scores will be the result of the analyses performed during the step and the results of each step will be combined to create a final score at the end of the site evaluation.
ESRI 49 of 79

□ Click Apply to save the evaluations that have been made. Step 2: Define and examine characteristics of potential sites In Step 1 you determined the viability of your potential sites through careful analyses of trade areas and demographics. In Step 2 you will analyze the key site characteristics. The characteristics can include, but are not limited to, building frontage, gross leasable area, monthly rent, age of the facility, number of parking spaces, accessibility, and so on. These variables are just as important as the demographic characteristics of a market but cannot be as easily measured in reports and trade areas. These Attachments will be uploaded by the author during the initial configuration of the workflow. The screen shot below shows some examples of attachments that may be valuable in analyzing potential sites. You may use any files that you wish during the tutorial.
From the drop-down menu to the right of each potential site, select the following scores. Again, keep in mind these values are for demonstration purposes and don’t represent any true analysis.
ESRI 50 of 79

Step 3: Examine Market Favorability When understanding your potential position in a new or existing market, you need to take several factors into consideration such as location or proximity of competitors and how well you are penetrating a market.
□ Click Actions and click Locator Report.
□ Type “Competition Locator Report” in the Report Name text box.
□ Click the Store Layer drop-down arrow and click ConfigStep1/Potential Sites.
□ Click the Business Points Layer drop-down arrow and click ConfigStep3/Competitors
□ Click Limit to Nearest Locations and type “5” in the value field.
□ Verify that the header and footers fields match the screen shot below.
□ Type “Competition Locator Report” in the Report Title (optional) text box.
□ Click Execute.
ESRI 51 of 79

Examining the Locator Report below allows you to understand where your competitors are and how they might influence your market share. Some organizations locate new sites within a certain distance to a competitor, who provides similar goods or services, hoping that clients will travel the shorter distance to their site rather than the greater distance to another of the competitor’s sites.
ESRI 52 of 79

The Market Penetration tool provides a method to examine how well you are reaching your market areas. The number of customers in each area is divided by the total number of people in each area to give you a percentage of your market penetration or alternatively described as market share. The Market Penetration tool calculates the percentage of customers for each feature in the Geography Level. The denominator in the percent penetration of customers can be any Business Analyst variable. In most cases, this variable will be total households or total population, but you can also use the Consumer Expenditure data provided with Business Analyst Server to determine market share. This tool can be used to examine the percentage of customers for each Block Group in your study area. The map layer that is generated with this action will highlight areas of good penetration and highlight other areas where you are not capturing much market share. The first step is to geocode your customer data.
ESRI 53 of 79

□ Click Actions and click Add Customers.
□ Type “SF Customers” in the Customer Layer Name text box.
□ Click the Uploaded Table drop-down arrow and click sf_custs
□ From the Address Input Fields match the Geocode Fields to the associated Table Fields drop-down list.
□ Click the Store ID Field drop-down arrow and click STORE_ID.
□ Click Execute.
Your customer layer has now been geocoded and added to your Display in map drop-down menu. The next step is to calculate your market penetration. In this example you will calculate how well your customer points penetrate the Total Households of the market.
□ Click the SF Customers layer name that is available in the Display in map section. This will cause the map view to zoom in around the customers.
□ Click Actions and click Market Penetration.
□ Type “Market Penetration” in the Trade Area Name text box.
ESRI 54 of 79
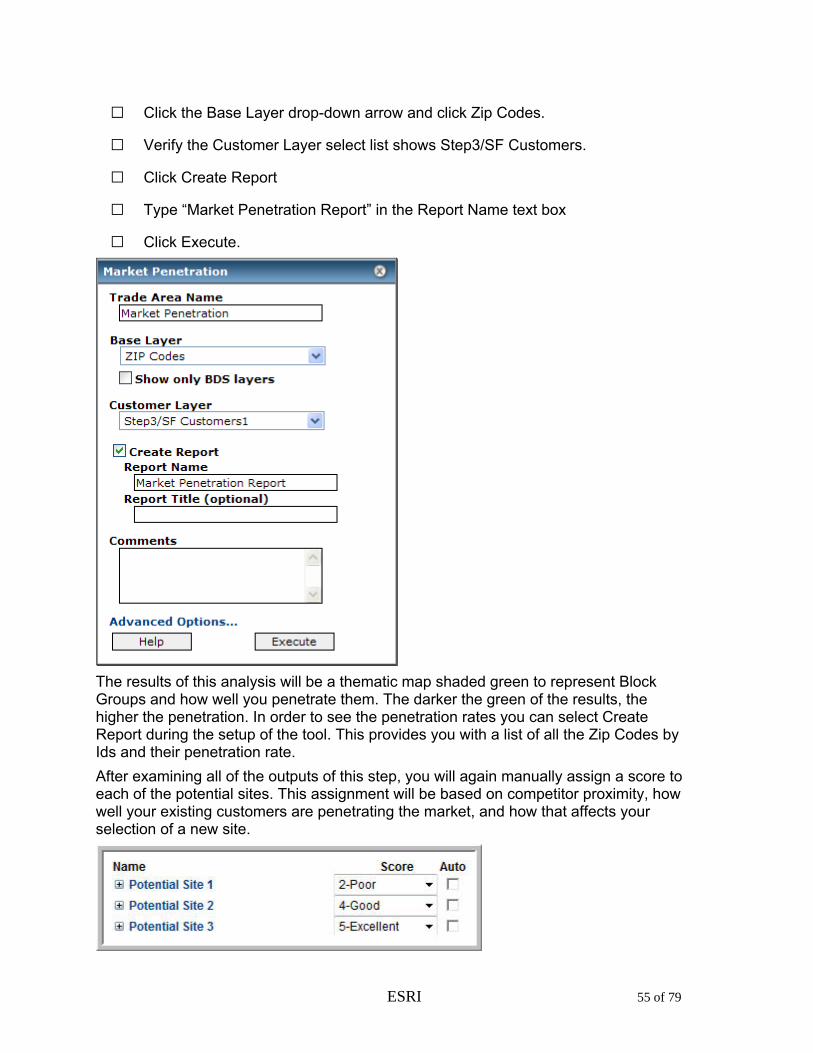
□ Click the Base Layer drop-down arrow and click Zip Codes.
□ Verify the Customer Layer select list shows Step3/SF Customers.
□ Click Create Report
□ Type “Market Penetration Report” in the Report Name text box
□ Click Execute.
The results of this analysis will be a thematic map shaded green to represent Block Groups and how well you penetrate them. The darker the green of the results, the higher the penetration. In order to see the penetration rates you can select Create Report during the setup of the tool. This provides you with a list of all the Zip Codes by Ids and their penetration rate. After examining all of the outputs of this step, you will again manually assign a score to each of the potential sites. This assignment will be based on competitor proximity, how well your existing customers are penetrating the market, and how that affects your selection of a new site.
ESRI 55 of 79

Step 4: Identify how new locations will cannibalize existing stores In this step, scores will be generated automatically by determining how potential new store locations cannibalize existing facilities. NOTE: This step is only necessary if the author has set the Cannibalization Statistics tool to run manually during setup.
□ Click Actions and click Cannibalization Statistics.
□ Type “Cannibalization Statistics” in the Analysis Name text box.
□ Click the Potential Sites drop-down arrow and click ConfigStep1/Potential Sites.
□ Click the Potential Sites TA drop-down arrow and click Step1/Potential Drive Time Polygons.
□ Click the Existing Sites drop-down arrow and click Step1/Existing Drive Time Polygons.
□ Click Execute.
ESRI 56 of 79

The scoring is done for you based on the outputs from previous steps. In this example, the amount of overlap (cannibalization) between trade areas automatically triggers scores for each potential site. The mechanics of how the amount of overlap translates to specific scores is described in the configuration and setup of the workflow section. Once all steps are finalized, a summary of the scoring of each step can be viewed by expanding the Evaluation Status dialog. This summary displays the scores of each step for each site.
ESRI 57 of 79

The Status drop-down menu allows you to define the viability of each site. You can choose from In Progress, Rejected and Accepted.
In Progress: The site has not been fully evaluated at this time or the user is undecided but the site will remain in the documents package. Rejected: The site is below the required standards for a new site and will be removed from the documents package. Accepted: The site meets the standards for a new site and will be added to the documents package for distribution.
Change Potential Site 1 to In Progress, Potential Site 2 to Rejected and Potential Site 3 to Approved.
Final Step: Documents Package Now that the each workflow step is complete, the output can be reviewed for final approval. The documents package will produce a scoring evaluation card for each site based on the results of each workflow step. To access the Documents Package, click the Documents Package icon from the task bar at the top of the Site Evaluation Workflow.
This displays the list of potential sites and a link for each Evaluation Scorecard. Additionally any documents you uploaded will be available under the General Documents link. Your outputs will vary so this document package may appear differently based on your selections and results during the site evaluation.
ESRI 58 of 79

The Evaluation Scorcard for each site provides a summary of the scores and an overall score of each site.
ESRI 59 of 79

How do you edit and configure an existing Site Evaluation workflow? This section provides guidelines on editing an ArcGIS Business Analyst Server workflow. Workflows provide a structured process for solving common business problems. This section shows how the default Site Evaluation workflow was created and explains how to edit the steps in the workflow. You can edit a workflow from the Edit Workflow dialog and the Workflow Manager. Editing from the Workflow Manager tool is recommended.
The Edit Workflow dialog can be accessed from within the Site Evaluation workflow. This dialog only allows edits to the Evaluation Steps and not the Configuration Steps. Edits to the Configuration Steps must be performed within the Workflow Manager. This is also the recommended way to edit a workflow type and save the edits to the project. The Workflow Manager tool allows global changes to the template being edited meaning all aspects of the workflow can be edited here. This is the recommended way to edit a workflow template and allows edits to be available independent of the
ESRI 60 of 79

project. It is important to note that each of these editing dialogs have different tools available. The Edit Workflow dialog has the tools to edit and configure the basic components of the Evaluation Steps and the Workflow Manager contains all the editing tools for workflows in ArcGIS Business Analyst Server.
How do you edit and configure an existing workflow type? If you want to edit an existing workflow type within a project, you can do so by opening the workflow. This approach only edits this workflow and the results will be saved in the currently active project.
□ Open the Analysis Center.
□ Click the Workspace drop-down arrow and click Default Workspace.
□ Click the Project drop-down arrow and click San Francisco Tutorial Project.
□ Click Site Evaluation.
□ Click the Show/Hide Advanced Tools icon.
A series of advanced tools appears to the right of the standard tools. These tools can be used by an author to configure and edit an existing workflow.
□ Click Edit Workflow and the Edit Workflow dialog appears.
ESRI 61 of 79

This dialog allows modifications to the Evaluation Steps and saves these modifications to the currently selected project. In this example, any edits will be saved to the San Francisco Tutorial Project. Each step in a workflow has several options for editing. You can remove entire steps or modify individual steps to better suit a business model.
□ To remove a step and the associated tasks completely, click the dash in the red circle next to the step.
For example, if you want to remove 3. Examine market favorability from the example above, click on the remove icon associated with this step.
□ Click Add new workflow to add a completely new workflow step. For example, if you want to add a 5th workflow step for Forecast sales and market share, click Add new workflow step.
□ To edit the name of a step, click the pencil icon next to the step. To edit the items contained within a step, expand the tree underneath the step. There are many editing options. The Add new section allows a user to add section types to the workflow step. You can choose from Map Layers, Attachments, Actions, and Reports.
• Map Layers allows you to turn on and off map layers generated during the step. In
addition new map services can be added as background maps for the workflow. • Attachments can only be added from within the workflow editor or from the
configuration steps. Once added, they can be viewed by the user from within the workflow. You can attach most document and image formats such as an aerial photograph of a site, a picture of a proposed store, a marketing plan, and a PDF of a
ESRI 62 of 79

rental agreement. • Actions provide quick links to any tool from with ArcGIS Business Analyst Server and
can be added from this section to be used in the workflow. For example, if a workflow has been completed and it was decided that Customer Derived Trade Areas would be beneficial in a particular step, adding an Action section provides the link to the Customer Derived Trade Areas tool to be accessible from within the workflow.
• Reports allow a user to access existing reports run from within the workflow or
create shortcuts to run new reports. The Evaluation Scorecard provides tools for the author to modify the automatic scoring for a workflow step although it does not contain tools for configuring an automatic scorecard from the ground up. In the Site Evaluation workflow, this is only done in Step 4. To setup or edit automatic scoring, the two components that contain the parameters of the automatic scoring are Native Columns and Join Tables tools. NOTE: A user can choose to manually score the items in Step 4. A Native Column is a column of the attribute table of the potential sites feature layer (the layer from which the evaluated items originated). Values of this column are used to score potential sites. The first step in defining an automatic scoring is deciding the variables to be used in the scoring process and how they will be scored.
□ Click Add new column from the Native columns menu.
□ Select the variable to be used in the scoring from the Table field drop-down menu.
If this value will be used in the final scoring, determine how it will be weighted and scored. This value is always read from the attribute table of the potential sites feature layer (numeric fields only).
ESRI 63 of 79

□ Click Yes or No under Use to calculate score to indicate if the user will use the added field in the automatic score calculation.
If No is chosen, the column will be shown in the scorecard for information purposes only and will not be used for calculation. The Scoring method defines how values from the attribute table will be mapped to the scoring scale. The Scoring Method dialog allows the user access to the custom intervals, equal intervals and natural breaks. The Custom Intervals method uses two approaches to map values onto the scoring legend:
Using percentage ratio of column values to max-min range interval.
ESRI 64 of 79

For example, let’s say there are 10 values in the column (10 rows in the attribute table): 2, 4, 5, 6, 7, 8, 9, 10, 11, and 12. The value 5 will be mapped (according to the mapping described on the screenshot above) to 3, because 5/(12-2) * 100%=50% which falls to the third class, the value 8 will be mapped to 4 score (upper boundary is included), and so on.
Using upper boundary in original units.
For example, this approach can be useful if the original values in a column are in percent units. Let’s say there are 5 values in the column: 20%, 30%, 60%, 70%, 80% (it can be, for instance, the values of maximum overlap of trade areas around 5 potential sites with trade areas around existing stores). Then the mapping given above will map the value 20% to score 4, 30% => 3, 60% => 2, 80% => 1.
ESRI 65 of 79

The two other scoring methods, Equal Intervals and Natural Breaks, use standard ESRI functions to map values from column to the corresponding classes.
The Equal Interval classification scheme divides the range of attribute values into equal-sized subranges, allowing you to specify the number of intervals while ArcMap determines where the breaks should be.
For example, if features have attribute values ranging from 0 to 300 and you have three classes, each class represents a range of 100 with class ranges of 0–100, 101–200, and 201–300. This method emphasizes the amount of an attribute value relative to other values, for example, to show that a store is part of the group of stores that made up the top one-third of all sales. It is best applied to familiar data ranges such as percentages and temperature.
Natural Breaks are classes based on natural groupings inherent in the data. These break points are identified by picking the class breaks that group similar values and maximize the differences between classes. The features are divided into classes with boundaries set where there are large jumps in the data values. After selecting the scoring method, click OK. The new column will be added to the scorecard.
A Joined Table is a repository item joined to the attribute table of the potential sites feature layer (it is an attribute table of an underlying feature layer belonging to the selected repository item) by an ID field, usually the Store ID, which is common for both feature layers. A column of this joined table can be used the same way as the native column and is called a joined column. Joined Tables is a more sophisticated approach to automatic scoring.
□ To join a new table, click Add new joined table.
□ In the Add New Joined Table dialog, select the repository item you are joining to the main attribute table (more specifically you are joining the attribute table of an underlying feature layer belonging to the selected repository item) and a field used to join the table by.
ESRI 66 of 79

□ Click OK and the new attribute table will be joined to the main attribute table. This new joined attribute table is empty until you add the appropriate columns to the table.
□ Click Add new column to add a new column to this joined attribute table.
The Table field drop-down menu allows you to place the calculated statistics into MAX, MIN, and AVG. Choose the appropriate field depending on how you want the statistics presented in the scorecard.
□ Click OK and the joined column will be added to the joined table. In the final step, select how you want the Cannibalization Statistics run. You can choose from Run manually, Run once on step opening, and Run as soon as valid.
ESRI 67 of 79

Run manually: A user should open the corresponding step then go to the Actions menu and click on the corresponding action. The task will open with the preconfigured values which are taken from layer aliases configured via the workflow configuration steps.
NOTE: If a user has not assigned actual layers to the layer aliases used in the task then the values of the parameters will not be set.
Run once on step opening: The action will be automatically run once when a user opens the corresponding step if all aliases used in the action were assigned (in configuration steps) to actual data. Run as soon as valid: The action will be automatically run once when a user clicks OK or Apply in the configuration popup, if all the aliases used as parameters of the action are assigned to actual layers, and are valid.
In the Edit Workflow dialog, the Scoring Legend displays a list the possible scores to be assigned to a site during the Site Evaluation workflow. These scores can be manually edited by clicking the edit section icon. Scores cannot be added or removed; however, the names of the scores can be edited. In the default Site Evaluation workflow, steps 1-3 are setup to be manually scored so advanced scoring (or the Evaluation Scorecard) is not necessary during these steps unless the author incorporates it.
ESRI 68 of 79

How do you edit a workflow template? The Workflow Manager, having the same tools as the Evaluation Steps, also allows edits to the Configuration Steps. Any edits within the Workflow Manager are global edits and are not linked to a specific project. Any edits made with the Workflow Manager will be available to anyone using the workflow template.
The Workflow Manager can be accessed directly from the Analysis Center and can also be accessed from within the workflow from the upper right of the working project.
□ Click Workflow Manager.
The Edit Template gives the author complete access to the all aspects of the default Site Evaluation workflow. The Delete Template permanently removes the template from the repository. Be careful when deleting a template as they cannot be recovered. The Copy Template copies the selected template into the repository. Note: Verify that the Workspace drop-down menu has the Default workspace selected and the Project drop-down menu has the San Francisco Tutorial Project selected. In order to view and edit the default Site Evaluation workflow click Edit Template.
□ Click the Workflow Type drop-down arrow and click Evaluation. The Workflow type displays a list of the available default workflow scenarios loaded into ArcGIS Business Analyst Server. Additional workflow types can be generated outside of the Workflow Manager and also appear here.
ESRI 69 of 79

□ Click the TemplateName drop-down arrow and click Default Site Evaluation. In this example, once selected the Edit Template dialog changes to reflect the default settings of the Site Evaluation workflow and provides editing tools to customize the template selected.
Unlike the Scoring Legend from within the Workflow Editor, the Base Scoring Legend can be edited to remove a score, edit the name of a score, or add additional scores. These scores are used in each workflow step to evaluate how each site compares to the other. For example, site A may have good visibility while site B may have poor visibility.
□ Click Add new base score.
ESRI 70 of 79

This action allows a user to add a new scoring value to the workflow.
□ Type in the name or value of the score and it will be added to the Base Scoring Legend.
□ A user can remove an existing score by clicking the dash in the red circle.
□ To edit an existing score, click the pencil icon. The Configuration Steps of the Site Evaluation workflow example requires that the Existing, Potential and Competitor sites be identified and loaded during the Configuration Steps before the user can start an analysis. In addition any attachments required for visual analysis, such as marketing reports or floor plans, need to be uploaded in advance.
□ To add additional steps to the workflow, click Add new configuration Layer Aliases provides the author with the ability to configure the parameters needed to run the Automatic scoring of the Cannibalization Statistics tool.
ESRI 71 of 79

Step 4 of the Evaluation Steps of this default Site Evaluation workflow consists of the Cannibalization tool. Aliases must be defined in the Configuration Steps in accordance to requirements of the tool. To run properly, it requires an ID, Name, and an Address field from the Potential and Existing site layers.
The Cannibalization Statistics tool also requires the layers that represent the cannibalization. In the case of the Site Evaluation workflow the Potential Sites, the Potential Sites trade area and the Existing Sites trade area are required. These trade areas can be simple rings or drive times while the configuration steps can be modified to
ESRI 72 of 79

include any trade area generation tool by using the Add new action tool from within the workflow manager.
NOTE: The Evaluation steps accessed from the Workflow Manager are not addressed in this section because they are identical to the ones described under the Edit Workflow dialog.
How are Site Evaluation workflows saved in order to be accessed by all users? Site Evaluation workflow global edits will only be reflected if a user creates a new workflow or resets an existing Site Evaluation workflow. Edits created in the Edit Template dialog will only be saved to the Default Site Evaluation workflow template. Additionally, any outputs saved to an existing Site Evaluation workflow will be cleared from that workflow, will be stored in the projects contents, and can be recovered and reloaded into the workflow from within the Site Evaluation. To create a new Site Evaluation workflow based on recent edits:
□ Click Create Workflow from the Workflow Manager.
□ Click the Workflow Type drop-down arrow and click Evaluation.
□ Click the Workflow Template drop-down arrow and click Default Site Evaluation.
□ Change the Workflow Name and Description fields to reflect your project.
□ Click Ok.
ESRI 73 of 79
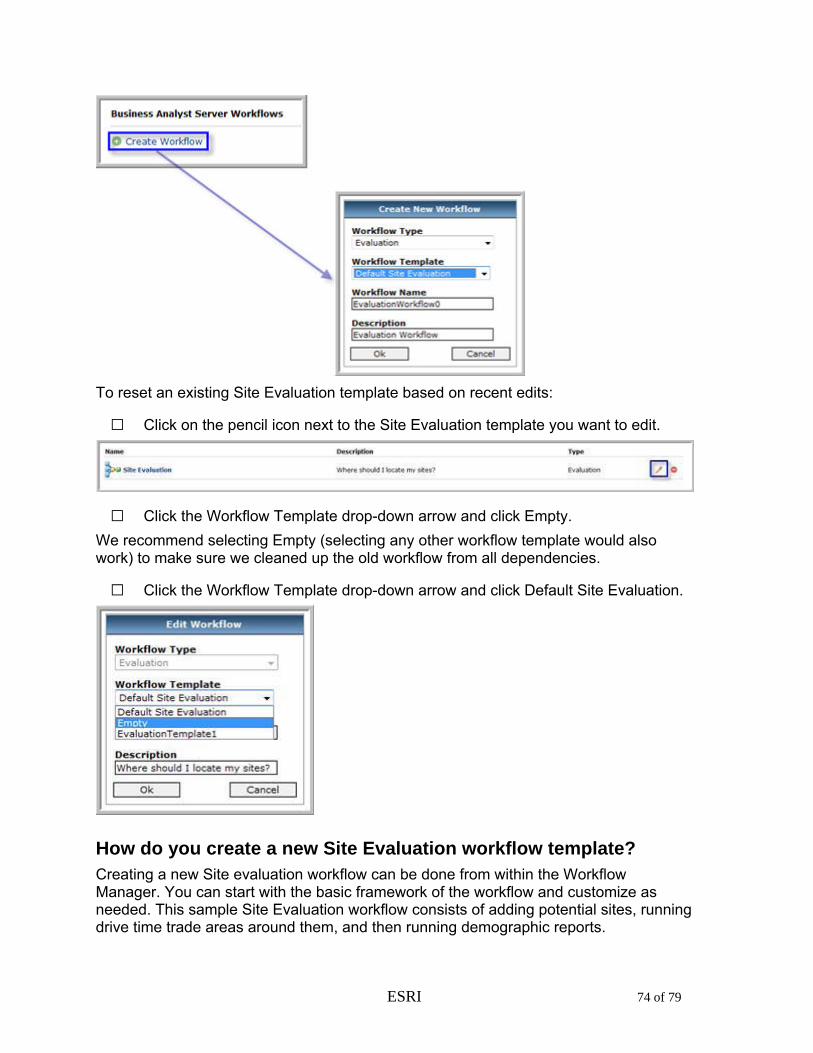
To reset an existing Site Evaluation template based on recent edits:
□ Click on the pencil icon next to the Site Evaluation template you want to edit.
□ Click the Workflow Template drop-down arrow and click Empty. We recommend selecting Empty (selecting any other workflow template would also work) to make sure we cleaned up the old workflow from all dependencies.
□ Click the Workflow Template drop-down arrow and click Default Site Evaluation.
How do you create a new Site Evaluation workflow template? Creating a new Site evaluation workflow can be done from within the Workflow Manager. You can start with the basic framework of the workflow and customize as needed. This sample Site Evaluation workflow consists of adding potential sites, running drive time trade areas around them, and then running demographic reports.
ESRI 74 of 79

□ From the Analysis Center, click Workflow Manager.
□ From within the Workflow Manager, click Create New Template.
NOTE: Creating a new template will make this workflow template in any Project.
□ Type “Sample Site Evaluation Template” in the New Template Name text box. You will see all the basic template information that is saved to the Empty template. These items can be removed or modified.
□ Leave the Base Scoring Legend unchanged.
□ Expand Configuration Steps.
□ Remove Step 1 Identify existing stores.
□ Remove Step 2 Identify competitors. In this example you will analyze the potential sites based on drive times leaving the settings in the default mode for the Identify potential sites.
ESRI 75 of 79

□ From the Evaluation Steps, click Add new workflow step.
□ Type “Identify and examine drive time cannibalization” in the Workflow Step Name text box.
□ Click Ok. Once a step is added, you must decide how this step is going to be implemented. In this example you will run drive times only around the potential sites and visually inspect the sites for cannibalization while manually scoring each site based on the information provided. Because automatic scoring is not needed, and only an action is required, you will be adding in an action for calculating drive time polygons.
□ Expand Identify drive time cannibalization.
□ Click Add New Section.
□ Click the Section type drop-down arrow and click Actions.
□ Click Ok.
ESRI 76 of 79
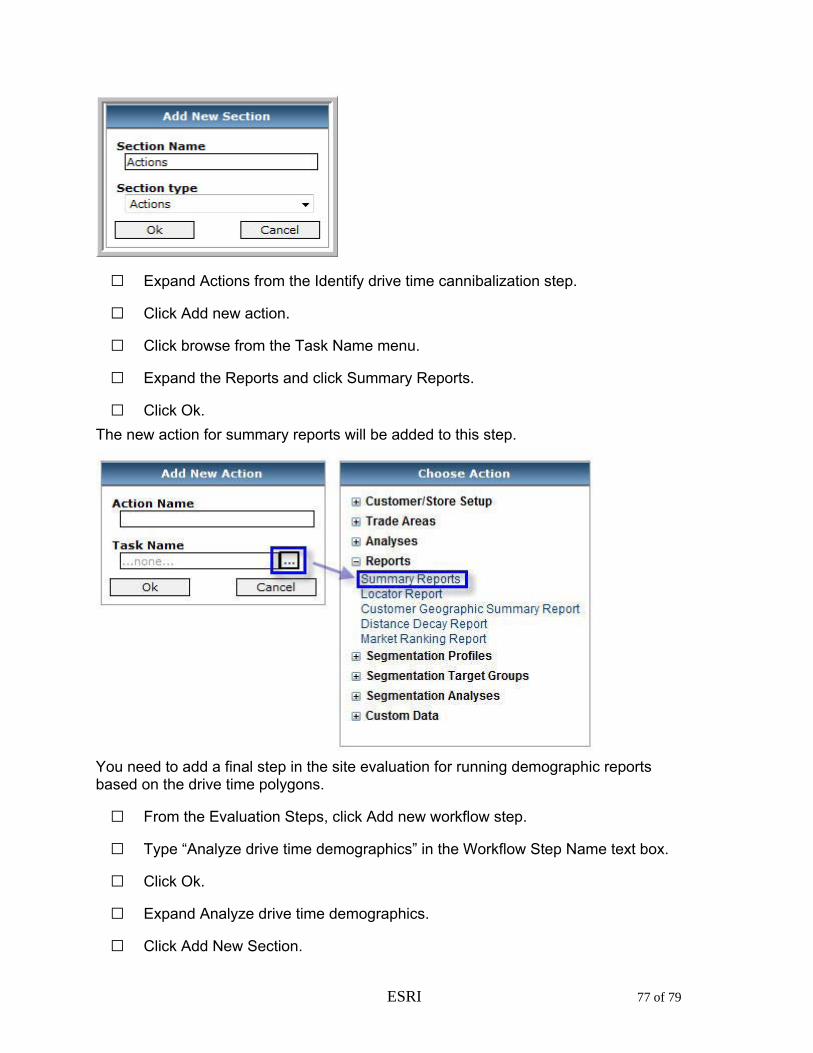
□ Expand Actions from the Identify drive time cannibalization step.
□ Click Add new action.
□ Click browse from the Task Name menu.
□ Expand the Reports and click Summary Reports.
□ Click Ok. The new action for summary reports will be added to this step.
You need to add a final step in the site evaluation for running demographic reports based on the drive time polygons.
□ From the Evaluation Steps, click Add new workflow step.
□ Type “Analyze drive time demographics” in the Workflow Step Name text box.
□ Click Ok.
□ Expand Analyze drive time demographics.
□ Click Add New Section.
ESRI 77 of 79

□ Click the Section type drop-down arrow and click Actions.
□ Click Ok.
□ Expand Actions from the Identify drive time cannibalization step.
□ Click Add new action.
□ Click browse from the Task Name menu.
□ Expand Trade Areas then expand No customer data required and click Drive Time Polygons.
□ Click Ok.
□ Click Ok in the Create New Template dialog. The new template doesn’t appear automatically in your list of available workflows in the Workflow Manager. This is because you created a new template that will be available in any project. You will need to add this new workflow template to this project.
□ Click Create Workflow.
□ Click the Workflow Type drop-down arrow and click Evaluation.
□ Click the Workflow Template drop-down arrow and click Sample Site Evaluation Workflow.
□ Type “Sample Site Evaluation” in the Workflow Name text box.
□ Click Ok.
The new template you created in the Workflow Manager appears and is available from within the Analysis Center for use.
□ Click Sample Site Evaluation to launch the new workflow.
ESRI 78 of 79

ESRI 79 of 79