arbs 2021 proceedings 8 annual conference held virtually
TRANSCRIPT
ARBS 2021 Proceedings
8th Annual Conference
Held Virtually on March 26, 2021
Hosted by Eastern Kentucky University
Richmond, KY
Edited by:
Kristen Wilson
Eastern Kentucky University

Proceedings of the Appalachian Research in Business Symposium, Eastern Kentucky University, March 26, 2021 2
2021 Appalachian Research in Business Symposium
Conference Committee:
Lakshmi Iyer, Appalachian State University
Kristen Wilson, Eastern Kentucky University (Conference Chair)
Prasun Bhattacharjee, East Tennessee State University
Monica Wei, Marshall University
Benjamin Thomas, Radford University
Steve Ha, Western Carolina University
It is our pleasure to present the Proceedings of the 8th Annual Appalachian Research in Business
Symposium from the 2021 conference. The conference was held virtually on March 26, 2021,
hosted by the College of Business at Eastern Kentucky University.
The Appalachian Research in Business Symposium provides a venue for presenting new
research, discovering contemporary ideas, and building connections among scholars at
Appalachian State University, Eastern Kentucky University, East Tennessee State University,
Marshall University, Radford University, and Western Carolina University.
Acknowledgements:
The Conference Committee for the 2021 Appalachian Research in Business Symposium wishes
to extend our gratitude to all authors, presenters, conference contributors, and volunteers for their
time and effort in service to the conference. As always, we are grateful for the continued support
from all for this engaging, research-driven conference.

Proceedings of the Appalachian Research in Business Symposium, Eastern Kentucky University, March 26, 2021 3
Website, Registration, and Conference Planning:
Tom Erekson
Mike Hawksley
Trish Isaacs
Heather Morris
Marcel Robles
Sandy Taylor
Kristen Wilson
Reviewers:
Appalachian State University
Dave McEvoy
Erich Schlenker
Hoon S. Choi
Jason Xiong
Rajat Panwar
Eastern Kentucky University
Ben Woodruff
Fatima Hasan
Jim Fatzinger
Lee Allison
Marcel Robles
Michael Fore
Tom Martin
East Tennessee State University
Allen Gorman
Kent Schneider
Michael McKinney
Prasun Bhattacharjee
Robert Beach
William Trainor
Marshall University
Ben Eng
Kevin Knotts
Mohammad Karim
Nabaneeta Biswas
Ralph E. McKinney, Jr.
Tyson Ang
Yi Duan
Radford University
Angela Stanton
Benjamin Thomas
Jane Machin
Richard Gruss
Zachary Collier
Western Carolina University
Audrey Redford
Charles Scott Rader
Heidi Dent
Marco Lam
Sanjay Rajagopal
Proceedings Editor:
Kristen Wilson

Proceedings of the Appalachian Research in Business Symposium, Eastern Kentucky University, March 26, 2021
4
Table of Contents
Team-Based Learning in Marketing ..................................................................... 6 Atkins, Kelly, East Tennessee State University Starnes, Hannah, East Tennessee State University
What is the Relationship Between International Trade and Migration?......... 11 Bhandari, Jagdeep, East Tennessee State University
Toward True Price-to-Risk Matching: The Importance of Risk-Based
Pricing and Transparent Subsidies in a Sustainable Insurance Market
for Inland Flood ..................................................................................................... 18 Browne, Madison, Appalachian State University Medders, Lorilee, Appalachian State University
MU Access: Accessibility Curricula Collaboration Fostering
Employable Student Skills .................................................................................... 24 Christofero, Tracy, Marshall University Howard, Lori, Marshall University McKinney, Ralph, Marshall University
Measurement and Tracking of Project Activity Quality Based on Time
and Cost Indicators ............................................................................................... 32 Collier, Zachary A., Radford University Lambert, James H., University of Virginia
The Progressive Effects of a Robust Supply Chain Ecosystem in Driving
Economic Development and Entrepreneurship ................................................. 38 Easterling, James Kirby, Eastern Kentucky University Fatzinger, Jim, Eastern Kentucky University
A Comparison of Learning Outcomes From Online and Face-to-Face
Accounting Courses at a Four-Year University ................................................. 44 Faidley, Joel K., East Tennessee State University
Go It Alone: The (Lack of) Impact of the Payroll Protection Plan on
Solo Law Practitioners in Rural Kentucky ......................................................... 53 Fore, Michael S., Eastern Kentucky University
Employment Challenges for People With Disabilities in Appalachia: A
Community Approach .......................................................................................... 59 Howard, Lori, Marshall University Christofero, Tracy, Marshall University McKinney, Ralph, Marshall University

Proceedings of the Appalachian Research in Business Symposium, Eastern Kentucky University, March 26, 2021
5
Small Business and COVID-19: A Train Wreck on “Main Street” ................. 64 Lahm, Robert J., Western Carolina University
Exploring Moderating Effects of Personality on Satisfaction and
Loyalty .................................................................................................................... 70 Leon, Steven, Appalachian State University Leon, Abigail, Watauga High School
Innovative Leadership: Breaking Constraints ................................................... 77 Martin, Thomas, Eastern Kentucky University
An Initial Look at Patterns of Appellate Decisions in Employment
Related Cases ......................................................................................................... 82 McKinney, Michael, East Tennessee State University Gorman, C. Allen, East Tennessee State University
The Impact of Typos on Brand Perception and Business Reputation.............. 86 Robles, Marcel, Eastern Kentucky University
Predicting Groundwater Fluctuations in Badgaon of the Dharta
Watershed in India – A study of Machine Learning Algorithms and
Hard Rock Watersheds ......................................................................................... 89 Stocker, Matthew, Appalachian State University Iyer, Lakshmi, Appalachian State University Maheshwari, Basant, Western Sydney University
The Risks of Extra-Role (Citizenship) Behaviors ............................................... 98 Thomas, Benjamin, Radford University Kopf, Jerry, Radford University
Understanding Computer Health and Fear Appeals via the Protection
Motivation Model ................................................................................................ 103 Wilson, Kristen, Eastern Kentucky University
Hotel Hurricane Options .................................................................................... 108 Woodruff, Ben, Eastern Kentucky University
Small-Scale Crisis Events Impact on Price Discovery and Volatility
Transmission Across Financial Markets: Evidence From Terror
Attacks, Assassinations, North-Korean Saber-Rattling, and Natural
Disasters ............................................................................................................... 117 Woodruff, Ben, Eastern Kentucky University Jackson, Thad

Proceedings of the Appalachian Research in Business Symposium, Eastern Kentucky University, March 26, 2021
6
Team-Based Learning in Marketing
Kelly G. Atkins, Ph.D.
Associate Professor
Department of Management and Marketing
College of Business and Technology
East Tennessee State University
Box 70625
Johnson City, TN 37614
423.439.5384 (Contact Author)
Hannah N. Starnes, M.S.
Instructor
Department of Management and Marketing
College of Business and Technology
East Tennessee State University
Box 70625
Johnson City, TN 37614
423.426.3425
Key words:
Team-based learning, teamwork, accountability, satisfaction
Introduction
The National Association of Colleges and Employers (NACE) conducts annual employer surveys
about the most important resume attributes to employers. Over the last ten years, the “ability to
work in a team” has been one of the top three skills employers are seeking ("Key Attributes,"
2020); therefore, it is absolutely necessary that university programs assist students in the
development of teamwork skills that will enable them to work collaboratively with others in the
workplace (Betta, 2016; Pate, 2020). Are professors of higher education adequately preparing
marketing students with the teamwork skills to be successful in the workplace? Industry experience
through internships and group assignments in the classroom may be utilized to develop effective
communication skills and the ability to interact with groups (“The Key Skills,” 2017) but is this
enough training and development to meet the needs of employers?
The purpose of this case study is to share professional experience using team-based learning (TBL)
in a marketing course and to identify best practices reviewed in the literature for enhancing student
learning through TBL. As marketing students prepare for careers in the industry, experience

Proceedings of the Appalachian Research in Business Symposium, Eastern Kentucky University, March 26, 2021
7
working collaboratively in the classroom increases student confidence and the ability to function
effectively on teams in the workplace.
Literature Overview
Group work is expected in schools of business by the Association to Advance Collegiate Schools
of Business (AACSB). Accreditation standard 4: Curriculum encourages experiential learning
opportunities and active engagement of students in learning (“Guiding Principles and Standards,”
2020). This learning model includes team-based projects. The TBL method requires student
accountability to the instructor and peers through a grading system made up of multiple
components: individual preparation and performance; collective preparation and performance; and
peer-assessment and evaluation (Cestone, Levine & Lane, 2008).
Fink (2013) recommended TBL in a “particular sequence of activities that transforms groups into
teams and then uses the extraordinary capabilities of teams to accomplish a high level of content
and application learning” (p. 148). This method requires that students read the relevant material
on their own, come to class to take a test on the material individually and in a group, and then
spend a significant amount of time working in small groups on application exercises (Fink, 2013).
The TBL strategy contains frequent small-group interaction to increase students’ ability to apply
course content and to develop self-managed learning teams (Michaelsen, Sweet & Parmalee,
2008). Betta (2016) also found an increased level of interdependence between the team and
individual using the TBL method.
Methodology
Inspired by a workshop conducted at the researchers’ university by Dr. Dee Fink on “Designing
Courses for More Significant Learning,” the authors used the TBL approach to revitalize a
traditional lecture-based marketing course with more active learning strategies. At the beginning
of the course, the instructor formed heterogeneous teams of 3-4 students. The three phases for each
of the ten units throughout the semester were: Phase 1 - independent study to master identified
content, Phase 2 - readiness assurance tests, and Phase 3 - application of course concepts.
The instructor posted guided note-taking sheets on the university’s online course management
system for the assigned chapters before each Readiness Assessment Test. In Phase 1, students were
to read the assigned textbook chapters, take notes, and study the material prior to class. In Phase
2, the instructor and graduate assistant administered the Individual Readiness Assessment Test
(iRAT) and Group Readiness Assessment Test (gRAT) during class. After each gRAT test, the
instructor took time to resolve any queries or misconceptions about the assigned reading materials.
Student RAT grades were calculated from individual (iRAT) scores and group (gRAT) averages.
After completing Phase 2, students began the designated group application activity. The Phase 3
in-class or out-of-class application activities (related to the applicable chapter) were due at the end
of the class for the date assigned. After completing Phase 1, 2 & 3 for all ten units, students used
the skills they had obtained to create and construct two visual displays of apparel products for their
final projects. Each group turned in an electronic "scrapbook" photographically documenting the

Proceedings of the Appalachian Research in Business Symposium, Eastern Kentucky University, March 26, 2021
8
entire process as well as the final displays. Each student also turned in an individual written
summary/evaluation of the group displays.
The first year the TBL marketing course was offered, the instructor gathered feedback from
students through a written student reflection after unit four, a focus group interview at mid-term,
and a survey for student assessment of team-based learning at the end of the semester. The second
year, the instructor gathered student reflections after unit four and a survey for student assessment
of TBL at the end of the semester.
The Team-Based Learning Student Assessment Instrument (TBL-SAI), used with permission from
Heidi A. Menninga, provided student feedback about accountability, preference for TBL learning,
and student satisfaction. The TBL-SAI questionnaire employed a Likert-type scale (1=strongly
disagree to 5=strongly agree) to assess these constructs. The collected data was input into SPSS
for evaluation and assessment.
Results and Implications
The first year, the survey participants consisted of fourteen students (n=14), and in the second year
there were six participants (n=6), for a total of twenty participants in this case study (n=20). Of the
participants surveyed, 80% were female, 75% were Caucasian, 80% were juniors, and 90% were
between ages 20-22.
Notable findings related to student accountability: 85% of participants indicated that “ I spent time
studying before class in order to be more prepared” and that “I feel I have to prepare for this class
in order to do well.” Similar data were not collected from traditional lecture classes to compare to
this study, but the TBL learning method used in this case study is believed to have significantly
increased student preparation. In addition, 90% of respondents reported, “I contribute to my team
members’ learning.” This can be used as one indication of teamwork effectiveness.
Notable findings related to student preference for TBL learning include: 80% of participants agree
or strongly agree with the statements, “I remember information longer when I go over it with team
members during the gRAT used in team-based learning” and “I easily remember what I learn when
working in a team.” Similarly, 80% of participants reported that TBL activities helped information
recall. In contrast, 70% of respondents indicated, “It is easier to study for tests when the instructor
has lectured over the material.” The researchers infer from the data that the students recognize the
value of the TBL environment but might prefer when the instructor lectures because the it does
not require as much of them and it is easier or faster to take notes during lectures. Further
investigation is needed to understand exactly why students think that studying for tests is easier
when the instructor lectures.
Related to student satisfaction, 80% of respondents indicated “I enjoy team-based learning
activities” and 60% indicated “I learn better in a team setting” yet only 55% of respondents
indicated they strongly agree or agree to “I had a good experience with team-based learning.”
These responses indicate that participants may need additional tools or more assistance from the
instructor on effective group interaction and participation.
Proceedings of the Appalachian Research in Business Symposium, Eastern Kentucky University, March 26, 2021
9
Only five students provided written comments about the TBL learning experience. These written
comments included both positive and negative feedback. One student stated, “Team-based learning
is incredibly frustrating to me. I would rather work by myself. It has affected my learning this
semester as well as my grade.” Another student commented, “I thoroughly enjoyed the iRATs and
gRATs. They were a good, exciting, and more fun way to learn.” Fifteen participants did not
provide any written comments. In future studies, written comments to support the Likert-type
survey evaluations could be required.
Conclusion
The TBL approach the researchers used in this marketing course required a drastic revision of
course exams and activities causing the instructor and the students to grow from the experience.
In the future, the instructor will work to explain the value of the TBL course structure more
thoroughly and discuss its application to industry. The instructor will also assist groups with
effective group communication tools and provide additional time for out-of-class activities and
assignments.
Limitations of this case study include the small sample size and the fact that data were collected
at only one university. In addition, the effect of TBL on student grades could not be measured
because this course was previously taught by another professor who has since retired and student
grades were not available. Suggestions for further research studies include applying the TBL
structure in additional marketing courses. Results could differ depending on the course content
and instructor style of teaching. Another suggestion is to examine student grade improvement in
relation to TBL accountability and satisfaction. Finally, researchers could follow these participants
into the workplace and seek employer feedback about the effectiveness of student teamwork skills
as compared to students without TBL courses.
References
2020 guiding principles and standards for business accreditation. (2020). AACSB Business
Accreditation Standards. https://www.aacsb.edu/-
/media/aacsb/docs/accreditation/business/standards-and-
tables/2020%20business%20accreditation%20standards.ashx?la=en&hash=E4B7D8348A6860B
3AA9804567F02C68960281DA2
Betta, M. (2016). Self and others in team-based learning: Acquiring teamwork skills for
business. Journal of Education in Business, 91(2), 69-74.
Cestone, C.M., Levine, R.E., & Lane, D.R. (2008). Peer assessment and evaluation of team-
based learning. New Directions for Teaching and Learning, 116, 69-78
Fink, D. (2013). Creating significant learning experiences: An integrated approach to designing
college courses. Jossy-Bass.

Proceedings of the Appalachian Research in Business Symposium, Eastern Kentucky University, March 26, 2021
10
Key attributes employers want to see on students’ resumes. (2020). NACE's Job Outlook 2020.
https://www.naceweb.org/talent-acquisition/candidate-selection/key-attributes-employers-want-
to-see-on-students-resumes/
Michaelsen, L., Sweet, M. & Parmalee, D. (2008). Team-based learning: Small group learning’s
next big step. New Directions for Teaching and Learning, 116, 7-27.
Pate, D.L. (2020). The top skills companies need most in 2020- and how to learn them. LinkedIn
Learning. https://www.linkedin.com/business/learning/blog/top-skills-and-courses/the-skills-
companies-need-most-in-2020and-how-to-learn-them
The key skills employers develop in their interns. (2017). NACE Internships.
https://www.naceweb.org/talent-acquisition/internships/the-key-skills-employers-develop-in-
their-interns/

Proceedings of the Appalachian Research in Business Symposium, Eastern Kentucky University, March 26, 2021
11
What is the Relationship Between International Trade and
Migration?
Jagdeep S. Bhandari
Department of Economics and Finance
East Tennessee University
312 Sam Wilson Hall
Johnson City, TN 37614
423.439.4416
Key words:
Immigration, International Trade, Voter Attitudes, Symmetrical or Inconsistent
Introduction
There have been few issues that have consistently occupied the attention of policy makers and
citizens of most developed countries than in international migration and to a lesser extent,
corporate globalization and international commerce. Election campaigning in the US in 2008, 2016
and 2020 has been strongly influenced by the stated position of candidates on migration and
asylum policies. In Europe too, once - fringe political parties with strong anti-immigrant or
populist views have gained legislative power in several countries such as France, Denmark and
Austria.
Although corporate globalization and international trade have pre-occupied the attention of some
segments of the labor force international trade, while pervasive in its effects is largely ubiquitous.
Nor have the public or policy makers in the US viewed migration and trade and closely related in
their effects. In Europe, both trade in goods/services and capital were liberalized along with free
mobility of persons, but this was more the result of ideological allegiance to the notion of single
European market, rather than articulated economic reasons.
This dichotomized view of trade and migration among policy makers has not been replicated
among professional economists, political scientists or public choice theorists. Specifically, and
while not initially focused on the relationship between trade and migration, early, classical trade
models predict a close relationship of substitutability between trade and migration.1 Thus,
1 This can be readily deduced from the simple version of the workhorse Heckscher Ohlin trade model. Basic
textbooks in trade do not typically present the model in these terms but the implication of substitutability between
trade and migration is very easily deduced. See for example, Krugman, Obstfeld and Melitz (2018), Feenstra and
Taylor (2019) among others.

Proceedings of the Appalachian Research in Business Symposium, Eastern Kentucky University, March 26, 2021
12
countries may choose to trade goods which leads to convergence of factor prices (wage and rental
rates) and reduced incentives to migrate internationally. Alternatively, with free migration (“open
borders”), factor prices also converge as do prices of goods, thus eroding the basis for trade. Trade
and migration are thus substitutes in these simple models. One may import tomatoes or tomato
pickers as one Mexican president famously said.
More complex trading structures embodying monopolistic competition, increasing returns to scale
or core-periphery models may complicate or reverse this strict substitutability relationship.2 I
mention some of these extensions below, but that is not the focus of this paper.
In this paper, I inquire into two issues that have been largely underdeveloped in the professional
literature. First, what is the relationship between regime type (liberal democracy v autocracy) and
the country’s chosen migration and trade regimes? For example, are liberal democracies more pro-
immigration and/or more pro-free trade or conversely. We discuss this first, from the perspective
of the expected relationship based upon socio-economic considerations. Thereafter, I examine
whether the predicted relationship between regime type and migration/trade policies is empirically
validated, even if indirectly. Second, I turn to a more microscopic examination of expected voter
preferences regarding migration and trade in rich v poor countries using interest group analysis.
Empirical testing of the predicted relationship is then discussed. There appears to be broad
consistency between predicted preferences and those expressed by voters or survey respondents.
Literature Review
There is ample literature on trade models/theories which imply a strict substitutability relationship
between trade liberalization and incentives to migrate. Most modern textbooks in international
trade such as Krugman, Obstfeld and Melitz (2018 and Feenstra and Taylor (2019) etc. discuss the
standard vintage models of trade, factor price equalization and the Samuelson-Stolper theorem
(dealing with the effects of trade or protection on factor distribution in the country). Modern
textbooks also explain the effect of more complex market structures such as monopolistic
competition, scale effects and geography and trade on the predicted pattern of trade and the implied
effects on incentives to migrate. See for example, Krugman (1992) and Helpman and Krugman
(1985).
Our focus in this paper is the type of political regime of a country and its trade/migration regimes.
Additionally, we also examine individual voter preferences over trade liberalization and migration
restrictiveness in countries with different regime types (democracies v autocracies). The seminal
work which codes regime types is by Boix (2002), later updated in Boix, Miller and Rosato (2012)
and Decker and Lim (2009). With respect to restrictiveness of immigration policy, Williamson and
his colleagues (Timmer and Williamson (1996), Williamson (2002), Hatton and Williamson
(2006) have published several articles on the political economy of immigration. Other references
include those on economic history by Williamson (2004 and 2006) and some general work related
to economic policies and regime types by Wintrobe (1998), Przeworski et al (2000) and Mulligan
(2004). A literature search reveals very few papers on regime type and immigration and trade.
These are Mirilovic (2005 and 2014) and Collins et al (1997) addressing the historical relationship
2 See for example, Bhandari (2010) and Del Rio and Thornworth (2009).

Proceedings of the Appalachian Research in Business Symposium, Eastern Kentucky University, March 26, 2021
13
between trade and migration policies. Finally, empirical data on voter attitudes is derived from
voter surveys or polls. Three are of note: those from the International Social Survey Programme,
the World Values Survey and the European Social Survey.3 There is also the Index of Economic
Freedom utilized by some researchers which provides rankings on freedom of trade and investment
policies of various countries.4 A survey of papers utilizing the indices of the Heritage Foundation
is contained in Hall and Lawson (2014). Finally, although not strictly related to my topic, an
interesting paper dealing with the impact of arriving immigrants in US economic institutions and
hence resistance to immigration is by Padilla and Cachanosky (2020.
Methodology
We (a) investigate the relationship between regime type and the nature of migration and trade
policies and (b) deduce the expected preferences over trade and migration at the individual level
and (c) compare these preferences with those revealed in the voter surveys referred to above.
Deducing the preferences of voters over trade and migration requires an analytical framework. I
have utilized the standard classical trade model. This model has the advantage of being well-known
and of yielding clear implications for voter preferences. When this baseline Heckscher-Ohlin
model is extended to include more complex market structures such as monopolistic competition,
increasing returns to scale or specific factors of production, preferences over trade and migration
become ill-defined because the underlying relationship between trade and migration is no longer
clear-cut.
Results and Implications
a. Consider first the relationship between regime type (i.e., liberal democracy v authoritarianism)
and migration policy (pro-immigration v restrictive). Although, it may initially seem surprising,
we should expect that authoritarian regimes (particularly those in rich nations) will adopt more
liberal immigration policies than their democratic counterparts. This is so for a number of reasons.
First, liberal democratic regimes are more responsive to the preferences of the median voter due
to the existence of contested elections. However, the median voter in most countries is only
moderately skilled with limited access to resources. Because most migrants happen to be low
skilled, the median voter and hence the government in liberal democracies is likely to oppose
further immigration which might threaten the median voter. This effect is absent in authoritarian
regimes in which meaningful voter franchise is limited.
There is a second reason for the expected pro-immigration stance of autocracies compared with
liberal democracies. This relates to the existence of the welfare state. Unskilled migrants require
welfare transfers, for example, food stamps, subsidized housing, medical care etc., all of which
impose fiscal and tax burdens on the democratic, receiving state. Such fiscal burdens can be more
3 For details regarding these surveys see, www.issp.org, www.worldvaluessurvey.org and
www.europeansocialsurvey.org. 4 See https://www.heritage.org/index/about

Proceedings of the Appalachian Research in Business Symposium, Eastern Kentucky University, March 26, 2021
14
easily avoided in authoritarian regimes. These factors mean that migration of younger, skilled
workers is likely to be encouraged by both liberal democracies and authoritarian regimes.
Are these predictions empirically corroborated? Using Boix’s listing of regime types and
utilizing the Timmer -Williamson index of restrictiveness of immigration policy at least until
1930, the validity of the principal hypothesis seems to be established, i.e., democratic regimes
are more likely to pursue restrictive immigration policies than their authoritarian counterparts.5
Cross section and panel data tests for the last quarter of the twentieth century also corroborate
this thesis.
Consider next the relationship between regime type and protectionism of trade policy. Work in
this area is even more limited than with respect to migration.6 Does broadening the voter franchise
lead to more liberal trade policies? The answer depends upon whether the median voter stands to
gain or lose from liberalized trade. While the benefits of trade are ubiquitous and widely dispersed,
its costs are visited upon the scarce factor whose relative returns fall in the standard trade model
through Samuelson-Stolper effects, In advanced countries such as the US and Canada, labor is the
scarce factor compared to capital and liberalizing trade is expected to draw opposition from the
median voter who has low to moderate labor skills. Thus, expanding the democratic franchise will
lead to pressure upon elected governments to restrict trade. Historical analysis by O’Rourke and
Taylor (2006) for 35 countries seems to indicate that the extent of democratic franchise is a
significant determinant of protectionism.
b. In this sub-section, I briefly conduct a more microscopic examination of individual preferences
over trade and migration. Such an exercise is only relevant to democratic liberal regimes, whether
rich or poor, since voter preferences are of marginal relevance in authoritarian regimes.
The standard trade model employs only two factors. For ease of exposition, assume these factors
to be skilled labor and unskilled labor. By definition, rich countries are abundant in skilled labor
and scarce in unskilled labor, while the opposite configuration prevails in poor countries. The
Samuelson-Stolper proposition thus yields the following predictions. Trade liberalization
(protection) benefits the abundant (scarce) factor everywhere. Hence, skilled labor is expected to
be pro-trade in rich countries while unskilled labor would tend to oppose trade liberalization
(which would lower wages of unskilled labor). In poor countries, the abundant factor is unskilled
labor and symmetrically, unskilled labor would support liberalized trade while skilled labor in such
countries would oppose it. Finally, because in the classic Heckscker-Ohlin framework, trade and
migration are complete substitutes, the same configuration of preferences over trade and migration
will prevail in each country, i.e., skilled labor is also pro-migration in rich countries and conversely
for unskilled labor.
These predictions can be conveniently summarized in the following:
Rich Country Poor Country
Skilled Labor pro-trade/pro-migration anti-trade/anti-migration
Unskilled Labor anti-trade/anti-migration pro-trade/pro-migration
5 Timmer and Williamson (1996). Over the period 1850-1930, the index of immigration restrictiveness for the major
democracies is only -0.16, while for authoritarian regimes it is much more liberal, i.e., 1.8 6 A few early exceptions are Morrow et al (1998) and O’Rourke and Taylor (2006).

Proceedings of the Appalachian Research in Business Symposium, Eastern Kentucky University, March 26, 2021
15
More complex trade structures such as monopolistic competition etc. can easily disrupt the
substitutability relationship between trade and migration. If so, the preference structure deduced
above would also be undermined. As of this time, while there is plenty of writing on complex trade
models (See Helpman and Krugman (1985) and Krugman (1992), the interest group analysis
developed above has not been extended to such models.
c. Are these implied preferences over trade and migration policy validated in practice? The three
surveys utilized in this paper are the World Values Survey, European Social Survey and
International Social Survey. With respect to migration, there appears to be some support in
expressed preferences for the predictions outlined above; the high skilled are less opposed to
migration than unskilled migration than the unskilled. However, contrary to the results described
in the chart, skilled labor everywhere (i.e. in rich and poor countries) is likely to be more liberal
with respect to migration than unskilled labor.7
Results with respect to sentiments about trade policy are broadly similar in voter surveys.8 While
nationalist sentiments may play a strong role in explaining voter attitudes toward protectionism,
better skilled workers, especially those in rich countries are likely to be pro-trade. Surprisingly,
there is robust evidence of a gender gap in both rich and poor countries with respect to trade
preferences. Women everywhere appear to be more protectionist compared with men at equivalent
skill levels.
Conclusion
This paper has dealt with the relationship between the type of political regime (i.e., liberal
democracy v autocracies) and the predicted posture of trade and immigration policies. We inquire
whether trade and migration regimes of democracies are more likely to be more liberal or
restrictive than those in autocracies or vice versa. We have also utilized interest group analysis to
conduct a microscopic examination of individual voter preferences over trade and migration in
rich v poor countries.
References
Bhandari, J.S. (2010). World Migration and Trading Regimes, Albany Gov’t. L. Rev. 3, 169-217
Bliss, H. and B. Russett (1998). Democratic Trading Partners: The Liberal Connection 1962-
1989, J. of Politics 60(4), 1126-1147
Boix, C. (2003). Democracy and Redistribution, Camb. U. Press
Boix, C., Miller, M. and S. Rosata (2012). A Complete Data Set of Political Regimes 1800-2007,
Comp. Political Studies 46(12), 1523-1554
7 See for example, O’Rourke and Sinnott (2006), Mayda (2006) and Hainmuller and Hiscox (2007). 8 See for example, O’Rourke and Sinnott (2006), Scheve and Slaughter (2001) and Mayda and Rodrik (2005) among
others.
Proceedings of the Appalachian Research in Business Symposium, Eastern Kentucky University, March 26, 2021
16
Borjas, G. (2011). Heaven's Door: Immigration Policy and the American Economy, Princeton U.
Press
Collins W., O’Rourke, K. and J. Williamson (1997). Were Trade and Factor Mobility Substitutes
in History, NBER Working Paper 6059
Decker, J. and J. Lim (2009). Democracy and Trade: An Empirical Study, Economics of
Governance 10, 165-186
Del Rio, A.M. and S. Thornworth (2009). Tomatoes or Tomato Pickers? Free Trade and
Migration Between Mexico and the United States, J. Applied Econ. 12(1), 109-134
Feenstra, R. and A.Taylor (2019). International Economics (4th ed.), Worth Publishers
Hall, J. and Lawson, R.A. (2014). Economic Freedom of the World: An Accounting of the
Literature, Contemporary Econ. Policy 32(1), 1-19
Hanson, G., Scheve K. and M. Slaughter (2005).Public Finance and Individual Preferences Over
Globalization Strategies, NBER Working Paper 11028
Hatton, T. and J. Williamson (2005). A Dual Policy Paradox: Why Trade and Migration Policies
Have Always Differed in Labor Scarce Economies, NBER Working Paper 11866
Heinmuller, J. and M. Hiscox (2007). Educated Preferences: Explaining Individual Attitudes
Toward Immigration in Europe, International Organization 61(2), 399-442
Helpman, E. and P. Krugman (1985). Market Structure and Foreign Trade, MIT Press
Krugman, P. (1992). Geography and Trade, MIT Press
Krugman, P., Obstfeld, M. and M. Melitz (2018). International Economics: Theory and Policy
(11th Ed.), Pearson Higher Education
Mayda, A. M. and D. Rodrik (2005). Why Are Some People More Protectionist Than Others?
European Econ. Rev. 49(6):1393-1430
Mayda, A.M. (2006).Who Is against Immigration? A Cross-Country Investigation of Individual
Attitudes toward Immigrants, Rev. of Econ and Stat. 88(3), 510-530
Mirilovic, N. (2010). Explaining the Politics of Immigration: Dictatorship, Developlment and
Defense, Comp. Politics 42, 273-292
Mirilovic, N. (2014). Regime Type, International Migration and the Politics of Dual Citizenship,
Inter. Pol. Sci. Rev. 36(5), 510-525

Proceedings of the Appalachian Research in Business Symposium, Eastern Kentucky University, March 26, 2021
17
Morrow, J.D., Silverson, R. and T. Tabares (1998). The Political Determinants of International
Trade: The Major Powers 1907-1990, Amer. Pol. Sci. Rev. 92(3), 649-661
Mulligan C., Gil, R. and Sala-i-Martin, X. (2004). Do Democracies Have Different Economic
Policies than Nondemocracies? J. Econ. Persp. 18(1), 51-74
O’Rourke, K. and R. Sinnott (2006). The Determinants of Individual Attitudes Toward
Immigration, European J. of Pol. Economy 22(4), 838-861
O’Rourke, K. and A. Taylor (2006). Democracy and Protectionism, NBER Working Paper 12250
Padilla, A. and N. Cachanosky (2020). Immigration, Economic Freedom, and Ideology, The
International Trade Journal 34(1), 5-17
Przeworski, A., Alvarez M. and J. Cheibub (2000). Democracy and Development, Camb. U.
Press
Scheve, K. and M. Slaughter (2001). What determines individual trade-policy preferences?
Journal of International Economics 54, 267–292
Timmer, A. and J. Williamson (1996). Racism, Xenophobia or Market: The Political Economy
of Immigration Policy Prior to the Thirties, NBER Working Paper 5867
Williamson, J. (2002). Winners and Losers Over Two Centuries of Globalization, NBER
Working Paper 9161
Williamson, J. (2004). The Political Economy of World Mass Migration: Comparing Two Global
Centuries, AEI Press
Williamson, J. (2006). Globalization and the Poor Perphery before 1950, MIT Press
Wintrobe, R. (1998). The Political Economy of Dictatorship, Camb. Univ. Press

Proceedings of the Appalachian Research in Business Symposium, Eastern Kentucky University, March 26, 2021
18
Toward True Price-to-Risk Matching: The Importance of Risk-
Based Pricing and Transparent Subsidies in a Sustainable Insurance
Market for Inland Flood
Madison Browne
Department of Finance, Banking & Insurance
Walker College of Business
Appalachian State University
416 Howard Street
Boone, NC 28608
828.262.6234
Lorilee Medders
Department of Finance, Banking & Insurance
Walker College of Business
Appalachian State University
416 Howard Street
Boone, NC 28608
828.262.6234 (Contact Author)
Key words:
Flood risk, insurance, catastrophe, price, subsidy
Introduction
Floods are the most common and destructive natural disaster in the United States, with 90 percent
of natural disasters involving floods. All 50 states have experienced floods or flash floods in the
past five years (National Association of Insurance Commissioners and Floodsmart.gov), and in
every state the majority of these events occurred inland. Inland flooding can result from multiple
sources – flash flooding, river flooding, the rainfall that accompanies tropical storms, dam
breaks/levy failure, snow melts and debris jams.
Mortgage lenders generally require flood insurance coverage for borrowers on homes that lie in
high-risk flood zones. The National Flood Insurance Program (NFIP) has been virtually the only
choice for residential flood insurance coverage since the 1960s. Despite significant flood risk, the
NFIP experiences low participation rates among homeowners – somewhere between 5 and 15
percent of homes overall and approximately 68 percent of properties located in Special Flood

Proceedings of the Appalachian Research in Business Symposium, Eastern Kentucky University, March 26, 2021
19
Hazard Areas (SFHAs) – and remains in a large financial deficit based on its risk (and loss)
portfolio of homes it has insured (NCRB, 2019; Insurance Information Institute, 2021).
Furthermore, inland communities subject to flooding risk are simultaneously more economically
vulnerable to flood losses and less able to pay for flood insurance than their coastal counterparts,
as evidenced by significantly lower median (and average) household incomes and property values.
We assert at least two changes for development of a healthy insurance system for flood, and more
specifically for inland flood: 1) match price commensurate with the risk being insured and 2)
provide premium subsidies based on both risk and financial need.
Literature Overview
Risk-based insurance pricing is predicated on the same concept as the pricing of other goods and
services – that a sustainable market charges prices that cover the “cost of goods sold” and in a
private market environment, allows for a reasonable profit. Insurance pricing is made more
complex than it might appear on the surface, however, since the “cost of goods sold” is unknown
until sometime after the originating insurance transaction. Actuarial and flood loss modeling are
employed by private insurers to estimate the losses that will result from underwriting property
risks, and these estimates are used for risk aggregation and insurance pricing.
There is ample literature in the fields of disaster risk and insurance economics indicating the price-
risk match within the insurance contract is important to optimize insurance availability and
reduction of the underlying risk, both broadly (Arrow, 1971; Doherty and Schlesinger, 1983;
Cummins, 1991; Harrington and Doerpinghaus, 1993; Harrington and Danzon, 2000; Eeckhoudt
and Schlesinger, 2006; and others) and more narrowly within catastrophe insurance contracting
(Kelly and Kleffner, 2003; Cole, Macpherson, McCullough, Newman and Nyce, 2011; Nyce and
Maroney, 2012; Carson, McCullough and Pooser, 2013; Medders, Nyce and Karl, 2014; Taylor
and Weinkle, 2020; among others). Yet there is also a sizable body of work establishing that in
cases of catastrophic risk – such as flood – lack of insurance affordability can be a barrier to
achieving a critical mass of insured customers and/or achieving societal goals (Viscusi, 1995;
Grace, Klein, Kelindorfer and Murray, 2003; Grace and Klein, 2009; Medders and Nicholson,
2018; and others). Insurance premium subsidization, as used in both the private and public risk
financing markets, can be used to improve insurance affordability. Yet, it is often used simply to
create cost shifts from high-risk to low-risk exposures rather than based on financial need or
economic vulnerability, thus resulting in non-optimal market outcomes and negative externalities
(Viscusi, 1995; Grace and Klein, 2009; Nyce and Maroney, 2012; Medders, Nyce and Karl, 2014;
Medders and Nicholson, 2018; among others).
The increase in the frequency of severe flooding events in the U.S., along with the NFIP’s historic
use of systematically inadequate pricing and heavy cross-subsidization (Hayes and Neal, 2012;
Horn, 2019), highlight the need for improvements in the flood insurance marketplace (Anderson,
1974; Kousky and Kunreuther, 2014; Fan and Davlasheridze, 2016; Born and Klein, 2019; and
others). The authors of the current research submit that flood insurance is insurable in the private
market today, and that the NFIP coverage (and/or other public insurance program) can be used as
a limited market of last resort for high-risk exposures. Furthermore, we assert that a premium
subsidy program, based on financial need rather than on flood risk alone, is feasible as a means to
enhance participation without underpricing or pricing inequitably.
Proceedings of the Appalachian Research in Business Symposium, Eastern Kentucky University, March 26, 2021
20
Methodology
The research is based on 1) case evaluation of the recently developed North Carolina Rate Bureau
(NCRB) Flood Insurance Program (North Carolina Rate Bureau, 2019); and 2) the authors’
proposal of a premium subsidy program that could be utilized on a needs basis for either or both
of the rating programs evaluated. Narrative analysis and descriptive statistics are used to uncover
and illuminate key points of the plan evaluation.
Results and Implications
North Carolina is a useful laboratory for examining and illustrating flood insurance market options
given its significant and increasing flood risk, its new risk-based flood insurance rate plan that is
usable by admitted insurers and replicable in states across the nation, its best practice flood
mapping efforts, and its socio-economic inequalities. A private market and premium structure have
been worked out (NCRB, 2019), showing that at least 94 percent of homeowners would pay less
under risk-based pricing than under NFIP pricing.
In the United States, 10.5 percent of households live at or below the federal poverty level of
$26,200. The percent is higher for North Carolina households, at 13.6 percent, and approximately
50 percent live at or below twice the poverty level ($51,000). For these households, a flood
insurance premium may be unaffordable even if living in a location that is only at moderate risk
of flooding. Most inland counties in North Carolina have median household incomes at or below
the state median. Take Jackson County for purposes of illustration. This county is a prime example
of a locale having 1) relatively high percentage of households living at or below the poverty level,
2) even higher percentage living below the state median income level, 3) most living below the
national household income median, 4) significant inland flood risk, and 5) large percentage of its
property owners making their living based on the local geography – spanning from agriculture to
tourism. In Jackson County, the median household income is $47,252 and 19.3 percent live below
the poverty level, while over 64 percent of housing units are owner occupied. (Illustrative statistics
taken from current U.S. Census data.)
Flood insurance premiums vary widely within Jackson County. Although it has properties that are
at lowest flood risk and are subject to a minimum premium, there are properties at high flood risk
and premiums. The median premium for a $200,000 Jackson County home, for instance, is just
$200. But high risks closest to water sources and at low elevation result in a much higher average
premium of $2,033 for $200,000 coverage in the county, and one $200,000 (insurance value)
property with a premium in excess of $26,750. To put Jackson County flood insurance costs in
perspective, while 75 percent of homes having $200,000 coverage enjoy the minimum NCRB
premium of $200, the top 10 percent of those covered at $200,000 value are subject to a premium
above $9,500. Jackson County is an inland county in the state’s Mountains region, with median
household income below the state median, which clearly does not paint a picture of wealthy coastal
villages where homeowners can largely afford to pay whatever the insurance premium may be.
(Illustrative statistics taken from NCRB, 2019.)
Flood insurance premiums might be subsidized according to a scale where the subsidy is explicitly
used to limit the out-of-pocket portion of the flood insurance premium to some reasonable
percentage of household income, subject to a maximum household income and a maximum

Proceedings of the Appalachian Research in Business Symposium, Eastern Kentucky University, March 26, 2021
21
property value, or policy limit, that are eligible for subsidization. As such, the subsidy program
would consider household income as well as insurance premium.
A subsidy formula based on annual income level and the risk-based annual flood insurance
premium can be used to ensure that the higher the household income, the lower the subsidy and
the lower the risk-based premium, the lower the subsidy. This sort of formula incorporates both
components of affordability, such that the poorest households living in the highest risk areas
receive the greatest subsidies. The eligible insurance premium would be subject to some minimum
and the eligible household income would be subject to some maximum. For example, the subsidy
could be used to slide the out-of-pocket flood insurance cost to a maximum of two percent of
annual income, commensurate with the typical cost of hazard insurance for homes.
Maximum household income that is eligible for subsidy could be set to some multiple of the
poverty line or of median household income. For example, the national poverty line is around
$26,200, so a maximum income could be set at 300 percent of the poverty line, or $76,500 (or if
the median household income as a baseline, a lower multiple would be in order for setting the
maximum, such as 125 percent of the median). The NFIP generally limits coverage to $250,000
per policy, such that a property owner with a more expensive property (in terms of replacement
cost value) would be eligible but only be able to insure up to the $250,000 maximum. Furthermore,
if a property’s market value exceeds some other standard, say at or higher than the 75th percentile
of home values, no subsidy is allowed. The market value is implicit evidence that the homeowner
holds sufficient wealth to either afford the risk-based insurance premium or move.
A simple numerical example illustrates how the subsidy program might work. With an average
household income of $20,000 and a maximum premium of two percent (or $400), for instance, a
homeowner facing a $200 or $400 flood insurance premium would pay the full amount because
these premiums are within the two percent maximum, and nothing is subsidized. That same
homeowner, if facing a risk-based premium of $2,000 dollars, however, would pay only their
calculated maximum out-of-pocket cost of $400, leaving $1,600 of the premium subsidized. For
homeowners, the subsidy phases out as the true premium falls below 2% of household income or
once household income reaches a threshold multiple of the state’s median income.
One sensible approach to fund the program is to subsidize using a transparent tax, and to do so
from a wide, rather than narrow, tax base that can be linked to home ownership. One viable option
may be a small additional sales tax on properties, to include only the sale of non-primary residences
(i.e., vacation homes) and commercial properties (could either limit to commercial residential
properties or to any commercial property). Every taxable transaction within the subsidy program’s
jurisdiction (e.g. state or nation) would participate, which seems equitable given that economies
(and thus also the low-income residents) near water sources benefit the entire nation in important
ways (e.g., agriculture, tourism, shipping, etc.). Without a wide tax base, cost volatility may
damage the wellbeing for entire local economies. For example, one flood could raise premiums
for all local homeowners, and disproportionately so for those who subsidize their neighbors. We
estimate the percentage tax necessary to fund the estimated cost of such a subsidy within North
Carolina would be well under 0.5 percent, based on the flood insurance premium distribution and
estimated real estate transactions from 2019.

Proceedings of the Appalachian Research in Business Symposium, Eastern Kentucky University, March 26, 2021
22
Conclusion
Although the analysis here is limited to North Carolina and offered as a private market solution,
it is possible to provide a broader program and utilize it within private and/or public insurance
marketplace. The NFIP is phasing out its risk-based subsidies, which will drive up the NFIP’s
rates. With no needs-based subsidy program in place, the NFIP will become more expensive for
the five million or so policyholders it currently has, likely resulting in decreased flood insurance
demand. The authors offer an option for state governments to promote private flood insurance
using a needs-based subsidy program.
References
Anderson, D. (1974). The National Flood Insurance Program: Problems and potential. Journal of
Risk and Insurance, 41(4), 579-599.
Arrow, K. (1971). Essays in the Theory of Risk Bearing, Markham Publishing Co.: Chicago.
Born, P. & Klein, R. (2019). Privatizing flood insurance in the United States: Options, challenges
and pitfalls. Working paper.
Cummins, J. (1991) Statistical and financial models of insurance pricing and the insurance firm.
Journal of Risk and Insurance, 58(2), 261-302.
Carson, J. M., McCullough, K. & Pooser, D. (2013). Deciding whether to invest in mitigation
measures: Evidence from Florida. Journal of Risk and Insurance, 80(2), 309-327.
Cole, C., Macpherson, D., Maroney, P., McCullough, K., Newman, J. & Nyce, C. (2011). The use
of post-loss financing of catastrophic risk. Risk Management and Insurance Review, 14(2), 265-
298.
Doherty, N. & Schlesinger, H. (1983). Optimal insurance in incomplete markets. Journal of
Political Economy, 91(6), 1045-1054.
Eeckhoudt, L. & Schlesinger, H. (2006). Putting risk in its proper place. American Economic
Review, 96(1), 280-289.
Fan, Q. & Davlasheridze, M. (2016). Flood risk, flood mitigation and location choice: Evaluating
the National Flood Insurance Program’s community rating system. Risk Analysis, 36(6), 1125-
1147.
Grace, M., Klein, R., Kleindorfer, P., Murray, M. (2003). Catastrophe Insurance: Consumer
Demand, Markets and Regulation, Springer: New York.
Grace, M. and Klein, R. (2009). The perfect storm: Hurricanes, insurance and regulation. Risk
Management and Insurance Review, 12(1), 81-124.
Harrington, S. & Doerpinghaus, H. (1993). The economics and politics of automobile insurance
rate classification. Journal of Risk and Insurance, 60(1), 59 – 84.

Proceedings of the Appalachian Research in Business Symposium, Eastern Kentucky University, March 26, 2021
23
Harrington, S. & Danzon, P. (2000). Rate regulation, safety incentives, and loss growth in
workers’ compensation insurance. Journal of Business, 73(4), 569 – 595.
Hayes, T. L., & Neal, D. A. (2012). National Flood Insurance Program: Actuarial Rate Review
(Rep.).
Horn, D. (2019). National Flood Insurance Program: The Current Rating Structure and Risk
Rating 2.0, Congressional Research Service.
Insurance Information Institute. (2020, October 6). Spotlight on: Flood Insurance.
www.iii.org/article/spotlight-on-flood-insurance
Kelly. M. & Kleffner, A. (2003). Optimal loss mitigation and contract design. Journal of Risk
and Insurance, 70(1), 53-62.
Kousky, C. & Kunreuther, H. (2014). Addressing affordability in the National Flood Insurance
Program. Journal of Extreme Events, 1(1).
Medders, L., Nyce, C. & Karl, J. (2014). Market implications of public policy interventions: The
case of Florida’s property insurance market. Risk Management and Insurance Review, 17(2),
183-214.
Medders, L. & Nicholson, J. (2018). Evaluating the public financing for Florida’s wind risk. Risk
Management and Insurance Review, 21(1), 117-139.
North Carolina Rate Bureau. (2019, September 19). North Carolina Residential Flood Proposal
to the North Carolina Department of Insurance.
Nyce, C. & Maroney, P. (2012). Are territorial rating models outdated in residential property
insurance markets? Evidence from the Florida property insurance market. Risk Management and
Insurance Review, 14(2), 201-232.
Taylor, Z. & Weinkle, J. (2020). The risk landscapes of re/insurance. Cambridge Journal of
Regions, Economy and Society, 13(2), 405–422.
Viscusi, W. (1995). Government action, biases in risk perceptions and insurance decisions. The
Geneva Papers on Risk and Insurance Theory, 20, 93-110.

Proceedings of the Appalachian Research in Business Symposium, Eastern Kentucky University, March 26, 2021
24
MU Access: Accessibility Curricula Collaboration Fostering
Employable Student Skills
Tracy Christofero
Department of Applied Science and Technology
College of Engineering and Computer Sciences
Marshall University
100 Angus E. Peyton Drive
Charleston, WV 25303
304.741.6272 (Contact Author)
Lori Howard
Department of Special Education
College of Education and Professional Development
Marshall University
100 Angus E. Peyton Drive
Charleston, WV 25303
304.761.2026
Ralph McKinney
Department of Management & Health Care Administration
Brad D. Smith Schools of Business
Lewis College of Business
Marshall University
100 Angus E. Peyton Drive
Charleston, WV 25303
304.746.1967
Key words:
Accessibility, technology accessibility, disability, MU Access
Introduction
“Industry leaders like Adobe, Amazon, Facebook, IBM, Google, Microsoft, Netflix and Verizon
Media are actively recruiting people who can create products everyone can use, but they cannot
find appropriately trained talent due to a significant skills gap” (Teach Access, 2019).

Proceedings of the Appalachian Research in Business Symposium, Eastern Kentucky University, March 26, 2021
25
Institutions of Higher Education are more physically accessible for students with disabilities in
compliance with the American with Disabilities Act. While those efforts promote more inclusion
of students with disabilities on campus, the MU ACCESS (Accessibility Curricula Collaboration
fostering Employable Student Skills) collaborative project was founded to foster technology
accessibility skills specifically for the future employability of students in the workplace. Current
students will be the future employees who will create new technologies and work in a more
accessible environment. Students at Marshall University and throughout the Appalachian region
need to be prepared for how accessible technologies will impact the workplace of the future, their
careers, and this region.
The MU ACCESS project consists of an interdisciplinary team of three faculty members from
three different colleges who are committed to incorporating the teaching of accessibility. The
choice of using an interdisciplinary approach was not haphazard, as interdisciplinary learning was
found to promote academic improvement, retention, develop of general education skills, and high
levels of student engagement (Welch, 2011). The MU ACCESS faculty collaboration seeks to
increase student knowledge and provide learning experiences with disability perspectives in
curriculum and instruction within business, human resources, and technology management. This
project aims to encourage and excite students about potential opportunities for creative and
innovative problem-solving and providing technology accessibility for everyone now and with
their future employers.
Literature Overview
Accessible technologies incorporate universal design tools and features to assist users, including
those with disabilities, access and use technology. However, a 2018 survey conducted by the
Partnership on Employment and Accessible Technology (PEAT) found over 60% of respondents
reported their organization’s employees lacked the needed skills to create accessible technologies.
Ninety-three percent projected their needs for those skills will increase in the future. A 2018 Best
Practices in Digital Accessibility roundtable acknowledged the skills gap and the lack of an
accessibility mindset during the design stage of technology development. “The educational system
should teach students the fundamental concepts and develop the ability to think from perspectives
across users” (Kulkarni, 2019).
Marshall University is a member of Teach Access with the MU ACCESS team serving as
university liaisons. Teach Access is “…an active collaboration among education, industry, and
disability advocacy organizations to address the critical need to enhance students’ understanding
of digital accessibility as they learn to design, develop, and build new technologies with the needs
of people with disabilities in mind” (Teach Access, n.d.). The consortium acknowledges the lack
of accessibility experts in the workforce and states, “Industry requires even those who are not
experts to have a working knowledge of the basics of Accessibility” (Teach Access, n.d.), yet less
than 3% of technology course descriptions surveyed from Teach Access university member
institutions referenced accessibility skills (Teach Access, 2019). Marshall and the MU ACCESS
team took that to heart and developed an Accessibility Awareness certificate with its
interdisciplinary accessibility curriculum to expose students to accessibility and potential
employment opportunities.

Proceedings of the Appalachian Research in Business Symposium, Eastern Kentucky University, March 26, 2021
26
Accessible technologies are particularly relevant in
the Appalachian region, the disability belt of the
United States (ARC, 2020). The Appalachian Region
includes 420 counties across 13 states along the
Appalachian Mountains from New York through
Georgia, Alabama, Mississippi, and all of West
Virginia where 7.3% residents receive disability
benefits. This is 2.2% higher than the overall US rate
(ARC, 2020; PRB, 2020). Disability rates for
veterans are even higher in Kentucky, West Virginia,
and Virginia, ranging from 38.2 to 100%.
In response to the skills gap and the Appalachian
demographic statistics, education appears to be the
solution. Organizations may not be familiar with the
social identity of individuals with disabilities in
working environments (Wright, 2015). As such, it is
essential that those entering the workforce command knowledge that enables them to be effective
advocates for inclusive environments for those with disabilities (Knight & Oswal, 2018). This
knowledge can be best appreciated through observations, analysis of spaces, and understanding
how individuals with disabilities perform tasks (Livingston, 2000). Appreciation continues as
understanding is built around achieving social justice through integrating accessibility into
organizational communications and processes (Wheeler, 2018) and including organizations
advocating for individuals with disabilities (Buelow, 2015).
Best practices associated with improving accessibility within organizational environments are to
create a deep appreciation and general understanding associated with individuals with disabilities
in those entering the workforce. “When one considers that legislation in many countries now
mandates accessibility for a variety of technologies, the lack of developers with appropriate skills
becomes apparent. The need is truly urgent.” (Teach Access, n.d.). Thus, the logical iteration is in
education programs (Browning & Cagle, 2017).
Methodology
To create accessibility learning and skill-building opportunities, graduate and undergraduate
courses among two colleges at Marshall University incorporate accessibility and technology in
their curriculum and, therefore, accommodate a broad range of students:
HON480: Disability Perspectives – This course explores how people with disabilities are
portrayed in literature and popular culture and how we can understand the perspectives of
people with disabilities.
MGT424: Human Resource Management – This course analyzes the role of human
resource managers within strategic decision-making.
Figure 1: Percentage of Persons in
Appalachia with a Disability, 2011-
2016

Proceedings of the Appalachian Research in Business Symposium, Eastern Kentucky University, March 26, 2021
27
HRM632: Human Resources: Special Populations – This course is an introduction to
disabilities across the lifespan, focusing on adulthood and employment. It surveys
disability laws, disabilities, and workplace impacts including accessibility,
accommodations, and service animals.
MGT672: Organizational Behavior – This course covers basic ideas and concepts for the
effective management of an organization, emphasizing organizational behavior and theory.
TM610: Management of Innovation and Technology – This course provides a
comprehensive introduction to technology and innovation management. It considers issues
related to rapidly changing technology, and effective organizational and managerial
approaches to technology.
TM615: IT Strategies – This course provides sound principles for managing information
technology systems processes and procedures for applying the principles. Topics include
ethics, privacy and security, accessibility, collaboration, knowledge management, etc.
TM659: Digital Accessibility Policies and Strategies – This course introduces creating
digital accessibility policies and plans for the workplace. It includes strategies to create
accessible documents, evaluate web site accessibility, and investigate assistive
technologies.
There are two aspects of learning outcomes for the MU ACCESS project: 1) student learning
outcomes fostered within these courses; and 2) learning outcomes related to curriculum and
methods. Student outcomes for these courses are assessed through both formative and summative
assessments. Students in the courses have a project-based learning assignment that uses a rubric
incorporating accessibility criteria, a self-reflections essay, and ongoing formative assessments,
i.e., class discussions and questioning. The rubric and self-reflections are collected and analyzed.
Student Learning Outcomes:
• Describe the importance of accessibility, including defining accessibility, for all people.
• Explain and describe common disabilities using people-first language and how these
disabilities may limit the person’s access to society at-large.
• Analyze an accessibility barrier that a person with a disability may encounter.
• Create innovative technological solutions to address identified accessibility barriers
relative to the content of the specific course, e.g., business, human resources management,
and technology management.
Project learning outcomes fall within three of the nine domains identified by the Marshall
University Office of Assessment and Program Review as important to “providing students with
opportunities to become reflective critical, creative, and ethical thinkers who possess the
knowledge and skills to be successful in global society of the 21st century” (Marshall, n.d.).
Proceedings of the Appalachian Research in Business Symposium, Eastern Kentucky University, March 26, 2021
28
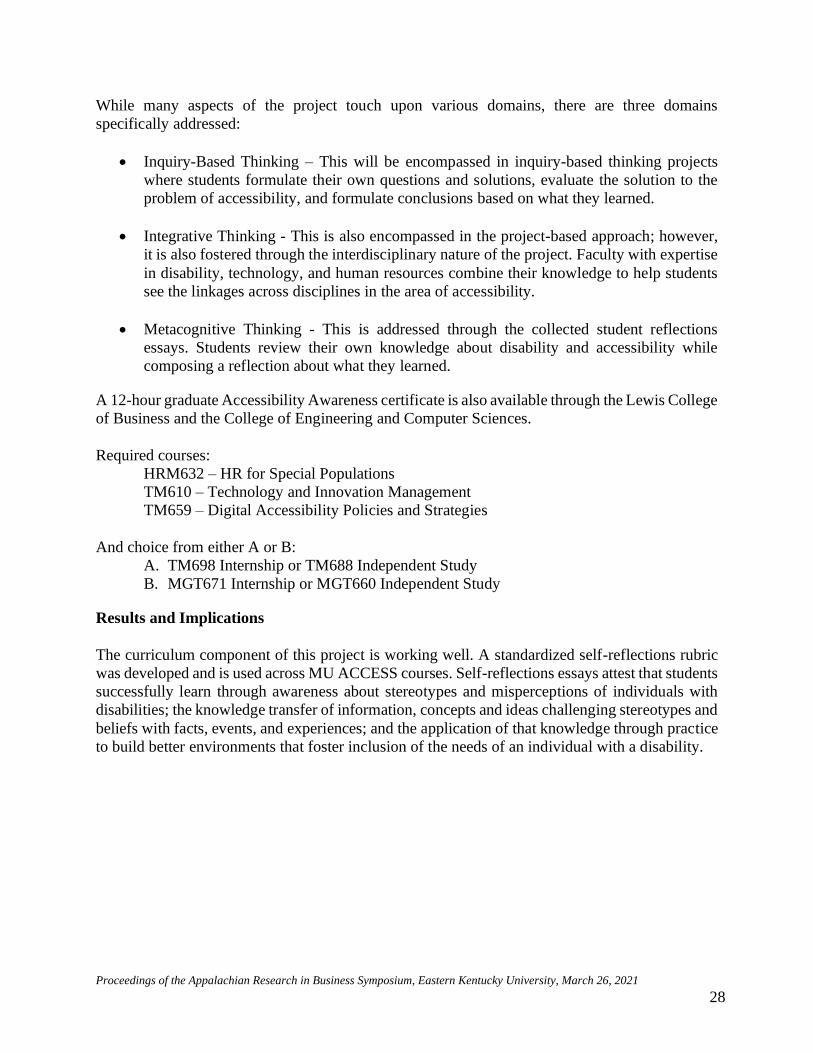
While many aspects of the project touch upon various domains, there are three domains
specifically addressed:
• Inquiry-Based Thinking – This will be encompassed in inquiry-based thinking projects
where students formulate their own questions and solutions, evaluate the solution to the
problem of accessibility, and formulate conclusions based on what they learned.
• Integrative Thinking - This is also encompassed in the project-based approach; however,
it is also fostered through the interdisciplinary nature of the project. Faculty with expertise
in disability, technology, and human resources combine their knowledge to help students
see the linkages across disciplines in the area of accessibility.
• Metacognitive Thinking - This is addressed through the collected student reflections
essays. Students review their own knowledge about disability and accessibility while
composing a reflection about what they learned.
A 12-hour graduate Accessibility Awareness certificate is also available through the Lewis College
of Business and the College of Engineering and Computer Sciences.
Required courses:
HRM632 – HR for Special Populations
TM610 – Technology and Innovation Management
TM659 – Digital Accessibility Policies and Strategies
And choice from either A or B:
A. TM698 Internship or TM688 Independent Study
B. MGT671 Internship or MGT660 Independent Study
Results and Implications
The curriculum component of this project is working well. A standardized self-reflections rubric
was developed and is used across MU ACCESS courses. Self-reflections essays attest that students
successfully learn through awareness about stereotypes and misperceptions of individuals with
disabilities; the knowledge transfer of information, concepts and ideas challenging stereotypes and
beliefs with facts, events, and experiences; and the application of that knowledge through practice
to build better environments that foster inclusion of the needs of an individual with a disability.

Proceedings of the Appalachian Research in Business Symposium, Eastern Kentucky University, March 26, 2021
29
Criteria Not Observed Emerging Competent Exemplary
Discussion of Initial
Knowledge of Disability
0-0 points 1-3 points 4-7 points 8-10 points
Discussion of Course
Objectives
0-0 points 1-3 points 4-7 points 8-10 points
Review of Discussion Posts
and Reflection Journal
Entries
0-0 points 1-3 points 4-7 points 8-10 points
Analysis of Course Themes 0-0 points 1-4 points 5-11 points 12-15
points
Analysis of Learning 0-0 points 1-6 points 7-15 points 16-20
points
Conclusion “Pulling it
Together”
0-0 points 1-3 points 4-7 points 8-10 points
Professional Writing, APA,
Spelling, and Grammar
0-0 points 1-2 3-4 points 5-5 points
Table 1. Self-Reflections Rubric
The Rubrics Statistics Report provided through BlackboardTM is an easy-to-use tool standardizing
results for further analysis. This report from one of the self-reflections assignments indicates the
high level of awareness and knowledge transfer in that course.
Figure 2. Self-Reflection Paper Rubric Statistics Report

Proceedings of the Appalachian Research in Business Symposium, Eastern Kentucky University, March 26, 2021
30
Changes in student attitudes and behaviors regarding people with disabilities are also evident
through excerpts from some self-reflections essay assignments:
“I learned that company culture can influence workplace accessibility as much as policies can.”
“After reviewing some of my own misconceptions from early in the course, I realize now that I,
along with most able-bodied people, have been operating under some very incorrect
assumptions.”
“Every business is going to deal with people with disabilities. They might not necessarily be
employees but knowing the details of this demographic made me feel more prepared.”
“Another thing that surprised throughout this course was the number of workplace
accommodations that are available with little to no cost to the employer.”
“The first thing I can do is to educate my own household with the learning received through the
class, which include using the correct vernacular, and to focus on the persons and not their
disability.”
Conclusions
The MU ACCESS project is an innovative interdisciplinary approach to the teaching of
accessibility and accessible design to students. This project-based approach falls within a high-
impact learning strategy that also provides real-world connections for students.
The self-reflections assignment rubric continues to be used and revised so student performance
can be compared in a consistent manner across MU ACCESS courses. As a next step, a project
rubric is in process of being standardized.
Future integration of accessibility in other aspects of student life, e.g., accessible resumes and
working with the Marshall University Center for Teaching and Learning to promote accessibility
in writing assignments throughout the university, e.g., communication disorders, nursing, physical
therapy, pharmacy, etc. is recommended to further disseminate the need for equal access for
everyone, including those with disabilities.
References
Appalachian Regional Commission. (2020). Appalachian States - Appalachian Regional
Commission (arc.gov)
Browning, E.R. & Cagle, L.E. (2017). Teaching a “Critical Accessibility Case Study”:
developing disability studies curricula for the technical communication classroom. Journal of
Technical Writing and Communication, 47(4), 440-463.
Buelow, J.A. (2015). Promoting dignity through design: a grounded analysis o stakeholders’
views on the role of disability organizations in inclusive design. Master of Design in Inclusive
Design. OCAD University.

Proceedings of the Appalachian Research in Business Symposium, Eastern Kentucky University, March 26, 2021
31
Centers for Disease Control. (2020). Disability Impacts All of Us Infographic | CDC
Knight, M. & Oswal, S.K. (2018). Disability and accessibility in the workplace: some exemplars
and a research agenda for business and professional communications. Business and Professional
Communication Quarterly, 81(4), 395-398.
Kulkarni, M. (2019, March). Digital accessibility: Challenges and opportunities. IIMB
Management Review Vol. 31 Issue 1 https://dio.org/10.1016;j.iimb.2018.05.009
Livingston, K. (2000). When architecture disables: teaching undergraduates to perceive ableism
in the build environment. Teaching Sociology, 28(3), 182-191.
Marshall University. (n.d.). Office of Assessment and Program Review.
www.marshall.edu/assessment/LearningOutcoms.aspx
Partnership on Employment and Accessible Technology PEAT. (2018). Accessible Technology
Skills Gap Report. www.peatworks.org/skillsgap/report
Population Reference Bureau. (2020). Appalachia’s Digital Gap in Rural Areas Leaves Some
Communities Behind – Population Reference Bureau (prb.org)
Teach Access. (2019). Why Teach Accessibility Fact Sheet. Why Teach Accessibility? Fact
Sheet – Teach Access
Teach Access. (n.d.). www.teachaccess.org
Welch IV, J. (2011). The emergence of interdisciplinarity from epistemological thought. Issues
in Integrative Studies, 29, 1-39.
Wheeler, S. K. (2018). Harry Potter and the first order of business: using simulation to teach
social justice and disability ethics in business communication. Business and Professional
Communication Quarterly, 81(1), 85-99.
Wright, G.L. (2015). An Exploration of Gender and Disability in the Workplace. MRes theseis.
The Open University.

Proceedings of the Appalachian Research in Business Symposium, Eastern Kentucky University, March 26, 2021
32
Measurement and Tracking of Project Activity Quality Based on
Time and Cost Indicators
Zachary A. Collier
Department of Management
Davis College of Business and Economics
Radford University
701 Tyler Avenue
Radford, VA 24142
540.831.6732 (Contact Author)
James H. Lambert
Department of Engineering Systems and Environment
School of Engineering and Applied Sciences
University of Virginia
151 Engineers Way
Charlottesville, VA 22904
434.982.2072
Key words:
Quality, schedule, cost, project management, project control
Introduction
A critical function in project management is the measurement of project status. Measuring the
status of the project enables effective monitoring and control. Executives must be given project
status updates to facilitate decisions about whether to continue or end a project, and whether
actions must be taken to correct a project that may have gone over-budget, behind-schedule, or
experienced scope creep. Additionally, measurement of project status reminds project team
members what the managerial priorities are, and can serve to align work with organizational goals
(McQueen, 2009). The attributes that are measured should reinforce and reflect organizational
priorities (Williamson, 2006), and in a typical project, those priorities are represented by the
traditional “iron triangle” of cost, schedule, and quality (Atkinson, 1999). Therefore, a project
manager must be able to answer whether the quality of the final product will be sufficient, and
whether the project quality is currently on track to meet customer expectations (McQueen, 2009).
Unlike cost and schedule, which are comparatively straightforward to measure, quality has been
much more difficult to quantify. One reason for this is that quality is more of an abstract concept.
The Project Management Institute (2013) defines quality as “the degree to which a set of inherent
characteristics fulfill requirements.” Quality involves a subjective element, rather than being a

Proceedings of the Appalachian Research in Business Symposium, Eastern Kentucky University, March 26, 2021
33
fixed and inherent property, and reflects an assessment of how well the attributes or features of a
good or service meet a user’s needs and expectations (Thomson et al. 2003).
Further complicating the matter is the fact that cost, schedule, and quality can all be measured at
various levels of abstraction – both at the project level and the activity level. Quality is typically
addressed at the project level, however the ability to measure and track quality at the activity level
has some important benefits. First, quality is accrued gradually and additively throughout the life
of the project as individual activities are completed. As Paquin et al. (2000) explained, quality is
not simply “poured into an end product on the very last day of the project.” Second, by taking an
activity level perspective, project managers can better identify quality deviations at the source of
the problem, which can facilitate project quality planning, quality assurance, and quality control
activities (Liberatore & Pollack-Johnson 2013; 2009; Pollack-Johnson & Liberatore 2006). Third,
the measurement of quality at the activity level facilitates mathematical quality-time-cost
optimization (Orm & Jeunet, 2018).
Literature Overview
Researchers have proposed several different methods for measuring activity quality. Orm and
Jeunet (2018) provided a review of the measurement of quality in project management. They
pointed to the work of Babu and Suresh (1996) as one of the first examples of an explicit
consideration of activity quality when making cost-schedule-quality tradeoffs. Babu and Suresh
(1996), followed later by Khang and Myint (1999), used a subjective estimate of activity quality
between 0 and 1 in a linear programming model. Another approach to measuring activity quality
is to decompose performance attributes into criteria and sub-criteria, and utilize multicriteria
decision analysis methods to develop a quality index (Paquin et al., 2000; Pollack-Johnson &
Liberatore, 2006).
Liberatore and Pollack-Johnson (2009; 2013) developed an activity quality function based
explicitly on activity cost and schedule indicators. They identified desiderata for the behaviors of
such a quality function: 1) if one holds schedule constant, quality should be an increasing function
of cost, and 2) if one holds cost constant, quality should be an increasing function of schedule.
Selecting the bivariate normal distribution as a function satisfying these requirements, Liberatore
and Pollack-Johnson (2009; 2013) defined their quality function as follows:
𝑄(𝑡, 𝑐) = 𝐾𝑒−[(
𝑡−𝜇𝑡𝜎𝑡
)2
+(𝑐−𝜇𝑐
𝜎𝑐)
2] (1)
where t and c are the time and cost spent on the activity, 𝜇𝑡 and 𝜇𝑐 are defined as the maximum
reasonable time and cost values for each activity, 𝜎𝑡 and 𝜎𝑐 are standard deviation values which
define the rate at which quality drops from the maximum to the minimum, and K is a scaling
constant which defines the maximum quality value (Liberatore & Pollack-Johnson, 2013; 2009).
The value of K is often set to 100. Fu and Zhang (2016) later extended this bivariate normal model
by adding two additional shape parameters.
However, as noted by Collier and Lambert (2018) and Collier et al. (2018), the choice to normalize
the quality function based on the maximum reasonable time and cost values for each activity results
in a quality function which increases with increasing cost and time spent on each activity,
effectively rewarding spending more money and time on each activity. This may not be optimal
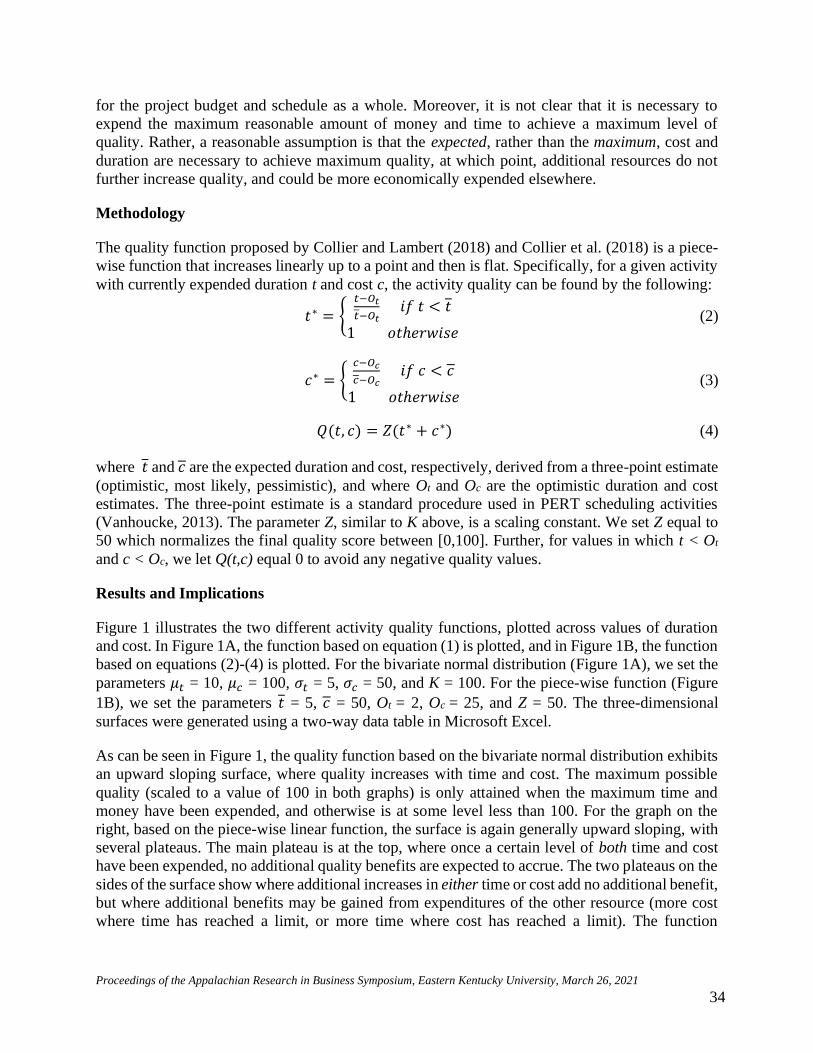
Proceedings of the Appalachian Research in Business Symposium, Eastern Kentucky University, March 26, 2021
34
for the project budget and schedule as a whole. Moreover, it is not clear that it is necessary to
expend the maximum reasonable amount of money and time to achieve a maximum level of
quality. Rather, a reasonable assumption is that the expected, rather than the maximum, cost and
duration are necessary to achieve maximum quality, at which point, additional resources do not
further increase quality, and could be more economically expended elsewhere.
Methodology
The quality function proposed by Collier and Lambert (2018) and Collier et al. (2018) is a piece-
wise function that increases linearly up to a point and then is flat. Specifically, for a given activity
with currently expended duration t and cost c, the activity quality can be found by the following:
𝑡∗ = {𝑡−𝑂𝑡
𝑡−𝑂𝑡 𝑖𝑓 𝑡 < 𝑡
1 𝑜𝑡ℎ𝑒𝑟𝑤𝑖𝑠𝑒 (2)
𝑐∗ = {𝑐−𝑂𝑐
𝑐−𝑂𝑐 𝑖𝑓 𝑐 < 𝑐
1 𝑜𝑡ℎ𝑒𝑟𝑤𝑖𝑠𝑒 (3)
𝑄(𝑡, 𝑐) = 𝑍(𝑡∗ + 𝑐∗) (4)
where 𝑡 and 𝑐 are the expected duration and cost, respectively, derived from a three-point estimate
(optimistic, most likely, pessimistic), and where Ot and Oc are the optimistic duration and cost
estimates. The three-point estimate is a standard procedure used in PERT scheduling activities
(Vanhoucke, 2013). The parameter Z, similar to K above, is a scaling constant. We set Z equal to
50 which normalizes the final quality score between [0,100]. Further, for values in which t < Ot
and c < Oc, we let Q(t,c) equal 0 to avoid any negative quality values.
Results and Implications
Figure 1 illustrates the two different activity quality functions, plotted across values of duration
and cost. In Figure 1A, the function based on equation (1) is plotted, and in Figure 1B, the function
based on equations (2)-(4) is plotted. For the bivariate normal distribution (Figure 1A), we set the
parameters 𝜇𝑡 = 10, 𝜇𝑐 = 100, 𝜎𝑡 = 5, 𝜎𝑐 = 50, and K = 100. For the piece-wise function (Figure
1B), we set the parameters 𝑡 = 5, 𝑐 = 50, Ot = 2, Oc = 25, and Z = 50. The three-dimensional
surfaces were generated using a two-way data table in Microsoft Excel.
As can be seen in Figure 1, the quality function based on the bivariate normal distribution exhibits
an upward sloping surface, where quality increases with time and cost. The maximum possible
quality (scaled to a value of 100 in both graphs) is only attained when the maximum time and
money have been expended, and otherwise is at some level less than 100. For the graph on the
right, based on the piece-wise linear function, the surface is again generally upward sloping, with
several plateaus. The main plateau is at the top, where once a certain level of both time and cost
have been expended, no additional quality benefits are expected to accrue. The two plateaus on the
sides of the surface show where additional increases in either time or cost add no additional benefit,
but where additional benefits may be gained from expenditures of the other resource (more cost
where time has reached a limit, or more time where cost has reached a limit). The function

Proceedings of the Appalachian Research in Business Symposium, Eastern Kentucky University, March 26, 2021
35
penalizes spending money and time beyond their expected values for each activity by yielding no
additional incremental quality benefits.
Figure 1. Project activity quality plotted as a function of time and cost using A) bivariate
normal distribution, B) piece-wise linear function.
The implication of this new perspective on an activity quality function is that it realigns project
management incentives. Using the bivariate normal function, by normalizing maximum quality to
the maximum (or pessimistic) estimates for activity duration and cost, project teams may be
incentivized to spend more time and money on tasks to maximize the activity quality, which may
be optimal at a local level, but could have negative impacts on the project schedule and budget as
a whole. Using the piece-wise function, by normalizing maximum quality to the expected activity
duration and cost, rather than the maximum, there may be less of an incentive to let the work of
activities expand to fill the time and budget available, i.e., Parkinson’s Law (Filiatrault & Peterson,
2000).
Conclusion
In this paper, we described the need to track project status at the activity level, focusing especially
on the often-overlooked metric of quality. We explored common approaches to measuring and
tracking project activity quality, including the leading quality function proposed by Liberatore and
Pollack-Johnson (2013; 2009). A new quality function was explored, originally formulated by
Collier and Lambert (2018) and Collier et al. (2018), and the two functions were compared.
Future research is needed in the area of project quality measurement in general, especially at the
activity level. Other functional forms could be explored which combine the smooth features of the
bivariate normal distribution with the plateaus proposed here. Demonstrations and comparative
evaluations of quality measurement methodologies, based on real project data, are needed to
validate the proposed functions. Finally, a better theoretical understanding is needed of
“cumulative quality” (Fu & Zhang, 2016), a concept describing how activity quality accumulates
as various activities are completed over the project life cycle.

Proceedings of the Appalachian Research in Business Symposium, Eastern Kentucky University, March 26, 2021
36
References
Atkinson, R. (1999). Project management: Cost, time and quality, two best guesses and a
phenomenon, its time to accept other success criteria. International Journal of Project
Management, 17(6), 337-342.
Babu, A. J. G., & Suresh, N. (1996). Project management with time, cost, and quality
considerations. European Journal of Operational Research, 88(2), 320-327.
Collier, Z. A., Hendrickson, D., Polmateer, T. L., & Lambert, J. H. (2018). Scenario analysis and
PERT/CPM applied to strategic investment at an automated container port. ASCE-ASME Journal
of Risk and Uncertainty in Engineering Systems, Part A: Civil Engineering, 4(3), 04018026.
Collier, Z. A., & Lambert, J. H. (2018). Time management of infrastructure recovery schedules by
anticipation and valuation of disruptions. ASCE-ASME Journal of Risk and Uncertainty in
Engineering Systems, Part A: Civil Engineering, 4(2), 04018012.
Filiatrault, C. L. G., & Peterson, C. D. (2000). Five behaviors that can reduce schedule risk.
Proceedings of the Project Management Institute (PMI) Annual Seminars & Symposium, (pp. 953-
957).
Fu, F., & Zhang, T. (2016). A new model for solving time-cost-quality trade-off problems in
construction. PloS One, 11(12), e0167142.
Khang, D. B., & Myint, Y. M. (1999). Time, cost and quality trade-off in project management: a
case study. International Journal of Project Management, 17(4), 249-256.
Liberatore, M. J., & Pollack-Johnson, B. (2013). Improving project management decision making
by modeling quality, time, and cost continuously. IEEE Transactions on Engineering
Management, 60(3), 518-528.
Liberatore, M. J., & Pollack-Johnson, B. (2009). Quality, time, and cost tradeoffs in project
management decision making. PICMET 2009 Proceedings, (pp. 1323-1329).
McQueen, C. (2009). How to measure the state of your project. PM Times.
https://www.projecttimes.com/articles/how-to-measure-the-state-of-your-project.html
Orm, M. B., & Jeunet, J. (2018). Time cost quality trade-off problems: a survey exploring the
assessment of quality. Computers & Industrial Engineering, 118, 319-328.
Paquin, J. P., Couillard, J., & Ferrand, D. J. (2000). Assessing and controlling the quality of a
project end product: the earned quality method. IEEE Transactions on Engineering Management,
47(1), 88-97.
Pollack-Johnson, B., & Liberatore, M. J. (2006). Incorporating quality considerations into project
time/cost tradeoff analysis and decision making. IEEE Transactions on Engineering Management,
53(4), 534-542.

Proceedings of the Appalachian Research in Business Symposium, Eastern Kentucky University, March 26, 2021
37
Project Management Institute. (2013). A Guide to the Project Management Body of Knowledge
(PMBOK Guide). 5th ed. Project Management Institute: Newtown Square, PA.
Thomson, D. S., Austin, S. A., Devine-Wright, H., & Mills, G. R. (2003). Managing value and
quality in design. Building Research and Information, 31(5), 334-345.
Vanhoucke, M. (2013). Project Management with Dynamic Scheduling: Baseline Scheduling, Risk
Analysis, and Project Control. 2nd ed. Springer-Verlag: Berlin.
Williamson, R. M. (2006). What gets measured gets done: Are you measuring what really matters?
Strategic Work Systems, Inc.: Columbus, NC.

Proceedings of the Appalachian Research in Business Symposium, Eastern Kentucky University, March 26, 2021
38
The Progressive Effects of a Robust Supply Chain Ecosystem in
Driving Economic Development and Entrepreneurship
James Kirby Easterling
Department of Management, Marketing and International Business
School of Business
Eastern Kentucky University
521 Lancaster Avenue
Richmond, KY 40475
859.779.5858 (Contact Author)
Jim Fatzinger
Department of Management, Marketing and International Business
School of Business
Eastern Kentucky University
521 Lancaster Avenue
Richmond, KY 40475
305.469.9465
Key words:
Supply chain, ecosystem, economic development, entrepreneurship
Introduction
The fields of Supply Chain Management (SCM) and Entrepreneurship (ENT) may initially seem
somewhat distant from each other, but they are heavily intertwined. At the very basic level, SCM
refers to the processes and systems of managing upstream (towards suppliers) and downstream
(towards customers) partners (firms that buy/sell to each other) to efficiently bring products (or
services) to the marketplace. ENT—also at a very basic level—refers to the processes of
designing, launching, and often running new entities in the pursuit of offering new (or improved)
products or services in either a for-profit or non-profit manner. At minimum, then, we can
conclude that both SCM and ENT share in the pursuit of helping products and/or services reach
consumers.
The Richmond Industrial Development Corporation (RIDC) is an extension of Richmond City
Government and reports into the Office of the Mayor and is responsible for
enhancing/expanding/retaining economic development for Madison County. Richmond Industrial
Development Corporation is a non-profit and non-stock corporation formed in pursuant to the
Kentucky Non-profit Corporation Act. The corporation is governed by an eleven-member Board

Proceedings of the Appalachian Research in Business Symposium, Eastern Kentucky University, March 26, 2021
39
of Directors comprised of industry leaders (banking, manufacturing, utilities, etc.), educators
(secondary & post-secondary). RIDC program objectives include the following:
1. To work closely with existing industry in order to encourage expansion and job
retention.
2. To promote growth, stability and well-being for all citizens by enticing commercial and
industrial development.
3. To maintain a listing of available industrial sites/buildings and provide community
information to organizations considering expansions or relocations.
4. To attract industry by purchasing, developing and marketing farmland as industrial
parks.
Many progressive counties—both in Kentucky as well as nationwide—have RIDC-equivalent
organizations whose aim is increasing economic expansion by driving higher tax bases and
bringing more jobs to its citizens. Competition between cities, counties, and states is very
competitive, with incentives to prospective employers (and entrepreneurs) including, but not
limited to, reduced local and state taxes for a period of years, start-up funding, recruiting fairs for
potential employees, availability of commercial property for building construction, etc.
An excellent example of the positive effect of recruiting a prestigious firm to an area is Toyota’s
selection in 1986 of Georgetown (Scott County, KY) as its site to produce the Toyota Camry.
Since its inception in 1986, Toyota Motor Manufacturing Kentucky (TMMK) has grown to nearly
12,000 employees, and is the largest automobile production plant in the world for Toyota.
According to Wilbert W. James (2017), President of TMMK, the incentives that the
Commonwealth of Kentucky and Scott County extended in 1986 were fully repaid by 1993.
With extreme competitiveness between states, counties, and cities, there is heavy emphasis in
highlighting the opportunities and strengths that each locale offers to prospective employers and
entrepreneurs. One of the major strengths for Madison County is the county is intersected by
Interstate 75 (North/South) while Interstate 64 (East/West) lies just to the north in neighboring
Fayette and Clark Counties. As such, one of Madison County’s major economic strengths is a
geographical advantage of having two of the nation’s most-traveled interstate highway systems
intersecting less than 10 miles north of the county’s northern border.
Literature Review
Existing research has already begun to explore the relationship between supply chain management
and entrepreneurial behaviors. Even more so, the construct of supply chain ecosystems already
appears in numerous journals. Per a study by Viswanadham and Samvedi (2013), “a supply chain
ecosystem consists of the elements of the supply chain and the entities that influence the goods,
information and financial flows through the supply chain. These influences come through
government regulations, human, financial and natural resources, logistics infrastructure, and
management, etc., and thus affect supply chain performance”.

Proceedings of the Appalachian Research in Business Symposium, Eastern Kentucky University, March 26, 2021
40
Handfield et al (2009) state that “in the current globally competitive environment, many firms are
turning to supply management as a core competency that creates competitive advantage. Firms
with proactive and world-class supply management programs are differentiated by hybrid
governance structures, where supply managers work closely with business stakeholders to scan the
supply market, collect market intelligence, identify opportunities to integrate suppliers with
internal requirements, deliver value-added initiates to drive growth, and ensure on-going
collaboration with key supplier partners.”
Effective supply chain management is essential for firms to operate in today’s highly competitive
environment. Giunipero et al (2008) shares that “supply chain managers need to become more
proactive in seeking out opportunities, identifying new technologies, and introducing these insights
into the organization for adoption.”
Handfield (2006) states “the evolution of supply management relies on the fact that managers have
the core skills, knowledge, capabilities, management authority, and systems knowledge required
to not only identify opportunities, but also to act on them. When firms invest in joint, relationship-
specific assets, and combine resources through governance mechanisms, a supernormal profit can
be derived on the part of both exchange parties”.
Research Opportunity
Future research will quantifiably assess how a robust Supply Chain ecosystem drives economic
development and firm growth. Firm growth can come in one of three primary ways:
1. Growth by existing firms already located in Madison County: for example, Asahi
Bluegrass Forge (ABF), a major supplier of automotive parts, established a manufacturing location in Madison County in 2002 (initially less than 20 employees) and has expanded multiple times (including 2019-2020).
2. Recruitment of established firms that are new to Madison County: for example, TRB
Lightweight Structures is a British company which recently opened a new facility in
Richmond to support components for electric vehicles (major growth industry).
3. Recruitment of non-established firms that are new to Madison County: this is perhaps
the purest entrepreneurial endeavor from the presence of a non-established firm (or
individual) bringing a new product/service/technology to the county. AppHarvest, a
startup company revolutionizing the organic vegetable industry, chose Madison County
(two locations) in 2020 in part due to access to large-scale land availability and presence
of EKU’s accredited undergraduate degree program in Global Supply Chain Management.

Proceedings of the Appalachian Research in Business Symposium, Eastern Kentucky University, March 26, 2021
41
Figure 1. Firm Growth Opportunities
Broadly speaking, supply chain capability refers to the ecosystem in which there are sufficient
supply chain professionals in the area, the degree to which supply chain tools, systems, and
processes (Material Requirement Planning, Just-in-Time, Enterprise Resource Planning, Vendor
Managed Inventories, etc.) are actively used, and supply chain infrastructure (roads, exit ramps,
utilities, etc.) are established. As such, a key point prospective businesses are seeking is the degree
to which regional supply chain capability already exists (and hence a more streamlined startup) vs
supply chain capability needing to be developed, and hence a more complicated and time-intensive
endeavor to bring products/services to market. Some of the endeavors being undertaken at Eastern
Kentucky University to assist in improving regional supply chain capability include the following:
• Establishment of the new Global Supply Chain Management (GSCM) program, the
first comprehensive (SCOR Model) Bachelor’s degree program in supply chain
management amongst the Commonwealth of Kentucky’s eight public universities
• Establishment of a Global Supply Chain Management Executive Speaker Series, in
which executive-level SCM professionals come to EKU in heavily-promoted events to
engage students, faculty, administrators, as well as the general public
• Establishment of a Supply Chain Advisory Council, comprised of senior SCM executives
from Corning, Valvoline, Lexmark, Hitachi, et al, to give executive guidance to EKU
faculty/administrators on SCM areas that should be heightened/improved in order to further
attract outside investment
• Establishment of a Center for Economic Development, Entrepreneurship, and Technology
(CEDET) at EKU which provides a wide range of services including helping businesses
transition into Madison County, helping introduce prospective businesses to funding
options, providing on-campus/low-cost small offices, and a Small Business Administration
(SBA) incubator, etc.

Proceedings of the Appalachian Research in Business Symposium, Eastern Kentucky University, March 26, 2021
42
• Launch of APICS “Continuing Education” courses through EKU’s Workforce
Development program. APICS is the leading association for Supply Chain Management
professionals.
• Supporting the upcoming launch of a “pathways” Supply Chain Management program for
high school (vocational) students through the Commonwealth of Kentucky’s Department
of Education.
While traditional incentives have worked in the past and continue to be viable options today, non-
traditional incentives are becoming more sought after as businesses transition from looking mostly
at tax incentives (traditional focus) to other cost-reduction enables (non-traditional investments).
Traditional incentives—from state and local governments for attracting economic development—
includes things such as discounted/reduced taxes (property taxes, state and local income taxes,
etc.) and upfront money for training, equipment, recruiting, etc. Non-traditional incentives
from government entities to encourage economic development include items such as the following:
• Proactive development of major industrial parks with ‘build ready’ sites.
• Streamlining businesses licenses and coordinating across municipalities (water, sewer,
fiber cable, electricity, etc.).
• Developing “Work Ready Communities” with local technical schools to ensure there is an
abundance of workers with the basic skills needed for general laborers
• Adding new highways and/or access points to enable more efficient movement of
goods/services.
o Example: Madison County recently worked with Commonwealth of Kentucky
Transportation Cabinet and the Federal Highway Commission to add a new Exit
(#83) on Interstate 75 to enable easier access to Richmond’s largest industrial
development site at Duncannon Road
Conclusion
This study has far-reaching impacts in that the robustness of a supply chain ecosystem has
significant positive effects on the growth of Madison County economic development. Even more
so, Kentucky’s Cabinet for Economic Development is highly interested in this study as the belief
is that the supply chain ecosystem considerations for Madison County applies to all counties
throughout Kentucky; hence the survey and results may be of great use from not only a county vs.
county perspective, but also from a state vs. state perspective. As such, the results of this study(s)
will be shared with RIDC and Madison County officials, as well as leaders within the
Commonwealth of Kentucky’s State Economic Development Cabinet to assist in how Kentucky
evaluates statewide supply chain ecosystems to compete with other regional states.

Proceedings of the Appalachian Research in Business Symposium, Eastern Kentucky University, March 26, 2021
43
References
Giunipero, L. C., Handfield, R., & Johansen, D. (2008). Beyond buying: supply-chain managers
used to have one main job: purchasing stuff cheaply. They need a whole new skill set now. Wall
Street Journal, 10(3), R8.
Handfield, R. (2006). Supply market intelligence: A managerial handbook for building sourcing
strategies. Auerbach publications.
Handfield, R., Petersen, K., Cousins, P., & Lawson, B. (2009). An organizational entrepreneurship
model of supply management integration and performance outcomes. International Journal of
Operations & Production Management, 29(2), 100-126.
James, Wilbert W. Richmond (KY) Rotary International Meeting. October 25 2017.
Viswanadham, N., & Samvedi, A. (2013). Supplier selection based on supply chain ecosystem,
performance and risk criteria. International Journal of Production Research, 51(21), 6484-6498.
Proceedings of the Appalachian Research in Business Symposium, Eastern Kentucky University, March 26, 2021
44
A Comparison of Learning Outcomes From Online and Face-to-
Face Accounting Courses at a Four-Year University
Faidley, Joel K.
Department of Accountancy
College of Business & Technology
East Tennessee State University
110 Sam Wilson Hall | P. O. Box 70710
Johnson City, Tennessee 37614
(423) 439-8656
Key words:
Online, Face-to-Face, Student Performance, Gender, ACT, GPA
Introduction
Online education continues to evolve and grow dramatically at colleges and universities across the
globe. Today’s society is comprised of people who are increasingly busy with work and family
obligations and who are looking for more flexible and expedited avenues for higher education.
Institutions seek to meet these new demands by offering online distance educational opportunities
while increasing cash flow for their college. Unfortunately the pitfalls to this rush to meet online
demand results in what some researchers assert are inadequate quality content and curriculum
(Brazina & Ugras, 2014; Verhoeven & Wakeling, 2011). Others indicate there are not significant
differences in the outcomes from online learning compared with traditional face-to-face classes
(U. S. Department of Education, 2010). Much of the research has been conducted on non-
quantitative courses, quantitative courses with small sample sizes, or large sample sizes that are
not controlled for quality of online content, delivery, or verification of learning.
The development and use of online courses for instruction have grown at an incredible pace in
recent years enabling students to learn from home or business locations far removed from a brick
and mortar campus. The busy lives that individuals lead justify their willingness to pay the added
cost that higher education institutions require for online courses. Online learning provides the
opportunity for asynchronous time frames in a low distraction, 24-hour-a-day, 7-day-a-week
environment, and many students embrace this method of instruction for the convenience.

Proceedings of the Appalachian Research in Business Symposium, Eastern Kentucky University, March 26, 2021
45
The advent of online instruction has not been without criticism as a means of increased revenue
streams and lower faculty costs at the expense of reduced effectiveness in meeting curriculum
learning objectives and student performance measured as grades. The general perception is an
online education is not as robust as the traditional face-to-face method of instruction (Brazina et
al., 2014; Verhoeven et al., 2011). Online testing for course progress is typically in a non-
proctored environment and if monitored at all is within the learning platform’s constraints of being
time bound. Authenticity by educators is a key concern for students enrolled and completing
coursework in an online environment.
According to the U.S. Department of Education (2010), a meta-analysis revealed when used by
itself online learning appears to be as effective as conventional classroom instruction, but not more
so. Much of the existing research has found mixed results leading to this study of a comparison
of quantitative courses, Principles of Accounting I and II, delivered in a traditional face-to-face
format and as an asynchronous online format designed by academic technology instructors. The
quality of the online content delivered in an asynchronous method of instruction would influence
the ability for a student to master the learning objectives and final grade.
There seems to be very little disagreement that rigorous investigative research is needed on
quantitative courses such as accounting to determine if a significant difference exists in learning
outcomes from an online method of instruction (Schmidt, 2012). The Association to Advance
Collegiate Schools of Business (AACSB) expects continuous process and quality improvements
and the onus of proving exceptional accounting education rests with the college or university. This
study clarifies that students learn more in face-to-face accounting courses than online
asynchronous courses based on final grade as a measure of assurance of learning.
Findings
The purpose of this quantitative research that encompassed a quasi-experimental ex-post-facto
design was to compare student outcomes (measured as final grades) from Principles of Accounting
courses delivered in two instructional methods: face-to-face (F2F) and a totally online
asynchronous format. The relationship of ACT score, GPA, gender, and age to mean final course
grade were analyzed. The number of subjects in this study was 557 students from a public
university in the Southeast United States enrolled in Principles of Accounting I and II classes.
Accounting I is financial accounting and Accounting II is primarily managerial accounting.
Archived data were provided by the participating university’s Office of Institutional Research.
The time frame was summer 2015 through summer 2017. Identical exams were proctored to all
students. Each student, who self-selected the course delivery method, was identified by an 8-digit
number assigned by the system’s data base administrator to protect the anonymity of the students.
Two instructors were included in this study with one instructor teaching both modalities of
Accounting I and the other instructor teaching both modalities of Accounting II. The rubrics were
the same for each instructor across all sections he/she taught.

Proceedings of the Appalachian Research in Business Symposium, Eastern Kentucky University, March 26, 2021
46
Research Question 1: Is there a significant difference in composite ACT scores between
students enrolled in a face-to-face method of instruction and students enrolled in an
asynchronous online format?
An independent-samples t-test was conducted to evaluate whether the composite ACT scores were
significantly different between asynchronous online class and a face-to-face students. The mean
overall ACT score was the test variable and the grouping variable was the method of instruction
for the class. The test was not significant, t(420) = .56, p = .574. The η2 index was .01 indicating
a small effect size. Students from face-to-face classes (M = 23.22, SD = 3.96) on average scored
about the same on the composite ACT as students from asynchronous online classes (M = 22.95,
SD = 4.00). The 95% confidence interval for the difference in means was -.68 to 1.23. The
distributions of ACT scores for the two groups are displayed in Figure 1.
Figure 1. Distribution of Student ACT Scores in Each Mode of Instruction
Research Question 2: Is there a significant difference in students’ mean final course
grades between a face-to-face method of instruction and an asynchronous online format?

Proceedings of the Appalachian Research in Business Symposium, Eastern Kentucky University, March 26, 2021
47
An independent-samples t-test was conducted to evaluate whether the final mean grade of
Principles of Accounting students were significantly different between asynchronous online class
and a face-to-face class. The overall course final mean score was the test variable and the grouping
variable was the method of instruction for the class. The test was significant, t(524) = 2.65, p =
.008. The η2 index was .01 indicating a small effect size. Students from face-to-face classes (M =
2.52, SD = 1.21) on average scored significantly higher in Principles of Accounting classes than
students from asynchronous online classes (M = 2.17, SD = 1.29). The 95% confidence interval
for the difference in means was .09 to .60. The distributions of final grades for the two groups are
displayed in Figure 2.
Figure 2. Distribution of Grades for Students
It should be noted that female students scored significantly higher than male students in the
Principles of Accounting classes for both online and face-to-face instruction. The means and
standard deviations for the two groups are displayed in Table 1.

Proceedings of the Appalachian Research in Business Symposium, Eastern Kentucky University, March 26, 2021
48
Method of Delivery M SD P
Online
Males
Females
Face-to-Face
Males
Females
1.85
2.42
2.38
2.74
1.39
1.15
1.20
1.19
.001
.003
Table 1. GPA Means and Standard Deviations by Gender and Method of Delivery
Also nontraditional aged students (25+) scored significantly higher than traditional aged students
(18-24) in the online accounting classes but not in face-to-face classes. The means and standard
deviations for the two groups are displayed in Table 2.
Method of Delivery M SD P
Online
Traditional Aged
Nontraditional Aged
Face-to-Face
Traditional Aged
Nontraditional Aged
2.02
2.59
2.51
2.52
1.23
1.38
1.20
1.19
.038
.964
Table 2. GPA Means and Standard Deviations by Age and Method of Delivery
Research Question 3: Is there a significant difference in mean entering GPAs between
online and face-to-face students?
An independent-samples t-test was conducted to evaluate whether mean student GPA prior to the
class enrollment were significantly different between face-to-face and online classes. The mean
GPA score immediately prior to the course was the test variable and the grouping variable was
method of instruction. The test was significant, t(555) = 2.97, p = .003. The η2 index was .02
indicating a small effect size. Students’ entering mean GPAs in face-to-face classes (M = 3.02,
SD = .78) was significantly higher than students’ entering mean GPA enrolled in online Principles
of Accounting classes (M = 2.78, SD = .85). The 95% confidence interval for the difference in
means was .08 to .40. Students entered face-to-face Principles of Accounting classes with a

Proceedings of the Appalachian Research in Business Symposium, Eastern Kentucky University, March 26, 2021
49
significantly higher GPA than students choosing the online delivery method. The distributions of
GPA by method of instruction are displayed in Figure 3.
Figure 3. Distribution of Student GPA Prior to Course
Research Question 4: How well does the ACT composite score, GPA, age (grouped into 2
segments of below 25 and 25 and above), gender, and method of delivery selected by students
predict mean final course grade?
A multiple regression analysis was conducted to evaluate how well the various factors predicted
the final course grade. Face-to-face instructional method was coded as 1 and online instruction
was coded as 2. The predictors were five variables, while the criterion variable was the final course
grade. The linear combination of these factors was significantly related to the final course grade,
F(5, 397) = 30.56, p <.001. The sample multiple correlation coefficient was .53, indicating that
approximately 28% of the variance of the student final grade in the sample can be accounted for
by the linear combination of these factors.
In Table 3 the relative strength of the individual predictors are displayed. Three of the five
bivariate correlations were significant with ACT composite and GPA significant at (p < .01). Four
of the five partial correlations were significant with instructional method, ACT composite score,
and GPA significant at p < .01. Age and gender were significant at the .05 level in predicting final
course grade. The prediction equation for the standardized variables was as follows:
ZPredicted Student Grade = -.11 ZInstructional Method + .31 ZComp ACT +.06 ZAge +.31 ZGPA +.06 ZGender

Proceedings of the Appalachian Research in Business Symposium, Eastern Kentucky University, March 26, 2021
50
Predictor Correlation between each Correlation between each predictor
predictor and final grade and final grade controlling for all
other predictors
Instructional Method -.13* -.13**
ACT Composite .41** .32**
Gender .11 .07*
Age .03 .07*
GPA .42** .33**
*p < .05 **p < .01
Table 3. The Bivariate and Partial Correlations of the Predictors with Mean Final Grade.
Conclusions
The study clearly indicated significantly lower grades in online courses than face-to-face courses.
In the present study both instructors of the Principles of Accounting classes required onsite campus
exams or proctored exams in bona fide testing centers across the country. Several literature review
articles indicated cheating as a concern. Kuzma, Kuzma, and Thiewes (2015) stated more than
50% of students perceived a greater propensity to cheat in online courses. Prince, Fulton, and
Garsombke (2009) documented the average score for online exams were 10% higher than face-to-
face exams. Verification of learning through proctored uniform exams is a key component of
successful measurement and must be considered in robust research designs.
The use of Academic Technology Services at the participating university to create the online
content of these courses should also be noted. Both instructors of these Principles of Accounting
classes used the university professionals available to develop a diverse curriculum that employs
various mediums to engage and motivate students. The use of qualified personnel to guide online
course development reinforces the findings that face-to-face class performance is significantly
better than online class learning measured as final course grade.
Males made lower grades than females in online classes compared to a face-to-face method of
instruction. Females performed better than males in both methods of instruction. GPA was
correlated to course performance as was ACT composite and ACT math scores. The findings of
GPA as a predictor of final grade performance was consistent with Dotterweich and Rochelle
(2012) who found GPA was a significant factor in student success regardless of instructional
delivery method. Students with a college ready ACT math score of 22 or higher was a strong
predictor with 62% of the participating university’s sample designated as college ready.
Nontraditional aged students performed significantly better in online Principles of Accounting
classes than traditionally aged students. Kimmel, Gaylor, and Hayes (2016) noted adult students
were more likely to be employed than younger students. In their study 73% were employed full-

Proceedings of the Appalachian Research in Business Symposium, Eastern Kentucky University, March 26, 2021
51
time and 20% were employed part-time. Students under 24 years of age were more motivated to
attend college because of parental support. Students aged 25 to 34 sought a new career, and
students aged 35 and older desired a pay increase, new career, or respect from peers. These facts
imply that nontraditional aged learners may be more motivated when taking college classes and
understand the value of higher education more so than the average traditionally aged student.
References
Association to Advance Collegiate Schools of Business (AACSB). (2006). Eligibility procedures
and accreditation standards for business accreditation. Available at:
https://www.aacsb.edu/accreditation/standards/accounting
Brazina, P. R., & Ugras, J. Y. (2014). Growth and changes in online education. Pennsylvania
CPA Journal, 85(3), 34-38. Retrieved on October 14, 2016 from
https://login.iris.etsu.edu:3443/login?url=http://search.proquest.com.iris.etsu.edu:2048/docview/
1564109461?accountid=10771
Dotterweich, D. P., & Rochelle, C. F. (2012). Online, instructional television and traditional
delivery: Student characteristics and success factors in business statistics. American Journal of
Business Education (Online), 5(2), 129. Retrieved on September 26, 2017 from
https://login.iris.etsu.edu:3443/login?url=https://search.proquest.com/docview/
1418444288?accountid=10771
Kimmel, S. B., Gaylor, K. P., & Hayes, J. B. (2016). Age differences among adult learners:
Motivations and barriers to higher education. Academy of Business Research Journal, 4, 18-44.
Retrieved on October 2, 2017 from https://login.iris.etsu.edu:3443/login?url=https://search-
proquest-com.iris.etsu.edu:3443/ docview/1863564210?accountid=10771
Kuzma, A., Kuzma, J., & Thiewes, H. (2015). Business student attitudes, experience, and
satisfaction with online courses. American Journal of Business Education (Online), 8(2), 121.
Retrieved on September 5, 2017 from https://login.iris.etsu.edu:3443/login?url=https://search-
proquest-com.iris.etsu.edu:3443/ docview/1673824570?accountid=10771
Prince, D. J., Fulton, R. A., & Garsombke, T. W. (2009). Comparisons of proctored versus non-
proctored testing strategies in graduate distance education curriculum. Journal of College
Teaching and Learning, 6(7), 51-62. Retrieved on September 26, 2017 from
https://login.iris.etsu.edu:3443/login?url=https://search.proquest.com/docview/218938172?accou
ntid=10771
Schmidt, S. (2012). The rush to online: Comparing students’ learning outcomes in online and
face-to-face accounting courses. (Doctoral dissertation). Retrieved on October 14, 2016 from
http://search.proquest.com/docview/1039150240
U.S. Department of Education, Office of Planning, Evaluation, and Policy Development. (2010).
Evaluation of evidence-based practices in online learning: A meta-analysis and review of online
learning studies. Washington, DC: Author

Proceedings of the Appalachian Research in Business Symposium, Eastern Kentucky University, March 26, 2021
52
Verhoeven, P., & Wakeling, V. (2011). Student performance in a quantitative methods course
under online and face-to-face delivery. American Journal of Business Education, 4(11), 61-66.
Retrieved on October 14, 2016 from https://login.iris.etsu.edu:3443/login?url
=http://search.proquest.com.iris.etsu.edu:2048/docview/1697501263?accountid=10771
Proceedings of the Appalachian Research in Business Symposium, Eastern Kentucky University, March 26, 2021
53
Go It Alone: The (Lack of) Impact of the Payroll Protection Plan on
Solo Law Practitioners in Rural Kentucky
Michael S. Fore
BTC 108
Department of Management, Marketing, & International Business
Eastern Kentucky University
521 Lancaster Avenue
Richmond, KY 40475
859.893.1434 (Contact Author)
Key words:
Payroll protection plan, PPP, business of law, solo practice, rural business
Introduction
The idea of a small town, solo lawyer in the mold of a Matlock or Atticus Finch is a popular culture
trope. However, this business model may be disappearing from rural Kentucky. The Payroll
Protection Plan (PPP), was one of the most popular parts of the government’s response to the 2020
pandemic. Like all types of businesses, law firms and individual lawyers participated in this
program. Even a solo firm in a rural area might have several employees. In addition, such small
firms are often the only access to legal services for the businesses and individuals in these
communities. This paper reviews data from the Small Business Administration which indicates
that and solo practitioners in rural areas of Kentucky may not have benefited from this program on
the same rate as did larger law firms.
Background and Review of Literature
Part of the larger Coronavirus Aid, Relief, and Economic Security Act (CARES Act), PPP offered
tax free loans to businesses with less than 500 employees. The loan itself was for up to 2.5 times
of monthly payroll expense and was forgivable, provided it was used primarily for payroll. The
program provided a sizable, and essentially free, injection of cash into small and large businesses
across the nation.
PPP was so well-received that it received a second round of funding in April 2020. Subsequently,
Congress voted to make expenses paid with PPP funds tax deductible. According to the Small
Business Administration, the 2020 PPP program may have saved or helped fund at least 51 million
jobs during the course of 2020 (SBA 2020).

Proceedings of the Appalachian Research in Business Symposium, Eastern Kentucky University, March 26, 2021
54
However, the PPP program was not without controversy or criticism. Some public companies
such as Shake Shack and the Los Angeles Lakers took advantage of the program, presumably
crowding out smaller businesses (New York Times 2020). Banks themselves were criticized for
allegedly prioritizing larger clients over small businesses (Ponciano 2020). Ultimately, SBA data
showed that as of November 2020, 87 percent of PPP loans were for less than $150,000 which
presumably benefited smaller businesses (Hansen 2020).
PPP and Legal Services
Like the rest of the economy, legal services businesses also took part in the PPP program.
Nationwide over 600 law firms received PPP loans that were in excess of $2 million each. Another
14,000 large law firms received PPP loans in excess of $150,000 each (LexisNexis 2020 and Coe
2020).
For smaller firms, the impact was also significant, if more difficult to measure. In an April 2020
survey of 75 managing partners at small and midsize law firms conducted by a legal consulting
firm, “The Remsen Group,” 90% of the firm leaders said they had applied for a forgivable PPP
loan. In Florida, nearly every eligible large law firm participated in the PPP program, accounting
for a majority of the funds loaned to the legal industry. However, over 90% of loans to legal
services businesses were for less than $150,000.00 (Roe 2020).
A similar top-heavy dollars pattern appears in study of PPP data from New York. The majority
of law firm loans in New York went to individual attorneys or firms with three or fewer employees,
while the vast majority of funds went to larger enterprises. Loans of $50,000 or less accounted for
two-thirds of all New York law firm loans but represented just 12% of statewide borrowing by law
firms and lawyers. Nearly half of all New York loans were for $25,000 or less; those loans
accounted for 6% of all New York law firm and attorney loans (Roe 2020).
Some local bar associations, such as the Ohio Bar and Knoxville Bar Association, actively
encouraged members to apply and provided guidance to small firms and solo practitioners about
participation in the PPP program (Knoxville Bar 2020 and Estell 2020). However, Kentucky’s bar
did not undertake such efforts.
Kentucky Legal Community
History and geography have shaped Kentucky’s legal community. Civil and criminal courts,
property indexing, and other judicial functions are organized on county by a county basis. And
the 120 counties that make up Kentucky are unusually small. Historically, the stated justification
was that a county’s borders should stretch no further than a round-trip horseback ride to the county
seat. Thus despite being a relatively small state, Kentucky has the 4th highest number of counties
of any state in the nation (Kleber 1992).
Each of the 120 counties has its own county seat, its own Courts of various jurisdictions, its own
property records, etc. Because of this dynamic, the practice of law in Kentucky has traditionally
been more localized. Each courthouse in each county supported its own, in many cases insular,
ecosystem of legal business. This meant that the smallest and least populous community usually
had access to local legal counsel because of this unique dynamic. However, in recent years the

Proceedings of the Appalachian Research in Business Symposium, Eastern Kentucky University, March 26, 2021
55
small town practice of law seems to be shrinking in favor of firms, even smaller firms which
operate across a larger geographic area stretching several counties. Study of PPP data and lending
patterns should provide insight into this continuing trend.
Because of this unique characteristic, Kentucky law firms tend to be smaller and the traditional
definitions of “small” and “mid-sized” firms used by national organizations do not always fit the
reality of Kentucky’s fractured legal landscape. For example, a firm of 5 attorneys would be
considered small by the measures of the American Bar Association but may well be a larger firm
in any Kentucky County outside of Lexington, Louisville, or the Cincinnati suburbs of Northern
Kentucky. However, these smaller firms or solo attorney do provide access to legal services to
their subject communities.
Many traditional connotations of the practice of law involve the imagery of a small town
practitioner, working as an integral part of the local community. However, this model may be
vanishing. New methods of communication have blurred practice areas and made multi-county
practice more normalized, rather than the exception.
Methodology
The data reviewed was from publicly available sources. The SBA has provided information about
the PPP program. PPP loan recipients are indexed by zip code and also by NAICS Code (54110
being the code for law firms). In December of 2020, the SBA released business name data, making
it possible to determine which specific law firms and solo practitioners had participated, or not
participated, in the PPP program (SBA 2020).
The Kentucky Bar Association makes available information concerning licensed lawyers in the
state by various means. For purposes of this limited study the Kentucky Legal Directory, the
official print publication directory of the Kentucky Bar Association, was used. Keeping in mind
the nature of Kentucky’s legal system, this directory is indexed by county.
Participation in the PPP Program was widespread by the Kentucky Bar. However, by comparing
PPP data with legal directory information on a county by county basis, it could be determined
which specific firms and individuals did and did not participate in this program. In addition to
primary data from the SBA, third-party searchable databases (www.federalpay.org and
www.searchppp.com) were also consulted to confirm results. This initial survey was focused on
PPP participation by rural firms and solo practitioners, a survey of roughly 10% of Kentucky’s
counties. The 10 lowest per capita income counties, by use of 2010 census data, were selected and
reviewed, as were a handful of other counties throughout the state. This review did not attempt to
compare or consider data from the highest per capita income counties for comparison, although
such may be attempted in the future. Nor does this survey consider rates of PPP participation of
solo practitioners relative to sole proprietorships in other industries.
Results and Implications
According to SBA data, approximately 1,460 Kentucky law firms participated in the PPP program,
representing 2% of the state’s overall loan totals. The average of these loans was for just over
$70,000.00 and involved 6 jobs. The Kentucky Bar Association claims approximately 16,000
members. However, a significant part of this membership is not involved in the active private

Proceedings of the Appalachian Research in Business Symposium, Eastern Kentucky University, March 26, 2021
56
practice of law. The actual numbers of lawyers in private practice who might participate in the
PPP program is much smaller and is best reviewed on a county by county basis.
County Per
Capita
Income
Population
(2018)
PPP Part.
Firms
PPP Non-
Part. Firms
PPP
Participating
Solo
PPP Non-
Participating
Solo
Owsley 10,767 4,435 0 0 0 2
Wolfe 11,214 7,264 1 0 0 3
McCreary 12,197 17,465 1 0 1 6
Clay 12,300 20,366 4 0 1 5
Lee 12,983 6,570 0 0 0 2
Elliot 13,072 7,523 0 0 0 2
Magoffin 13,849 12,538 6 0 1 6
Jackson 13,935 13,431 0 1 1 2
Knox 14,101 31,227 2 1 7 8
Casey 14,252 15,750 0 1 0 5
Estill 15,725 14,277 0 0 0 3
Lincoln 16,985 24,456 1 2 0 10
Montgomery 20,004 27,928 4 2 5 7
Bath 15,487 12,378 1 1 3 4
Garrard 18,735 17,523 0 1 2 4
Table 1. PPP Legal Services Participation by County
All of the counties reviewed are relatively low in population. In many of these economically
disadvantaged counties, a number of solo practitioners did not participate in the PPP program.
Consider Clay County, which has one of the lowest per capita incomes in the country but which is
home to a relatively large legal community in its county seat of Manchester. There, all of the local
firms participated in the PPP program. The majority of solo practitioners did not. This was typical
as law firms did by and large take advantage of the program in the reviewed areas. This sampling
of only 15 counties is too small to draw further conclusions, but it does provide a path and
methodology for data review and further research over a wider scope. In addition, it is unclear
what this says about the access for legal services and impact on economic development in these
smaller communities.
Conclusion
This preliminary review of a small data set shows that in the areas reviewed, a significant number
of solo practitioners did not participate in the PPP program. The data reviewed consisted of a
small sampling of data and no larger conclusions can be drawn beyond the correlation that in the
reviewed rural areas, a number of solo practitioners and a handful of small firms chose not to
participate in the PPP program. Similarly, the geographic scope of review was limited by design
and may not be indicative of other areas of the state. Further review is warranted.
Moreover, the reasons for nonparticipation were not the subject of this project. PPP was essentially
a grant program. Seemingly most would have sought to participate given the singular economic
situation of 2020. However, it appears many presumably eligible lawyers in rural Kentucky did
not.

Proceedings of the Appalachian Research in Business Symposium, Eastern Kentucky University, March 26, 2021
57
This review ties in to an upcoming survey of the entire Kentucky Bar Association membership as
a whole concerning the impact of the 2020 pandemic on the practice of law as a whole. Data
collection is expected to begin in early 2021. This study will gather information directly from Bar
Members about the utilization, or lack thereof, of the PPP program. It is hoped that this survey will
provide insights into the motivations behind the present data.
Potentially, the situation of more rural, small firm or solo lawyers may be similar to that of urban
or minority entrepreneurs, who potentially lack access to or existing relationships with banks to
facilitate PPP participation. Unlike other businesses, law firms do not traditionally operate with
standing credit lines or debt financing. It may be that smaller firms and individuals did not either
have connections with a bank to seek to participate in the program or were simply unaccustomed
to applying for loans at all, prior to the pandemic.
Alternatively, there may be cultural or social pressures that dissuaded eligible businesses from
participation, perhaps a traditional rural aversion to accepting a perceived hand-out or aid or
concern about the public nature of the loan program discouraged participation. It is hoped that the
aforementioned survey will give some insights into some of these questions.
Decreased PPP utilization by smaller legal businesses in more rural areas may well be indicative
of a larger consolidation of legal services throughout the Commonwealth. The implications of this
trend are significant not just for the business of law, but also for the larger communities. If there
is an ongoing pullback and consolidation of legal services away from poorer, rural communities,
local businesses may lose access to legal services and individuals may lose access to advocacy in
the legal system. The larger economic and social justice implications of this for these potentially-
underserved communities warrants further study.
References
Coe, A. (2020, April 28). Law Firms Scramble For Federal Money With Mixed Results.
Law360/LexisNexis. Retrieved from: https://www.law360.com/articles/1268389/law-firms-
scramble-for-federal-money-with-mixed-results
Estelle, S. (2020, April 2). Coronavirus Relief Package: Guidance for Small Law Firms and
Solo Practitioners. Ohio Bar Association: Small Practice Section. Retrieved from:
https://www.ohiobar.org/member-tools-benefits/practice-resources/practice-library-
search/practice-library/caresact-impact-solosmallfirm/
Federalpay.org (2020). PPP Loan Company Lookup Tool. Retrieved from:
https://www.federalpay.org/paycheck-protection-program
Hansen, S. (2020, April 4). Potbelly, Shake Shack, Axios: Here Are All The Companies
Returning PPP Money After Public Backlash. Forbes. Retrieved from:
https://www.forbes.com/sites/sarahhansen/2020/04/29/potbelly-shake-shack-axios-here-are-all-
the-companies-returning-ppp-money-after-public-backlash/?sh=2e6fb6bf7ea0
Kentucky Bar Association. (2018). Kentucky Legal Directory, Official Directory of the
Kentucky Bar Association, Legal Directory Publishing, Inc.
Kleber, John E., ed. (1992). "Counties". The Kentucky Encyclopedia. Lexington, Kentucky: The
University Press of Kentucky.

Proceedings of the Appalachian Research in Business Symposium, Eastern Kentucky University, March 26, 2021
58
Knoxville Bar Association. (2020). Help for Solos & Small Firms. Retrieved from:
https://www.knoxbar.org/?pg=CoronavirusintheWorkplace
LexisNexis. (2020, June 2). PPP Program Presents Four Big Questions for Law Firms.
LexisNexis. Retrieved from: https://www.lexisnexis.com/community/lexis-legal-
advantage/b/insights/posts/ppp-program-presents-four-big-questions-for-law-firms
New York Times. (2020, May 4). Public companies return millions in loans set aside for small
businesses. New York Times. Retrieved from
https://www.nytimes.com/2020/05/04/business/live-stock-market-coronavirus.html#link-
48f11fd9
Ponciano, J. (2020, October 16). Big Banks Prioritized Billions In PPP Funds For Wealthy
Clients At The Expense Of Struggling Small Businesses, House Report Finds. Forbes.
Retrieved from: https://www.forbes.com/sites/jonathanponciano/2020/10/16/trump-admin-big-
banks-billions-ppp-funds-wealthy-clients-at-expense-of-struggling-small-businesses-house-
report/?sh=39464d6d730b
Roe, D. (2020, December 8). Some Florida Firms Maxed Out On PPP Loans, but Most Legal
Industry Loans Were Small. Law.com: Daily Business Review. Retrieved from:
https://www.law.com/dailybusinessreview/2020/12/08/some-florida-firms-maxed-out-on-ppp-
loans-but-most-legal-industry-loans-were-small/
Roe, D. (2020, December 9). Midsize and Small NY Firms Borrowed Most of $1.2B Law Firm
PPP Money. Law.com: New York Law Journal. Retrieved from:
https://www.law.com/newyorklawjournal/2020/12/09/midsize-and-small-ny-firms-borrowed-
most-of-1-2b-law-firm-ppp-money/
SearchPPP.com/Accountable.us. (2020). Covid Bailout Tracker. Retrieved from:
https://covidbailouttracker.com/
Small Business Administration. (2020, July 23). PPP Save over 51 Million Jobs. Retrieved
from: https://www.sba.gov/about-sba/sba-newsroom/press-releases-media-advisories/ppp-save-
over-51-million-jobs
Small Business Administration. (2020, December 2). PPP Data. Retrieved from:
https://sba.app.box.com/s/y9rwcanhe6pehwvtblctfmxyy9sytnwz
Small Business Administration, PPP Frequently Asked Questions (2020), Retrieved from
SBA.gov https://www.sba.gov/sites/default/files/2020-06/Paycheck-Protection-Program-
Frequently-Asked-Questions%20062520-508.pdf
U. S. Census Bureau. Selected Economic Characteristics. Retrieved from
https://data.census.gov/cedsci/table?q=ACSDP5Y2010.DP03&g=0500000US16075&tid=ACSD
P5Y2010.DP03

Proceedings of the Appalachian Research in Business Symposium, Eastern Kentucky University, March 26, 2021
59
Employment Challenges for People With Disabilities in Appalachia:
A Community Approach
Lori A. Howard
Department of Special Education
College of Education and Professional Development
Marshall University
100 Angus E. Peyton Drive
Charleston, WV 25303
304.761.2026
Tracy Christofero
Department of Applied Science and Technology
College of Engineering and Computer Sciences
Marshall University
100 Angus E. Peyton Drive
Charleston, WV 25303
304.741.6272 (Contact Author)
Ralph McKinney
Department of Management & Health Care Administration
Brad D. Smith Schools of Business
Lewis College of Business
Marshall University
100 Angus E. Peyton Drive
Charleston, WV 25303
304.746.1967
Key words:
Disability, Employment in Appalachia, American Federation for the Blind, MU Access
Introduction
The Appalachian region has multiple employment challenges. These challenges are complex
requiring innovative and collaborative approaches to help identify the problem and possible
solutions. An area often overlooked is the lack of employment for people with disabilities. This
complex problem needs collaborative solutions; therefore, a collaboration between the Lewis
College of Business at Marshall University, the American Foundation for the Blind (AFB), and an
Proceedings of the Appalachian Research in Business Symposium, Eastern Kentucky University, March 26, 2021
60
employment task force comprised of community leaders in Huntington, West Virginia have begun
discussing these issues and creating realistic solutions.
Literature Overview
It has been 30 years since the Americans with Disabilities Act (ADA) was enacted to protect the
civil rights of people with disabilities. This law provides a foundation for hiring and supporting
employees with disabilities (American with Disabilities Act, 2021). However, there is an
employment gap related to both aging employees who may experience a loss of mobility, hearing,
and/or vision as part of the aging process, and younger workers with a disability entering the
workforce.
It is estimated that between 20-24% of all Americans have some disability limiting life activities
including employment (Teach Access, 2019). Rates among the 13 states comprising
the Appalachian Region are even higher, where residents receiving disability benefits is 7.3%.
This is 2.2% higher than the overall US rate. Disability rates for veterans are even higher in
Kentucky, West Virginia, and Virginia, which range from 38.2-100% (ARC, 2021; PRB,
2020). The federal government estimates 14% of all public-school students have a disability, with
the largest portion being students with learning disabilities (National Center for Education
Statistics, 2020).
While there has been an increased focus on employment for people with disabilities, only about
“1 in 3 (34.9%) individuals with disabilities compared with about 76% of their counterparts
without disabilities” are employed (Bonaccio, Connelly, Gellatly, Jetha, & Ginis, 2019). This
employment gap is often attributed to many factors including a general lack of knowledge about
disability which creates an inherent bias in the hiring and retention of workers with disabilities;
and a lack of awareness/understanding of how to help these employees be successful (AFB, 2020;
JAN, 2020).
Methodology
This paper uses a case study approach in addressing the subject. Informal discussions among
community and university partners led to the creation of a task force to collaborate on an innovative
comprehensive approach to the problem of disability and employment. Current task force members
include Huntington area business leaders, an ophthalmologist, faculty in Marshall University’s
College of Business, Outreach Coordinators from AFB and Marshall University, vocational
rehabilitation representatives, and a representative from the Huntington Regional Chamber of
Commerce.
Due to COVID-19, project meetings have been conducted via Zoom. Despite the challenge of
remote collaboration, the task force has been meeting twice monthly, with emails and telephone
calls, as necessary. They have been able to use accepted group process skills, e.g., identifying
members, sharing resources, explaining values, coming to consensus on areas they wished to focus,
and meetings to implement agreed upon actions.
Proceedings of the Appalachian Research in Business Symposium, Eastern Kentucky University, March 26, 2021
61
Results and Implications
The task force identified two major focus areas/phases: 1. Employer knowledge and sensitivity to
the issues of disability and workplace accommodations, and 2. Potential employees with
disabilities increasing their employment skills with a focus on productivity, i.e., technical, and soft
skills.
Phase 1 - Employer knowledge and sensitivity to the issues of disability and workplace
accommodations. To begin early 2021.
The task force decided to promote awareness of disability through a Speaker’s Series and a micro-
credential continuing education program to provide mini workshops for employers and human
resource specialists offered through the university partner. Workshops are designed to be virtual
until such time face-to-face workshops can be conducted. They will be for one hour and include
videos, reading materials, and interactive discussions.
Specific topics for the mini workshops include general disability etiquette for working with
employees with disabilities, legal aspects of hiring people with disabilities, employer resources,
and the Big A’s: Accommodations, Accessibility, and Assistive Technology:
Accommodations - This refers to how an employer can level the playing field for a person
with a disability. This might include a large screen monitor, frequent breaks, ergonomic
furniture, or any way the employer can help ensure employees with a disability have an
equal chance to succeed. Most accommodations are low cost, i.e., less than $500.00, or no-
cost (JAN, 2020).
Accessibility - This refers to both electronic and physical accessibility. Most people realize
curb cuts, ramps, or elevators can be used by everyone, not just those with disabilities.
Electronic accessibility should do the same. It refers to making websites and documents
accessible to everyone, including those with disabilities. For example, certain color
combinations on websites are hard for a screen reader to “see”, and closed captioning is
used by many to read what is written on a screen. Some devices and software applications
already have accessibility features built in.
Assistive Technology - This refers to devices that can assist a person with a disability,
although they are often used by others. This can include a smart phone, a magnifier,
wheelchair, hearing aid or any device that assists a person with a disability participate in
everyday life activities.
During discussions about potential topics, the task force expressed a concern related to the
potential cost of accommodations, assistive technology, and accessibility. To address this
concern, the MU ACCESS project at Marshall University collaborated with the American
Foundation for the Blind to develop a series of accessibility-related videos. One of the videos by
a blind person and a person with low vision demonstrates how they use accessible technology
built into devices such as a smart phone. (This video is available at
https://ensemble.marshall.edu/Watch/Fd68TcGz) This, and other videos in the series, are used in

Proceedings of the Appalachian Research in Business Symposium, Eastern Kentucky University, March 26, 2021
62
some Marshall University graduate-level courses, which exemplifies the success of collaborative
efforts around the issue of disability, technology, and employment.
The task force additionally discussed the importance of resources for employers and employees as
an important objective of the continuing education program. Community partners agreed that this
education needs to be concrete and promote practical strategies.
Initial Resources for Employers and Employees:
• American with Disabilities Act (ADA) https://www.ada.gov/
This website is well designed and provides information for both employers and employees
about assistive technology, accommodations, and accessibility. It discusses the legal aspects
and addresses common concerns.
• American Foundation for the Blind (AFB) https://www.afb.org/
This website provides a plethora of videos, resources, and general information. It also provides
some specific information related to COVID-19 for employers who have blind or visually
impaired employees.
• Job Accommodation Network (JAN) https://askjan.org/index.cfm
This website is designed for both employers and employees. It provides information about
specific disabilities, accommodations, and resources. It has a directory of state-by-state
resources, and the website has a LIVE chat feature where they encourage telephone calls for
individual consultations.
Phase 2 - Potential employees with disabilities increasing their employment skills with a focus on
productivity, i.e., technical, and soft skills.
Just as employers need to have more knowledge about disability to hire and retain employees with
disabilities, employees need help with skills development in both technical areas, i.e., software
applications, job-related skills; and, soft skills, i.e., communication, problem solving. Mini
workshops are being developed with a focus on providing a micro-credential that provides
certification for a specific skill. Additionally, the community partners from vocational
rehabilitation are discussing how to provide mentoring and job coaching for newly hired people
with disabilities, which would facilitate productivity and help resolve any issues in the workplace.
Conclusion
This collaborative task force has continued throughout the COVID-19 pandemic and shows that a
complex employment concern can be addressed when partners bring their talents and resources
together to solve a problem. This project is continuing and will likely expand the focus to include
more training for any person with a disability. There have been discussions of addressing the issue
of military veterans with disabilities and graduating high school students with disabilities who may
also benefit from the mini workshops to help them secure their first paid job. There are many
aspects of employment and disability that can be addressed as the task force matures, and partners
want to continue their efforts on behalf of disability and employment issues.

Proceedings of the Appalachian Research in Business Symposium, Eastern Kentucky University, March 26, 2021
63
References
Americans with Disabilities Act (ADA). (2021). https://www.ada.gov/
American Foundation for the Blind (AFB) (2020). https://www.afb.org/
Appalachian Regional Commission. (2021). https://www.arc.gov/appalachian-states/
Bonaccio, S., Connelly, C. E., Gellatly, I. R., Jetha, A., and Martin Ginis, K. A. (2019, January
22). The participation of people with disabilities in the workplace across the employment cycle:
Employer concerns and research evidence. https://doi.org/10.1007/s10869-018-9602-
Job Accommodations Network (JAN). (2020). https://askjan.org/index.cfm
MU ACCESS. (2019). AFB Video Take 1. https://ensemble.marshall.edu/Watch/Fd68TcGz
National Center for Education Statistics (NCES). (2020). Condition of Education: Special
Education Report. https://nces.ed.gov/programs/coe/indicator_cgg.asp
Data Source: U.S. Department of Education, Office of Special Education Programs, Individuals
with Disabilities Education Act (IDEA) database, retrieved February 20, 2020, from
https://www2.ed.gov/programs/osepidea/618-data/state-level-data-files/index.html#bcc; and
National Center for Education Statistics, National Elementary and Secondary Enrollment
Projection Model, 1972 through 2029. See Digest of Education Statistics 2019, table 204.30.
Population Reference Bureau. (2020). Appalachia’s Digital Gap in Rural Areas Leaves Some
Communities Behind – Population Reference Bureau (prb.org)
Teach Access. (2019). Why Teach Accessibility Fact Sheet. Why Teach Accessibility? Fact
Sheet – Teach Access
Proceedings of the Appalachian Research in Business Symposium, Eastern Kentucky University, March 26, 2021
64
Small Business and COVID-19: A Train Wreck on “Main Street”
Robert J. Lahm, Jr., Ph.D.
Professor of Entrepreneurship
College of Business
Western Carolina University
Cullowhee, NC 28723
http://www.DoctorLahm.com
[email protected] (Contact Author)
Key words:
Small business, entrepreneurship, economy, COVID-19
Introduction1
COVID-19’s impact on the global social and economic picture has been like watching a train
wreck, taking place on “Main Street” in slow motion. There are many questions about where we
are going as a nation, and a world at large. “Stores, factories, and many other businesses have
closed by policy mandate, downward demand shifts, health concerns, or other factors” (Fairlie,
2020, p. 727). One of the more popular books on Amazon covering the topic of canning and
preserving foods was on backorder for at least several weeks (researcher’s personal observation).
“Doomsday preppers” and at least some of their prognostications and suggestions moved towards
the mainstream, having greater acceptance than before. There have been shortages on major
Websites of sewing machines, elastic, and other materials – even those that are substitute goods
like coffee filters. Toilet paper was “wiped out” from store shelves (Kirk & Rifkin, 2020). Terms
such as “social distancing” (Bana, Benzell, & Solares, 2020; Gunay & Kurtulmuş, 2021) have
become familiar. One company that has been affected in a positive way by social distancing is
Zoom, which has gone from a relative niche player in business communication (i.e.,
videoconferencing) services to a being a household name (Galgani, 2020). However, a vast
majority of businesses have not fared as well. Bad actors are also hard at work, launching scams
as they hoarded essential items for resale on websites such as Craigslist and eBay. This research
aims to review COVID-19 impacts on entrepreneurs.
1 This present paper, while it is a unique work product unto itself, is connected to an ongoing research stream
(including literature review databases).

Proceedings of the Appalachian Research in Business Symposium, Eastern Kentucky University, March 26, 2021
65
Literature Overview
A local computer database comprised of items associated with the small business,
entrepreneurship, and the “gig” economy generally, pre-COVID-19, has been combined with
results from post-COVID-19 searches using library databases current through mid-January 2021.
Library database collections including those from ABI/INFORM, Ebsco, and ProQuest have been
consulted. Filters have been applied to these library database searches, setting limits as follows:
scholarly sources; full text available; English language publications. Most importantly, for the
benefit of other future researchers who may wish to discern a breadcrumb trail, a filter was also
applied to limit results to business disciplines. The reason for this is that across disciplines and
around the globe, there are millions of results relative to scholarship pertaining to all aspects of
COVID-19 (medical/health care disciplines being a prime example, as one might easily guess).
The software used for the resulting database as a whole (approximately 370 artifacts/records)
allows for attachments (e.g., PDF, Excel, and images, most frequently) in association with
individual bibliography items. Additional local databases, in support of research on topics such
as social entrepreneurship, innovation, and new product development, comprised of hundreds of
artifacts have served to inform this present research under a qualitative framework. Multiple
search strategies have been used to develop databases like the ones mentioned above, as an ongoing
stream of research has been pursued over a period of several years.
Methodology
Under a qualitative researcher’s framework, attachments (as discussed above) are identified as
artifacts. All artifacts may be regarded as sources of data, and these may in-turn be analyzed under
a qualitative research paradigm (Creswell, 1994; Hodder, 1994; Strauss & Corbin, 1994). The role
of the researcher is to ask questions, collect data, and to identify patterns and themes under a
qualitative paradigm. Where similar or the same patterns may present themselves through multiple
forms or sources of data, confidence in researchers’ findings my be increased through triangulation
(Caporaso, 1995; Maxwell, 1992). On the other hand, data that is lacking applicability (or
credibility) relative to a given phenomenon under study may be dismissed (Caporaso, 1995). From
such analysis, the researcher may interpret meaning(s) and report findings. From patterns in data,
the qualitative researcher seeks to establish theoretical frameworks while using a constructivist
approach (Barry, 1996; Schwandt, 1994). Such frameworks are not intended to be or presented as
being generalizable. Rather, where little is known about a phenomenon due to a lack of prior
scholarly research or other foundational resources, such qualitative research approaches may be
deemed necessary.
Results and Implications
Gopinath (2020), writing on the International Monetary Fund’s blog, declared via a post title that:
“The ‘great lockdown’ has been the ‘worst economic downturn since the Great Depression.’”
Impulse buying has created major fluctuations in the availability of certain goods (Ahmed,
Streimikiene, Rolle, & Duc, 2020). Certain industries and jobs have been affected more than
others (Brown, 2020). Travel, hospitality, restaurant, and other industries (which involve higher
degrees of personal contact) have been among the hardest hit (Brown, 2020). Sports arenas, movie
theaters, amusement parks and other venues that entail large gatherings have been closed, opened
under restrictions, and might close again (Gunay & Kurtulmuş, 2021). Small business owners

Proceedings of the Appalachian Research in Business Symposium, Eastern Kentucky University, March 26, 2021
66
have been threatened with fines, forced closures, and jail time. Education is in a state of upheaval
as well as government services of all kinds. Another term, “non-essential” (Cowling, Brown, &
Rocha, 2020), is also now in popular use. There are non-essential jobs and non-essential
businesses, as well as some argument as to what constitutes the opposite of these, i.e., essential
(the same logic is being applied relative to vaccine eligibility and distribution). At the same time,
evidence of abundant ingenuity (and resolve) can be found on social media (as they are amplified
by traditional media). DIY’ers organized in groups and shared information about how to make
breathing masks and other personal protective gear. The aforementioned anecdote about mask-
making and community organizing exemplifies social entrepreneurs’ efforts, well. Fairlie (2020),
extrapolating from CPS (Current Population Survey) data from the Bureau of Labor Statistics,
found demographic patterns among small business owners that have been hit the hardest:
Patterns across gender, race, and immigrant status reveal alarming findings.
African‐Americans experienced the largest losses, eliminating 41% of active
business owners. Latinx also experienced major losses with 32% of business
owners halting activity between February and April 2020. Immigrant business
owners suffered a large drop of 36% in business activity, and female business
owners suffered a disproportionate drop of 25%. (p. 728)
Organizations of all kinds shifted operations, at least in part, to workers’ homes (with some
inconclusive results in terms of impacts on productivity (Bolisani, Scarso, Ipsen, Kirchner, &
Hansen, 2020). Indeed, “the COVID‐19 pandemic paralyzed the world and revealed the critical
importance of supply chain management — perhaps more so than any other event in modern
history — in navigating crises” (Craighead, Ketchen, & Darby, 2020, p. 838). Data are coming
in. Although, as observed by Fairlie (2020), “the early effects of COVID‐19 on small business
and entrepreneurs are not well known because of the lack of timely business‐level data released
by the government” (p. 727). The U.S. Census Bureau’s Small Business Pulse Survey ("Small
business pulse survey," 2021), for instance, is shedding some light on business owners’
perceptions of the impact as illustrated in Figure 1:
Figure 1. Coronavirus pandemic’s effect on small businesses (national averages)2
2 Figure developed from data published by The U.S. Census Bureau’s Small Business Pulse Survey [extracted using
pull-down menus; survey data collected 12/28/2020 to 1-3-2021]. Percentages in chart presented are rounded.
Retrieved January 15, 2021, from https://portal.census.gov/pulse/data/

Proceedings of the Appalachian Research in Business Symposium, Eastern Kentucky University, March 26, 2021
67
As shown, at the end of 2020 and the beginning of 2021, just over 30% of businesses reported a
“large negative effect.” This percentage is down from earlier in 2020, when just over half of
businesses reported significant distress (Brown, 2020). On the other end of the spectrum, only
about one-and-a-half percent reported a “large positive effect.”
Conclusion
Freelancing, home-based business pursuits, self-employment, and the “gig” economy had been
trending upward, at least, prior to the insertion of COVID-19 into the global social and economic
picture. For instance, Dourado and Koopman (2015) utilized IRS 1099-MISC form data and
concluded: “The shift toward more contract work is a real and dramatic change in the labor
market.” Following the Great Recession (Katz & Krueger, 2016; Larrimore, Durante, Kreiss, Park,
& Sahm, 2018), small business start-ups had also been rebounding. Finally, as an observation,
scholarly research – often with a long publication cycle – has a limitation relative to COVID-19
in terms of providing immediacy. Other kindred sources for small business and entrepreneurship
researchers, also have demonstrated themselves to have a similar limitation. For example, the U.S.
Small Business Administration’s (SBA) Office of Advocacy publishes an oft-quoted FAQs
document, updated annually ("Frequently asked questions about small business," 2020); in
reviewing the SBA’s most recent release, which is dated October 2020, one would likely not even
imagine that a global pandemic (crisis) existed until arriving at a footnote at the bottom of the first
page and then headings on the second page of the document. The Webpage which hosts the SBA’s
December Economic Bulletin states (a rather apparent lament): “the lack of recent data on business
closures makes it difficult to assess the overall state of small business” ("December Economic
Bulletin," 2020). Even if popular press sources may be held suspect, they do at least recognize
that conditions on the ground for small business and millions of others, such as individuals who
are now displaced and unemployed, have drastically changed. Anecdotal as it may be, we’ve been
witnessing a “train wreck on ‘Main Street.’”
References
Ahmed, R. R., Streimikiene, D., Rolle, J.-A., & Duc, P. A. (2020). The COVID-19 pandemic and
the antecedants for the impulse buying behavior of US citizens. Journal of competitiveness,
12(3), 5-27. doi:10.7441/joc.2020.03.01
Bana, S. H., Benzell, S. G., & Solares, R. R. (2020). Ranking how national economies adapt to
remote work. MIT Sloan Management Review, 61(4), 1-5.
Barry, D. (1996). Artful inquiry: A symbolic constructivist approach to social science research.
Qualitative Inquiry, 2(4), 411-438.
Bolisani, E., Scarso, E., Ipsen, C., Kirchner, K., & Hansen, J. P. (2020). Working from home
during COVID-19 pandemic: Lessons learned and issues. Management & marketing (Bucharest,
Romania), 15(1), 458-476. doi:10.2478/mmcks-2020-0027
Brown, D. (2020, December 21). The pulse of small business: An industry breakdown.
Retrieved from https://cdn.advocacy.sba.gov/wp-content/uploads/2020/12/21102154/December-
PULSE-Fact-Sheet.pdf

Proceedings of the Appalachian Research in Business Symposium, Eastern Kentucky University, March 26, 2021
68
Caporaso, J. A. (1995). Research design, falsification, and the qualitative–quantitative divide.
American Political Science Review, 89(2), 457-460.
Cowling, M., Brown, R., & Rocha, A. (2020). Did you save some cash for a rainy COVID-19
day? The crisis and SMEs. International small business journal, 38(7), 593-604.
doi:10.1177/0266242620945102
Craighead, C. W., Ketchen, D. J., & Darby, J. L. (2020). Pandemics and supply chain
management research: Toward a theoretical toolbox. Decision sciences, 51(4), 838-866.
doi:10.1111/deci.12468
Creswell, J. W. (1994). Research design: Qualitative & quantitative approaches. Thousand
Oaks, CA: Sage Publications.
December Economic Bulletin. (2020, December 8). Retrieved from
https://cdn.advocacy.sba.gov/wp-content/uploads/2020/12/08111415/December-Economic-
Bulletin.pdf
Dourado, E., & Koopman, C. (2015). Evaluating the growth of the 1099 workforce. Retrieved
from http://www.mercatus.org/publication/evaluating-growth-1099-workforce
Fairlie, R. (2020). The impact of COVID‐19 on small business owners: Evidence from the first 3
months after widespread social‐distancing restrictions. Journal of economics & management
strategy. doi:10.1111/jems.12400
Frequently asked questions about small business. (2020, October). Retrieved from
https://cdn.advocacy.sba.gov/wp-content/uploads/2020/11/05122043/Small-Business-FAQ-
2020.pdf
Galgani, M. (2020, March 18). IPO stock with 275% growth keeps zooming in coronavirus stock
market. Retrieved from http://www.investors.com/research/breakout-stocks-technical-
analysis/zoom-stock-ipo-leads-coronavirus-stock-market/
Gopinath, G. (2020). The great lockdown: Worst economic downturn since the Great
Depression. Retrieved from https://blogs.imf.org/2020/04/14/the-great-lockdown-worst-
economic-downturn-since-the-great-depression/
Gunay, S., & Kurtulmuş, B. E. (2021). COVID-19 social distancing and the US service sector:
What do we learn? Research in international business and finance, 56.
doi:10.1016/j.ribaf.2020.101361
Hodder, I. (1994). The interpretation of documents and material culture. In N. K. Denzin & Y. S.
Lincoln (Eds.), Handbook of qualitative research (pp. 393-402). Thousand Oaks, CA: Sage
Publications.
Katz, L. F., & Krueger, A. B. (2016). The rise and nature of alternative work arrangements in the
United States, 1995-2015. NBER Working Paper No. 22667. Retrieved from
http://www.nber.org/papers/w22667

Proceedings of the Appalachian Research in Business Symposium, Eastern Kentucky University, March 26, 2021
69
Kirk, C. P., & Rifkin, L. S. (2020). I'll trade you diamonds for toilet paper: Consumer reacting,
coping and adapting behaviors in the COVID-19 pandemic. Journal of Business Research, 117,
124-131. doi:10.1016/j.jbusres.2020.05.028
Larrimore, J., Durante, A., Kreiss, K., Park, C., & Sahm, C. (2018, May). Report on the
economic well-being of U.S. households in 2017. Retrieved from
http://www.federalreserve.gov/publications/files/2017-report-economic-well-being-us-
households-201805.pdf
Maxwell, J. A. (1992). Understanding and validity in qualitative research. Harvard Educational
Review, 62(3), 279-300.
Schwandt, T. A. (1994). Constructivist, interpretivist approaches to human inquiry. In N. K.
Denzin & Y. S. Lincoln (Eds.), Handbook of qualitative research (pp. 118-137). Thousand Oaks,
CA: Sage Publications.
Small business pulse survey. (2021, January 14). Retrieved from
https://portal.census.gov/pulse/data/
Strauss, A., & Corbin, J. (1994). Grounded theory methodology: An overview. In N. K. Denzin
& Y. S. Lincoln (Eds.), Handbook of qualitative research (pp. 273-285). Thousand Oaks, CA:
Sage Publications.

Proceedings of the Appalachian Research in Business Symposium, Eastern Kentucky University, March 26, 2021
70
Exploring Moderating Effects of Personality on Satisfaction and
Loyalty
Steven Leon
Department of Marketing and Supply Chain Management
Walker College of Business
Appalachian State University
416 Howard Street
Boone, NC 28608
828.262.7130 (Contact Author)
Abigail Leon
Watauga High School
300 Go Pioneers Drive
Boone, NC 28607
Key words:
Personality traits, satisfaction, loyalty, service quality, airline
Introduction
Business practitioners assume there is a positive relationship between satisfaction, loyalty and
repurchase intention. Afterall, researchers have found that satisfied customers are likely to express
loyalty behaviors (Ranaweera & Prabhu, 2003). Loyal customers tend to pay less attention to
competing brands and advertising, are less price sensitive, and create positive WOM (Desai &
Mahajan, 1998). While satisfaction was found to have a direct positive influence on loyalty
(Heckman & Guskey, 1998; Mittal et al., 1999), this finding is not universal. Arnett et al., (2003)
and Reynolds and Beatty (1999) did not find a direct relationship between the two constructs. King
and Dennis (2003) assert that one reason for the inconsistency in the findings is because every
consumer has a unique individual cognitive process that influences their satisfaction, loyalty, and
behavioral intent perceptions. While cognitive processes may be one reason, personality traits
could be another reason. Personality traits have been shown to affect consumer complaint behavior
(Huang & Chang, 2008), employee retention (Barrick & Zimmerman, 2009), and job satisfaction
(Bui, 2017).
Historically, much of the customer satisfaction and loyalty research includes intrinsic attributes
such as service quality. Service quality has been an integral part of satisfaction and loyalty
research. Service quality has been shown to have a positive influence on customer satisfaction in

Proceedings of the Appalachian Research in Business Symposium, Eastern Kentucky University, March 26, 2021
71
various industries such as, tourism (Lee et al., 2007), conventional retailing (Cronin et al., 2000),
online shopping (Hsu & Lin, 2015) and health care service (Cronin et al., 2000). To a lesser degree,
extrinsic attributes have been included in customer satisfaction and loyalty research.
Therefore, using the U.S. airline industry, the objective for this research is to explore the
moderating effects of personality traits on satisfaction and behavioral loyalty. This research
specifically examines the moderating effects of the “big five” personality traits between service
quality and satisfaction (Figure 1) and between satisfaction and conative (behavioral) loyalty
(Figure 2). Conative loyalty includes word of mouth, recommendations, and intent to repurchase.
Figure 1. Conceptual Model 1
Figure 2. Conceptual Model 2
Literature Overview
Individuals have unique personality attributes that are different from the others. Personality can be
described as a dynamic, internal organization of psychological systems that influence a person’s
behaviors, thoughts, and feelings (Carver & Scheier, 2004). Personality determines an individual’s
disposition and their response to the environment (Mishra & Vaithianathan 2015). There are two
schools of thought related to trait theory. One school believes that everyone has the same set of
traits, though there is variance in personality because each trait is more or less prominent from one
person to another. Thus, the same traits are common among all people but to different extents. The
second school believes that every person is different from one another because everyone has a
select and limited list of traits. McCrae et al. (1986), a believer of the first school of trait theory,
classified the personality traits into five factors. The five-factor model or “big five” personality
traits consists of neuroticism, extraversion, openness, agreeableness, and conscientiousness. The
five-factor model is a prominent classification of personality and categorizes a large number of
traits into five dimensions and has been consistently used to explain individual differences in a
variety of empirical settings (McCrae & Costa 1985). This study examines the first school of
thought, where individuals encompass all five traits, though at different levels.
While previous consumer personality trait research has been conducted in various areas such as
banking (Al-hawari, 2015), retail (Bove & Mitzifiris, 2007), and tourism (Faullant et al., 2011),
often, the research does not examine all of the “big five” personality traits, and when they do, they
tend to examine direct effects rather than moderating effects. However, when moderating effects
are examined, they tend to overlook the moderating effects between service quality and satisfaction
and between satisfaction and loyalty.

Proceedings of the Appalachian Research in Business Symposium, Eastern Kentucky University, March 26, 2021
72
Methodology
Data for this research was collected in 2018 using an online survey distributed via Amazon
Mechanical Turk (MTurk). The survey returned 708 responses. After screening for incomplete and
duplicate responses, and for surveys completed from outside of the United States, 624 usable
observations remained. To ensure completion of the survey, to lessen the likelihood of duplicates,
and to deter respondents from outside of the United States from answering the survey, respondents
were given $1.00US to complete the survey.
Service quality, satisfaction, loyalty and personality constructs are based on a 5-point Likert scale
where 1 = “Strongly disagree” and 5 = “Strongly agree.” To minimize common method variance,
the survey was developed in accordance with the recommendations from Podsakoff et al. (2003).
The survey items were constructed as closely as possible to validated items in previous studies,
the directions for the survey stated that the survey was anonymous, and respondents were asked to
provide honest answers.
The analysis was conducted using IBM SPSS v.25 and SPSS Process 3.5 macro. Items were first
analyzed using factor analysis and second, the resultant constructs were analyzed for moderating
effects. The latent variables for the analysis included service quality, satisfaction, behavioral
loyalty, and five personality traits: neuroticism, extraversion, openness, agreeableness, and
conscientiousness. Model 1 and Model 2 were analyzed five separate times, each time with one of
the five personality traits.
Results and Implications
The socio-demographic distribution of the sample consists of fewer females (43.91%) than males.
Most of the respondents are in the age groups between 25 and 35 years old (47.76%) and between
36 and 45 years old (22.28%). The educational level of the sample is mostly characterized by 4-
year college degree (45.83%) and some college (29.60%). Respondents selected economy seat
class the most (84.78%) and the majority of the sample flew domestically (86.38%).
Factor analysis was conducted using principal component extraction and varimax rotation. Kaiser-
Meyer-Olkin Measure of Sampling Adequacy = .925, and Bartlett's Test of Sphericity is significant
at p < .001, indicating that factor analysis may be useful for the data. The measurement items
showed high levels of internal consistency reliability, with Cronbach’s α values above the cutoff
value of 0.70 (Hair et al., 2006). The loadings and cross-loadings of factor analysis show that each
item loads highly within its corresponding latent constructs showing sufficient discriminant
validity. Indicator reliability can be assumed if all indicator loadings are above the threshold value
of 0.70 (Hair et al., 2006).
When examining the moderating effects of personality on satisfaction (Model 1), neuroticism
and extraversion are found to be insignificant. Openness (β =.2876, p = .0026), agreeableness (β
=.3386, p < .001), and conscientiousness (β =.2973, p < .001) are found to be significant and
influence satisfaction directly, however, their moderating effects between service quality and
satisfaction are found to be insignificant (Table 1).

Proceedings of the Appalachian Research in Business Symposium, Eastern Kentucky University, March 26, 2021
73
Openness Agreeableness Conscientiousness
Service Quality .7526 *** .7340 *** .7365 ***
Openness .2876 **
Agreeableness .3386 ***
Conscientiousnes
s
.2973 **
Moderating
Effect Not significant Not significant Not significant
R-sq .5711 .5796 .5712
R-sq change .0014 .0018 .0014
p value P < .0001 P < .0001 P < .0001 Notes: ** P< .05, *** P< .001
Table 1. Results of Model 1 Service Quality and Satisfaction
When examining the moderating effects of personality on behavioral loyalty (Model 2),
extraversion, agreeableness, and conscientiousness were found to be insignificant. Neuroticism
(β = -.1707, p = .0549) is found to be significant and influence loyalty directly, however, its
moderating effect between satisfaction and loyalty is found to be insignificant. The direct effect
of openness on loyalty is found to be insignificant, though its moderating effect between
satisfaction and loyalty is found to be significant (β =.0458, p = .0978) (Table 2).
Neuroticism Openness
Satisfaction .7292 *** .6361 ***
Neuroticism -.1707 * ---
Openness --- Not Significant
Interaction
Moderating
Effect
Not significant .0458 *
R-sq .6290 .6282
R-sq change .0015 .0016
p value P < .0001 P < .0001 Notes: * P< .10, *** P< .001
Table 2. Results of Model 2 Satisfaction and Loyalty

Proceedings of the Appalachian Research in Business Symposium, Eastern Kentucky University, March 26, 2021
74
Figure 3 shows that as satisfaction increases, loyalty increases in those with low, moderate, and
high levels of openness. Those who have the highest levels of openness also have the highest levels
of loyalty.
Figure 3. Openness Moderation
Though this research found that moderating effects of personality is limited, it did uncover that
openness, agreeableness, and conscientiousness affect satisfaction and neuroticism influences
loyalty directly. Given the findings of this research, managers might ascertain consumer
personality attributes to improve satisfaction, thus leading to higher levels of loyalty.
Conclusion
This research explored the moderating effects of the “big five” personality traits on satisfaction
and loyalty. It was found that openness has a moderating effect on loyalty while other personality
traits have direct effects on satisfaction and loyalty. To improve this line of research, future
research may explore other factors such as predisposition and trust in which personality might
interact with. Additionally, multi-group analysis could be explored to find additional insights.
References
Al-hawari, M. A. (2015). How the personality of retail bank customers interferes with the
relationship between service quality and loyalty. International Journal of Bank Marketing, 33(1),
41–57.
Arnett, D. B., German, S. D., & Hunt, S. D. (2003). The identity salience model of relationship
marketing success: The case of nonprofit marketing. Journal of Marketing, 67(2), 89–105.
Barrick, M. R., & Zimmerman, R. D. (2009). Hiring for retention and performance. Human
Resource Management, 48(2), 183– 206.
Bove, L., & Mitzifiris, B. (2007). Personality traits and the process of store loyalty in a
transactional prone context. Journal of Services Marketing, 21(7), 507–519.
3.20
3.70
4.20
4.70
Low Moderate High
Loya
lty
Satisfaction
Openness Moderator
Low
Medium
High

Proceedings of the Appalachian Research in Business Symposium, Eastern Kentucky University, March 26, 2021
75
Bui, H. T. (2017). Big Five personality traits and job satisfaction: Evidence from a national sample.
Journal of General Management, 42(3), 21–30.
Carver, C. S. & Scheier, M. F. (2004) Perspectives on Personality. Pearson Education Inc.:
Boston, MA.
Cronin, J. J., Brady, M. K., & Hult, G. T. M. (2000). Assessing the effects of quality, value, and
customer satisfaction on consumer behavioral intentions in service environments. Journal of
Retailing, 76(2), 193–218.
Desai, K. K., & Mahajan, V. (1998). Strategic role of affect-based attitudes in the acquisition,
development, and retention of customers. Journal of Business Research, 42(3), 309–324.
Faullant, R., Matzler, K., & Mooradian, T. A. (2011). Personality, basic emotions and satisfaction:
Primary emotions in the mountaineering experience. Tourism Management, 32(6), 1423–1430.
Hair, J. F., Tatham, R. L., Anderson, R. E., & Black, W. (2006) Multivariate data analysis (Vol.
6). Pearson Prentice Hall: Upper Saddle River, NJ.
Heckman, R., & Guskey, A. (1998). Sources of customer satisfaction and dissatisfaction with
information technology help desks. Journal of Market-Focused Management, 3(1), 59–89.
Hsu, C. L., & Lin, J. C. C. (2015). What drives purchase intention for paid mobile apps? – An
expectation confirmation model with perceived value. Electronic Commerce Research and
Applications, 14(1), 46–57.
Huang, J. H. & Chang, C. C. (2008). The role of personality traits in online consumer complaint
behavior and service recovery expectation. Social Behavior and Personality, 36(9), 1223–1232.
King, T., & Dennis, C. (2003). Interviews of deshopping behaviour: An analysis of theory of
planned behaviour. International Journal of Retail and Distribution Management, 31(3), 153–163.
Lee, C. K., Yoon, Y. S., & Lee, S. K. (2007). Investigating the relationships among perceived
value, satisfaction, and recommendations: The case of the Korean DMZ. Tourism Management,
28(1), 204–214.
McCrae, R. R., & Costa, P. T. (1985). Comparison of EPI and psychoticism scales with
measures of the five-factor model of personality. Personality and Individual Differences, 6(5),
587–97.
McCrae, R., Costa, T. Jr., & Busch, C. (1986). Evaluating comprehensiveness in personality
systems: The California Q-set and the five-factor model. Journal of Personality, 54(2), 430–446.
Mishra, V., & Vaithianathan, S. (2015). Customer personality and relationship satisfaction:
Empirical evidence from Indian banking sector. International Journal of Bank Marketing, 33(2)
pp. 122–142.
Proceedings of the Appalachian Research in Business Symposium, Eastern Kentucky University, March 26, 2021
76
Mittal, V., Kumar, P., & Tsiros, M. (1999). Attribute-level performance, satisfaction, and
behavioral intentions over time: A consumption-system approach. Journal of Marketing, 63(2),
88–101.
Podsakoff, P. M., MacKenzie, S. B., Lee, J. Y., & Podsakoff, N. P. (2003). Common method
biases in behavioral research: A critical review of the literature and recommended remedies. The
Journal of Applied Psychology, 88(5), 879–903.
Ranaweera, C., & Prabhu, J. (2003). On the relative importance of customer satisfaction and trust
as determinants of customer retention and positive word of mouth. Journal of Targeting,
Measurement and Analysis for Marketing, 12(1), 82–90.
Reynolds, K. E., & Beatty, S. E. (1999). Customer benefits and company consequences of
customer-salesperson relationships in retailing. Journal of Retailing, 75(1), 11–32.

Proceedings of the Appalachian Research in Business Symposium, Eastern Kentucky University, March 26, 2021
77
Innovative Leadership: Breaking Constraints
Dr. Thomas M. Martin
School of Business
Eastern Kentucky University
BTC 147
521 Lancaster Avenue
Richmond, KY 40475
859-622-2383
Key words:
Leadership, Innovation Bureaucracy, Robert M. Gates
Introduction
Dr. Robert M. Gates has led three of the largest, most complex, least adaptive organizations that
have ever been created. First, as the youngest director of Central Intelligence in our history –
and the first to have done so, starting from an entry-level position (Whipple, 2020) - a global spy
network of 22,000 employees, trained in the arts of secrecy and deception. Second, as president
of Texas A&M, the fifth largest public university in the United States, with 70,000 students and
3,500 “independent contractors” (Rosovksy, 1990) that share governance. Third, as secretary of
the Defense Department, the largest and most powerful bureaucracy in the world, housing the
Army, Navy, Air Force, Marines, and Coast Guard. He is the fourth longest-tenured Secretary of
Defense and the first to serve presidents of two political parties.
And he was the sole inspiration for Tom Clancy’s best known fictional character, Jack Ryan.
Described as quick, bright, with a deep foresight in what was coming, putting different pieces of
a puzzle into a larger context, and, “Pound for pound, he is the best bureaucrat we ever had. He
knew how to run the U.S. government” (Whipple, 2020: 149).
Gates said of the Department of Defense, but is applicable to the CIA and Texas A&M,
“…nearly everyone there is a career professional with considerable job security. Every major
part of the organization – budget, acquisition programs, and policy – has a constituency inside
and outside…everyone has an oar in the water…pulling in different directions” (Gates, 2014:
577). Admiral James Stavridis, retired Supreme Allied Commander, NATO, said of leading a
large, diverse organization like the Department of Defense, “What happens when you put eight
colonels in an electrical circuit – you get a circuit of infinite impedance”.
Proceedings of the Appalachian Research in Business Symposium, Eastern Kentucky University, March 26, 2021
78
The bigger the organization, the higher the level of inertia, the more resistance to innovation, the
more gridlock, obfuscation, self-interest, delay, and decay. Gates actively worked to break these
circuits of impedance and force innovation, by envisioning new ways to operate, adapting to the
nature of the organization, and forcing accountability. And by any leadership metric that can be
quantified – whether it be adapting to the external environment, using human resources
efficiently, allocating capital, or formulating and implementing solutions to complex social
problems – he achieved success at each stop.
How did Gates break these constraints? This paper seeks to develop a general framework of
innovative leadership.
Literature Overview
This paper will examine the literature on leadership, innovation, and organizations, specifically,
bureaucracies. Leadership has been studied for centuries. Unlike other disciplines that have a
foundational text on which the rest of scholarship rests (like Neustadt, 1960), the study of
leadership is very fluid.
Rost (1991) read the modern leadership literature, back to 1900 and found leadership had been
defined more than two hundred ways and often the definitions are incompatible, within the same
text. For example, he found that leaders should be simultaneously decisive and flexible, or
visionary and open-minded. In the 30 years since, the study has only increased, the picture is
just as cloudy, clarifying nothing. Kellerman (2012), a founding director of the Harvard
Kennedy School’s Center for Public Leadership, noted that, “…we don’t have much better an
idea of how to grow good leaders, or of how to stop or at least slow bad leaders, than we did a
hundred or even a thousand years ago.”
According to Rost (1991), the closest scholars came to a consensus definition of leadership was
the idea that it was “good management”. More recently, Suddaby (2010) argued for more
precise and categorical distinctions. Anderson and Sun (2017:76) agree, examining the literature
just since the turn of the 21st century and found, “…a bewildering assortment of leadership
styles”, including shared/distributed, authentic, ethical, spiritual, pragmatic, ideological, and
servant leadership, later admitting in a footnote that they omitted several styles, because it would
be difficult to do so in one paper.
Zegart (2007) show how government agencies lack three advantages that private organizations
enjoy. The first, is that government agencies lack the imperative of markets to adapt or suffer
the consequences. Markets create the ultimate incentive – unemployment – whereas government
agencies and the bureaucrats in those agencies, do not fear that poor performance will lead to
their death and replacement by newer, fitter firms.
The second is that creators and employees in private sectors want their firm to succeed, whereas
agencies are built on political compromise. As Gates notes (Chicago Council on Global Affairs),
the executive branch has a board of directors of 535 members, with no similar interests with the
executive branch, or the other 535 members.

Proceedings of the Appalachian Research in Business Symposium, Eastern Kentucky University, March 26, 2021
79
The third is that leaders of private firms have more freedom to run their firms than public
managers do. At Coca-Cola, the mission is to sell soft drinks, whereas at the U.S. Forest
Service, their mission is to harvest timber and protect National Parks at the same time. The
cynic would note those goals are in conflict with each other. Additionally, if Linda Rendle, the
CEO of Clorox, wants to raise capital to expand overseas operations, she can get financial
resources from a stock offering, issuing debt, going to bank down the street, or friends and
family. Conversely, Gates raises capital from Congress, and only Congress or the Texas state
legislature when he was at Texas A&M.
Methodology
This paper will utilize the 268 boxes of public papers, taking up 134.50 linear feet at William &
Mary that Dr. Gates donated in 2016, as well as the four books he has published (Gates, 1996,
2014, 2016, 2020) to advance this work. Qualitative research has proved valuable understanding
how leaders create change, achieve organizational ends, and explore new areas of leadership
(Bryman, 2004).
Results and Implications
Preliminary study shows that Gates was successful at breaking constraints of entrenchment at
each complex organization. As the director of Central Intelligence at the end of the Cold War,
he had to “break the concrete” (Rustand, 2021) of 16 agencies and billions of dollars that had
been singularly focused on the Soviet Union for 45 years. At the same time, Gates was breaking
social constraints, allowing gay employees to serve openly, long-before the rest of federal
government could settle on policy (he did the same for scout leaders and volunteers, as president
of the Boy Scouts of America, one of the largest youth organizations in the U.S.).
As president of Texas A&M, he increased the size and quality of the faculty; improved graduate
and undergraduate programming; increase diversity dramatically without affirmative action or
legacy admissions; and made improvements to the physical plant (Letter to Regents, June 21,
2004).
As Defense secretary, he cut over 30 defense programs, costing $300 billion; cut $180 billion
dollars out of the bureaucracy; acquired more-heavily armored vehicles to protect soldiers;
reduced medivac times from two hours to less than 50 minutes; fired the Secretary of the Army,
Secretary of the Air Force, and the Assistant Secretary of the Air Force over the poor treatment
of patients at Walter Reed Hospital; and handed the elected Iraqi government, a stable, secure
Iraq in 2009 (Gates, 2014).
From studying his papers, there are seven takeaways that explain how Gates was able to lead
each of these diverse entities successfully. First he fundamentally believes in institutions. His
latest book (Gates, 2020) makes the case for the “symphony” of U.S. global leadership, besides
the military: diplomacy, economics, strategic communication, development assistance,
intelligence, and technology.
Second, he does not micromanage, but has “micro-knowledge” (Gates 2016) of the institution.
With eighteen-hundred pages of published books, as well as 238 boxes of material at William &

Proceedings of the Appalachian Research in Business Symposium, Eastern Kentucky University, March 26, 2021
80
Mary, Gates knows how the government and higher education works; understands the political
landscape in both sectors; and knows how to win friends, and bargain with enemies.
Third, when you understand the institution deeply, you naturally develop instincts. When he
became president of Texas A&M, he promised to use the blueprint of his predecessor. That
blueprint had 12 imperatives for change that Gates recognized as impossible to implement. He
met with each college, asking them to agree on three or four. Those four imperatives – increase
and quality and compensation of faculty; increase graduate fellowships and assistance; improve
the physical plant; and increase diversity, would be his agenda during his four-year tenure.
Fourth and fifth, that blueprint was reduced to four, because he was sincere about getting
feedback and delegating decision making. Gates cut across silos to win support of those in the
trenches who have to do the work, particularly amongst the career professionals. Gates
frequently used task forces, councils, and advisory committees, to build consensus. Leaders
cannot hold individuals accountable if they do not let go of the steering wheel. ‘Because I
included so many faculty, administrators, students, and [alumni] in the process, the changes were
accepted with little resistance and endured after I left. (Gates, 2016: 71).
Sixth, Gates listened, more than he spoke. He was often criticized in both the Bush and Obama
administrations, for not speaking in cabinet meetings, unless specifically called upon. By
waiting to speak, he knew what the other principals were thinking before he spoke and could
calculate what needed to be said and how to express it. This was advantageous because the
meeting can conclude along the lines he preferred. With other issues, he had not made up his
mind and wanted to hear what others had to say.
Finally, Gates acted decisively. Whether it was social change at the CIA or the mistreatment of
veterans at Walter Reed, once he had the information to make a decision, he made it. ‘Don’t
take the job if you don’t want to make decisions – and have the political smarts to make them
stick’ (Rustand, 2021).
Limitations and Future Research
Much more investigation in the leadership, innovation, and bureaucracy literature is needed to
flesh out this development. There is much more that can be done, using the public papers housed
at William & Mary. After a week, I had only reviewed approximately 7% of the content.
Conclusion
Despite these limitations, early results show that Dr. Gates is a remarkable leader who succeeds,
despite sometimes impenetrable, impersonal, and complex organizations. This study attempts to
better understand how leaders break these constraints, gaining insight from the well-documented
career of Dr. Gates. Implications can guide leaders for success in challenging the status quo of
any organization.
References
Anderson, M.H. and P.Y.T. Sun (2017) Reviewing Leadership Styles: Overlaps and the Need for
a New “Full-Range” Theory. International Journal of Management Reviews, Vol. 19, 76-96
Proceedings of the Appalachian Research in Business Symposium, Eastern Kentucky University, March 26, 2021
81
Bryman, A. (2004) “Qualitative research on leadership: a critical but appreciative review. The
Leadership Quarterly, 15: 729-769
Gates, R.M. (2004) Memorandum to Board of Regents, June 21, 2004. Box 144 of the Public
Papers of Robert M. Gates. William & Mary
Gates, R. M. (1996). From the Shadows: The Ultimate Insider's Story of Five Presidents and
Now They Won the Cold War. Riverside: Simon & Schuster.
Gates, R. M. (2014). Duty. London: WH Allen
Gates, R. M. (2016). A passion for leadership: Lessons on change and reform from fifty years of
public service. New York: Vintage Books
Gates, R. M. (2020). Exercise of power: American failures, successes, and a new path forward in
the post-Cold War world. New York: Alfred A. Knoph
Chicago Council on Global Affairs website. Secretary of Gates on Leadership. Accessed January
8, 2021 https://www.youtube.com/watch?v=YO6f8t06yDg
Kellerman, B. (2012) The End of Leadership. New York: HarperCollins
Neustadt, R. E. (1960). Presidential power, the politics of leadership. New York: Wiley
Rosovsky, H. (1990) The university: an owner’s manual. New York, NY: W.W. Norton
Rustand, W. (2021) Conversation with Robert M. Gates. Accessed January 9, 2021
https://www.youtube.com/watch?v=gjR9SaCXfZE
Suddaby, R. (2010) Editor’s comments: construct clarity in theories of management and
organization. Academy of Management Review, 35, 346-357
Whipple, C. (2020) The spymasters: how the CIA directors shape history and the future. New
York: Scribner
Zegart, A. (2007). Spying Blind: The CIA, the FBI, and the Origins of 9/11. Princeton; Oxford:
Princeton University Press.

Proceedings of the Appalachian Research in Business Symposium, Eastern Kentucky University, March 26, 2021
82
An Initial Look at Patterns of Appellate Decisions in Employment
Related Cases
Michael M. McKinney
Department of Management and Marketing
College of Business and Technology
305 Sam Wilson Hall
East Tennessee State University
Johnson City, Tennessee 37614
423-202-5225 (Contact Author)
C. Allen Gorman
Department of Management and Marketing
College of Business and Technology
225 Sam Wilson Hall
East Tennessee State University
Johnson City, Tennessee 37614
423-439-4433
Key words:
Court decisions, lawsuit, human resources, discrimination
Introduction
The Civil Rights Act (CRA) of 1964 was enacted by Congress to address discrimination in many
areas. Prior to passage of the Act, employers were subject to various state laws and regulations
governing discrimination in the workplace. Title VII of the statute extended mandates of the
federal law to the employment context. Several years ago, the authors initiated a discussion to
develop a data set that would extend a previous study conducted by Jon Werner and Mark Bolino
(1997) to determine which variables most influenced judicial decisions when performance
appraisals were at issue in a lawsuit. While proceeding with that stream of research, the authors
decided to expand the model in terms of scope, time and geographic reach. This paper provides
descriptive statistics of some preliminary findings of the developing data set.

Proceedings of the Appalachian Research in Business Symposium, Eastern Kentucky University, March 26, 2021
83
Literature Overview
Arguably one of the most important employment practices impacted by Title VII of the CRA of
1964 is performance appraisal. Performance appraisal typically involves the continuous process of
identifying, measuring, and developing the performance of individuals and groups in organizations
(Aguinis, 2007), and it involves providing both formal and informal performance-related
information to employees (Selden & Sowa, 2011). Given the importance of performance appraisals
for determining employment outcomes such as raises, promotions, bonuses, terminations, etc.,
performance appraisal documentation is often presented as evidence in legal challenges of
employment decisions. In their watershed study, Werner and Bolino (1997) found that
performance appraisal components related to fairness and due process (e.g., giving employees the
opportunity to review the appraisal results) were more important to legal decisions than technical
components related to the measurement of performance itself (e.g., measuring traits versus
behaviors). However, the results of the Werner and Bolino (1997) study are over 20 years old at
this point and in dire need of an update. Moreover, the scope of their analysis needs to be expanded
to include federal trial court decisions, not just cases that are appealed. Furthermore, Werner and
Bolino’s (1997) analysis paid little attention to the characteristics of the plaintiffs (e.g., sex, race,
age, etc.) in the cases reviewed. Thus, the purpose of the present study is to provide an updated
and expanded analysis of the impact of performance appraisal components on employment
litigation outcomes.
Methodology
To develop an initial model for continuing with the line of research developed by Werner and
Bolino (1997), the authors used cases containing variables to mirror that study. To extend the
study, however, the authors desired to examine other aspects of the cases under review and the
researcher was instructed to gather data points not specifically addressed in the Werner and Bolino
(1997) study. To expand the scope of review as the model matured, additional variables were
coded. Werner and Bolino (1997) utilized case law during the 15-year span from 1980-1995. The
authors intend to compare findings of the previous study with results of subsequent judicial
decisions and expanded the search frame to include decisions from 1996 to 2020. The authors also
want to examine other aspects for comparison. The current study will use federal case law at the
intermediate appellate level (United States Courts of Appeals). Later, as a source of comparison,
the authors intend to expand the scope of the study to include federal trial court decisions since not
all outcomes are appealed.
The coding of variables was accomplished using a method similar to Werner and Bolino (1997),
with all categories being assigned numerical codes. Most categories consisted of a single digit
code assigned to each variable within the category. However, the level of detail in the current study
has been expanded. For instance, geographic regions of the trial courts making the initial
decisions, as well as the specific appellate divisions, were identified and coded for comparison
purposes. In addition to coding of variables involving performance appraisal information,
additional characteristics of the parties involved were determined and coded when possible given
the level of detail included in the cases.

Proceedings of the Appalachian Research in Business Symposium, Eastern Kentucky University, March 26, 2021
84
The results in this paper are derived from simple descriptive statistics using a first glance at data
from the 95 coded cases. The number of cases will increase as the study progresses. The coding
for most of the cases thus far was accomplished by one research assistant. Subsequent blind coding
of each individual case in the current data set will be conducted for verification of coding accuracy,
as will future cases added to the developing data set.
Results and Implications
The analysis in this paper is limited to descriptive statistics relating to characteristics of the plaintiff
filing an employment-related lawsuit in a federal trial court. The scope of the analysis is limited
to the plaintiff’s gender, whether the trial court decision was made by jury verdict or summary
judgment, success of the plaintiff’s claim, and the subsequent decision rendered by the appellate
court. The basis of the claim, impact of performance reviews, and implications of the geographic
dispersion of the cases will be analyzed in the future as the database grows.
The first level of analysis divides the cases into those decided by summary judgment, meaning the
case was summarily determined as a matter of law and therefore did not proceed to trial, and cases
decided by verdict after trial. Although each claim is based on discrimination in the employment
context, the specific type of discrimination will not be considered until an appropriate number of
cases are added to the database. A substantial number of the claims (88%) were summarily
disposed of by the trial court while the remaining claims were rendered by verdict after trial. All
cases decided by summary judgment were decided in the employer’s favor while 73% of the cases
going to trial were decided in the plaintiff employee’s favor. Of the cases decided by summary
judgment at the trial level, employee’s obtained favorable outcomes in only 18% of the appeals.
It is interesting to note that in the cases decided by verdict, the appellate court flipped the outcome
to favor the employer (73%)
A second level of analysis examines the cases based on claims made based on gender. The specific
type of discrimination claim is not considered in this analysis either. Of the 95 appellate level
cases coded, 55% of the claims were filed by male plaintiffs and 45% by female plaintiffs. The
high number of cases mentioned above that were decided by summary judgment at the trial level
were equally split between the two categories (male=89%, female=88%). Also, as noted above,
none of the cases decided by summary judgment were in favor of the plaintiff employee at the trial
level. In cases decided by verdict (male=6, female=5), males had favorable outcomes in four of
six cases (67%) at trial, but only one of those decisions (25%) survived the appeal. However, both
cases lost by the employee plaintiff at trial were favored by decisions of the appellate court. When
examining lawsuits filed by female plaintiffs and decided by verdict, four of the five claims (80%)
were won by the plaintiff at the trial level. However, on appeal, none of the five claims survived.
Although much remains to be examined, preliminary implications indicate that employers have
been very successful at defending against employment-related lawsuits at the trial level when
those claims are dismissed on summary judgment. On appeal of those claims, employers had
favorable outcomes in 82% of the cases. If the case went to trial, employees won 73% of the
verdicts. However, the advantage flipped on appeal of those verdicts as employers won favorable
outcomes in 73% of those cases.

Proceedings of the Appalachian Research in Business Symposium, Eastern Kentucky University, March 26, 2021
85
Conclusion
The analysis in this paper indicates that employers should be encouraged when defending against
claims of discrimination when summary judgment is granted by the trial court. That success rate
greatly dwindles when such cases proceed to trial. On appeal, however, employer outcomes are
very favorable in both cases. When gender was stratified, the analysis didn’t reveal significant
differences in outcomes at the trial court level. On appeal, no females had favorable outcomes
while males had a 50% success rate. A limitation on the analysis is that cases were not coded by
multiple researchers. Also, cases were not stratified by different types of discrimination claims
and judicial reasons for summary judgment at the trial level were not classified.
This research was inspired by the Werner and Bolino (1997) study which is over 20 years old.
Moving forward, this research will update and greatly expand the scope of their analysis. The
authors will add multiple reviewers to independently code the current and future cases, expand the
time horizon, test for additional variables, and consider geographical differences. The findings
and recommendations of this study should be especially useful to the legal and business
community, including practicing judges and attorneys, business leaders, human resources
practitioners, employees, and other users of legal and/or business information in the employment
context.
References
Aguinis, H. (2007). Performance management. Upper Saddle New River, NJ: Pearson-Prentice
Hall.
Civil Rights Act, 42 USCS § 2000e (1964).
Selden, S., & Sowa, J. E. (2011). Performance management and appraisal in human service
organizations: Management and staff perspectives. Public Personnel Management, 40, 251-264.
Werner, J. M., & Bolino, M. C. (1997). Explaining US courts of appeals decisions involving
performance appraisal: Accuracy, fairness, and validation. Personnel Psychology, 50, 1-24.

Proceedings of the Appalachian Research in Business Symposium, Eastern Kentucky University, March 26, 2021
86
The Impact of Typos on Brand Perception and Business Reputation
Marcel Robles
School of Business
Eastern Kentucky University
521 Lancaster Avenue, BTC 214
Richmond, KY 40475
859.582.8680 (Contact Author)
Key words:
Typos, typographical errors, brand perception, reputation, proofreading mistakes
Introduction
The purpose of this study was to examine the effects that typographical errors and the lack of
effective proofreading can have on brand perception and reputation. Previous studies have shown
that a single spelling mistake on a business website can cut online sales by 50%.
This study addressed two research questions:
(1) Do typos in business impact perception and reputation?
(2) Do proofreading mistakes affect consumer relationships?
Primary data, aligned with current literature, show that typographical errors in business lead to
losses of perception, brand reputation, and consumer relationships. Several examples of
typographical errors and proofreading mistakes are explained.
Literature Review
A comprehensive view of the marketing process and consumer relationships is significant when
investigating the impact typographical errors has on business entities (Garbarino & Johnson,
1999). Marketing is in the forefront of building brand identity, customer interest, loyalty, value,
and brand reputation (Garbarino & Johnson, 1999). Relationships with customers are initiated
through print marketing, television commercials, and web-based advertising (Hampel, Heinrich,
& Campbell, 2012).
It is important not to dwell only on the errors made by businesses, but also to establish an
understanding of how to build consumer relationships to grasp why making typographical mistakes

Proceedings of the Appalachian Research in Business Symposium, Eastern Kentucky University, March 26, 2021
87
can have such an impact. A business must take the time to ensure products and brand advertising
are produced without flaws to build trust and faith in the quality of products and services.
Additionally, businesses must avoid making proofreading mistakes which may lead to business
errors because consumers are easily influenced by mistakes (Everard & Galletta, 2018).
Methodology
The research questions were investigated using a 10-question online survey posted on Facebook.
Over the 10-day period, 202 individuals responded.
Results/Implications
Results of the primary data show consistent alignment with current literature, stating that
typographical errors in business lead to losses of perception, brand reputation, and consumer
relationships. Survey respondents said they were more forgiving of grammatical or spelling errors
in text conversation and emails, but were less forgiving of business entities, even if the context of
the error was less formal.
Consumer perception is important in maintaining brand loyalty and developing transactional
consumers into relational consumers, who will remain committed to a business over time.
Businesses must strive to maintain a relationship with consumers that is void of typographical
errors because these mistakes can lead to major repercussions that could have been avoided.
Today’s consumer expects interest, value, and brand relationships to be nurtured by the company
rendering goods; so it is critical for businesses to strive for perfection in marketing and delivering
a flawless product to the customer. Instances in which typographical errors have gone unnoticed
in marketing campaigns or on product packaging can spell disaster for a brand, with an impact on
revenue, reputation, and consumer loyalty. Further still, brands can be affected by typographical
errors and proofreading mistakes on behalf of a single individual, such as via the use of social
media, forcing public scrutiny on both the brand at stake, as well as the individual who committed
the error.
Professionalism can quickly be called into doubt, even by the most loyal of customers, if a business
continues to exhibit grammatical and spelling errors to the public. These errors over time create
doubt in the quality of products and services, because typographical errors begin to create a
perception of carelessness, which can become the new predisposed mood of a brand.
Conclusions
Typos on the part of a business can greatly impact reputation and perception, but more importantly,
consumer relationships can decline due to ongoing typographical mistakes. Consequently,
consumer relationships will suffer as a direct result of repetitive typographical errors in business.
Positive impressions with consumers lead to customer loyalty, brand awareness, trust, purchase
intent, positive perceptions, and increased company reputation. The relationship between business
and customer is a delicate balance dependent on trust from both parties.

Proceedings of the Appalachian Research in Business Symposium, Eastern Kentucky University, March 26, 2021
88
Further, the growth of internet-based advertising created an environment in which businesses were
able expand their consumer reach. With tremendous growth of the internet, brands were given the
chance to publish more content with more frequency through the additions of brand websites,
social media, videos, and blog posts. The increased frequency at which businesses began
broadcasting advertisements to consumers also allowed for much more potential for error, with
corporate and professional accounts seemingly held to a higher standard. Professionalism and
credibility come under major scrutiny when businesses start making typographical errors in
advertising and marketing. Placing doubt into the minds of a consumer base is very dangerous
because trust and loyalty begin to decline, which leads to lack of revenue and decreased future
purchase intent.
References
Everard, A., & Galletta, D. F. (2005). How presentation flaws affect perceived site quality, trust,
and intention to purchase from an online store. Journal of Management Information Systems,
22(3), 56-95. doi:10.2753/mis0742-1222220303
Garbarino, E., & Johnson, M. S. (1999). The different roles of satisfaction, trust, and commitment
in customer relationships. Journal of Marketing, 63(2), 70. doi:10.2307/1251946
Hampel, S., Heinrich, D., & Campbell, C. (2012). Is an advertisement worth the paper it’s printed
on? Journal of Advertising Research, 52(1), 118-127. doi:10.2501/jar-52-1-118-127.

Proceedings of the Appalachian Research in Business Symposium, Eastern Kentucky University, March 26, 2021
89
Predicting Groundwater Fluctuations in Badgaon of the Dharta
Watershed in India – A study of Machine Learning Algorithms and
Hard Rock Watersheds
Matthew Stocker
Department of Computer Information Systems
Walker College of Business
Appalachian State University
416 Howard Street
Boone, NC 28608
910.734.2146 (Contact Author)
Lakshmi S. Iyer
Department of Computer Information Systems
Walker College of Business
Appalachian State University
416 Howard Street
Boone, NC 28608
828.262.6823
Basant Maheshwari
Department of Water, Environment & Sustainability
Western Sydney University
Hawkesbury Campus
Locked Bag 1797, Penrith, NSW 2751, Australia
+61 2 4570 1235
Key words:
Groundwater fluctuations, predictive model, hard rock basin, UN sustainable goals,
analytics
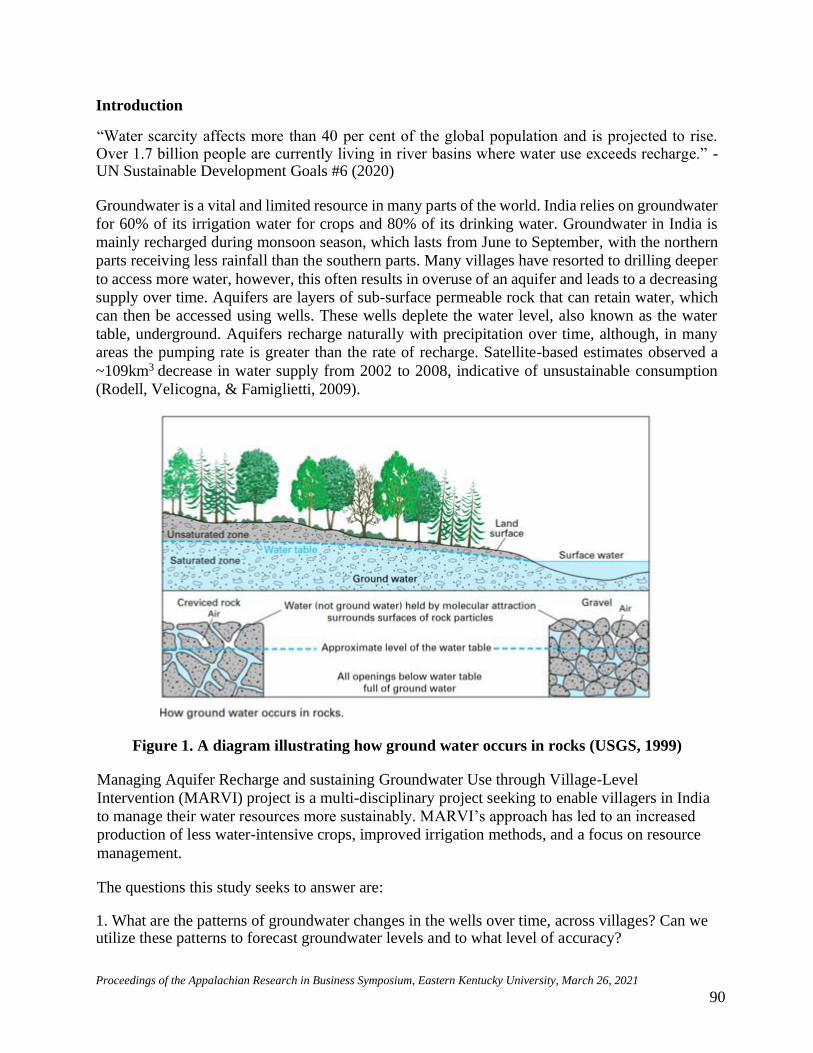
Proceedings of the Appalachian Research in Business Symposium, Eastern Kentucky University, March 26, 2021
90
Introduction
“Water scarcity affects more than 40 per cent of the global population and is projected to rise. Over 1.7 billion people are currently living in river basins where water use exceeds recharge.” - UN Sustainable Development Goals #6 (2020)
Groundwater is a vital and limited resource in many parts of the world. India relies on groundwater
for 60% of its irrigation water for crops and 80% of its drinking water. Groundwater in India is
mainly recharged during monsoon season, which lasts from June to September, with the northern
parts receiving less rainfall than the southern parts. Many villages have resorted to drilling deeper
to access more water, however, this often results in overuse of an aquifer and leads to a decreasing
supply over time. Aquifers are layers of sub-surface permeable rock that can retain water, which
can then be accessed using wells. These wells deplete the water level, also known as the water
table, underground. Aquifers recharge naturally with precipitation over time, although, in many
areas the pumping rate is greater than the rate of recharge. Satellite-based estimates observed a
~109km3 decrease in water supply from 2002 to 2008, indicative of unsustainable consumption
(Rodell, Velicogna, & Famiglietti, 2009).
Figure 1. A diagram illustrating how ground water occurs in rocks (USGS, 1999)
Managing Aquifer Recharge and sustaining Groundwater Use through Village-Level
Intervention (MARVI) project is a multi-disciplinary project seeking to enable villagers in India
to manage their water resources more sustainably. MARVI’s approach has led to an increased
production of less water-intensive crops, improved irrigation methods, and a focus on resource
management.
The questions this study seeks to answer are:
1. What are the patterns of groundwater changes in the wells over time, across villages? Can we utilize these patterns to forecast groundwater levels and to what level of accuracy?

Proceedings of the Appalachian Research in Business Symposium, Eastern Kentucky University, March 26, 2021
91
2. What is the minimum number of wells that should be targeted for data collection to get a sense of an aquifer’s behavior? In other words, what is the minimum number of wells that will give famers a good understanding of the water level fluctuations around their village? How does the water level in their wells change based on rainfall amounts during the monsoon season?
3. How often should well data be collected to get a sense of an aquifer’s behavior?
In this paper, the first question is addressed and additionally, how accurately groundwater fluctuations could be predicted for the monitored wells. If successful, it could be a valuable resource in helping villagers ration their water supplies. The first steps of this research were to use data visualizations and explore machine learning (ML) algorithms to better understand water shortages, aquifer recharge and seasonal variations. ML methods allow for non-linear approaches to modeling these complex interactions within nature, which would otherwise require a large number of resources to calculate manually.
Literature Overview
Predicting groundwater fluctuations has grown in prevalence as global concerns rise over water
shortages. While the field is still actively changing, “the most obvious input variables in
groundwater level predictions studies are rainfall, evaporation, temperature and pumping patterns”
(Yadav, Gupta, Patidar, & Himanshu, 2019). The ML approaches at the forefront for this research
have been focused on artificial neural networks (ANN) and support vector machines (SVM).
According to Hajji, Hachicha, Bouri, & Dhia’s work with ANNs forecasting groundwater levels,
ANNs are a supervised ML model intended to mirror neural networks, and function by learning
associations and patterns within data, with common applications being regression analysis or
classifications (Hajji, Hachicha, Bouri, & Dhia, 2012). An SVM is a supervised learning model
based on statistical learning theory that similarly is focused on regression analysis and
classification (Yoon, Jun, Hyun, Bae, & Lee, 2017). In predicting groundwater fluctuations, ANNs
have been found to perform more efficiently than SVM models, however, SVMs were found to be
less sensitive to the structure of input data, allowing it to better handle more diverse data in cases
where data is limited or provides a less complete image of the environment (Zhou, Wang, & Yang,
2017). Research suggests that ANNs might perform better for predicting groundwater levels,
specifically on hard rock aquifers, given the necessary predictors are available. (Sethi, Kumar,
Sharma & Verma, 2010). In establishing performance indicators, root mean square error (RMSE)
is the average magnitude of errors, meaning greater weight is given to larger errors, with a range
from 0 to infinity (Shiri, Kisi, Yoon, Lee, & Nazemi, 2013). RMSE is the primary performance
evaluation metric and functions as a measure of accuracy for prediction models to allow for
comparison. The coefficient of determination (R2) is the other performance indicator and is used
to test for any inadequacies in the data.
Experimental ANNs and SVMs are using modified approaches that apply ML to help clean their
data to further improve these models. One such instance is the use of wavelet transform
preprocessing, which is a mathematical function that analyzes time-series data and their
relationships to analyze time-series with non-stationary data present (Adamowski, & Chan, 2011).
Additionally, genetic algorithms are a simple meta heuristic approach, similar to an optimization-
focused flowchart, that can be applied to a variety of disciplines (Han, Zou, Xue, Xu, Wang, &
Zang, 2020).

Proceedings of the Appalachian Research in Business Symposium, Eastern Kentucky University, March 26, 2021
92
Methodology
Data was collected on 250 water wells, 50 wells per village, in the Dharta watershed in the Udaipur
district of the Rajasthan state of India (Figure 1). The villages, Varni, Sunderpura, Hinta, Dharta,
Badgaon, and their wells are within a ~24 sq. mile area. However, due to limited resources, this
analysis will focus on the village of Badgaon, the north most of the five villages. Bagaon is spread
over a ~ 6.8 mile area. Data was collected by Bhujal Jankaars, a Hindi word for “groundwater
informed,” who were trained to collect the well data. The data was recorded onto an app,
“MyWell,” that records the entered water level, rainfall amount, and water quality data. The app
was developed by the MARVI project to employ crowdsourcing for easier data collection. This
data was then exported to a spreadsheet, after which, it was cleaned, put into a panel format, and
brought into the machine learning application. Data collection began on August 5th 2012, and the
latest data available for analysis was collected on November 24th 2019. Data was very consistently
collected with only a handful of weekly readings missing per year, however, at the start of 2016,
there would be gaps with several months of groundwater level readings missing for some of the
wells. Missing values were omitted for all regression analyses. Additionally, in 2017, the wells
per village were reduced to 30 per village for a total of 150 wells. This was a decision made by
management to conserve resources.
The data collected on the wells includes the depth of the wells, measured in meters; the elevation
of the wells, measured in meters; and latitude and longitude recorded using smartphone readings.
Pumping and evaporation patterns were not able to be assessed therefore, they are not explicitly
included in the data. They are implicitly tied to fluctuations in groundwater levels over time and
while not directly available for analysis, their effect is implicit in the data. Monthly temperature
data, recorded in Celsius, was available from an Indian open government platform. Additionally,
El Niño3 monthly surface sea temperature (SST) readings from the National Oceanic and
Atmospheric Administration (NOAA) were used to gauge shifts in El Niño and La Niña, and their
meteorological effects (Yadav et al. 2019). Due to limited resources, the data was not pre-
processed, however, hopes to be developed in the future.
Figure 2. Location map of study area (from Dashora, Dillon, Maheshwari, Soni, Dashora, Davande, Purohit, & Mittal, 2017)

Proceedings of the Appalachian Research in Business Symposium, Eastern Kentucky University, March 26, 2021
93
Figure 2 below shows the location of the wells. The visualization (link to the interactive map) was created using Google maps and when a user clicks on it, provides information about each well such as owner information, the village located in, elevation and the depth of the well.
Figure 3. Map providing the wells location and information. Badagon is seen in orange and is the north most village.
The predictive regression-based models used the amount of water available as the dependent
variable, with the regressors being date, rainfall, elevation, El Niño3 SST, latitude and longitude
data. All models were trained using 80% of the data, with the remaining 20% being used as the
test set. The models evaluated were SVM, ANN, stochastic gradient descent (SGD), Lasso (L1)
regression, LASSO-LARS, Ordinary Least Squares, K Nearest Neighbors, and a series of different
decision tree-based models.

Proceedings of the Appalachian Research in Business Symposium, Eastern Kentucky University, March 26, 2021
94
Variable Explanation Range
Groundwater
Level
A calculated variable that took the
difference between the well depth and the
depth to water table.
0 - 29.60 m
Date The date the well was checked on a
weekly basis.
08/05/2012-11/24/2019
Longitude Longitude of the well 74.174°E - 74.210°E
Rainfall Weekly Total Rainfall as recorded by
farmers in millimeters
0 mm - 236.3 mm
Elevation Elevation of the wells, recorded in meters 409.9 m - 448.42 m
Latitude Latitude of the wells 24.581°N - 24.606°N
El Niño3 SST Surface Sea Temperature readings from
the Niño3 region that are used to predict
El Nino and La Niña and monitor their
effects. This data is recorded as a monthly
average in ℃.
24.35 - 27.95°C
Temperature Temperature readings for the state of
Rajasthan recorded monthly
18.000 - 30.591
Table 1. Table of the variables used for the ML models
Results and Implications
Model RMSE R2
SVM 5.463 0.31316
ANN 5.995 .17274
Table 2. Table comparing the results of different models
Ultimately, the only models that had a RMSE below 6 were the SVM and ANN models, with the
SVM outperforming the ANN. While more data is necessary to predict groundwater levels more
accurately, as seen in Figure 3 with the SVM model, the water level drop offs were predicted fairly
accurately and with very limited lag. The groundwater levels are also consistently underpredicted
by the SVM Model. In this scenario, under prediction is significantly more valuable than
overprediction, as it helps prevent overestimation and overuse of the available water.

Proceedings of the Appalachian Research in Business Symposium, Eastern Kentucky University, March 26, 2021
95
Figure 4. Predicted Groundwater levels compared to the actual groundwater levels using
the SVM Model. The SVM model performs good with sudden drops in water level, and has
difficulty with sudden increases in water level.
The ANN model, seen in Figure 4, performed similarly, however, tended to perform better at
sudden drops in groundwater levels, as opposed to the SVM models. This may suggest that while
the ANN’s overall performance is lower, it may be more ideal for our purposes, as more weather
data is gained. A more refined test focused on predicting fluctuations post-monsoon may reveal
better performance metrics than the SVM during the long months with limited rain.
Figure 5. Predicted Groundwater levels compared to the actual groundwater levels using
the ANN Model. The ANN model performed better with sharp drops in water level than
the SVM model, but worse with sharp increases in water level.

Proceedings of the Appalachian Research in Business Symposium, Eastern Kentucky University, March 26, 2021
96
Conclusion
While our findings are in very early stages, we hope to expand our understanding of these aquifers’ behavior and our accuracy with our models using pre-processing algorithms in the future. The most immediate next step will be the expansion of this analysis to the remaining 4 villages and the development of a prescriptive model that advises on an optimal number of wells to monitor, pursuant to goals 2 and 3 of this study. In doing so, it will allow the MARVI approach for greater scalability, while increasing efficiency for the villagers. Our final aim is to provide policy makers with substantially compelling data to empower them to commit to more sustainable policy proposals. As this study has been ongoing since 2012, we can observe a continued community commitment to monitoring and more sustainably managing their groundwater.
References
Adamowski, J., & Chan, H. F. (2011). A wavelet neural network conjunction model for
groundwater level forecasting. Journal of Hydrology, 407(1-4), 28-40.
Dashora, Y., Dillon, P., Maheshwari, B., Soni, P., Dashora, R., Davande, S., Purohit, R.C. and
Mittal, H. K. 2017. A simple method using farmers’ measurements applied to estimate check
dam recharge in Rajasthan, India. SWARM-D-16-171, pp.1–16.
Hajji, S., Hachicha, W., Bouri, S., & Dhia, H. B. (2012). Spatiotemporal groundwater level
forecasting and monitoring using a neural network-based approach in a semi-arid zone.
International Journal of Hydrology Science and Technology, 2(4), 342-361.
Han, K., Zuo, R., Ni, P., Xue, Z., Xu, D., Wang, J., & Zhang, D. (2020). Application of a genetic
algorithm to groundwater pollution source identification. Journal of Hydrology, 589, 125343.
Rodell, M., Velicogna, I., & Famiglietti, J. S. (2009). Satellite-based estimates of groundwater
depletion in India. Nature, 460(7258), 999-1002.
Sethi, R. R., Kumar, A., Sharma, S. P., & Verma, H. C. (2010). Prediction of water table depth in
a hard rock basin by using artificial neural network. International Journal of Water Resources
and Environmental Engineering, 4(2), 95-102.
Shiri, J., Kisi, O., Yoon, H., Lee, K. K., & Nazemi, A. H. (2013). Predicting groundwater level
fluctuations with meteorological effect implications—A comparative study among soft
computing techniques. Computers & Geosciences, 56, 32-44.
United Nations Sustainable Development Goals. 2020. Water and sanitation.
USGS. 1999. How groundwater occurs in rocks.
Yadav, B., Gupta, P. K., Patidar, N., & Himanshu, S. K. (2020). Ensemble modelling framework
for groundwater level prediction in urban areas of India. Science of The Total Environment, 712,
135539.
Yoon, H., Jun, S. C., Hyun, Y., Bae, G. O., & Lee, K. K. (2011). A comparative study of

Proceedings of the Appalachian Research in Business Symposium, Eastern Kentucky University, March 26, 2021
97
artificial neural networks and support vector machines for predicting groundwater levels in a
coastal aquifer. Journal of hydrology, 396(1-2), 128-138.
Zhou, T., Wang, F., & Yang, Z. (2017). Comparative analysis of ANN and SVM models
combined with wavelet preprocess for groundwater depth prediction. Water, 9(10), 781.

Proceedings of the Appalachian Research in Business Symposium, Eastern Kentucky University, March 26, 2021
98
The Risks of Extra-Role (Citizenship) Behaviors
Benjamin J. Thomas
Assistant Professor
Dept. of Management
Davis College of Business
Radford University
Radford, VA
Corresponding Author
Jerry Kopf
Professor
Dept. of Management
Davis College of Business
Radford University
Radford, VA
Key words:
Citizenship, VUCA, Risk Management, Employee Discretion
Introduction
Literature on job performance—an ultimate outcome of human management scholarship and
practice (Campbell, McCloy, Oppler, & Sager, 1993)—has identified organizational citizenship
behaviors (OCBs), employees’ voluntary, extra-role actions, as highly desirable behaviors that
significantly, positively impact organizational success (Organ, 1988). The line between expected
and extra job performance behaviors is admittedly fuzzy (Graen & Uhl-Bien, 1995). Formal job
descriptions—derived from job analysis—typically outline organization mandated employee
behaviors (e.g., responsibilities, tasks), but employees also engage in voluntary, extra-role
performance behaviors (Cascio & Aguinis, 2011), often labeled OCBs or citizenship. These
‘extras’, not prescribed by a job description or analysis, stem from a response to a perceived need
or demand in a given situation as well as employees’ own discretion in performing their job
roles.
As organizations operate in increasingly unpredictable environments and their employees face
novel, dynamic demands for success, we believe the performance of extra-role behaviors (cf.
responsibilities captured and prescribed by job analysis) will grow in frequency and importance.
Because of this, we believe employee extra-role behaviors, like OCBs, merit further

Proceedings of the Appalachian Research in Business Symposium, Eastern Kentucky University, March 26, 2021
99
consideration and caution. Namely, scholars and practitioners seemingly assume all OCBs are
inherently desirable (see Bolino et al., 2004). Recently emerging research has effectively
challenged these assumptions to demonstrate how OCBs can pose drawbacks to the company
and employee (Bolino et al., 2014; Vigoda-Gadot, 2006). Similarly, in this conceptual
discussion, we assert extra-role job behaviors can—and often do—pose unconsidered, possibly
critical, levels of risks to organizational stakeholders. Because extra-role behaviors typically
occur (a) spontaneously (George & Brief, 1992), (b) at the discretion of individual employees,
(c) within environments comprised of volatility, uncertainty, complexity, and ambiguity (VUCA;
Baran & Woznj, 2020), employees and organizational management possess a limited ability to
forecast all of their possible risks and threats. Consider a recent, true example:
Organizational Uncertainty Increases Extra-Role Behaviors
A car salesperson described waking up to his manager’s 1 am frantic phone call: “Storms are
flooding the car lot. Come help us move the cars to higher ground.” The car salesperson, after
complying with the request, reported standing in ankle-deep moving floodwaters, jumping the
dead battery of a car while lightning and rain filled the sky. Such a task—jumping dead batteries
while standing in moving floodwaters while lightning flashed overhead—would never fit into a
car sales person’s formal job description. Although no one suffered harm in this instance, the
great risks of harm to those involved certainly raises shudders for any professional focused on
employee safety and risk-management. The dealership where this occurred had never seen this
level of flooding from a storm, and the unprecedented weather patterns of the 21st century
indirectly exposed this employee and his company to a tremendous amount of risk through the
enactment of extra-role (i.e., not formally prescribed) job behaviors.
Importantly, we distinguish the risks of extra-role behaviors from dangerous work or dangerous
work activities. Many work roles (e.g., police work, mining) inherently include organizationally
relevant job tasks posing risks of great harm (Jerimer et al., 1989). Similarly, organizations may
operate in a high-stakes environment where members’ mistakes can pose disastrous
consequences for stakeholders (La Porte, 1996). Organizations facing such high stakes, or where
dangerous work occurs, use established processes to identify, anticipate, manage, and mitigate
the level of these risks a priori, in addition to creating systems specifically to mitigate bad
outcomes. Definitionally, extra-role behaviors are not expected behaviors or outcomes, therefore
their risks and harms can surprise the organization.
Broadly, extra-role behaviors like OCBs can benefit organizations (Podsakoff et al., 2009), and
organizational scholarship and management have long noted the rewards of fostering such
actions. In the real world of work, no one could possibly anticipate and formally prescribe—
using job analysis and documentation--every organizationally beneficial employee behavior
(Katz & Kahn, 1978). But work and organizational environments are changing. The risks posed
by extra-role behaviors are inherently unexpected, because the behaviors themselves cannot be
forecasted or anticipated. In the case of the car sales member above, no one anticipated the need
for cars to be moved with such urgency, therefore no process for mitigating the risks of such an
activity could be enacted, nor policies and safeguards for managing the risks provided to
employees. As organizations increasingly face environments filled with VUCA, probabilities
hold their employees will face more situations requiring extra-role behaviors (Potsangbam,

Proceedings of the Appalachian Research in Business Symposium, Eastern Kentucky University, March 26, 2021
100
2017). Likely, the risks posed by extra-role behaviors have always existed, but current forces are
making them more likely, thereby increasing their potential for harm. The increasingly dynamic
environments in which organizations operate make routine work less common (Eisenhardt, Furr,
& Bingham, 2010), requiring more adaptive work behaviors from employees and more
discretionary action from members (Pulakos et al., 2000).
Employee Discretion as Source of Extra-Role Behaviors
The VUCA faced by companies provides one source of increased extra-role behaviors, but
employees’ own discretion also drives extra-role behaviors. In the past decades, popular
management trends have increased the amount of discretion, and subsequent unpredictability, or
employees’ job performance. Organizational and job design, managerial behavior training, and
organizational rewards are some of the factors which seek to increase levels of employee
autonomy, job crafting, and employee innovation behaviors (Hardre & Reeve, 2009; Van den
Heuvel et al., 2015; Xerri & Brunetto, 2013). Such trends similarly increase the likelihood of
employees working outside formally defined human management systems and the risks they can
predict and manage in advance. Consider a second example, of an engineer working in a
manufacturing sector who saw a machine component slightly out of place in an automated
production line. Fearing the slight issue could halt 100% perfect production levels during his
shift, the engineer reported he felt it necessary to ““jump a safety rail, and leap from a platform
to try to, without landing, push the component back into position without stopping the
machines.”
This employee earnestly sought to benefit the company in an innovative, albeit dangerous,
manner, and did not stop to ask for permission or to consider the risks of his extra-role behavior.
As a result, he narrowly escaped serious injury to himself from landing in the machine’s pinch
points, his push of the component actually broke the component itself, and production was halted
for hours while repairs were made. Thus, the drive for employee empowerment, autonomy,
discretion, and proactivity inherent in so much of modern management (cf. 20th century
“Tayloristic” management; Taylor, 2004) increases the probabilities of employees engaging in
unpredictable, if earnestly well-intentioned, behaviors. Such a drive, as this true narrative
demonstrates, can pose underexamined risks to organizational stakeholders. Moreover, for more
than three decades, organizational research and management has identified extra-role behaviors
like OCBs with the assumption all of these behaviors are categorically beneficial to company and
employees. Together, organizations’ external environments and their internal practices increase
the need for, and probabilities of, employees engaging in extra-role behaviors.
Much evidence correctly justifies fostering employees’ engagement in extra-role behaviors,
because such actions reliably can provide desirable outcomes (Podsakoff et al., 2009). Certainly,
many OCBs, especially the more frequent and mundane types (e.g., helping a coworker) are
desirable. However, as organizations and approaches to management continue to evolve, and
provide systems where these extra-role behaviors will increase in frequency and impact, we must
consider their potential for harm as well. Indeed, the future of our discipline requires we study
the exceptional, not just the average, instances of workplace phenomena (Cortina et al., 2017).
To that end, we argue there is a need to examine the underexplored, neglected, and unnoticed
risks posed by managerial systems that foster extra-role behaviors at work. This should provide

Proceedings of the Appalachian Research in Business Symposium, Eastern Kentucky University, March 26, 2021
101
a rich area for future research efforts to understand what conditions increase these risks, what
motivations may uniquely precipitate these risks, why some behaviors end badly while some are
beneficial, and how organizations can encourage positive OCBs while mitigating the risks of
negative behaviors and/or outcomes.
Conclusion
This discussion on the risks of extra-role citizenship behaviors was specifically developed for the
symposium setting to which it is submitted. We have developed, briefly, our foundational points
here, that extra-role citizenship behaviors are increasingly likely and potent in workplaces where
(a) organizations face environments filled with growing VUCA and (b) managerial and
organizational practices are strategically designed to increase employees’ citizenship, discretion,
autonomy, and innovation. In such a workplace, of increasing unpredictability for employees
who will act with greater levels of discretion, organizations can enjoy the rewards of extra-role
citizenship behaviors. However, increased opportunity for rewards typically carry a
corresponding increase in risk. Whereas much management scholarship and practice have
focused on the rewards of extra-role citizenship, we believe more discussion is merited on the
risks of this increasingly likely variety of employee actions. We have developed a fuller model
than we present here, but certainly further research and consideration is needed to uncover what
factors, situational and personal, may make extra-role citizenship actions riskier. To that end, we
believe extra-role citizenship behaviors result in near-misses, accidents, mistakes, and
undesirable outcomes, although we cannot find any specific statistics on such events beyond
individual stories like those we have shared here. Thus, additional research in this area could
begin simply with descriptive work to establish rates of undesirable outcomes of citizenship
actions. However, we offer a catalyzing conversation to begin considering and discussing these
risks, especially within a discipline where citizenship is all-too-often considered categorically
rewarding (Bolino et al., 2004).
References
Baran, B. E., & Woznyj, H. M. (2020). Managing VUCA: The human dynamics of
agility. Organizational dynamics. Ahead of print
Bolino, M. C., Turnley, W. H., & Niehoff, B. P. (2004). The other side of the story:
Reexamining prevailing assumptions about organizational citizenship behavior. Human
Resource Management Review, 14, 229–246
Bolino, M. C., Klotz, A. C., Turnley, W. H., & Harvey, J. (2013). Exploring the dark side of
organizational citizenship behavior. Journal of Organizational Behavior, 34, 542-559.
Campbell, J. P., McCloy, R. A., Oppler, S. H., & Sager, C. E. (1993). A theory of
performance. Personnel selection in organizations, 3570, 35-70.
Cascio, W.F. & Aguinis, H. (2011) Applied Psychology in Human Resource Management, 7th
Ed. Pearson.

Proceedings of the Appalachian Research in Business Symposium, Eastern Kentucky University, March 26, 2021
102
Cortina, J. M., Aguinis, H., & DeShon, R. P. (2017). Twilight of dawn or of evening? A century
of research methods in the Journal of Applied Psychology. Journal of Applied Psychology, 102,
274-290.
George, J. M., & Brief, A. P. (1992). Feeling good-doing good: a conceptual analysis of the
mood at work-organizational spontaneity relationship. Psychological bulletin, 112(2), 310.
Graen, G. B., & Uhl-Bien, M. (1995). Development of leader-member exchange (LMX) theory
of leadership over 25 years: Applying a multi-level multi-domain perspective. Leadership
Quarterly, 6(2), 219-247.
Hardré, P. L., & Reeve, J. (2009). Training corporate managers to adopt a more autonomy‐supportive motivating style toward employees: An intervention study. International Journal of
Training and Development, 13(3), 165-184
Jermier, J. M., Gaines, J., & McIntosh, N. J. (1989). Reactions to physically dangerous work: A
conceptual and empirical analysis. Journal of Organizational Behavior, 10, 15-33
Katz, D., & Kahn, R. L. (1978). The social psychology of organizations Vol. 2. New York:
Wiley.
La Porte, T. R. (1996). High reliability organizations: Unlikely, demanding and at risk. Journal
of Contingencies and Crisis Management, 4, 60-71.
Organ, D. W. (1988). Organizational citizenship behavior: The good soldier syndrome.
Lexington Books/DC Heath and Com.
Potsangbam, C. (2017). Adaptive performance in VUCA era–Where is research
going? International Journal of Management (IJM), 8, 99-108.
Pulakos, E. D., Arad, S., Donovan, M. A., & Plamondon, K. E. (2000). Adaptability in the
workplace: Development of a taxonomy of adaptive performance. Journal of Applied
Psychology, 85, 612
Taylor, F. W. (2004). Scientific management. Routledge.
Van den Heuvel, M., Demerouti, E., & Peeters, M. C. (2015). The job crafting intervention:
Effects on job resources, self‐efficacy, and affective well‐being. Journal of Occupational and
Organizational Psychology, 88, 511-532.
Vigoda-Gadot, E. (2006). Compulsory citizenship behavior: Theorizing some dark sides of the
good soldier syndrome in organizations. Journal for the Theory of Social Behaviour, 36, 77-93.
Xerri, M. J., & Brunetto, Y. (2013). Fostering innovative behaviour: The importance of
employee commitment and organisational citizenship behaviour. The International Journal of
Human Resource Management, 24, 3163-3177.

Proceedings of the Appalachian Research in Business Symposium, Eastern Kentucky University, March 26, 2021
103
Understanding Computer Health and Fear Appeals via the
Protection Motivation Model
Dr. Kristen B. Wilson
School of Business
Eastern Kentucky University
521 Lancaster Avenue
BTC 108
Richmond, KY 40475
859.622.2103 (Contact Author)
Key words:
Online business environments, malware, coping behaviors
Introduction
Empirical research linking individual responses to fear appeals and subsequent effects on
behavioral intentions have been well-represented in fields such as marketing, consumer behavior,
and psychology through the years; however, other relevant applications may still exist, especially
in the discipline of information systems. In our increasingly virtual world, understanding reactions
to online threats becomes paramount. The purpose of this paper is to further apply the Protection
Motivation model to Information Systems by measuring individual reactions to computer health
when they are faced with a threat, namely identity theft as a result of a malware attack.
The paper is organized as follows: the next section examines the Protection Motivation model, its
constructs, and the adaptation to the Information Systems Protection Motivation model (ISPM).
The following section provides a review of malware and emanating threats, particularly with
respect to identity theft. Then, the current state of the experimental design is discussed. The final
section reviews the direction of future research, as this is a working research project.
Literature Overview
The Protection Motivation (PM) model was first conceptualized as a threat-stimulated cognitive
appraisal process by which individuals choose appropriate coping methods to mitigate danger and
reduce fear (Rogers 1975). This process includes an assessment of the perceived severity of the
threat, the perceived probability of threat occurrence, and the perceived ability of the coping
response to eliminate the threat. This model was later amended to include self-efficacy, or an
individual’s perception surrounding their ability to carry out a chosen coping behavior (Rogers
1983). The PM model also has roots in drive-reduction theory which suggests that the arousal of

Proceedings of the Appalachian Research in Business Symposium, Eastern Kentucky University, March 26, 2021
104
an emotional state of fear is necessary for effective fear appeal communication (Janis 1967).
Furthermore, threats and relative fear has been shown to heighten drive, increasing interest and
investment in the message (Ray et al., 1970). The PM model was widely researched in years prior,
but new applications emerge as the shift in online business environments has grown swiftly in past
years.
More recent research regarding the PM model supports the inclusion of maladaptive behaviors and
suggest that individuals process this information in some sort of sequential order and that messages
that appeal to individuals’ intrinsic motivation, rather than fear, may be successfully in promoting
safety (Menard et al., 2017; Tanner et al., 1991). Privacy concerns and threat emotions have also
been examined; specifically the effectiveness of these mechanisms on social networking site
behavior (Mousavi et al., 2020). The four appraisal processes and maladaptive coping behaviors
are discussed briefly below.
Severity of Threat
Individuals internally calculate threat severity in order to determine the direct, detrimental harm it
may cause. If the threat’s severity is not applicable to said individual, it is possible that no
behavioral changes will occur, or a coping mechanism may be implemented to help benefit others.
On the other hand, if an individual is driven by fear and believes the threat is real and eminent,
they will search for alternatives to help mitigate negative effects.
Likelihood of Threat
At this stage in the appraisal process, individuals evaluate the likelihood that the threat will occur
and affect them directly. Similar to threat severity, if individuals do not perceive the threat as
relevant or probable, selected coping mechanisms may reflect the interests of others or simply be
non-existent. To effectively influence behavior, individuals must be driven by the fear that the
threat can happen and will very likely directly affect them.
Perceived Ability of Coping Behavior to Remove Threat
Individuals are not likely to implement a coping mechanism if they do not believe it will have any
effect mitigating risk of the threat. If irrelevant or impractical coping behaviors are suggested as
a medium to alleviate a potential threat, individuals will not implement them and will have to
search elsewhere for alternatives.
Self-Efficacy
Self-efficacy refers to an individual’s belief that he/she can effectively carry out a chosen coping
behavior. This perception will vary from task to task and is likely influenced by the level of
knowledge regarding the specific threat or event. Individuals may seek the additional information,
advice, or guidance from others if their level of self-efficacy is low.
Maladaptive Coping Behaviors
Maladaptive coping behaviors are defined as actions that decrease perceived threat without
reducing the actual threat. These behaviors can be influenced by previous experiences and

Proceedings of the Appalachian Research in Business Symposium, Eastern Kentucky University, March 26, 2021
105
outcomes of similar, past decisions. The stimulation of individual emotional responses when the
threat is introduced will also be important in the development and influence of maladaptive
behaviors. These behaviors can vary between individuals, and it is likely that they will directly
moderate perceptions of threat severity, likelihood, relevance/effectiveness of coping behaviors,
and self-efficacy.
Application to Information Systems
Whereas traditional applications of the PM model have studied fear appeals as a medium to
influence consumer behavior, this research is aimed at measuring and manipulating computer
users’ behavior with reference to identity theft, malware threats, and preventatives.
For the purpose of this research, ISPM refers to this new approach, which might be more
appropriate for examining information systems issues, rather than consumer or psychological
behavior patterns. Figure 1 represents the cognitive assessments that an individual processes in
the presence of identity theft as a result of a malware attack according to the adapted ISPM model.
Figure 1: ISPM Model
Malware
Malware broadly refers to viruses, worms, Trojan horses, time bombs, spy-software, and other
malicious programs designed to cause disruption, deny activity, gather private data without user
consent, and/or allow unapproved access to system resources (Wadkar et al., 2020; Siponen et al.,
2007). The intention of malware is to cause harm, inconvenience, or monetary losses to
organizations and/or individuals. The rise of malware attacks in recent years is astonishing,
especially coupled with increased instances of ransomware. There are ways to help mitigate the
effects of malware attacks, such as strong password creation, employee education, regular data
backups, and preventative software packages (Loch et al., 1992). However, it can only be assumed
that as organizations and individuals work harder to protect their information, proprietors of these
attacks will only look for new, creative ways to bypass preventative measures.
Proceedings of the Appalachian Research in Business Symposium, Eastern Kentucky University, March 26, 2021
106
One of the many negative outcomes of malware attacks is identity theft. In 1998 Congress passed
the Identity Theft Assumption and Deterrence Act which defines identity theft as “any act that
knowingly transfers or uses, without lawful authority, any name or number that may be used, alone
or in conjunction with any other information, to identify a specific individual with the intent to
commit, or to aid or abet, any unlawful activity that constitutes a violation of Federal law, or that
constitutes a felony under any applicable State or local law” (Newman et al., 2005). This law also
applies to computer crimes, including the use of malware or phishing schemes to obtain and misuse
consumer information.
Proprietors of malware are motivated by several factors. These can manifest as a compulsive
attraction to hacking, curiosity, a desire for an enhanced sense of control, power and/or prestige,
an outlet for hostility, or simply the satisfaction of identifying with a group (McHugh et al., 2005).
Because malware and the intentions surrounding its implementation vary greatly, it is no wonder
that fear of an attack and possible identity theft is a real and prevalent threat in the minds of so
many individuals, especially in today’s increasingly online business environment.
Methodology in Progress
A laboratory experiment using student test subjects is currently being designed to test the
effectiveness of the ISPM model with respect to modifying individuals’ coping behavior choices;
furthermore, student respondents would be representative and applicable to the overall population
of computer users; this is especially relevant given the shift to online work, both in the education
and professional business realms. The survey constructs included in the experiment (to test the
ISPM model) were derived from previously validated measures (Tanner et al., 1989; Tanner et al.,
1991). Given the brevity of this manuscript, a full list of those questions is not included; rather,
will be discussed in the presentation.
A pre-experiment assessment will be implemented to gauge individuals’ knowledge of malware
and level of vulnerability before the threat manipulation is introduced. This step, however, may
not be necessary, since most students are aware of malware and potential risks. Then, students
will be randomly assigned to one of six treatment effects with various levels of threat and coping
behavior: (1) High identity theft/malware threat information only, (2) Low identity theft/malware
threat information only, (3) High identity theft/malware threat information with an offered coping
response, (4) Low identity theft/malware threat information with an offered coping response, (5)
Offered coping response only, and (5) No information (control sample). Offered coping responses
will include individual or professional credit mentoring services, anti-malware software packages,
or firewalls. Finally, a post-experiment questionnaire will be given to re-assess the pre-experiment
survey, appraise the arousal of fear in respondents, identify the perceptions of threat severity and
probability, determine individual intentions of implementing coping strategies and levels of self-
efficacy, and recognize any maladaptive behaviors that may moderate coping behavior choice.
Conclusion
It is the intention of the author to empirically test the ISPM model and analyze the results to
interpret its validity, specifically through the manipulation of malware threats and possible identity
theft constructs. Pending advice from other IS professionals and researchers, specifically gathered

Proceedings of the Appalachian Research in Business Symposium, Eastern Kentucky University, March 26, 2021
107
at the ARBS 2021 conference, the ISPM and survey constructs may be adapted to better epitomize
the research question.
References
Berghel, H. (2003). Malware month. Communications of the ACM 46(12), 15-19.
Janis, I. (1967). Effects of fear arousal on attitude change: Recent developments in theory and
experimental research. Advances in Experimental Social Psychology. Academic Press, Inc.: New
York.
Loch, K.D., Carr, H.H., & Warkentin, M.E. (1992). Threats to information systems: Today's
reality, yesterday's understanding. MIS Quarterly, 16(2), 173-186.
McHugh, J.A., & Deek, F.P. (2005). An incentive system for reducing malware attacks.
Communications of the ACM, 48(6), 94-99.
Menard, P., Bott, G. J., & Crossler, R. E. (2017). User motivations in protecting information
security: Protection motivation theory versus self-determination theory. Journal of Management
Information Systems, 34(4), 1203-1230.
Mousavi, R., Chen, R., Kim, D. J., & Chen, K. (2020). Effectiveness of privacy assurance
mechanisms in users' privacy protection on social networking sites from the perspective of
protection motivation theory. Decision Support Systems, 135, 1873-5797.
Newman, G.R., & McNally, M.M. (2005). Identity theft review. United States Department of
Justice: National Institute of Justice.
Ray, M.L., & Wilkie, W.L. (1970). Fear: The potential of an appeal neglected by marketing.
Journal of Marketing, 34, 54-62.
Rogers, R.W. (1975). A protection motivation theory of fear appeals and attitude change. Journal
of Psychology, 91(1), 93.
Rogers, R.W. (1983). Cognitive and physiological processes in fear appeals and attitude change:
A revised theory of protection motivation. Social Psychophysiology. Guilford Press: New York.
Siponen, M.T., & Oinas-Kukkonen, H. (2007). A review of information security issues and
respective research contributions. ACM SIGMIS Database, 38(1), 60-80.
Tanner, J.F., Hunt, J.B., & Eppright, D.R. (1991). The protection motivation model: A normative
model of fear appeals. Journal of Marketing, 55(3), 36-45.
Tanner, J.J.F., Day, E., & Crask, M.R. (1989). Protection motivation theory: An extension of fear
appeals theory in communication. Journal of Business Research, 19(4), 267-276.
Wadkar, M., Di Troia, F., & Stamp, M. (2020). Detecting malware evolution using support vector
machines. Expert Systems with Applications, 143(1), 1-22.

Proceedings of the Appalachian Research in Business Symposium, Eastern Kentucky University, March 26, 2021
108
Hotel Hurricane Options
Ben Woodruff
Accounting, Finance, and Information Systems
Eastern Kentucky University
521 Lancaster Ave
Richmond, KY 40475
859-622-8881
Key words:
Catastrophic, Hurricane, Option, Risk
Introduction
Revenue management scholarship and practices have extensively examined sellers’ options for
maximizing revenue under various conditions. Systems have been designed to allocate production
capacity and inventory holdings which rely on customer segmentation schemes in order to
maximize total revenue. I extend this literature by applying it to hotel revenue management
concerns arising during natural disaster evacuations. I use a binary option pricing model to predict
hotel room prices when customers are segmented into two groups, customers who reserve rooms
(by purchasing an option for a room in advance of a natural disaster) and customers who do not
hold an option. I find that hotels enjoy higher revenues under conditions which might confound
expectations. For example, given the higher probability of evacuation, hotels that offer refund rates
paid to those option-holding customers in the event of service failure will not only suffer from
lower room prices, but lower total revenue as well. These findings are an important first step in
examining revenue management issues related to natural disasters.
Evacuations are typically ordered 24-36 hours before landfall (Urbina & Wolshon 2003).
Government officials therefore must balance mandatory evacuation orders with having sufficient
lead time for individuals to actually leave the area (Fairchild, Colgrove, and Jones 2006). Having
sufficient egress routes and ready information flow can reduce that time but with some residual
physical constraints (Lindell and Prater 2007).
Literature Review
Revenue management systems serve to allocate capacity among products with different prices in
order to segment customers to maximize expected revenue. Yield management issues in airlines
were first addressed by Simon (1968, 1970), Falkson (1969), and Rothstein (1971, 1985). This
was extended by Belobaba (1989), Kimes (1989) and Subramanian et. al. (1999) to determine the

Proceedings of the Appalachian Research in Business Symposium, Eastern Kentucky University, March 26, 2021
109
optimal policies for allocating seats with multiple classes of customers and with the time of the
reservation. Gallego and Sahin (2010) examined the possibility of managing inventory under
partially refundable fares and found that even with risk neutral customers the provider will have
higher revenue by announcing the future price early. This holds even if a new type of customer
emerges in later periods with different preferences.
Taking this same approach of segmenting customers to maximize revenue with no inventory and
applying it to the hotel industry, Rothstein (1974) Ladany (1976, 1977), Williams (1977) and
Liberman and Yechiali (1978) found solutions using dynamic programing and Markovian
Sequential Decision Processes. Gallego and Van Ryzin (1994) examine perishable stock and
stochastic demand. Bitran and Gilbert (1996) added the complexity of walk-in and no-show
customers with a stochastic dynamic programing model to determine how to optimally allocate
rooms. Gu and Caneen (1998) develop two revenue maximization models. Baker and Collier
(1999) tested multiple heuristics and found that simple heuristics worked as well as complex ones
under a simulated environment. Toh and DeKay (2002) proposed a model for the optimal level in
overbooking. Baker and Collier (2003) also examined the advantage of bid pricing compared to
traditional pricing methods.
Several researchers examined issues more directly related to revenue management issues
concerning customer segmentation when early-purchase customers are offered refunds. Akçay,
Boyacı, & Zhang (2013) used a single period model to examine the effect of offering customers
money-back guarantees. Nasiry & Popescu (2012) examine the effect of customer regret and its
impact on total revenues. Gallego & Sahin (2010) used an inter-temporal choice model under
uncertainty which permits customer valuations to evolve over time, and they show that customer
choice can be priced as a call option, the price of which is contingent on capacity constraints.
For extensive reviews of this literature, see Vinod (2004), Ivanov and Zhechev (2011), and Talluri
& Van Ryzin, (2004).
Guest Choice Model
Consider a two-period problem where customers have independent and identically distributed
valuations on the room. The distribution of the valuation of the room can be modeled as
𝐹(𝑝) = 𝑃(𝑉 ≤ 𝑝) (1)
where 𝐹(𝑝) is the cumulative distribution function and is equal to the probability that the
willingness to pay (V) is less than or equal to the price set by the hotel (p). While this distribution
is known to the hotel and guests, the realization does not occur until period two. I assume that
𝐹(𝑝)is continuous and differentiable. Therefore, the value of 𝐹(0) ≤ 1. The implication is that it
is possible some people would not take a room even if it was free because the value of the free
room is negative.
In period one, the hotel will announce the price 𝑝1 and 𝑝2 so that 𝑝1 < 𝑝2 and the subscripts denote
which time period the price is officially offered. I assume that guests are maximizing their expected
consumer surplus. Consumer surplus (𝑥(𝑝𝑖)) is the difference in the willingness to pay (subjective

Proceedings of the Appalachian Research in Business Symposium, Eastern Kentucky University, March 26, 2021
110
valuation or V) and the actual cost of the room (𝑝1or 𝑝2) and acts as a measure of consumer
satisfaction with the purchase.
Using a model where the guest is attempting to maximize their expected surplus, the choice to
purchase in period 1, paying a price of 𝑝1 , results in an expected surplus of
𝑥(𝑝1) ≡ 𝐸[𝑉] − 𝑝1. Given that the price paid in period one is a sunk cost, rational agents will
ignore that price in deciding to use the room which was already purchased. Instead they will use
the room if the realized value is strictly non-negative. Similarly, it can be shown that
𝑥(0) = 𝐸[𝑉]
Since consumers will use the room already purchased in period one if the realized value is zero or
greater and later consumers will only purchase a room in period two if the realized value minus
the higher price is greater than zero.
𝐸[𝑉] − 𝑝1 = 𝐸[𝑉 − 𝑝2] (2)
𝑥(0) − 𝑝1 = 𝑥(𝑝2) (3)
With this model, the hotel simply must announce the prices under the following constraints to
induce purchase at time 1.
𝑝1 ≤ 𝑥(0) − 𝑥(𝑝2) = 1 − ∫ 𝐹(𝑦)𝑑𝑦𝑝2
0≤ 𝑝2 (4)
Similarly if one wishes to view this as a real option, the guest can pay a price X in period one
which will allow them to purchase the room in period two at the strike price of P. The strike price
is restricted so that 𝑃 ≤ 𝑝2 and the strike price must be less than or equal to the value of the
exercised option or 𝑋 ≤ 𝑥(𝑃) − 𝑥(𝑝2).
Using the surplus value definition, the value to the guest is the surplus value of purchasing the
room at price P minus the cost of the option itself, or similarly
𝑆 = 𝑥(𝑃) − 𝑋 (5)
So, using that we have a non-trivial value for the guest in purchasing the option.
Hotel Choice Model
The hotel has to set the price of the room (𝑝1and 𝑝2). We can assume that this hotel has some finite
capacity, C, and this is further reduced by a booking limit to the number of options being sold, b.
They do not know in period 1 the number of customers which will choose to buy the option and
there is some unknown demand in period 2 for rooms in general.
There is an overbooking penalty, d, if a customer has paid for an option and no room is available
with 𝑑 > 𝑝2. This has some minimum value because the customer is choosing to exercise the

Proceedings of the Appalachian Research in Business Symposium, Eastern Kentucky University, March 26, 2021
111
option with the assumption that the value is greater than the cost of the room therefore to simply
make the person whole would require a minimum value (d) with the form
𝑑 = 𝑋 + 𝐸[𝑉 − 𝑋|𝑉 > 𝑃] (6)
𝑑 = 𝐸[𝑉|𝑉 > 𝑃] (7)
with that value being what is necessary to make the guest whole.
The evacuation order is formulated in the following manner
𝜀 = {0 𝑖𝑓 𝑛𝑜 𝑜𝑟𝑑𝑒𝑟 𝑓𝑜𝑟 𝑒𝑣𝑎𝑐𝑢𝑎𝑡𝑖𝑜𝑛 𝑖𝑠 𝑔𝑖𝑣𝑒𝑛1 𝑖𝑓 𝑎𝑛 𝑜𝑟𝑑𝑒𝑟 𝑓𝑜𝑟 𝑒𝑣𝑎𝑐𝑢𝑎𝑡𝑖𝑜𝑛 𝑖𝑠 𝑔𝑖𝑣𝑒𝑛
(8)
There is a known probability of an evacuation order in period 1, 0 ≤ 𝑝(𝜀) = 𝐸[𝜀] ≤ 1, that can
be used by the hotel in setting price or booking limits.
I assume that some number of customers, Λ, will choose to purchase the option so that the number
of options sold will be
Λ𝑏 = min (Λ, 𝑏) (9)
where b was the booking limit that the hotel self-imposed. The number of customers that will
actually exercise the option in the event of an evacuation order will be
Λ𝑏∗ = Λ𝑏(1 − 𝐹(𝑃))(𝜀) (10)
There are also walk in customers in the second period, Γ. These customers will pay the higher price
of 𝑝2 > 𝑃 and so are preferred from a revenue consideration. The Poisson arrivals in period two
will have different subjective valuation and in the event of an evacuation that valuation will be
assumed to have a higher mean.
This also holds mathematically under the assumption that the revenue function, 𝑅𝑒𝑣(𝑝) ≡
𝑝(1 − 𝐹(𝑝)), is a concave function of price. If follows by Jensen’s inequality that 𝑅𝑒𝑣(𝐸[𝑝]) ≥𝐸[𝑅𝑒𝑣(𝑝)] meaning having a known price is preferred by a revenue maximizer to a random price
determined in period 2.
The number of customers that will show in the second period and be able to acquire a room will
therefore be
Γ𝑏 = min (Γ, 𝐶 − Λ𝑏∗ ) (11)
since the number of exercised options are known in the second period.

Proceedings of the Appalachian Research in Business Symposium, Eastern Kentucky University, March 26, 2021
112
Revenue Management
Ignoring any time value of money considerations between the two periods, the revenue for the
hotel will then take the following form.
𝐸𝑥𝑝𝑒𝑐𝑡𝑒𝑑 𝑃𝑟𝑜𝑓𝑖𝑡= 𝐸𝑥𝑝𝑒𝑐𝑡𝑒𝑑 𝑛𝑢𝑚𝑏𝑒𝑟 𝑜𝑓 𝑠𝑜𝑙𝑑 𝑜𝑝𝑡𝑖𝑜𝑛𝑠∗ (𝑜𝑝𝑡𝑖𝑜𝑛 𝑝𝑟𝑖𝑐𝑒 + 𝑜𝑝𝑡𝑖𝑜𝑛𝑠 𝑒𝑥𝑒𝑟𝑐𝑖𝑠𝑒𝑑 𝑢𝑛𝑑𝑒𝑟 𝑡ℎ𝑒 𝑟𝑜𝑜𝑚 𝑝𝑟𝑖𝑐𝑒∗ 𝑜𝑝𝑡𝑖𝑜𝑛 𝑟𝑜𝑜𝑚 𝑝𝑟𝑖𝑐𝑒)− 𝑒𝑥𝑝𝑒𝑐𝑡𝑒𝑑 𝑜𝑝𝑡𝑖𝑜𝑛 𝑐𝑢𝑠𝑡𝑜𝑚𝑒𝑟𝑠 𝑠ℎ𝑜𝑤𝑖𝑛𝑔 𝑖𝑛 𝑒𝑥𝑐𝑒𝑠𝑠 𝑜𝑓 𝑎𝑣𝑎𝑖𝑙𝑎𝑏𝑙𝑒 𝑟𝑜𝑜𝑚𝑠∗ 𝑝𝑒𝑛𝑎𝑙𝑡𝑦 𝑓𝑜𝑟 𝑛𝑜 𝑎𝑣𝑎𝑖𝑙𝑎𝑏𝑙𝑒 𝑟𝑜𝑜𝑚𝑠 + 𝑤𝑎𝑙𝑘 𝑖𝑛 𝑐𝑢𝑠𝑡𝑜𝑚𝑒𝑟𝑠 ∗ ℎ𝑖𝑔ℎ𝑒𝑟 𝑝𝑟𝑖𝑐𝑒
(12)
�̂�(𝐶, Λ, 𝑏, Γ, 𝑃, 𝑝2) = 𝐸[Λ𝑏](𝑋 + 𝑃(1 − 𝐹(𝑃))(𝐸[𝜀])) − max (0, 𝐸[Λ𝑏] −𝐶)(𝑑 + 𝑃)(𝐸[𝜀]) + 𝐸[Γ𝑏] 𝑝2 (13)
If 𝐸[Λ] ≡ 𝜆 and [Γ] ≡ 𝛾 , and the hotel has decided on the booking limit, the second period
price, the option price, and the strike price may be found by the following
𝜋(𝐶, Λ, Γ) = max𝑋,𝑃,𝑝2
(𝜆 (𝑋 + 𝑃(1 − 𝐹(𝑃))(𝐸[𝜀])) − max(0, 𝜆 − 𝐶) (𝑑 + 𝑃)(𝐸[𝜀]) + 𝛾𝑝2) (14)
𝑠𝑢𝑐ℎ 𝑡ℎ𝑎𝑡 𝜆(1 − 𝐹(𝑃)) + 𝛾(1 − 𝐹(𝑝2) ≤ 𝐶. (15)
To determine the economic significance of such a decision, I ran a series of simulations under
some reasonable assumptions of the demand. The variables changed as shown in Table 1.
Factor Low High
C (Hotel Room Capacity) 20 80
E[] (Probability of evacuation) 0.20 0.80
(Demand Factor Early Buy) 0.50 2
(Demand Factor Late Buy) 0.50 2
d (Penalty for overbooking) $150 $600
Table 1: Assumed Factor Values

Proceedings of the Appalachian Research in Business Symposium, Eastern Kentucky University, March 26, 2021
113
The results are demonstrated in Tables 2 and 3.
P(Evacuation) L L L L L L L L
𝝀 L L L L H H H H
𝜸 L L H H L L H H
d (Penalty) L H L H L H L H
Option Price(x) $2.77 $17.07 $3.76 $4.89 $9.38 $5.72 $2.60 $4.13
𝑷 $125.20 $125.20 $42.50 $38.80 $46.92 $35.00 $26.25 $22.50
𝑷𝟐 $139.05 $210.57 $61.28 $63.25 $93.83 $63.61 $39.23 $43.16
𝑿 + 𝑷 or 𝑿 + 𝑷𝟐 $127.97 $142.27 $46.26 $43.69 $56.30 $40.72 $28.85 $26.63
Total Revenue $2,433 $2,729 $931 $909 $1,589 $2,472 $629 $641
Table 2: Low Probability of Evacuation
P(Evacuation) H H H H H H H H
𝝀 L L L L H H H H
𝜸 L L H H L L H H
d (Penalty) L H L H L H L H
Option Price(x) $55.68 $34.13 $24.97 $26.39 $37.11 $23.23 $17.38 $9.33
𝑷 $69.60 $69.60 $31.22 $32.99 $46.39 $34.86 $21.72 $16.89
𝑷𝟐 $139.21 $112.27 $62.43 $65.98 $92.78 $63.90 $43.45 $28.55
𝑿 + 𝑷 or 𝑿 + 𝑷𝟐 $125.29 $103.74 $56.19 $59.38 $83.50 $58.09 $39.10 $26.22
Total Revenue $3,044 $3,730 $1,133 $1,168 $1,998 $2,737 $836 $1,843
Table 3: High Probability of Evacuation
Simulation Results
In looking for optimal solutions for pricing the option and the room, a comparison was generated
with various values for fixed portions. The solutions were calculated using a generalized reduced
gradient algorithm. All factor combinations estimated began at the same pricing kernel of $100
and $150 for the two room prices with the initial value of the option a risk adjusted price of a
binary option with no inflation discount factor.
Table 2 looks at the generated prices with a low probability of evacuation. With a lower probability
of an evacuation, a binary option has a lower intrinsic value. When changing the valuation of the
second period customers, the price of rooms in the second period fell; but not as quickly as the
price for first period rooms. The option price changed to the market-clearing price, with an option
price that was a function of the difference in the price of the early room and of the late room.
Changing the valuation function for the early purchase individuals causes a significant drop in the
price of the early room. The lowest total revenues result when both groups express the higher
values for the valuation equations.

Proceedings of the Appalachian Research in Business Symposium, Eastern Kentucky University, March 26, 2021
114
Evaluating the same changes to the factors for the valuation formula and penalty but under the
assumption of a high probability of evacuation, results in the values found in Table 3. While the
prices are higher under the low assumptions for valuation factor, the prices are less variable under
all high assumptions for factors.
Conclusions and Future Research
It has been demonstrated that the benefit exists for consumers with the introduction of such an
option. Even with an assumption that individuals will gain no benefit, i.e. the surplus is equal to
zero, there are significant revenue gains for the hotel if such an option was available. This benefit
is greatest when the uncertainty around evacuation is the greatest which is the best time to offer
such an option from a customer welfare standpoint.
References
Akçay, Y., Boyacı, T., & Zhang, D. (2013). Selling with Money-Back Guarantees: The Impact on
Prices, Quantities, and Retail Profitability. Production and Operations Management, 22(4), 777-
791.
Baker, T.K. and D.A. Collier. 1999. A Comparative Revenue Analysis of Hotel Yield Management
Heuristics. Decision Science. 30(1), 239-263.
Baker, T.K. and D.A. Collier. 2003. The Benefits of Optimizing Prices to Manage Demand in
Hotel Revenue Management Systems. Production and Operations Management. 12(4), 502-518.
Belobaba, P.P. 1989. Application of a Probabilistic Decision Model to Airline Seat Inventory
Control. Operations Research. 37(2), 183-197.
Bitran, G.R. and S.M. Gilbert. 1996. Managing Hotel Reservations with Uncertain Arrivals.
Operations Research. 44(1), 35-49.
Fairchild, A, J. Colgrove, and M.M. Jones. 2006. The Challenge Of Mandatory Evacuation:
Providing For And Deciding For. Health Affairs, Vol 25, No 4, 958-967.
Falkson, L.M. 1969. Airline Overbooking: Some Comments. Journal of Transport Economics and
Policy. 3(3), 352-354.
Feng, Y. and B. Xiao. 2000. A Continuous-Time Yield Management Model with Multiple Prices
and Reversible Price Changes. Management Science. 46(5), 644-657.
Feng, Y. and G. Gallego. 2000. Perishable Asset Revenue Management with Markovian Time
Dependent Demand Intensities. Management Science. 46(7), 941-956.
Gallego, G. and G. Van Ryzin. 1994. Optimal Dynamic Pricing of inventories with stochastic
demand over finite horizons. Management Science. 40(8):999-1020.

Proceedings of the Appalachian Research in Business Symposium, Eastern Kentucky University, March 26, 2021
115
Gallego, G. and O. Sahin. 2010. Revenue Management with Partially Refundable Fares.
Operations Research, Volume 58(1), 817-833.
Gladwin, C., H. Gladwin, and W.G. Peacock. 2001. Modeling hurricane evacuation decisions with
ethnographic methods. International journal of mass emergencies and disasters, Volume 19, Issue
2, 117-143.
Gu, Z. and J.M. Caneen. 1998. Quadratic Models for Yield Management in Hotel Rooms
Operation. Progress in Tourism and Hospitality Research. 4(3). 245-253.
Ivanov, S. and V.S. Zhechev, 2011. Hotel Revenue Management – A Critical Literature Review.
Online.
Kimes, S.E. 1989. Yield management: A tool for capacity-considered service firms. Journal of
Operations Management. 8(4), 348-363.
Koide, T., & Ishii, H. (2005). The hotel yield management with two types of room prices,
overbooking and cancellations. International Journal of Production Economics, 93-94(8), 417-
428.
Ladany, S.P. 1976. Dynamic Operating Rules for Motel Reservations. Decision Sciences. 7, 829-
840.
Ladany, S.P. 1977. Bayesian dynamic operating rules for optimal hotel reservations. Mathematical
Methods of Operations Research. 21(6), B165-B176.
Liberman, V. and U. Yechiali. 1978. On the hotel overbooking problem an inventory systems with
stochastic cancellations. Management Science. 24(11), 1117-1126.
Lindell, M. and C. Prater. 2007. Critical Behavioral Assumptions in Evacuation Time Estimate
Analysis for Private Vehicles: Examples from Hurricane Research and Planning. Journal of Urban
Planning & Development, Vol. 133, Issue 1, 18-29.
Nasiry, J., & Popescu, I. (2012). Advance selling when consumers regret. Management Science,
58(6), 1160-1177.
Rothstein, M. 1971. An Airline Overbooking Model. Transportation Science. 5(2), 180-192. 20
Rothstein, M. 1974. Hotel Overbooking as a Markovian Sequential Decision Processes. Decision
Sciences. Vol 5, 389-404.
Rothstein, M. 1985. OR and the Airline Overbooking Problem. Operations Research. 33(2), 237-
248.

Proceedings of the Appalachian Research in Business Symposium, Eastern Kentucky University, March 26, 2021
116
Simon, J.L. 1968. An Almost Practical Solution to Airline Overbooking. Journal of Transport
Economics and Policy. 2(2), 201-202.
Simon, J.L. 1970. Airline Overbooking: A Rejoinder. Journal of Transport Economics and Policy.
4(2), 212-213.
Subramanian, J., Stidham, Jr., S. and C.J. Lautenbacher. 1999. Airline Yield Management with
Overbooking, Cancellations, and No-Shows. Transportation Science. 33(2), 147-167.
Toh, R.S. and F. Dekay. 2002. Hotel Room-inventory Management: An Overbooking Model.
Cornell Hotel and Restaurant Administration Quarterly. 43(4), 79-90.
Talluri, K. T., & Van Ryzin, G. (2004). The theory and practice of revenue management. Boston,
MA: Kluwer Academic Publishers.
Urbina, E. and B.Wolshon. 2003. National review of hurricane evacuation plans and policies: A
comparison and contrast of state practices. Transportation Research Part A. Volume 37, Issue 3,
257-275.
Vinod, B. 2004. Unlocking the Value of Revenue Management in the Hotel Industry. Journal of
Revenue and Pricing Management. 3(2), 178-190.
Williams, E. 1977. Decision Theory and the Innkeeper: An Approach for Setting Hotel
Reservation Policy. Interfaces. 7(4), 18-30.

Proceedings of the Appalachian Research in Business Symposium, Eastern Kentucky University, March 26, 2021
117
Small-Scale Crisis Events Impact on Price Discovery and Volatility
Transmission Across Financial Markets: Evidence From Terror
Attacks, Assassinations, North-Korean Saber-Rattling, and Natural
Disasters
Ben Woodruff
Accounting, Finance, and Information Systems
Eastern Kentucky University
521 Lancaster Ave
Richmond, KY 40475
859-622-8881 (contact Author)
Thad Jackson
391 Gibson Ln
Richmond, KY 40475
Key words:
International conflict, financial integration, American Depository Receipts, terrorism, financial
markets
Introduction
We examine the impact of terrorist attacks, an assassination, three small wars, two natural
disasters, and other crisis events on the stock market returns of various American Depository
Receipts (ADRs) and test whether crises significantly affect ADR returns and the volatility
structures of ADRs and broad market indexes in the international arena. We focus on the returns
of ADRs because these securities trade on American stock exchanges and thus are relatively easy
to trade compared to stocks listed in home markets. Also, these securities provide a valuable
opportunity to examine market segmentation and whether various international shocks transmit
information homogenously to both ADRs and international markets during times of crisis.
We find that terrorist attacks do not affect ADR returns unless the attack involves mass casualties
(>100 deaths). We find that the assassination of Benazir Bhutto was associated with significantly
negative ADR returns, that North Korean provocative actions negatively affected ADR returns,
that small wars can have a persistently negative effect on ADR returns, and that natural disasters
do not negatively affect ADR returns. We also find evidence that volatility is transmitted bi-
directionally between ADRs and their home market during crisis events and that some shocks

Proceedings of the Appalachian Research in Business Symposium, Eastern Kentucky University, March 26, 2021
118
(such as the assassination of regional political leaders) affect the volatility structure of both ADRs
and the home market index.
Literature Review
Terrorism and Financial Markets
Crisis events such as terror attacks, wars and violent international provocations, and similar crises
can negatively affect financial markets through several channels. Terror attacks and wars can rattle
forward-looking financial markets due to the widespread economic harm that such crises cause.
Blomberg et al. (2004) examined the effect of 12,164 acts of terrorism across 179 countries from
1968 to 2001 and link terrorism to negative growth and the redirection of economic activity from
investment spending and towards government spending. Eckstein and Tsiddon (2004) investigated
the impact of terror attacks in Israel and concluded that persistent attacks, even those resulting in
relatively few deaths, had a negative impact on annual consumption. Eckstein and Tsiddon (2004)
found that over the years 2000 to 2003, terrorism cost Israel roughly 10% in per capita output.
Gupta et al (2003) examined the fiscal effects of 22 armed conflicts and terrorism on low-and
middle-income countries and linked those events with lower growth and higher inflation, and
adverse effects on tax revenues and investment. They concluded that wars significantly and
negatively affected economic growth. Lastly, Nitsch and Schumacher (2004) investigated the
effects of terrorism and warfare on bilateral trade flows and found evidence that terrorism
significantly reduced the trade volume.
The attacks of September 11, 2001 and their effects on stock markets have been studied
extensively. Navarro and Spencer (2001) reported that the total market value lost on American
stock exchanges immediately after the 9/11 attacks totaled approximately $1.7 trillion. Chen and
Siems (2004) found that the attacks caused a 7.14% a one-day abnormal negative return for the
DJIA and that the negative effect on the index persisted. They also found that thirty-three global
capital markets experienced negative abnormal returns and that the effect persisted in all but two
markets, Portugal and Helsinki. Charles and Darne (2006) examined ten daily stock market indexes
and concluded that incorporation of large shocks such as 9/11 and significant macroeconomic news
announcements could improve financial risk models, especially with regards to stock market price
volatility. Nikkinen et al (2008) studied the effect of 9/11 on fifty-three equity markets and found
that the attacks significantly increased volatility across markets. They concluded that those
economies that are less integrated with the global economy were less susceptible to shocks similar
to 9/11. Drakos (2004) and Carter and Simkins (2004) examined airline stock returns in the wake
of 9/11. Drakos (2004) found a structural break in airline stock betas, and that the idiosyncratic
risk associated with airline stocks more than doubled after 9/11. Carter and Simkins (2004) report
similar findings, but noted that markets reacted less harshly to those airlines maintaining adequate
cash reserves.
American Depository Receipts and Volatility
The transmission of volatility between ADRs and home market shares has been well studied. Kim
et al. (2000) used a VAR approach and a dynamic regression model to examine the transmission
of information between ADRs and their underlying shares. They included foreign exchange rates,

Proceedings of the Appalachian Research in Business Symposium, Eastern Kentucky University, March 26, 2021
119
the prices of underlying shares, and the U.S. market index as explanatory variables. They found
that information transmission is bi-directional. Also, they report that the most influential pricing
factor was the underlying share price, but that investors initially overreact to the U.S. market index
and under react to the underlying price. Hsu and Tsai (2008) extended the analysis by Kim et al.
(2000) by including in their analysis both changes in trading volume and macro-event shocks.
They examined the information flow between ADR prices and their underlying shares for three
markets: Japan, South Korea, and Taiwan. Their results were similar to Kim et al (2008). Hsu and
Tsai (2008) showed that information transmission is bi-directional and that changes in past
domestic volume affect current ADR returns. Additionally, Hsu and Tsai (2008) examined the
effect of various macro shocks (e.g.: economic stimulus plans, Operation Desert Storm, 9/11, East
Asian Financial Crisis) on the price transmission dynamics between the underlying shares and
their ADRs. They found that macro events lead to a short-run divergence between ADRs and their
underlying shares, especially when the macro event is “bad news.” They concluded that the price
divergence was due to heterogeneous perceptions between the ADR market participants and the
home market participants and that such divergence in perceptions can “result in market
segmentation or mispricing” (p. 56). Poshakwale et al. (2008) modeled the directionality of
volatility and information flow between ADRs and their underlying stocks using a GARCH (1, 1)
model. They showed that volatility varies over time and that the covariance between the underlying
shares and their ADRs is not constant. They also found that volatility is transmitted bi-
directionally, that is, that volatility is transmitted both from the ADR market to the home market,
and vice versa.
This paper extends the work of Hsu and Tsai (2008) and Poshakwale et al. (2008) by examining
the transmission of volatility between ADR indexes and their home market indexes and by testing
for structural changes in the transmission of volatility due to geopolitical/terrorist shocks. Our
findings are consistent with those of Poshakwale et al. (2008) regarding the transmission of
volatility between markets and Hsu and Tsai (2008) regarding the differential reaction between
markets to bad news. While Hsu and Tsai (2008) focus on returns, this paper focuses on differences
in volatility between markets.
Data
All terrorist and conflict data and information were obtained from the National Counterterrorism
Center’s Worldwide Incidents Tracking System. All other event related data, regarding natural
disasters, North Korean saber rattling, and similar events were dated using Reuters. All security
price information was obtained from the Center for Research in Security Prices. We use the
Standard and Poor’s Broad Market Index-All Countries, denominated in U.S. Dollars, as a proxy
for home market-wide returns and the global stock portfolio.
We examine the daily returns of ADRs which trade on the NYSE, NYSE Amex, or NASDAQ and
the home country that has experienced a terrorist attack resulting in at least 15 deaths, or which
suffered a natural disaster or endured a war or some similarly impactful political/military crisis.
The period examined for the event study is January 2004 through December 2008. In the volatility
section of the paper we examine the daily returns of value-weighted ADR indexes which we create
for both South Korean and Indian securities, and their respective home market indexes. The dates
examined are from January 2005 thru December 2008.

Proceedings of the Appalachian Research in Business Symposium, Eastern Kentucky University, March 26, 2021
120
Methodology: Event Study
We employ the Brown and Warner (1985) approach to computing test statistics for the abnormal
returns, which mitigates the potential problem of cross-sectional correlation of returns. Also, we
scan the major international newspapers for significant economy-wide events (such as interest rate
increases) and firm-specific occurrences (such as negative earnings reports) which may affect a
market’s or firm’s performance.
Analysis: Terrorist Attacks
We examine fifty-one terrorist attacks that occur in eight countries from January 2004 through
December 2008. (As noted above, these countries appear in the sample because they are the only
ones that experienced terror attacks during the sample period and also had firms that listed ADRs
on an American exchange.) Of these fifty-one attacks, forty-six involve fewer than one hundred
deaths. Of these forty-six attacks, we find no evidence of a negative impact on ADR returns on the
day of the attack. Twenty of the attacks occurred in India, involved few casualties, and failed to
receive international attention.
The Mumbai train bombings are associated with a negative mean adjusted return, but the result in
not significant even at the 10% level. Ten of the twelve Indian ADRs trading at that time did close
down on the event date. The Mumbai attacks of 2008 are linked with a negative 3.88% mean AR
and the result is significant at the 10% level, though only nine of fourteen ADRs closed down on
the event date. It should be noted that on the trading day prior to the Mumbai attacks, that the mean
adjusted AAR was almost 25% and that the ADRs made up the almost 4% loss within two trading
days. The four Spanish ADRs generated a mean adjusted AR of -2% on the date of the Madrid
train bombings. The result is significant at the 10% level. After the attacks, the ADRs continued
their downward trajectory. Chari (2004) contends that the terrorist attacks, which took place just
three days before national elections, were integral in swaying the electorate to vote the incumbent
party out of office. We changed the event date window to include the day of the election and the
results become much more significant in both economic and statistical terms. The abnormal AR is
-7.59% and this result is significant at the 1% level. The Beslan school crisis which took place in
Russia in 2004 coincided with a day that witnessed a AAR of 3.43%, significant at the 5% level.
Lastly, the London bombings resulted in at AAR of .88%, but the result was not significant.
Conclusion
This paper is the first to examine the impact of terror attacks and other surprise geopolitical events
on ADR returns and volatility flows. Though there is a substantial literature on the impact of
various geopolitical events on home market prices and cross-listed firms, this is the first paper that
examines the impact of these events on ADRs. Whereas much of the previous research has focused
on the effect of macroeconomic shocks on the returns of ADRs and volatility transmission between
home markets and ADRs, our findings shed further light on these factors from a different
perspective. As noted below, it appears that it isn’t the shock of the terror attack (or similar event)
that prompts a sell off of ADRs, but rather the evidence supports the hypothesis that it is the
perceived impact of the long-term economic environment that spooks investors.

Proceedings of the Appalachian Research in Business Symposium, Eastern Kentucky University, March 26, 2021
121
Terrorist attacks impact ADR returns only in those instances that receive widespread international
attention and result in mass casualties. The impact of these events is generally short-lived. The
assassination of Benazir Bhutto resulted in a significant impact on ADR returns of firms located
in surrounding nations. North Korean provocative actions involving instances of significant
regional/global import adversely affected ADR returns on the day of the event. Small wars can
lead to significant and persistent negative returns in ADRs. The natural disasters examined in this
study did not affect ADR returns. It appears that while instances that are manmade can induce a
perceived increase in the risk of the cash flows associated with the underlying shares that natural
disasters are not perceived to increase risk. It appears that investors distinguish between different
types of grey swans.
References
Abadie, A. & Gardeazabal, J. (2003). The Economic Costs of Conflict: A Case Study of the
Basque Country. American Economic Review 93(1), 113-132.
Amihud, Y. & Wohl, A., (2004). Political News and Stock Prices: The Case of Saddam Hussein
Contracts. Journal of Banking and Finance 28, 1185–1200.
Anderson, T, Davis, R. Krieb, J. & Mikosch, T. (2009). Handbook of Financial Time Series. New
York. Springer.
Arin, K., Ciferri, D. & Spagnolo, N. (2008). The Price of Terror: The effects of Terrorism on Stock
Market Returns and Volatility. Economics Letters 101(3), 164-167.
Arnold, T., Nail, L., & Nixon, T. (2004). Do ADRs Enhance Portfolio Performance for a Domestic
Portfolio? Evidence from the 1990s. Research in International Business and Finance 18(3), 341-
359.
Bin, F., Blenman, L., & Chen, D. (2004). Valuation Impact of Currency Crises: Evidence from the
ADR Market. International Review of Financial Analysis 13(4), 411–432.
Binder, J. (1998). The Event Study Methodology Since 1969. Review of Quantitative Finance and
Accounting 11(2), 111-137.
Blomberg, S., Hess, G. & Orphanides, A. (2004). The Macroeconomic Consequences of
Terrorism. Journal of Monetary Economics 51(5), 1007–1032.
Bollerslev, T. & Wooldridge, J. (1992). Quasi-maximum Likelihood Estimation and Inference in
Dynamic Models with Time-varying Covariances. Econometric Reviews 11(2), 143-172.
Brown, S. & Warner, J. (1985). Using Daily Stock Returns: The Case of Event studies. Journal of
Financial Economics 14(1), 3–31.

Proceedings of the Appalachian Research in Business Symposium, Eastern Kentucky University, March 26, 2021
122
Carter, D. & Simkins, B. (2004). The Market's Reaction to Unexpected, Catastrophic Events: The
Case of Airline Stock Returns and the September 11th Attacks. Quarterly Review of Economics
and Finance 44, 539–558.
Chen, A. & Siems, T. (2004). The Effects of Terrorism on Global Capital Markets. European
Journal of Political Economy 20, 349–366.
Chen, A., & Siems, T. (2004). The Effects of Terrorism on Global Capital Markets, European
Journal of Political Economy 20(2), 349–366.
Chesney, M., Reshetar, G. & Karaman, M. (2011). The Impact of Terrorism on Financial Markets:
An Empirical Study. Journal of Banking & Finance 35(2), 253–267.
Choi, Y. & Kim, D. (2000). Determinants of American Depositary Receipts and Their Underlying
Stock Returns: Implications for International Diversification. International Review of Financial
Analysis 9(4), 351–368.
Drakos, K. (2004). Terrorism-induced Structural Shifts in Financial Risk: Airline Stocks in the
Aftermath of the September 11th Terror Attacks. European Journal of Political Economy 20(2),
435–446.
Eckstein, Z. & Tsiddon, D. (2004). Macroeconomic Consequences of Terror: Theory and the Case
of Israel. Journal of Monetary Economics 51(4), 971–1002.
Eldor, R. & Melnick, R. (2004). Financial Markets and Terrorism. European Journal of Political
Economy 20 (2), 367–386.
Gagnon, L. & Karolyi, A. (2004). Multi-market Trading and Arbitrage. Journal of Financial
Economics 97(1), 53–80.
Grossmann, A., Ozuna, T. & Simpson, M. (2007). ADR Mispricing: Do Costly Arbitrage and
Consumer Sentiment Explain the Price Deviation? Journal of International Financial Markets,
Institutions and Money 17(4), 361-371.
Hsu, J. & Tsai, L. (2008) An Investigation on Information Transmission Between Stocks of Far
Eastern Countries and Their American Depositary Receipts. Emerging Markets Finance & Trade
44(4), 40–61.
Karolyi, G. & Martell, R. (2010). Terrorism and the Stock Market, International Review of
Applied Financial Issues and Economics 2(2), 285-314.
Kim, M., Szakmary, A.C., & Mathur, I. (2000). Price Transmission Dynamics Between ADRs and
Their Underlying Foreign Securities. Journal of Banking and Finance 24(8), 1359–1382.

Proceedings of the Appalachian Research in Business Symposium, Eastern Kentucky University, March 26, 2021
123
Nikkinen, J., Omran, M., Sahltrom, P. & Aijo, J. (2008). Stock Returns and Volatility Following
the September 11 attacks: Evidence from 53 Equity Markets. International Review of Financial
Analysis 17(1), 27–46.
Patro, D. (2000). Return Behavior and Pricing of American Depositary Receipts. Journal of
International Finance Markets, Institutions and Money 10(1), 43–67.
Perez-Aquino, K. & Poshakwale, S. (2006). Price determinants of American Depositary Receipts
(ADR): A Cross-sectional Analysis of Panel Data, Applied Financial Economics, 2006, 16(16),
1225–1237.
Poshakwale, S. & Perez-Aquino, K. (2008) The Dynamics of Volatility Transmission and
Information Flow between ADRs and their Underlying Stocks, Global Finance Journal 19(2), 187-
201.
Ramiah, V. & Graham, M. (2012). Global Terrorism and Adaptive Expectations in Financial
Markets: Evidence from the Japanese Equity Market. Research in International Business and
Finance 26 (1), 97–119.
Ramiah, V., Cam, M., Calabro, M., Maher, D. & Ghafouri, S. (2010). Changes in Equity Returns
and Volatility Across Different Australian Industries Following the Recent Terrorist Attacks.
Pacific-Basin Finance Journal 18 (1), 64–76.
Suarez, D. (2005). Arbitrage Opportunities in the Depositary Receipts Market: Myth or Reality?
International Financial Markets, Institutions and Money 15(5), 469–480.
Wahab, M. & Khandwala, A. (1993). Why Not Diversify Internationally with ADRs? Journal of
Portfolio Management 19(2), 75–82.
Wahab, M., Lashgari, M. & Cohn, R. (1992). Arbitrage Opportunity in the American Depository
Receipts Market Revisited. Journal of International Financial Markets Institutions & Money 2(3-
4), 97-130.
Worldwide Incidents Tracking System. (2010). National Counterterrorism Center, wits.nctc.gov,
accessed on February 01, 2010.
Worthington, A. & Valadkhani, A. (2005). Catastrophic Shocks and Capital Markets: A
Comparative Analysis by Disaster and Sector. Global Economic Review: Perspectives on East
Asian Economies and Industries 34 (3). 331-344.