arash karnama, do, facc oklahoma heart institute€¦ · · 2017-08-02arash karnama, do, facc...
TRANSCRIPT

1
The Latest and Greatest in Cardiology
Arash Karnama, DO, FACC
Oklahoma Heart Institute
Topics
CT-FFR CHF -Cardiomems
Valvular Heart Disease – TAVR
update, Mitral Clip
Electrophysiology – Leadless PPM,
Watchman, Cryoablation

2
CT-FFR
FFR from CTA
C.A. Taylor, T.A. Fonte, J.K. Min, et al. (2013) Computational Fluid Dynamics Applied to Cardiac Computed Tomography for Noninvasive Quantification of Fractional Flow Reserve: Scientific Basis. Journal of the American College of Cardiology. Vol. 61, Issue 22, pp. 2233-2241.
Courtesy Paul Temple from HeartFlow.

3
Build anatomic heart model from CTA
Assign myocardial territory to individual arteries
Requires good quality CTA image data
Courtesy Paul Temple from HeartFlow.
FFR from CTA
Allometric scaling laws can be applied to estimate physiologic parameters, e.g. coronary flow, under baseline conditions given organ mass
Qcrestµ Mmyo
β
1: Model REST coronary blood flow given left ventricular myocardial mass and assignment of myocardium to each coronary artery
Courtesy Paul Temple from HeartFlow.

4
FFR from CTA
1. Healthy and diseased vessels adapt to amount of flow they carry
2. Power law relationships of form Q dk apply to different vascular beds – including coronary arteries
3. Since mean pressure (P) is essentially constant down the length of the coronary arteries at rest
AND P=QR
AND Q dk
THUS R d-k
2: Model microcirculatory vascular bed flow resistance at REST, inversely proportional to size of feeding vessel.
Courtesy Paul Temple from HeartFlow.
FFR from CTA
1. When the heart lacks O2, breakdown of ATP results in release of adenosine → vasodilation
2. Exogenous administration of adenosine elicits maximum hyperemic response by forcing complete smooth muscle cell relaxation
3. Standard of care for induction of hyperemia in non-invasive tests and the cath lab Intravenous administration of adenosine elicits
remarkably consistent vasodilatory response in normal subjects at sufficient doses
3: Model predictable change in microcirculatory resistance in response to ADENOSINE
Courtesy Paul Temple from HeartFlow.

5
FFR from CTA
• Now we have:
• Resting coronary blood flow
• Resting coronary vascular resistance
• Adenosine-induced coronary vascular resistance
• And adenosine-induced coronary blood flow can be determined!
And… Watson is needed
Mass Conservation (1 equation):
Momentum Balance (3 equations):
0
yx zvv v
x y z
22 2
2 2 2
22 2
2 2 2
2
yx x x x x zx y z
y y y y yx zx y z
z z z zx y z
vv v v v v vpv v v
t x y z x x y z
v v v v vv vpv v v
t x y z y x y z
vv v v v pv v v
t x y z z
2 2
2 2 2
yx zv v
x y z
where is the fluid density, and is the fluid viscosity (both assumed known).
We solve these for ( , , , ), ( , , , ), ( , , , ), ( , , , )
for every point in the 3D model and over whatever time
x y zv x y z t v x y z t v x y z t p x y z t
interval we are interested in.
MOMENTUM conservation: These equations come from the application of Newton’s 2nd law, F=ma to a fluid
MASS conservation: This law states that blood is an incompressible fluid
4: Solve equations of mass and momentum conservation to calculate coronary flow with ADENOSINE
Courtesy Paul Temple from HeartFlow.

6
Make a supercomputer do it
Courtesy Paul Temple from HeartFlow.
Standard: 12-15 hours, High priority: 4-6 hours
Testing FFR-CT• DISCOVER-FLOW
• 103 patients underwent CTA, cath with FFR, blinded FFR-CT
• Cath-FFR<0.8 = reference
• Specificity improved: 40% to 82% (reduced false positives!)
• Sensitivity similar: 88% vs 91%
Koo, et al. JACC 2011.

7
Testing FFR-CT• DE FACTO
• 252 patients underwent CTA, cath with FFR, blinded FFR-CT
• Cath-FFR<0.8 = reference
• Specificity improvement not as good: 40% to 52%
• Sensitivity similar: 84% vs 90%
Min, et al. JAMA 2012.
Testing FFR-CT• NXT
• 254 patients underwent CTA , cath with FFR, blinded FFR-CT
• Cath-FFR<0.8 = reference
• Specificity improved: 60% to 86%
• Sensitivity similar: 83% vs 84%
Norgaard, et al. JACC 2014.

8
Not for stents or grafts
Confirmation
• 2 meta-analyses since FDA approval both found
• FFR-CT improved specificity and overall accuracy for ischemic disease compared to CTA only
• Adding FFR-CT did not change sensitivity
• FFR-CT effectively cuts the rate of incorrectly assuming disease on CTA causes ischemia
(Baumann S, et al. Acad Radiol 2016)
(Tan XW, et al. Int J Cardiol 2017)

9
FFR-CT impact on decision making
• RIPCORD
• 200 patients with CTA + FFR-CT
• 3 blinded interventionalists made consensus initial plan of management based on CTA alone
• Then FFR-CT results are provided, and the interventionalists decide whether to modify plan
• In 72 patients (36%), FFR-CT changed management approach
Curzen, et al. JACC Cardiovasc Img 2016.
FFR-CT impact on decision making• RIPCORD
• 36% of management plans changed after FFR-CT
• FFR-CT eliminated need for more information after CTA
• FFR-CT positive (<0.8)
• 23% of 51-70% stenoses
• 54% of 71-90% stenoses
• 70% of >90% stenoses
Curzen, et al. JACC Cardiovasc Img 2016.

10
FFR-CT impact on cath
• PLATFORM
• 584 patients intermediate probability for stenotic CAD• 204 planned for noninvasive testing
• 380 planned for cath
• Both groups randomized to original plan or CT with FFR-CT
• Outcomes• Rate of coronary catheterization
• Cardiac events at 90 days
Douglas, et al. EHJ 2015.
FFR-CT impact on cath• PLATFORM
• In the group originally headed for cath, use of FFR-CT
• Cancelled 60% of caths, none of these patients had a cardiac event at 90 days
• Resulted in 60% less cathshowing nonobstructive disease (73% vs 12%)
• No difference in overall rate of revascularization
Douglas, et al. EHJ 2015.

11
OHI Case
~60% stenosis
60% mid LAD stenosis, 70-80% D2 stenosis

12
Who gets FFR-CT?
• FFR-CT became available at OHI on May 1• @ HMC, BMC, and HHS
• Only center in Oklahoma to have the service
• Referring clinicians order coronary CTA as usual
• CTA reader discretion to proceed with FFR-CT
• If we use RIPCORD study data:• Borderline 50% or nearly 50% stenoses
• 50-69% stenoses
• Select 70-99% stenoses
• FFR-CT cannot save a nondiagnostic CTA!
Limitations
• Patients with nondiagnostic scans do not suddenly become diagnostic because of FFR-CT
• FFR-CT cannot be interpreted in isolation
• FFR-CT was tested against gold standard vasodilation cath FFR, not instantaneous wave-free ratio (iFR)
• Still waiting for data to help determine utility in the acute symptomatic setting

13
Conclusion• With the addition of FFR-CT, coronary CTA now provides
• High sensitivity for detecting anatomic stenoses
• High sensitivity for differentiating amongst no disease, nonstenotic disease, stenotic disease, and severe high-risk disease
• Good specificity for identifying hemodynamically important disease when measured by cath-FFR
• A big leap forward for noninvasive CAD testing!
Congestive Heart Failure

14
27
DESPITE MEDICAL ADVANCES Heart Failure hospitalization is a worsening epidemic
Significant Reduction in Coronary Deaths1
050
100150200250300350400
1980 1985 1990 1995 2000 2005 2010
Significant Increase in HF Hospitalizations2
-
5,000,000
10,000,000
15,000,000
20,000,000
1980-84 1985-89 1990-94 1995-99 2000-2004
1. Graph adapted from NIH, Accessed 2016.2. Graph adapted from Fang J, et al. JACC, 2008.
THE PROBLEM:Unless focused, dramatic measures are taken, the clinical and financial
burden to society is only going to escalate.
Deaths/100,000 PopulationNumber of HF Hospitalizations With HF as
Primary or Secondary Diagnosis, by 5-Year Time Period
28
The CLINICAL burden :heart failure is A GROWING GLOBAL CONCERN FOR PATIENTS, PROVIDERS AND
HEALTH CARE SYSTEMSUNITED STATES
1. AHA 2016 Statistics at a Glance, 2016.2. Krumholz HM, et al. Circ Cardiovas Qual Outcomes 2009.3. Heidenreich PA et al. Circ Heart Failure 2013.
HIGH INCIDENCE, HIGH PREVALENCE AND POOR PROGNOSIS
despite advances in the treatment of heart failure over the past few decades.
Projected to increase to > 8M people ≥ 18 years of age with HF by 20301
915,000people ≥ 45 years of age are newly diagnosed each year with HF.1
For AHA/ACC stage C/D patients diagnosed with HF:
| PREVALENCE
|INCIDENCE
|MORTALITY
50% readmitted within 6
months.2
2.2%prevalence1
5.7M HF patients1
50% will die within 5
years.3

15
29
The ECONOMIC burden:heart failure is a significant and growing contributor to overall HEALTH system costs
Total medical costs for HF are projected
to
increase to $70B by 2030, a 2x increase
from 2013.*
1. CDC NCHS National Hospital Discharge Survey, 2000-10.2. Blekcer et al. JACC, 2013.3. Yancy et al. JACC, 2006.
4. Yancy CW, et al. Circulation, 2013. 5. Krumholz HM, et al. Circ Cardiovas Qual Outcomes 2009.6. Wexler DJ, et al. Am Heart J, 2001.
50% of the costs are
attributed to hospitalization.
4
> 3,000,000hospitalizations include HF as a contributor.2
~5 daysaverage length
of hospital stay3
> 1,100,000hospitalizations for
HF1
~25%all-cause readmission within 30 days; ~50% within 6 months.5,6
HOSPITALIZATIONS & READMISSIONS COSTS
Despite advances in medical therapies to treat heart failure, the hospitalization rate has not changed significantly from 2000. As a result, heart failure continues to be a
MAJOR DRIVER OF OVERALL HEALTH CARE COSTS.
UNITED STATES
*Study projections assumes HF prevalence remains constant and continuation of current hospitalization practices
30
Current HF Management: Why aren’t current parameters working?
Graph adapted from Adamson PB, et al. Curr Heart Fail Reports, 2009.

16
31
Current HF Management: How can we get ahead of symptoms associated with acute decompensation?
Graph adapted from Adamson PB, et al. Curr Heart Fail Reports, 2009.
Cardiomems™ hf system
A Personalized, Proactive Approach to Manage HF
by Monitoring PA Pressure
32

17
33
Delivers insight into the early onset of worsening HF to more proactively manage HF patients and improve outcomes
cardiomems™ HF System:Provides clarity in the management of heart failure
Pulmonary Artery Pressure Sensor
Patient Electronics System
Merlin.net™ PCN
Target location for PA pressure sensor
Abraham WT, Lancet, 2011

18
36
CHAMPION TRIAL design: RANDOMIZED (Part 1) AND OPEN ACCESS (part 2)
CardioMEMS™ PA Sensor Implanted n = 550
Treatment Groupn = 270
Control Groupn = 280
Transition to Former Treatment Group
n = 177
Transition to Former Control Group
n = 170
1. Abraham W, et al. Lancet, 2011.2. Abraham W, et al. Lancet, 2016.
PART 1: RANDOMIZED ACCESS1
Study Exitn = 110
Study Exitn = 93
PART 2: OPEN ACCESS2
Previously hospitalized patients (past 12 months) with NYHA class III HF for at least 3 months, regardless of LVEF
All took daily readings.
RANDOMIZATION
CardioMEMS™ Heart Sensor Allows Monitoring of Pressure to Improve Outcomes in New York Heart Association (NYHA) Class III Heart Failure Patients (CHAMPION) Trail
TRIAL HYPOTHESIS: In addition to basing treatment on signs and symptoms, adjusting medications based on PA pressures will reduce HF-related hospitalizations.

19
37
CHAMPION TRIAL design: part 1: Prospective, multi-center, randomized, controlled,
single-blind clinical trial
CardioMEMS™ PA Sensor Implanted n = 550
Treatment Groupn = 270
Traditional HF management guided by PA pressure
information
Control Groupn = 280
Traditional HF management
PURPOSEEvaluate the safety and efficacy of the CardioMEMS™ HF System in reducing HF related hospitalizations in NYHA class III heart failure patients.
Primary Endpoint: Rate of HF hospitalization
Secondary Endpoints:
Change in PA pressure at 6 months
No. of pts admitted to hospital for HF
Days alive outside of hospital QOL (MLHFQ)
Study exits < 6 mos.: 26 (9.3%) Total20 (7.1%) Death6 (2.2%) Other
Study exits < 6 mos.:26 (9.6%) Total
15 (5.6%) Death11 (4.0%) OtherTreatment group
managed to target PA pressures:
Systolic 15 – 35 mmHgDiastolic 8 – 20 mmHgMean 10 – 25 mmHg
Abraham W, et al. Lancet, 2011.
38
CHAMPION TRIAL RESULTS: PART 1 and PART 2: 31 MONTHS Average FOLLOW-UP
CardioMEMS™ PA Sensor Implanted
n = 550
Treatment Groupn = 270
Control Groupn = 280
Transition to Former Treatment Group
n = 177
Transition to Former Control Group
n = 170
Study Exitn = 110
Study Exitn = 93
Completed Open Accessn = 119
Completed Open Accessn = 127
Study Exitn = 43
Study Exitn = 58
PART 1: RANDOMIZED ACCESS1
18 months
PART 2: OPEN ACCESS2
13 months
1. Abraham W, et al. Lancet, 2011.2. Abraham W, et al. Lancet, 2016.

20
39
CHAMPION Trial results:PRIMARY ENDPOINT
Abraham W, et al. Lancet, 2016.
Patients managed with PA pressure data had
SIGNIFICANT RELATIVE RISK
REDUCTIONas compared to the control group.
PART 1: RANDOMIZED ACCESS PART 2: OPEN ACCESS
0
0.2
0.4
0.6
0.8
1
1.2
1.4
1.6
1.8
2
0 90 180 270 360 450 540 630 720 810 900 990 1080
Cum
ulat
ive
Haz
ard
Rat
e
Days From Implant
33% Relative Risk Reduction in HF Hospitalizations in Treatment Group vs.
Control Group
Treatment
Control
# at Risk
Control 280 267 254 241 210 175 131 101 62 27 12 5 0
Treatment 270 262 246 235 197 164 125 105 75 38 8 3 0
p=0.017
40
CHAMPION Trial results:Primary Safety Endpoints and Secondary Endpoints
Treatment(n = 270)
Control(n = 280)
P-value
Primary Safety Endpoints
Device-related or system-related complications3 (1%) 3 (1%)
Total 8 (1%)* < 0.0001
Pressure-sensor failures 0 0 < 0.0001
SecondaryEndpoints
Change from baseline in PA mean pressure (mean AUC [mm Hg x days])
-156 33 0.008
Number and proportion of patients hospitalized for HF (%) 55 (20%) 80 (29%) 0.03
Days alive and out of hospital for HF (mean ± SD) 174.4 ± 31.1 172.1 ± 37.8 0.02
Quality of life (Minnesota Living with Heart Failure Questionnaire, mean ± SD)
45 ± 26 51±25 0.02
* Total of 8 DSRCs including 2 events in Consented not implanted patients (n = 25)
Abraham WT, et al. Lancet, 2011.
ALL ENDPOINTS MET.Both primary safety endpoints and all secondary endpoints were met at 6 months.
PART 1: RANDOMIZED ACCESS PART 2: OPEN ACCESS
21
PA
Mea
n P
rea
sure
AU
C (
mm
Hg
-Da
ys)
-220
-200
-180
-160
-140
-120
-100
-80
-60
-40
-20
0
20
40
60
80
100
Days from Implant
0 30 60 90 120 150 180
p = 0.0077
Treatment (-155.7 mmHg-Days)Control (33.1 mmHg-Days)
41
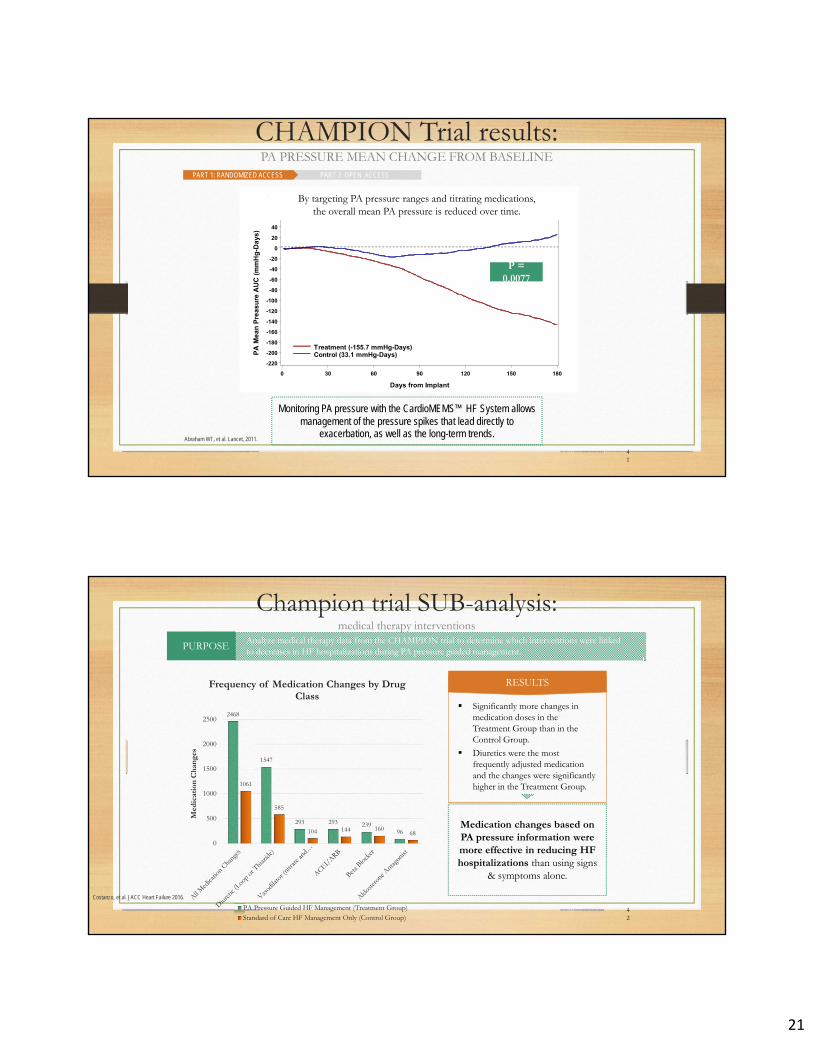
CHAMPION Trial results:PA PRESSURE MEAN CHANGE FROM BASELINE
Abraham WT, et al. Lancet, 2011.
PART 1: RANDOMIZED ACCESS PART 2: OPEN ACCESS
Monitoring PA pressure with the CardioMEMS™ HF System allows management of the pressure spikes that lead directly to
exacerbation, as well as the long-term trends.
By targeting PA pressure ranges and titrating medications, the overall mean PA pressure is reduced over time.
Treatment (-155.7 mmHg-Days)Control (33.1 mmHg-Days)P
A M
ean
Pre
asu
re A
UC
(m
mH
g-D
ays)
P = 0.0077
42
Champion trial SUB-analysis:medical therapy interventions
Analyze medical therapy data from the CHAMPION trial to determine which interventions were linked to decreases in HF hospitalizations during PA pressure guided management. PURPOSE
Medication changes based on PA pressure information were more effective in reducing HF hospitalizations than using signs
& symptoms alone.
Costanzo, et al. JACC Heart Failure 2016.
2468
1547
293 293 23996
1061
585
104 144 16068
0
500
1000
1500
2000
2500
Med
icat
ion
Ch
ange
s
Frequency of Medication Changes by Drug Class
PA Pressure Guided HF Management (Treatment Group)Standard of Care HF Management Only (Control Group)
Significantly more changes in medication doses in the Treatment Group than in the Control Group.
Diuretics were the most frequently adjusted medication and the changes were significantly higher in the Treatment Group.
RESULTS

22
43
CardioMems™ HF system indicated for NYHA Class III – WHY?
We’ve studied several heart failure populations:
• 34% reduction in hospitalizations in NYHA Class III from COMPASS-HF (p < 0.001, retrospective subgroup analysis)1
• 37% reduction in hospitalizations in NYHA Class III from CHAMPION (p < 0.001, prospective full duration follow-up)2
• NYHA Class II patients were too well to impact heart failure outcomes (REDUCEhf)3
• NYHA Class IV (ACC/AHA stage D) were too sick to impact heart failure outcomes (COMPASS-HF)1
1. Bourge RC, et al. J Am Coll Cardiol, 2008.2. Abraham WT, et al. Lancet, 2011.3. Adamson PB, et al. J Cardiac Fail, 2010.
The CardioMEMS™ HF System is indicated for wirelessly measuring and
monitoring pulmonary artery (PA) pressure and heart rate in New York Heart
Association (NYHA) Class III heart failure patients who have been hospitalized for
heart failure in the previous year.
Data demonstrates that previously hospitalized NYHA Class III heart failure patients are
MOST LIKELY TO BENEFITfrom PA pressure-guided therapy.
44
Heart Failure CLASSIFICATIONbased on severity of symptoms
Adapted from American Heart Association.
CLASS IICLASS I CLASS III CLASS IV
No limitation of physical activity. Ordinary physical
activity does not cause undue fatigue, palpitation,
dyspnea (shortness of breath).
Slight limitation of physical activity. Comfortable at rest. Ordinary physical
activity results in fatigue, palpitation, dyspnea
(shortness of breath).
Marked limitation of physical activity.
Comfortable at rest. Less than ordinary activity
causes fatigue, palpitation, or dyspnea.
Unable to carry on any physical activity without
discomfort. Symptoms of heart failure at rest. If any
physical activity is undertaken, discomfort
increases.
New York Heart Association (NYHA) Functional Classification
23
Valvular Heart Disease
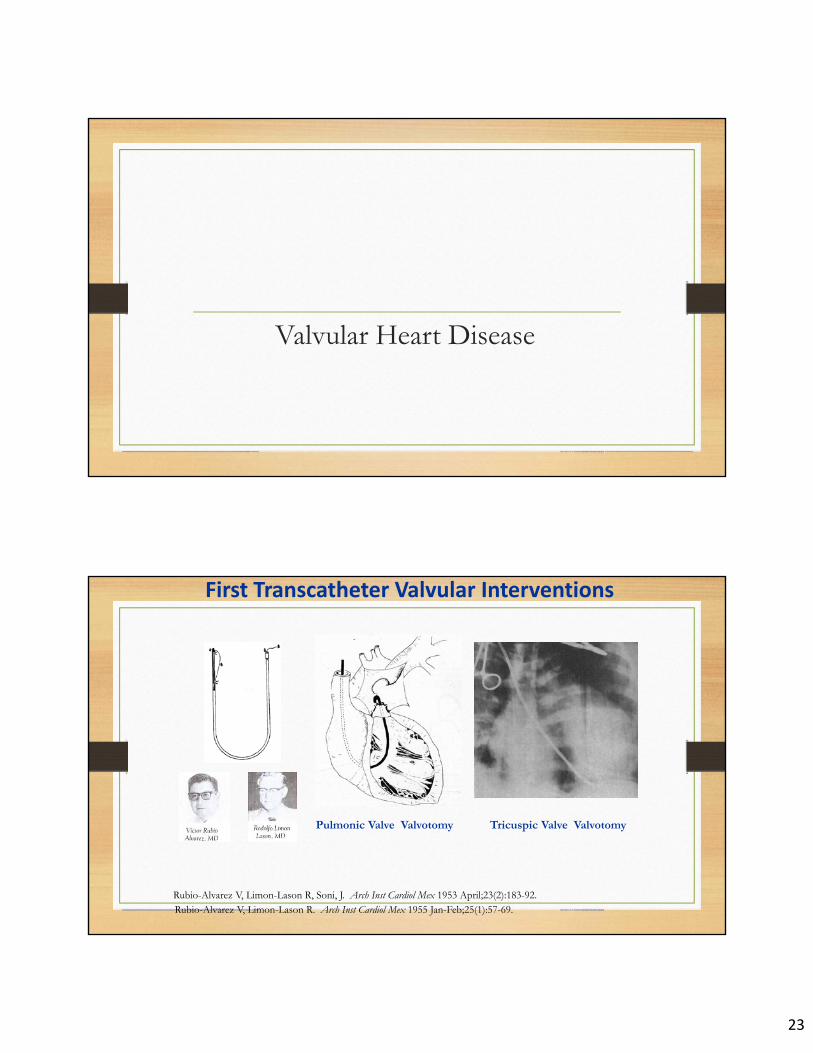
First Transcatheter Valvular Interventions
Rubio-Alvarez V, Limon-Lason R. Arch Inst Cardiol Mex 1955 Jan-Feb;25(1):57-69.
Tricuspic Valve Valvotomy
Rubio-Alvarez V, Limon-Lason R, Soni, J. Arch Inst Cardiol Mex 1953 April;23(2):183-92.
Pulmonic Valve Valvotomy

24
Mitral Clip

25
Edge to Edge & MitraClip Concepts• Facilitates proper leaflet coaptation
• Degenerative - Anchor flail and prolapsed leaflets
• Functional - Coapt tethered leaflets to reduce time and force required to close valve
• Reduces LV volume overload by reducing MR
• Creates tissue bridge
• May limit dilatation of annulus
• Septal-lateral (A-P) dimension
• Supports durability of repair
• Restrains LV wall
• Limits LV dilatationPorcine model, 6M

26
Everest II: Background and Purpose
• Of the 50,000 patients in the United States developing significant mitral regurgitation (MR) each year, up to 60% have functional MR
• Isolated leaflet repair for functional mitral regurgitation (FMR) has not been well characterized
• The purpose of this study is to evaluate the safety and efficacy of isolated leaflet repair using the MitraClip device in patients with FMR.
Methods: Anatomic Eligibility
• TEE evidence of FMR:• Absence of Degenerative valve disease• Presence of leaflet “tethering”
• Not exceeding 10mm
• Sufficient leaflet tissue available for mechanical coaptation
• > 2mm “vertical” leaflet tissue available• Protocol anatomic exclusions
• Coaptation depth >11mm • Coaptation length < 2mm
• Absence of severe LV dysfunction• Excluding LVID-s > 55mm or EF <25%• Ischemic or non-ischemic etiology
<2mm
>11mm
Exclusions

27
5‐year Results of EVEREST IIPrimary MR
Feldman et al, JACC 2015;66:2844-54.
Survival
30 Day mortality 6%
High Surgical Risk Patients5‐year Results of EVEREST II
Primary MR
Feldman et al, JACC 2015;66:2844-54.
Survival

28
TAVR Update

29
The PARTNER 2A Trial NEJM On-line
Primary Endpoint: All-Cause Mortality or Disabling Stroke at Two Years
Randomized Patients n = 2032
Symptomatic Severe Aortic Stenosis
ASSESSMENT by Heart Valve Team Operable (STS ≥ 4%)
The PARTNER 2A TrialStudy Design
TF TAVR (n = 775)
Surgical AVR (n = 775) VS.VS.
ASSESSMENT: Transfemoral Access
Transapical (TA) / TransAortic (TAo)Transfemoral (TF)
1:1 Randomization (n = 482)1:1 Randomization (n = 1550)
TA/TAo TAVR (n = 236)
Surgical AVR (n = 246)
Yes No

30
Inclusion Criteria
Severe AS: Echo-derived AVA ≤ 0.8 cm2 (or AVA index < 0.5 cm2/m2) and mean AVG > 40 mm Hg or peak jet velocity > 4.0 m/s
Cardiac Symptoms: NYHA Functional Class ≥ II
Intermediate Risk:
1. Determined by the multi-disciplinary Heart Team
using a guideline STS ≥ 4%, and adjucated by case review committee
* Disabling stroke = CEC adjudicated stroke by a neurologist with a modifiedRankin score of 2 or greater at 30 or 90-day evaluation
Primary Endpoint
Non-hierarchical composite of all-cause mortality or disabling stroke* at two years
Intention-to-treat population is the primary analysis;
As-Treated (AT) population also a pre-specified, powered analysisTransfemoral (TF) subgroup pre-specified
All patients followed for at least 2 years
Event rates by Kaplan-Meier estimates

31
1
1011 918 901 870 842 825 811 801 774
1021 838 812 783 770 747 735 717 695
Number at risk:
TAVR
Surgery
p (log rank) = 0.253
HR [95% CI] = 0.89 [0.73, 1.09]
TAVR
Surgery
0
10
20
30
40
50
19.3%
21.1%
14.5%
16.4%
0 3 6 9 12 15 18 21 24
6.1%
8.0%
Primary Endpoint (ITT)All-Cause Mortality or Disabling Stroke
Months from Procedure
All
-Cau
se M
ort
alit
y o
r D
isab
ling
Str
oke
(%
)
The PARTNER 2A Trial Conclusions (1)
In intermediate-risk patients with symptomatic severe aortic stenosis, results from the PARTNER 2A trial demonstrated that...
• TAVR using SAPIEN XT and surgery were similar (non-inferior) for the primary endpoint (all-cause mortality or disabling stroke) at 2 years.
• In the transfemoral subgroup (76% of patients), TAVR using SAPIEN XT significantly reduced all-cause mortality or disabling stroke vs. surgery (ITT: p = 0.05, AT: p = 0.04).

32
Electrophysiology
Leadless Pacemaker

33

34
Atrial Fibrillation
Atrial Fibrillation
• Random, chaotic atrial activity
• No P waves present
• Irregular heart beat
• Random, chaotic atrial activity
• No P waves present
• Irregular heart beat

35
AF is a Progressive Disease
of patients progress from Paroxysmal to Persistent AF within 1 year of diagnosis
20%
Nieuwlaat R et al. Eur Heart J. 2008 May;29(9):1181-9.
First Episodeof AF
Recurrent AF Recurrent Persistent AF
Understanding AF Progression
2010
Paroxysmal AF Persistent AF Permanent AF
Scarring/fibrosis

36
LA Fibrosis Staging
The DECAAF Study Marrouche NF et al JAMA. 2014;311(5):498-506
2010
Paroxysmal AF Persistent AF Permanent AF
Scarring/fibrosis
Paroxysmal AF
Persistent AF
Permanent AF
Fibrotic AtrialCardiomyopathy
+GeneticsInflammationHypertensionObesityAging
2016
Understanding AF Progression

37
0
5
10
15
20
25
30
0 1 2 3 4 5
The Big Debate?Rate Control versus Rhythm Control
Mortality(%)
Years
P=0.08
Rate control
Rhythm control
AFFIRM Investigators: NEJM 347:1825, 2002
N = 4060
Pulmonary Veins Trigger Atrial Fibrillation
Haïssaguerre M et al, NEJM 1998;339(10):659

38
Radiofrequency Pulmonary Vein Ablation
C.
Cryoballoon Ablation
Ablates at the point of balloon contact
1. Wire Targeted Vein 2. Inflate and Position 3. Occlude and Ablate
A.
B.C.

39
Progression to Persistent AF
Proietti R et al J Am Coll Cardiol EP. 2015;1(3):105-115
Medical Therapy
Catheter Ablation
“AF ablation is associated with significantly reduced progression to persistent forms
compared with studies in the general population.”
Long-Term Effect of Goal Directed Weight Management in an Atrial Fibrillation Cohort: A Long-term Follow-Up StudY
(LEGACY Study)
Weight loss, if sustained, will be of incremental benefit in rhythm control
Weight fluctuation has detrimental effect
Dose dependent effect of long term weight loss on freedom from AF
Impact of weight fluctuation
Role of dedicated clinic
Prathak RK, et al. J Am Coll Cardiol. 2015;65(20):2159-2169

40
Risk Factor Modification and Ablation Success
84%
48%
Pathak RK, et al J Am Coll Cardiol 2014;64:2222–31
Single Ablation Multiple Ablations
63
23
30
34
8
11
0 20 40 60 80Patients (%)
Non-AF(n=120)
AF(n=30)
AF and Stroke: A Healthcare Burden
• 2.7 to 6.1 million individuals in the United States had AF in 2010
• AF increases the risk for stroke ≈5-fold
• 23.5% of strokes in patients80 to 89 years old are AF related
• Strokes in patients with AF tend to be more disabling, recur, or be fatal
Mortality
Recurrentstroke
Severedisability
1-year Outcomes FollowingIschemic Stroke
Go AS et al. Circulation. 2014;129(3):e28-e292. Lin HJ et al. Stroke. 1996;27(10):1760-1764.

41
Left Atrial Appendage
LAA with Thrombus
Richard P. Whitlock et al. Circulation 2009;120:1927-1932

42
Warfarin for AF
Favors Warfarin Favors Placebo or Control
Study, Year Relative Risk Reduction
% % % %
From: Hart RG, et al Ann Intern Med. 2007;146:857-867
6 Trials
2,900 patients
Warfarin reduces risk of stroke by
64%
-100-50050100
All Trials
EAFT, 1993
SPINAF, 1992
CAFA, 1991
BAATAF, 1990
SPAF I, 1991
AFASAK I 1989

43
AF patients without contraindications
44
58 61 57
35
0
20
40
60
80
100
<55 55-64 65-74 75-84 ≥85
Age (years)
55%
War
fari
n U
se (
%)
*Data from automated pharmacy, laboratory, and clinical administrative databases for 13,428 patients with nonvalvular AF were used to determine the prevalence of warfarin use in the 3 months before or after the identified diagnosis of AF (July 1996 – December 1997).
Using Warfarin Remains Challenging
Time in Therapeutic Range (TTR)
51
28
67
55
58
54
0 20 40 60 80
McCormick et al
Sarawate et al
Rose et al
Baker et al
Rose et al
Dlott et al
Mean TTR (%)
(N=22,237)
(N=124,551)
(N=3104)
(N=470)
(N=174)
(N=138,319)
The Novel Anticoagulants
dabigatran(Pradaxa)
rivaroxaban(Xarelto)
apixaban(Eliquis)
edoxaban(Savaysa)
Mechanism Direct Thrombin inhibitor
Factor Xa Inhibitor Factor Xa inhibitor Factor Xa inhibitor
Half-Life (t½) 14 hours 5 – 13 hours 12 hours 10-14 hours
Dosing 150mg BID (CrCl>30)75mg BID (CrCl 15-30)
20mg QD (CrCl>50)15mg QD (CrCl 30-49 or ESRD)
5mg BID2.5mg BID (age>80, Cr>1.5 or wt <60Kg)
60mg daily (CCl 50-95)30mg daily (CCl 15-50)
Population in Study
Age 71.5CHADS2 = 2.1TTR 64%
Age 73CHADS2 = 3.5TTR 57.8%
Age 70CHADS2 = 2.1TTR = 62.2%
Age 72CHADS2 = 2.8TTR = 68.4%
Stroke Risk Superior Non-inferior Superior Lower
Bleeding Risk Similar Similar Superior Superior
Mortality Reduction
12% (p=0.051) 8% (p=0.15) 11% (p=0.047) 13% (p=0.006)

44
Bleeding
Thrombosis
Right Atrium Left Atrium

45
Concept:Exclude the LAA from central circulation
LAA

46
PROTECT AF 4-Year Results
Reddy, VY et al. JAMA. 2014;312(19):1988-1998.
• Device superior to Control: primary efficacy, CV death, hemorrhagic stroke and all-cause mortality
Device grouprate
Control grouprate
Hazard ratioWATCHMAN/
warfarin (95% CI)
P
Primary efficacy 2.3 3.8 0.61 (0.38, 0.97) 0.0348
CV death 1.0 2.4 0.40 (0.21, 0.75) 0.0045
All stroke 1.5 2.2 0.70 (0.39, 1.26) 0.2244
Hemorrhagic stroke 0.2 1.1 0.16 (0.04, 0.51) 0.0049
Ischemic stroke 1.4 1.1 1.30 (0.64, 2.84) 0.4921
Disabling stroke 0.5 1.2 0.37 (0.15, 1.00)
All-cause mortality 3.2 4.8 0.66 (0.45, 0.98) 0.0379
Primary safety 3.6 3.1 1.21 (0.78, 1.94) 0.4051
707 AF patients randomized 2:1 - Watchman vs warfarin
Watchman Long-Term Follow upPROTECT AF 4-Year Superiority
2.3
1.0
3.23.8
2.4
4.8
0
2
4
6
8
10
PS = Posterior Superiority ProbabilityReddy et al: HRS, 2013
Rat
e pe
r 10
0 pa
tient
-yea
rs
WATCHMAN (n=463)Warfarin (n=244)
Primary efficacyPS=0.96
CV or unexplaineddeath
P=0.0045
All-cause deathP=0.0379
Superior40% lower
Superior60% lower
Superior34% lower

47
WATCHMANTM Device Reduces Ischemic Stroke Over No Therapy
* Imputation based on published rate with adjustment for CHA2DS2-VASc score (3.0); Olesen JB. Thromb Haemost (2011)
0
1
2
3
4
5
6
7
8
PROTECT AF PREVAIL CAP
Imputed IschemicStroke Rate*
ObservedWATCHMANIschemic Stroke Rate
Isch
emic
Str
oke
Ris
k(E
ven
ts/
100
Pat
ien
t-Y
ears
)
79%Relative
Reduction
67%Relative
Reduction
83%Relative
Reduction
Baseline CHA2DS2-VASc = 3.4
Baseline CHA2DS2-VASc = 3.8
Baseline CHA2DS2-VASc = 3.9
FDA Oct 2014 Panel Sponsor Presentation. Hanzel G, et al. TCT 2014 (abstract)
Watchman Indication 2016• High risk of stroke
• CHADS2 ≥ 2
• CHA2DS2VASc ≥ 3
• Suitability for short-term warfarin but deemed unable to take long term oral anticoagulation
• A formal shared decision making interaction with an independent non-interventional physician using an evidence-based decision tool on oral anticoagulation

48
Thank you!